
Common Variants in Left/Right Asymmetry Genes and Pathways Are Associated with Relative Hand Skill
Humans display structural and functional asymmetries in brain organization, strikingly with respect to language and handedness. The molecular basis of these asymmetries is unknown. We report a genome-wide association study meta-analysis for a quantitative measure of relative hand skill in individuals with dyslexia [reading disability (RD)] (n = 728). The most strongly associated variant, rs7182874 (P = 8.68×10⁻⁹), is located in PCSK6, further supporting an association we previously reported. We also confirmed the specificity of this association in individuals with RD; the same locus was not associated with relative hand skill in a general population cohort (n = 2,666). As PCSK6 is known to regulate NODAL in the development of left/right (LR) asymmetry in mice, we developed a novel approach to GWAS pathway analysis, using gene-set enrichment to test for an over-representation of highly associated variants within the orthologs of genes whose disruption in mice yields LR asymmetry phenotypes. Four out of 15 LR asymmetry phenotypes showed an over-representation (FDR≤5%). We replicated three of these phenotypes; situs inversus, heterotaxia, and double outlet right ventricle, in the general population cohort (FDR≤5%). Our findings lead us to propose that handedness is a polygenic trait controlled in part by the molecular mechanisms that establish LR body asymmetry early in development.
Published in the journal:
. PLoS Genet 9(9): e32767. doi:10.1371/journal.pgen.1003751
Category:
Research Article
doi:
https://doi.org/10.1371/journal.pgen.1003751
Summary
Humans display structural and functional asymmetries in brain organization, strikingly with respect to language and handedness. The molecular basis of these asymmetries is unknown. We report a genome-wide association study meta-analysis for a quantitative measure of relative hand skill in individuals with dyslexia [reading disability (RD)] (n = 728). The most strongly associated variant, rs7182874 (P = 8.68×10⁻⁹), is located in PCSK6, further supporting an association we previously reported. We also confirmed the specificity of this association in individuals with RD; the same locus was not associated with relative hand skill in a general population cohort (n = 2,666). As PCSK6 is known to regulate NODAL in the development of left/right (LR) asymmetry in mice, we developed a novel approach to GWAS pathway analysis, using gene-set enrichment to test for an over-representation of highly associated variants within the orthologs of genes whose disruption in mice yields LR asymmetry phenotypes. Four out of 15 LR asymmetry phenotypes showed an over-representation (FDR≤5%). We replicated three of these phenotypes; situs inversus, heterotaxia, and double outlet right ventricle, in the general population cohort (FDR≤5%). Our findings lead us to propose that handedness is a polygenic trait controlled in part by the molecular mechanisms that establish LR body asymmetry early in development.
Introduction
Humans display such striking cerebral asymmetries that we have been labeled, “The Lopsided Ape” [1]. The prevalence of right-handedness for tool use in excess of 85% across all human societies implies left-hemisphere dominance for controlling hand preference [2], [3]. The same degree of collective population bias is not observed in the other great apes [4], [5], suggesting right-handedness evolved along the human lineage [6]. Studies of fossil hominins suggest that the evolution of right-handedness dates back over half a million years [7], and is shared with Homo neanderthalensis [8], [9] and Homo heidelbergensis [10].
Handedness correlates with asymmetries of both the motor cortex and language-related areas of the brain, such as the planum temporale [11]–[13]. Furthermore, there is a weak correlation between language lateralization and handedness: in a study of 326 individuals, 96% of strong right-handers, as compared with 73% of strong left-handers, show left-hemisphere dominance for language [14]. Because language, like handedness, evolved primarily along the human lineage, it has been proposed that the two evolved together [15]. It has also been hypothesized that atypical cerebral asymmetries are associated with neurodevelopmental disorders. Although many associations appear to be spurious [16], dyslexia has been associated with structural and functional asymmetry differences, particularly in language related regions like the superior temporal gyrus (which includes the planum temporale) [17], [18]. Schizophrenia has been associated with both reduced planum temporale asymmetry [19]–[21] and an increased prevalence of left-handedness [22].
Both cerebral asymmetry and handedness are heritable traits, with additive genetic effects estimated to account for about a half and a quarter of the variance, respectively [23]–[25]. Heritability estimates are consistent with theories that propose a single causal gene underlies handedness [26]–[28], however population genomics theory predicts that a significant proportion of the genetic variance in common traits is the results of multiple common variants of small effect [29]–[31]. Indeed, the first direct molecular studies of handedness support the view that it has a complex multifactorial basis. To date, positional cloning and candidate gene studies have implicated LRRTM1 and AR, each of which would explain only a small proportion of the genetic variance in handedness. The imprinted LRRTM1 at 2p12 has been associated with both relative hand skill and schizophrenia [32]. A candidate gene approach found that CAG repeat length in the X-linked androgen receptor (AR) has opposite effects on the probability of left-handedness in males and females [33]. The same polymorphism in AR was found to be associated with ‘mixed-handedness’ in an independent cohort [34]. A genome-wide association study (GWAS) of 4,268 individuals for hand preference [35] found no single nucleotide polymorphisms (SNPs) associated at P≤5×10⁻⁸, the standard genome-wide threshold for significance. Based on GWAS and linkage studies, both published and unpublished, it has been estimated that that at least 40 loci underlie the genetic basis of handedness [36].
We recently identified the first association with handedness through a GWAS for relative hand skill (peg-board task, see Materials and Methods) [37]. The associated variant, rs11855415, is located in an intron of the proprotein convertase subtilisin/kexin type 6 (PCSK6, also known as PACE4). PCSK6 is a protease that cleaves NODAL proprotein into an active form. NODAL determines the development of left/right (LR) asymmetry in bilaterians from snails to vertebrates [38], [39]. Mice in which Pcsk6 is disrupted display asymmetry defects like heterotaxia (abnormal distribution of visceral organs) [40].
In our previous study, we analyzed a cohort of individuals originally selected for reading disability (RD; dyslexia) that were characterized with handedness measures. The most highly associated SNP, rs11855415, was then genotyped in two independent cohorts with RD, reaching genome-wide significance in the combined meta-analysis [37]. However, the association was specific to individuals with RD; rs11855415 was not associated with hand skill in a general population cohort unaffected with RD. A study of an independent general population cohort has identified a variable number tandem repeat (VNTR), close to rs11855415, associated with degree of handedness, providing further evidence that PCSK6 is important in the development of handedness [41].
Here we have genotyped the replication cohorts from our original study genome-wide, and perform a meta-analysis after imputation with reference panels from the 1000 Genomes Project [42]. The PCSK6 locus is the only genome-wide significant signal observed. Because PCSK6 plays a key role in regulating the activity of NODAL during the development of LR asymmetry in vertebrates [40], we hypothesize that other genes in this pathway are relevant for the development of handedness. Performing gene-set enrichment analysis, we identify an over-representation of SNPs strongly associated with relative hand skill in the human orthologs of genes that cause asymmetry defects when disrupted in mice. We replicate these results in a large independent general population cohort without reading disability. Our results suggest that handedness is a complex trait controlled in part by genes responsible for the establishment of LR body asymmetry early in development.
Results
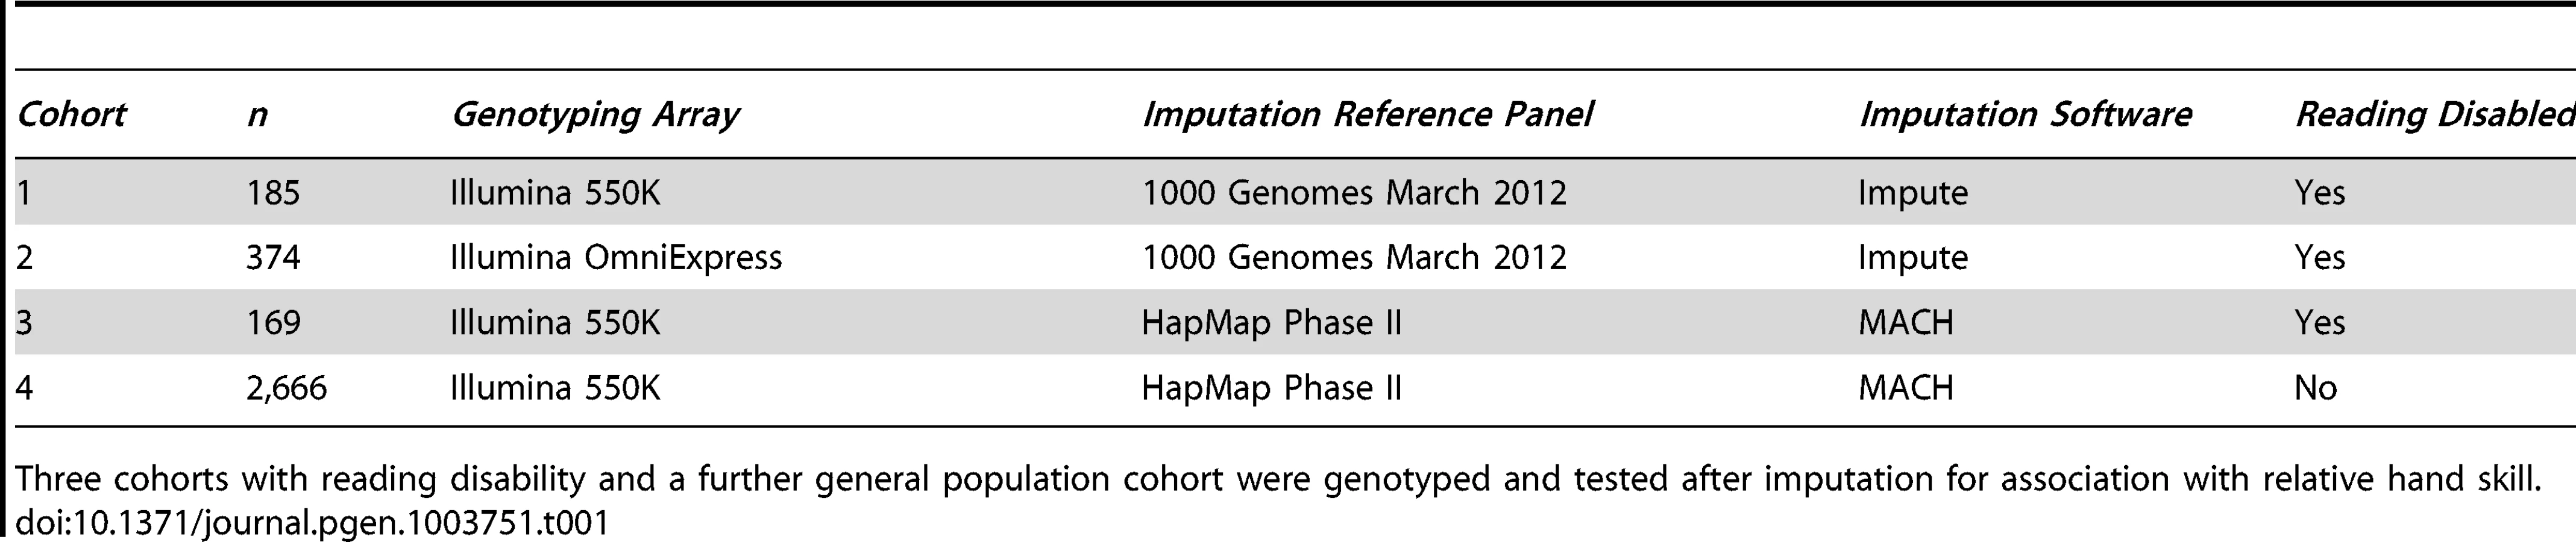
The study participants are derived from four cohorts (Table 1), three with RD (cohorts 1–3, n = 185, 374, and 169 respectively), and a general population cohort (cohort 4, n = 2,666). The samples from cohorts 1 and 2 were selected as part of an ongoing study of dyslexia [43], [44]. The samples from cohorts 3 and 4 are part of the Avon Longitudinal Study of Parents and Children (ALSPAC). We divided them into individuals with RD (cohort 3), and those unaffected with RD (cohort 4), based on their IQ and reading scores (see Materials and Methods). All have had their relative hand skill assessed.
Relative Hand Skill Phenotype
The relative hand skill peg-board task measures the time taken by the subjects to move a row of ten pegs from one location to another with the left hand (L) and right hand (R) separately [26]. Each hand was tested five times, from the average time for each hand we derived the measure PegQ [2(L−R)/(L+R)]. This task produces an approximately normally distributed variable with a positive mean; a positive PegQ indicates superior relative right-hand skill, and a negative PegQ indicates superior relative left-hand skill. In cohort 1, the PegQ distribution has a mean of 0.080 (SD = 0.099) [37], and in cohort 2 it is 0.061 (SD = 0.091). A similar peg-board test involving moving 12 pegs was performed just once (after practice) in ALSPAC (cohorts 3 and 4, see Materials and Methods). Since the test was slightly different, the mean PegQ was slightly different to cohorts 1 and 2 (Table 2), while the distribution remains unimodal, continuous and approximately normal.

We investigated the correlation between binary hand preference and relative hand skill using logistic regression in all the individuals in our cohorts for which we have data. The PegQ phenotype is highly correlated with the preferred hand of the participants. In cohorts 1 & 2, for every 1 standard deviation shift to the right of the Peg distribution, individuals are 13.4 times more likely to be right handed (95% Confidence intervals: 6.11–36.49). In ALSPAC (cohorts 3 & 4), they are 3.23 times more likely to be right handed (95% Confidence intervals: 2.83–3.70). The weaker correlation in ALSPAC is likely due to the fact that the peg-board task was performed only once, as opposed to five times in cohorts 1 and 2 (see Materials and Methods). As the peg-board tests fine motor control, PegQ also correlates with dexterity, measured as the time taken to perform the task with either the right hand (cohorts 1 & 2, Pearson's r = −0.42, cohorts 3 and 4 r = −0.50) or the left hand (cohorts 1 & 2, Pearson's r = 0.27, cohorts 3 and 4 r = 0.59).
Individuals with RD (cohort 3) are not significantly more likely to be left-handed (f = 11.4%) than those in the general population (cohort 4, f = 10.9%, two-tailed Fisher's exact test P = 0.82). Furthermore, they are not more likely to be shifted toward the left-handed distribution of the peg board task, however their average time for both hands is slower, indicating lower overall motor skill (P = 0.001, one tailed Student's t-test, Table 2).
GWAS for Relative Hand Skill
Cohorts 1 and 2 have been genotyped on the Illumina 550K and OmniExpress SNP arrays, respectively, and we imputed genotypes using the 1000 Genomes reference panel (Phase 1, March 2012 release). The samples from cohorts 3 and 4 come from the Avon Longitudinal Study of Parents and Children (ALSPAC) cohort. The participants have performed a similar peg-board task (see Materials and Methods), been characterized by similar reading measures to cohorts 1 and 2, been genotyped on the Illumina 550K SNP array, and had genotypes imputed using the HapMap II CEU reference panel. We selected individuals (cohort 3) to closely match the ascertainment criteria for RD used in the other two cohorts. Furthermore we selected a general population cohort, excluding individuals showing phenotypes compatible with a neurodevelopmental disorder diagnosis (cohort 4, consistent with the methodology in our previous report [37]).
We tested 2,095,209 SNPs for association with relative hand skill in a meta-analysis of the three RD cohorts. The marker rs7182874 within PCSK6 is the most highly associated SNP (P = 8.68×10⁻⁹, Figures 1, S1, Tables 3, S1), confirming our previous findings [37]). Each copy of the minor (derived) allele shifts an individual 0.37 standard deviations toward the right-handed end of the distribution of relative hand skill. No SNP is genome-wide significant in the general population cohort; the most highly associated SNP, rs7883190 (P = 2.08×10⁻⁶) is located approximately 6 Kb upstream of the gene GPC3 on the X chromosome, a gene that causes heart and lung asymmetry defects when disrupted in mice (cohort 4, Table S2) [45].


Gene-Set Enrichment Analysis (GSEA)
Disruption of PCSK6 in mice causes asymmetry defects [40], [46]. We therefore employed gene-set enrichment analysis (GSEA) to test for an over-representation of highly associated SNPs within the human orthologs of mouse genes whose disruption causes LR asymmetry defects, as annotated by the Mouse Genome Informatics (MGI) resource [47]. GSEA was implemented in MAGENTA, which combines variant association P values into individual gene scores, correcting for confounders such as gene size, variant number, and linkage disequilibrium [48]. It then ranks all gene scores and tests for an overrepresentation of a given set of genes above the 75th percentile of all gene P values. We chose this cutoff because it yields the best power for detecting enrichment in traits that are highly polygenic with many associations of weak effect [48]. Genes were defined as from 20 Kb upstream of the most 5′ transcription start site to 10 Kb downstream of the most 3′ untranslated region, to include adjacent cis-regulatory elements. We tested for an over-representation of genes annotated to each of 15 morphological asymmetry phenotypes (with between 10 and 100 annotated genes per phenotype) in the meta-analysis of cohorts 1–3. Four phenotype gene sets out of the 15 tested were significant at an FDR≤5% in the combined RD meta-analysis (Table 4); abnormal right lung morphology (MP:0009570), double outlet right ventricle (MP:0000284), heterotaxia (MP:0004133), and situs inversus (MP:0002766). MAGENTA also provides the overrepresentation of genes above the 95th percentile cutoff by default. Despite the fact that the expected number of genes above this threshold was very low (typically around one or two genes per phenotype), reducing our power to detect any enrichment, we observed five phenotypes at FDR≤5% (Table S3). The genes that comprise the LR asymmetry phenotype sets overlap considerably; thus FDR correction for multiple testing is conservative. A list of the ten most highly associated genes from the four phenotypes above the 75th percentile cutoff is given in Table 5. After removing PCSK6 from the analysis, the phenotypes abnormal right lung morphology, situs inversus, and double outlet right ventricle, still show an over-representation of associated SNPs (FDR≤5%, Table S4). Therefore the association in PCSK6 is not solely driving the results.


We took forward the four phenotypes that show an over-representation of genes with low P-value SNPs in the RD cohorts for testing in the general population (cohort 4). Three out of the four phenotypes show enrichment at (FDR≤5%), double outlet right ventricle (P = 0.019, adjusted for multiple testing), heterotaxia (adjusted P = 0.026), and situs inversus (adjusted P = 0.021) (Table S5). We have therefore shown that our findings from the RD cohort hold true for the general population.
There are 116 unique genes whose disruption in their mouse ortholog is annotated with these three phenotypes. 47 genes in the RD cohorts, and 42 in the general population cohort, show P values above the 75th percentile of all gene P values. Of these, 16 overlap between the RD meta-analysis and the general population cohort (one-tailed Fisher's exact test, P = 0.72). Therefore, although the same phenotypes show enrichments, the associated SNPs and genes are different, i.e. there is both allelic and locus heterogeneity between the cohorts.
Four out of the five most highly associated genes from the mouse phenotypes tested (Table 5) are involved in ciliogenesis (RFX3, MNS1, GLI3, and PKD2). Because ciliopathies cause cerebral phenotypes like agenesis of the corpus callosum and hydroencephaly, we also tested these two phenotypes in both the meta-analysis of the individuals with RD (cohorts 1–3), and separately in the general population (cohort 4). The absent corpus callosum (MP:0002196) phenotype showed an over-representation in the RD cohorts (adjusted P = 0.016, Table S6), but not in the general population (cohort 4). Of the associated genes from the absent corpus callosum phenotype, only GLI3 overlaps with the associated genes in Table 5. Hydroencephaly (MP:0001891) did not show an over-representation in either cohort.
Discussion
We have performed a genome-wide association study (GWAS) meta-analysis for a quantitative measure of handedness and found association with variants that implicate genes involved in the determination of left/right body asymmetry. To achieve this, we developed a novel approach to GWAS pathway analysis, coupling gene-set enrichment analysis (GSEA) with mouse phenotype data. In the RD meta-analysis, we showed there was an over-representation of variants with low P-values within human orthologs of genes that cause LR asymmetry phenotypes when knocked-out in mice. We replicated the same over-representation in the general population. We also confirmed that the gene PCSK6 was associated with relative hand skill at genome-wide significance (RD meta-analysis, cohorts 1–3, rs7182874 P = 8.68×10⁻⁹).
The genes identified by GSEA in the meta-analysis of cohorts with RD are involved in the determination of LR asymmetry in mice (Table 5). Mns1 and the transcription factor Rfx3 both play key roles in ciliogenesis [46], [49]. The transcription factor Gli3 is expressed at primary cilia, localizing to both the distal tip of the cilia as well as the nucleus, and is involved in Sonic hedgehog signal transduction [50]. The unidirectional fluid flow created by cilia rotation that breaks asymmetry is detected via the Ca2+ channel PKD2 [51]. This flow concentrates the morphogen NODAL on the left, which is cleaved into an active form by the protease PCSK6 [52]. The NODAL signal is then transduced through the transmembrane receptor ACVR2B [53]. Retinoic acid acts through receptors like RARA to affect expression of Nodal, Pitx2, and Lefty in mice [54]. FZD1 also acts upstream of NODAL, it is a receptor for WNT3A [55], which activates the Delta/Notch pathway to regulate expression of Nodal in mice [56]. Similarly, in a significant proportion of mouse embryos where Mgrn1 is disrupted, Pitx2, Lefty1, and Lefty2 are abnormally expressed [57]. LAMA5 is a component of the extracellular matrix, its precise role in the development of LR asymmetry is unknown. However, mice in which Lama5 has been disrupted develop Polycystic Kidney Disease (PKD) [58], a phenotype comorbid with LR asymmetry defects caused by ciliopathies [59].
We have shown that our findings from the RD cohorts hold true for the general population, three of the four phenotype gene sets tested are significant at FDR≤5% (heterotaxia, situs inversus, and double outlet right ventricle). However, the associated variants and genes are different. For example, the most highly associated marker in the general population GWAS (rs7883190, P = 2.08×10⁻⁶, Table S2) is located 6 Kb upstream of GPC3 on the X chromosome, a gene that causes the double outlet right ventricle phenotype when disrupted in mice [45].
If genes that are critical to the breaking of LR body symmetry influence handedness and brain asymmetry, individuals with Mendelian disorders that cause asymmetry defects like situs inversus (SI) should have a greater prevalence of left-handedness. However, studies dating as far back as 1836 have shown that individuals with SI present with a prevalence of left-handedness equal to the rest of the population [60]–[62]. A more recent study of individuals with primary ciliary dyskinesia (a ciliopathy that causes SI) has confirmed this finding [63]. However, two brain imaging studies of individuals with SI have shown a significant reversal of the typical pattern of right-frontal and left-occipital petalia asymmetry [64], [65], of which one study also showed a significant reversal of language dominance [65]. However, each study only assessed three individuals with SI, and given its rarity (∼1 in 10,000 [62]), large-scale studies have yet to be performed. Furthermore, a study of gene expression in fetal brains identified 27 differentially expressed genes between the two hemispheres, none of which are known to be involved in body asymmetry development [66]. It is possible that compensatory mechanisms allow for the normal development of handedness in individuals with situs inversus and the development of handedness and brain asymmetry is more complex than just involving early LR asymmetry determining genes.
To help explain the relationship between LR asymmetry determination, brain asymmetry, and handedness, we hypothesize that the same molecular mechanism for visceral LR asymmetry is involved during cerebral development. In support of this, RFX3 regulates the expression of GLI3 in the telencephalon in mice, which in turn regulates the distribution of guidepost neurons necessary for corpus callosum formation [67]. Rfx3 deficient mice show corpus callosum agenesis and disorganization of guidepost neurons necessary for axon pathfinding across the brain's midline [67]. Humans with ciliopathies commonly present with two specific structural changes within the brain; hydroencephaly and an absent corpus callosum [59]. Because four of the five most strongly associated genes shown in Table 5 are involved in ciliogenesis, we therefore performed GSEA on these two phenotypes as well. Enrichment was detected in absent corpus callosum, but not in hydroencephaly in the RD cohort, although this did not replicate in the general population cohort. The only gene that overlaps with the LR asymmetry genes in Table 5, annotated to the absent corpus callosum phenotype, is GLI3. However, RFX3 has not yet been annotated to this phenotype in the mouse phenotype ontology [67], while PCSK6 is also known to have high expression in the corpus callosum [68]. Both postmortem measurements and MRI studies have independently indicated the tendency for the corpus callosum to be larger in left-handers [69], [70], suggesting that the corpus callosum plays a role in the expression of handedness. Our study provides genetic evidence in support of this.
The relationship between these genes and both corpus callosum development and brain asymmetry are not well understood in humans. However, infants with agenesis of the corpus callosum appear to show a similar bias in right-handedness and performance on unimanual hand skill tasks to controls, although they perform slower at bimanual tasks [71], [72]. Brain asymmetries have been better studied in zebrafish and have revealed that these processes are under the control of Nodal-related genes, suggesting a conserved pathway controlling both visceral and cerebral asymmetries [73]. A particular line of zebrafish, frequent situs inversus (fsi), displays reversal of both body and neuronal asymmetries, as well as of some characteristic behavioral phenotypes, like eye preference and direction of prey approach [74]. Our study implicates Nodal-related genes in the development of handedness and therefore brain asymmetry in humans.
The main limitations of this study are dependent on the currently available datasets, characterized by a degree of genotype and phenotype heterogeneity, and a small sample size. Genotypes from ALSPAC were imputed with HapMap phase II instead of the 1000 genomes reference panel. This means we were restricted to analyzing only ∼2 million SNPs instead of over 6 million common SNPs in the 1000 genomes project. The imputation accuracy is also lower with HapMap II, however we restricted our study to common variants (MAF≥5%), for which imputation accuracy is high (see box 4 of [75]). Not only was the relative hand skill phenotype slightly different in ALSPAC (see Materials and Methods), it was only measured once instead of five times. Furthermore the phenotype is only a proxy for one specific aspect of handedness, namely manipulating objects quickly with each hand separately. It is strongly correlated with both hand preference and dexterity (see Results), and it is not clear whether the associations observed are due to handedness or dexterity or a combination of the two. Although we interrogated a quantitative phenotype, which is more powerful than a binary case-control GWAS such as that performed by Eriksson et al. [35], the numbers of participants were relatively small (discovery cohorts: n = 744 and replication: n = 2,666). Analysis of phenotypes like PegQ in much larger cohorts will be needed to investigate comprehensively the biological complexity of laterality.
Based on our results we propose that the same biological mechanism underlying the development of LR asymmetry in the body plays a role in determining handedness. However, although we replicated the same LR asymmetry phenotypes in the general population as the RD cohorts, different SNPs located in different genes within these same pathways were responsible for driving the association. Furthermore, the genome-wide significant SNP in PCSK6 does not even show the same trend in the general population (Table 3). This suggests there is both allelic and locus heterogeneity between the RD and general population cohorts. We suggest this heterogeneity may derive from epistasis between genes involved in dyslexia and those involved in handedness. In support of this, a cilia-related coexpression module derived from publically available microarray datasets found that the dyslexia associated genes, DCDC2, DYX1C1, and KIAA0319 are coexpressed in cilia, suggesting they interact with genes involved in the determination of LR asymmetry [76]. Furthermore, overexpression of Dcdc2 increases the length of cilia in rats [77]. Also, the Zebrafish ortholog of the dyslexia candidate gene DYX1C1 has been shown to play a key role in cilia growth and function, and the inhibition of dyx1c1 produces asymmetry phenotypes like situs inversus [78]. We have confirmed, as previously reported [16], [23], that no consistent association has been found between either hand preference or relative hand skill and dyslexia. However, early work by Galaburda et al. reported eight consecutive post-mortem specimens with RD that had reduced planum temporale asymmetry [79], [80]. This suggests subtle structural asymmetries might be involved in dyslexia. It has also been shown that reading performance is correlated with motor abilities on the peg-board test [23], [81]. We have replicated this finding by comparing cohorts 3 and 4 in the current study – demonstrating that individuals with RD are slower at the peg board test than those in the general population (P = 0.001, Table 2). This is consistent with a broad literature showing motor skill difficulties in children with dyslexia [82]–[86].
The precise relationship between handedness, cerebral asymmetry, and neurodevelopmental disorders like dyslexia remains to be determined. However, our results have implicated some of the same genes involved in body asymmetry in handedness, and therefore the development of cerebral asymmetry in both individuals with RD and the general population. Larger scale GWAS or sequencing studies of handedness, coupled with a deeper understanding of the genetic basis of language-related disorders like dyslexia will help determine whether handedness and language do indeed develop hand-in-hand.
Materials and Methods
Ethics Statement
Ethical approval for cohorts 1 and 2 was acquired from the Oxfordshire Psychiatric Research Ethics Committee (OPREC O01.02). For the ALSPAC cohorts, ethical approval was obtained from the ALSPAC Law and Ethics committee and relevant local ethics committees, and written informed consent provided by all parents.
Study Participants
The initial cohort was selected for severity of phenotype to undergo a GWAS for RD as described before [37]. Briefly, families were recruited from the Dyslexia clinic of the Royal Berkshire Hospital and one child per family with dyslexia was selected (n = 185) ranging in age from 6 to 25 years. Unrelated individuals with RD (cohort 2, n = 374) were recruited from either the Dyslexia Research Centre clinics in Oxford and Reading or the Aston Dyslexia and Development Clinic in Birmingham [43]. The majority of these individuals are between 8 and 18 years old. The third cohort of unrelated individuals came from the Avon Longitudinal Study of Parents and Children (ALSPAC). ALSPAC is a general population cohort that started collecting data on around 14,000 pregnant women in the Bristol area with a then expected delivery date between 1 April 1991 and 31 December 1992 [87]. This cohort is described in detail on the website (http://www.alspac.bris.ac.uk) and elsewhere [88]. The children are being followed and measured for many different phenotypes including laterality measures. For the present study, we assigned individuals from the ALSPAC cohort into a sub-group with RD (n = 169, cohort 3), and a sub-group representing the general population who do not show phenotypes compatible with a neurodevelopmental disorder (n = 2666) consistent with our previous study [37].
Relative Hand Skill Phenotype
The peg-board test [26] was administered to the individuals who were analyzed in cohorts 1 and 2. The relative hand skill peg-board task measures the time taken by the subjects to move a row of ten pegs from one location to another with the left hand (L) and right hand (R) separately [26]. Each hand was tested five times, from the average time for each hand we derived the measure PegQ [2(L−R)/(L+R)]. In cohort 1, the distribution has a mean of 0.080 (SD = 0.099) [37], and in cohort 2 it is 0.061 (SD = 0.091). A similar peg-board test was performed in ALSPAC (cohorts 3 and 4) as part of a battery of manual dexterity tests known as Movement ABC [89]. In this case there were 12 pegs on the table that the child picked up one-at-a-time and placed in a peg-board. After initial practice, children performed the test once (due to time constraints) with each hand. Since the test was slightly different, the mean PegQ was slightly different to cohorts 1 and 2 (Table 2), while the distribution remains unimodal, continuous and approximately normal. One outlier was removed from further analysis (PegQ = 1.50).
Genotyping and Quality Control
Genotypes for cohort 1 were generated on the Illumina 550K SNP array [37]. Genotypes for cohort 2 were generated for the present study on the Illumina OmniExpress SNP array (730,525 markers), according to the manufacturer's instructions. We followed the quality control protocol set out by Anderson et al., 2010 [90] excluding individuals with: discordant sex information, a low genotyping success rate (≤98%, Figure S2), duplicated or related to other individuals (identity by state IBS metric ≥0.1875), divergent ancestry from CEU hapmap3 reference samples based on principal component analysis (PCA, Figure S3).
Furthermore, we excluded SNPs that: have an excessive missing genotype rate (call rate ≤0.98, Figure S4), show a significant deviation from Hardy-Weinberg Equilibrium (P≤10−6), and have a minor allele frequency (MAF)≤0.05.
After QC, 458,236 (cohort 1) and 589,768 (cohort 2) single nucleotide polymorphisms (SNPs) were taken forward for imputation.
Genotyping for the ALSPAC (cohorts 3 and 4) was carried out using the Illumina HumanHap 550K array. Individuals were excluded on the basis of the following: sex mismatches, minimal or excessive heterozygosity, disproportionate levels of individual missingness, cryptic relatedness measured as proportion of identity by descent, and insufficient sample replication. The remaining individuals were assessed for evidence of population stratification by multidimensional scaling analysis and compared with Hapmap II (release 22) European descent (CEU), Han Chinese, Japanese and Yoruba reference populations; all individuals with non-European ancestry were removed in the ALSPAC dataset. SNPs with a minor allele frequency of <1%, a call rate of <95% or evidence for violations of Hardy-Weinberg equilibrium were removed.
Imputation
In cohorts 1 and 2, haplotypes were inferred prior to imputation using the Segmented HAPlotype Estimation and Imputation Tool (shapeit v2 – http://www.shapeit.fr/ [91]). We used IMPUTE [42] (v2.2.2 – http://mathgen.stats.ox.ac.uk/impute/impute_v2.html) to estimate the genotypes of SNPs not directly genotyped. Imputed SNPs were filtered out if they had an MAF≤0.05 or imputation info ≤0.8. We then used the 1000 Genomes Phase I integrated variant set (March 2012, build 37) as the reference panel for imputation, testing 5,829,682 SNPs for association.
In ALSPAC autosomal genotypic data were imputed in ALSPAC using Markov Chain Haplotyping software (MACH v.1.0.16) and phased haplotype data from CEU individuals (Hapmap release 22, Phase II NCBI B36, dbSNP 126) based on a cleaned dataset of 8,365 individuals and 464,311 autosomal SNPs. After imputation, all poorly imputed SNPs (RSQR<0.30) and those with low minor allele frequency (MAF≤0.01) were excluded from analyses.
We were not able to obtain 1000 Genomes imputation data for the ALSPAC cohort, however we did perform imputation using the HapMap II reference panel for cohorts 1 and 2, and obtained very similar results, suggesting our overall conclusions are not an artifact of using different imputation panels (Tables S7, S8).
Statistical Analysis
Association with PegQ was tested under an additive model using SNPTEST (v2.4.1, http://www.stats.ox.ac.uk/~marchini/software/gwas/snptest.html) simultaneously specifying sex and age as covariates. The genomic inflation factor (λ) was calculated for directly genotyped and imputed SNPs combined, and showed no evidence of population structure, λ was 1.01 for cohort 1, 1.00 for cohort 2, 1.01 for cohort 3, and 1.00 for cohort 4. The values of PegQ were standardized in all cohorts separately to give a mean of 0, and a SD of 1. The results for the three cohorts were then meta-analyzed under a fixed-effects model with inverse variance weighting using GWAMA [92]. In total, 2,095,209 SNPs that were either directly genotyped or imputed and overlapped in all three studies and passed quality control were tested for association.
We performed pathway analysis using Meta-Analysis Gene-set Enrichment of variaNT Associations (MAGENTA) [48]. MAGENTA first maps SNPs to genes (defined as from 20 Kb upstream of the 5′ UTR to 10 Kb downstream), and then selects the most strongly associated SNP, after correcting for confounding factors like gene size, the number of SNPs, linkage disequilibrium, number of recombination hotspots, in order to calculate a P value for each gene. It then ranks all gene P values and tests if there is an overrepresentation of a given set of genes above a user-specified cutoff of all genes. We chose the 75th percentile as a cutoff because it yields the best power for detecting enrichment in traits that are highly polygenic with many associations with weak effect [48]. We tested all pathways in the mouse genome informatics database (MGI, n = 15) that cause asymmetry defects when knocked out in mice and contain more than 10 and less than 100 genes, against a background of all genes in the MGI database (6,573 genes as of August 2012, http://www.informatics.jax.org/ [47]). Mouse phenotypic measurements were chosen because they closely resemble observations from human clinical examination of patients with mutations in orthologous genes [93].
Finally, in order to compare relative hand skill and hand motor skill in cohorts 3 and 4, we used a one-tailed Student's T-Test, not assuming equal variance.
Supporting Information
Zdroje
1. Corballis MC (1993) The lopsided ape: Evolution of the generative mind: Oxford University Press, USA.
2. MarchantLF, McGrewWC (1998) Human handedness: an ethological perspective. Human Evolution 13 : 221–228.
3. RaymondM, PontierD (2004) Is there geographical variation in human handedness? Laterality 9 : 35–51.
4. McgrewWC, MarchantLF (1997) On the other hand: Current issues in and meta-analysis of the behavioral laterality of hand function in nonhuman primates. Yearbook of Physical Anthropology, Vol 40 - 1997 40 : 201–232.
5. CashmoreL, UominiN, ChapelainA (2008) The evolution of handedness in humans and great apes: a review and current issues. Journal of Anthropological Sciences 86 : 7–35.
6. UominiNT (2009) The prehistory of handedness: archaeological data and comparative ethology. J Hum Evol 57 : 411–419.
7. FrayerDW, LozanoM, de CastroJMB, CarbonellE, ArsuagaJL, et al. (2012) More than 500,000 years of right-handedness in Europe. Laterality 17 : 51–69.
8. FrayerDW, FioreI, Lalueza-FoxC, RadovcicJ, BondioliL (2010) Right handed Neandertals: Vindija and beyond. Journal of Anthropological Sciences 88 : 113–127.
9. FoxCL, FrayerDW (1997) Non-dietary marks in the anterior dentition of the Krapina neanderthals. International Journal of Osteoarchaeology 7 : 133–149.
10. LozanoM, MosqueraM, de CastroJMB, ArsuagaJL, CarbonellE (2009) Right handedness of Homo heidelbergensis from Sima de los Huesos (Atapuerca, Spain) 500,000 years ago. Evolution and Human Behavior 30 : 369–376.
11. AmuntsK, SchlaugG, SchleicherA, SteinmetzH, DabringhausA, et al. (1996) Asymmetry in the human motor cortex and handedness. Neuroimage 4 : 216–222.
12. DassonvilleP, ZhuXH, UurbilK, KimSG, AsheJ (1997) Functional activation in motor cortex reflects the direction and the degree of handedness. Proc Natl Acad Sci U S A 94 : 14015–14018.
13. HervePY, CrivelloF, PercheyG, MazoyerB, Tzourio-MazoyerN (2006) Handedness and cerebral anatomical asymmetries in young adult males. Neuroimage 29 : 1066–1079.
14. KnechtS, DragerB, DeppeM, BobeL, LohmannH, et al. (2000) Handedness and hemispheric language dominance in healthy humans. Brain 123 : 2512–2518.
15. CorballisMC (2003) From mouth to hand: gesture, speech, and the evolution of right-handedness. Behav Brain Sci 26 : 199–208; discussion 208-160.
16. Bishop DVM (1990) Handedness and developmental disorder. Lavenham: Mac Keith Press. xi, 213 p. p.
17. MaisogJM, EinbinderER, FlowersDL, TurkeltaubPE, EdenGF (2008) A meta-analysis of functional neuroimaging studies of dyslexia. Ann N Y Acad Sci 1145 : 237–259.
18. RichlanF, KronbichlerM, WimmerH (2012) Structural abnormalities in the dyslexic brain: A meta-analysis of voxel-based morphometry studies. Hum Brain Mapp doi: 10.1002/hbm.22127
19. ShapleskeJ, RossellSL, WoodruffPW, DavidAS (1999) The planum temporale: a systematic, quantitative review of its structural, functional and clinical significance. Brain Res Brain Res Rev 29 : 26–49.
20. SommerI, RamseyN, KahnR, AlemanA, BoumaA (2001) Handedness, language lateralisation and anatomical asymmetry in schizophrenia: meta-analysis. Br J Psychiatry 178 : 344–351.
21. ClarkGM, CrowTJ, BarrickTR, CollinsonSL, JamesAC, et al. (2010) Asymmetry loss is local rather than global in adolescent onset schizophrenia. Schizophr Res 120 : 84–86.
22. DragovicM, HammondG (2005) Handedness in schizophrenia: a quantitative review of evidence. Acta Psychiatr Scand 111 : 410–419.
23. FrancksC, FisherSE, MarlowAJ, MacPhieIL, TaylorKE, et al. (2003) Familial and genetic effects on motor coordination, laterality, and reading-related cognition. Am J Psychiatry 160 : 1970–1977.
24. MedlandSE, DuffyDL, WrightMJ, GeffenGM, HayDA, et al. (2009) Genetic influences on handedness: Data from 25,732 Australian and Dutch twin families. Neuropsychologia 47 : 330–337.
25. GeschwindDH, MillerBL, DeCarliC, CarmelliD (2002) Heritability of lobar brain volumes in twins supports genetic models of cerebral laterality and handedness. Proc Natl Acad Sci U S A 99 : 3176–3181.
26. Annett M (1985) Left, Right, Hand and Brain: The Right Shift Theory. London: Psychology Press. 488 p. p.
27. KlarAJS (1996) A single locus, RGHT, specifies preference for hand utilization in humans. Cold Spring Harbor Symposia on Quantitative Biology 61 : 59–65.
28. McManus C (2004) Right hand, left hand: The origins of asymmetry in brains, bodies, atoms and cultures: Harvard University Press.
29. ChakravartiA (1999) Population genetics–making sense out of sequence. Nat Genet 21 : 56–60.
30. ReichDE, LanderES (2001) On the allelic spectrum of human disease. Trends Genet 17 : 502–510.
31. LanderES (1996) The new genomics: global views of biology. Science 274 : 536–539.
32. FrancksC, MaegawaS, LaurenJ, AbrahamsBS, Velayos-BaezaA, et al. (2007) LRRTM1 on chromosome 2p12 is a maternally suppressed gene that is associated paternally with handedness and schizophrenia. Molecular Psychiatry 12 : 1129–1139.
33. MedlandSE, DuffyDL, SpurdleAB, WrightMJ, GeffenGM, et al. (2005) Opposite effects of androgen receptor CAG repeat length on increased risk of left-handedness in males and females. Behav Genet 35 : 735–744.
34. HampsonE, SankarJS (2012) Hand preference in humans is associated with testosterone levels and androgen receptor gene polymorphism. Neuropsychologia 50 : 2018–2025.
35. ErikssonN, MacphersonJM, TungJY, HonLS, NaughtonB, et al. (2010) Web-based, participant-driven studies yield novel genetic associations for common traits. PLoS Genet 6: e1000993.
36. McManusIC, DavisonA, ArmourJAL (2013) Multilocus genetic models of handedness closely resemble single-locus models in explaining family data and are compatible with genome-wide association studies. Ann NY Acad Sci 1288 : 48–58.
37. ScerriTS, BrandlerWM, ParacchiniS, MorrisAP, RingSM, et al. (2011) PCSK6 is associated with handedness in individuals with dyslexia. Hum Mol Genet 20 : 608–614.
38. GrandeC, PatelNH (2009) Nodal signalling is involved in left-right asymmetry in snails. Nature 457 : 1007–1011.
39. MercolaM, LevinM (2001) Left-right asymmetry determination in vertebrates. Annu Rev Cell Dev Biol 17 : 779–805.
40. ConstamDB, RobertsonEJ (2000) SPC4/PACE4 regulates a TGFbeta signaling network during axis formation. Genes Dev 14 : 1146–1155.
41. ArningL, OcklenburgS, SchulzS, NessV, GerdingWM, et al. (2013) VNTR Polymorphism Is Associated with Degree of Handedness but Not Direction of Handedness. PLoS One 8: e67251.
42. HowieBN, DonnellyP, MarchiniJ (2009) A flexible and accurate genotype imputation method for the next generation of genome-wide association studies. PLoS Genet 5: e1000529.
43. ScerriTS, ParacchiniS, MorrisA, MacPhieIL, TalcottJ, et al. (2010) Identification of candidate genes for dyslexia susceptibility on chromosome 18. PLoS One 5: e13712.
44. FrancksC, ParacchiniS, SmithSD, RichardsonAJ, ScerriTS, et al. (2004) A 77-kilobase region of chromosome 6p22.2 is associated with dyslexia in families from the United Kingdom and from the United States. Am J Hum Genet 75 : 1046–1058.
45. NgA, WongM, VivianoB, ErlichJM, AlbaG, et al. (2009) Loss of glypican-3 function causes growth factor-dependent defects in cardiac and coronary vascular development. Dev Biol 335 : 208–215.
46. ZhouJ, YangF, LeuNA, WangPJ (2012) MNS1 is essential for spermiogenesis and motile ciliary functions in mice. PLoS Genet 8: e1002516.
47. BlakeJA, BultCJ, EppigJT, KadinJA, RichardsonJE (2009) The Mouse Genome Database genotypes::phenotypes. Nucleic Acids Res 37: D712–719.
48. SegreAV, GroopL, MoothaVK, DalyMJ, AltshulerD (2010) Common inherited variation in mitochondrial genes is not enriched for associations with type 2 diabetes or related glycemic traits. PLoS Genet 6: e1001058.
49. El ZeinL, Ait-LounisA, MorleL, ThomasJ, ChhinB, et al. (2009) RFX3 governs growth and beating efficiency of motile cilia in mouse and controls the expression of genes involved in human ciliopathies. J Cell Sci 122 : 3180–3189.
50. HaycraftCJ, BanizsB, Aydin-SonY, ZhangQ, MichaudEJ, et al. (2005) Gli2 and Gli3 localize to cilia and require the intraflagellar transport protein polaris for processing and function. PLoS Genet 1: e53.
51. YoshibaS, ShiratoriH, KuoIY, KawasumiA, ShinoharaK, et al. (2012) Cilia at the node of mouse embryos sense fluid flow for left-right determination via Pkd2. Science 338 : 226–231.
52. ConstamDB, RobertsonEJ (1999) Regulation of bone morphogenetic protein activity by pro domains and proprotein convertases. J Cell Biol 144 : 139–149.
53. YeoC, WhitmanM (2001) Nodal signals to Smads through Cripto-dependent and Cripto-independent mechanisms. Mol Cell 7 : 949–957.
54. ChazaudC, ChambonP, DolleP (1999) Retinoic acid is required in the mouse embryo for left-right asymmetry determination and heart morphogenesis. Development 126 : 2589–2596.
55. GazitA, YanivA, BaficoA, PramilaT, IgarashiM, et al. (1999) Human frizzled 1 interacts with transforming Wnts to transduce a TCF dependent transcriptional response. Oncogene 18 : 5959–5966.
56. NakayaMA, BirisK, TsukiyamaT, JaimeS, RawlsJA, et al. (2005) Wnt3a links left-right determination with segmentation and anteroposterior axis elongation. Development 132 : 5425–5436.
57. CotaCD, BagherP, PelcP, SmithCO, BodnerCR, et al. (2006) Mice with mutations in Mahogunin ring finger-1 (Mgrn1) exhibit abnormal patterning of the left-right axis. Dev Dyn 235 : 3438–3447.
58. ShannonMB, PattonBL, HarveySJ, MinerJH (2006) A hypomorphic mutation in the mouse laminin alpha5 gene causes polycystic kidney disease. J Am Soc Nephrol 17 : 1913–1922.
59. BadanoJL, MitsumaN, BealesPL, KatsanisN (2006) The ciliopathies: an emerging class of human genetic disorders. Annu Rev Genomics Hum Genet 7 : 125–148.
60. WatsonT (1836) An account of some cases of transposition observed in the human body. Lond Med Gazette 18 : 393–403.
61. CockayneEA (1938) The genetics of transposition of the viscera. Q J Med 31 : 479–493.
62. TorgersenJ (1950) Situs inversus, asymmetry, and twinning. Am J Hum Genet 2 : 361–370.
63. McManusIC, MartinN, StubbingsGF, ChungEM, MitchisonHM (2004) Handedness and situs inversus in primary ciliary dyskinesia. Proc Biol Sci 271 : 2579–2582.
64. KennedyDN, O'CravenKM, TichoBS, GoldsteinAM, MakrisN, et al. (1999) Structural and functional brain asymmetries in human situs inversus totalis. Neurology 53 : 1260–1265.
65. IharaA, HirataM, FujimakiN, GotoT, UmekawaY, et al. (2010) Neuroimaging study on brain asymmetries in situs inversus totalis. J Neurol Sci 288 : 72–78.
66. SunT, PatoineC, Abu-KhalilA, VisvaderJ, SumE, et al. (2005) Early asymmetry of gene transcription in embryonic human left and right cerebral cortex. Science 308 : 1794–1798.
67. BenadibaC, MagnaniD, NiquilleM, MorleL, VallotonD, et al. (2012) The ciliogenic transcription factor RFX3 regulates early midline distribution of guidepost neurons required for corpus callosum development. PLoS Genet 8: e1002606.
68. JohnsonJM, CastleJ, Garrett-EngeleP, KanZ, LoerchPM, et al. (2003) Genome-wide survey of human alternative pre-mRNA splicing with exon junction microarrays. Science 302 : 2141–2144.
69. WitelsonSF (1985) The brain connection: the corpus callosum is larger in left-handers. Science 229 : 665–668.
70. HabibM, GayraudD, OlivaA, RegisJ, SalamonG, et al. (1991) Effects of handedness and sex on the morphology of the corpus callosum: a study with brain magnetic resonance imaging. Brain Cogn 16 : 41–61.
71. MuellerKLO, MarionSD, PaulLK, BrownWS (2009) Bimanual Motor Coordination in Agenesis of the Corpus Callosum. Behav Neurosci 123 : 1000–1011.
72. SaccoS, MoutardML, FagardJ (2006) Agenesis of the corpus callosum and the establishment of handedness. Dev Psychobiol 48 : 472–481.
73. ConchaML, BurdineRD, RussellC, SchierAF, WilsonSW (2000) A nodal signaling pathway regulates the laterality of neuroanatomical asymmetries in the zebrafish forebrain. Neuron 28 : 399–409.
74. BarthKA, MiklosiA, WatkinsJ, BiancoIH, WilsonSW, et al. (2005) fsi zebrafish show concordant reversal of laterality of viscera, neuroanatomy, and a subset of behavioral responses. Current biology : CB 15 : 844–850.
75. MarchiniJ, HowieB (2010) Genotype imputation for genome-wide association studies. Nat Rev Genet 11 : 499–511.
76. IvlievAE, t HoenPA, van Roon-MomWM, PetersDJ, SergeevaMG (2012) Exploring the transcriptome of ciliated cells using in silico dissection of human tissues. PLoS One 7: e35618.
77. MassinenS, HokkanenME, MatssonH, TammimiesK, Tapia-PaezI, et al. (2011) Increased expression of the dyslexia candidate gene DCDC2 affects length and signaling of primary cilia in neurons. PLoS One 6: e20580.
78. ChandrasekarG, VesterlundL, HultenbyK, Tapia-PáezI, KereJ (2013) The Zebrafish Orthologue of the Dyslexia Candidate Gene DYX1C1 Is Essential for Cilia Growth and Function. PLoS One 8: e63123.
79. GalaburdaAM, ShermanGF, RosenGD, AboitizF, GeschwindN (1985) Developmental dyslexia: four consecutive patients with cortical anomalies. Ann Neurol 18 : 222–233.
80. GalaburdaAM (1989) Ordinary and extraordinary brain development: Anatomical variation in developmental dyslexia. Ann Dyslexia 39 : 65–80.
81. StoodleyCJ, SteinJF (2006) A processing speed deficit in dyslexic adults? Evidence from a peg-moving task. Neurosci Lett 399 : 264–267.
82. RamusF, PidgeonE, FrithU (2003) The relationship between motor control and phonology in dyslexic children. Journal of Child Psychology and Psychiatry 44 : 712–722.
83. FawcettAJ, NicolsonRI, DeanP (1996) Impaired performance of children with dyslexia on a range of cerebellar tasks. Annals of Dyslexia 46 : 259–283.
84. IversenS, BergK, EllertsenB, TonnessenFE (2005) Motor coordination difficulties in a municipality group and in a clinical sample of poor readers. Dyslexia 11 : 217–231.
85. NicolsonRI, FawcettAJ (1990) Automaticity - a New Framework for Dyslexia Research. Cognition 35 : 159–182.
86. GetchellN, PabrejaP, NeeldK, CarrioV (2007) Comparing children with and without dyslexia on the movement assessment battery for children and the test of gross motor development. Perceptual and Motor Skills 105 : 207–214.
87. GoldingJ, PembreyM, JonesR (2001) ALSPAC–the Avon Longitudinal Study of Parents and Children. I. Study methodology. Paediatr Perinat Epidemiol 15 : 74–87.
88. BoydA, GoldingJ, MacleodJ, LawlorDA, FraserA, et al. (2012) Cohort Profile: The ‘Children of the 90s’–the index offspring of the Avon Longitudinal Study of Parents and Children. Int J Epidemiol 42 : 111–27.
89. Henderson SE, Sugden DA (1992) Movement Assessment Battery for Children manual. Sidcup: The Psychological Corporation.
90. AndersonCA, PetterssonFH, ClarkeGM, CardonLR, MorrisAP, et al. (2010) Data quality control in genetic case-control association studies. Nat Protoc 5 : 1564–1573.
91. DelaneauO, MarchiniJ, ZaguryJF (2012) A linear complexity phasing method for thousands of genomes. Nat Methods 9 : 179–181.
92. MagiR, MorrisAP (2010) GWAMA: software for genome-wide association meta-analysis. Bmc Bioinformatics 11 : 288.
93. WebberC, Hehir-KwaJY, NguyenDQ, de VriesBB, VeltmanJA, et al. (2009) Forging links between human mental retardation-associated CNVs and mouse gene knockout models. PLoS Genet 5: e1000531.
Štítky
Genetika Reprodukční medicínaČlánek vyšel v časopise
PLOS Genetics
2013 Číslo 9
- Kazuistika – Perspektivy využití precizované medicíny v rámci personalizované specifické terapie onkologických pacientů
- Nobelova cena za chemii pro genetické nůžky: Objev, který změní naši budoucnost?
- Technologie na bázi RNA v klinické praxi: od přebarvených petúnií k terapii vzácných a dosud jen obtížně léčitelných chorob u lidí
- „Nepředstavovali jsme si, že náš výzkum povede přímo ke vzniku nových léků, dokonce ještě za našeho života“
- Bezplatné služby pro diagnostiku ATTRv amyloidózy pro kardiology
Nejčtenější v tomto čísle
- A Genome-Wide Systematic Analysis Reveals Different and Predictive Proliferation Expression Signatures of Cancerous vs. Non-Cancerous Cells
- Recent Acquisition of by Baka Pygmies
- The Condition-Dependent Transcriptional Landscape of
- Histone Chaperone NAP1 Mediates Sister Chromatid Resolution by Counteracting Protein Phosphatase 2A
Zvyšte si kvalifikaci online z pohodlí domova
Mazová zátka a její řešení
nový kurzVšechny kurzy