
Ago1 Interacts with RNA Polymerase II and Binds to the Promoters of Actively Transcribed Genes in Human Cancer Cells
Argonaute proteins are often credited for their cytoplasmic activities in which they function as central mediators of the RNAi platform and microRNA (miRNA)-mediated processes. They also facilitate heterochromatin formation and establishment of repressive epigenetic marks in the nucleus of fission yeast and plants. However, the nuclear functions of Ago proteins in mammalian cells remain elusive. In the present study, we combine ChIP-seq (chromatin immunoprecipitation coupled with massively parallel sequencing) with biochemical assays to show that nuclear Ago1 directly interacts with RNA Polymerase II and is widely associated with chromosomal loci throughout the genome with preferential enrichment in promoters of transcriptionally active genes. Additional analyses show that nuclear Ago1 regulates the expression of Ago1-bound genes that are implicated in oncogenic pathways including cell cycle progression, growth, and survival. Our findings reveal the first landscape of human Ago1-chromosomal interactions, which may play a role in the oncogenic transcriptional program of cancer cells.
Published in the journal:
. PLoS Genet 9(9): e32767. doi:10.1371/journal.pgen.1003821
Category:
Research Article
doi:
https://doi.org/10.1371/journal.pgen.1003821
Summary
Argonaute proteins are often credited for their cytoplasmic activities in which they function as central mediators of the RNAi platform and microRNA (miRNA)-mediated processes. They also facilitate heterochromatin formation and establishment of repressive epigenetic marks in the nucleus of fission yeast and plants. However, the nuclear functions of Ago proteins in mammalian cells remain elusive. In the present study, we combine ChIP-seq (chromatin immunoprecipitation coupled with massively parallel sequencing) with biochemical assays to show that nuclear Ago1 directly interacts with RNA Polymerase II and is widely associated with chromosomal loci throughout the genome with preferential enrichment in promoters of transcriptionally active genes. Additional analyses show that nuclear Ago1 regulates the expression of Ago1-bound genes that are implicated in oncogenic pathways including cell cycle progression, growth, and survival. Our findings reveal the first landscape of human Ago1-chromosomal interactions, which may play a role in the oncogenic transcriptional program of cancer cells.
Introduction
Argonautes (Ago) comprise a family of evolutionarily conserved proteins that are central to the RNA interference (RNAi) platform and miRNA function [1], [2]. Ago proteins are often recognized by their cytoplasmic function in which they regulate gene transcripts via post-transcriptional gene silencing (PTGS) mechanisms. However, nuclear functions have also been well-characterized in fission yeast and plants in which they assist in mechanisms of transcriptional gene silencing (TGS). In fission yeast, Ago partners with antisense transcripts to form the RITS (RNA-induced transcriptional silencing) complex at centromeric regions to induce heterochromatin formation [3]. Similarly, plant Argonautes interact with ribonucleoprotein complexes to induce histone and DNA methylation [4].
In mammals, the nuclear role of Ago proteins (Ago1–4) has remained largely unexplored. There have been scattered examples implicating mammalian Ago members in several nuclear processes including TGS [5]–[8], gene activation [9]–[11], and alternative splicing [12]. In the present study, we investigate the nuclear functions of Ago1 and Ago2 – the major facilitators of miRNA activity [13], [14] – from a global prospective using human cancer cells as a model system. Initial biochemical experiments indicate that nuclear Ago1 selectively interacts with RNA polymerase II (RNAP II). Chromatin immunoprecipitation coupled with massively parallel sequencing (ChIP-seq) reveals nuclear Ago1, but not Ago2, is pervasively associated with promoters of actively transcribed genes involved in growth, survival, and cell cycle progression. Ago1 knockdown experiments further indicate a positive correlation between Ago1 binding and gene expression. Additional evidence suggests that Ago1-chromosomal interactions may be dependent on miRNA. Our data represents the first landscape of Ago1-chromosomal interactions in human cells and reveals a novel function for Ago1 in modulating gene transcription within the nucleus.
Results
Nuclear localization and distribution of Ago1 and Ago2
We have previously shown that Ago1 and Ago2 exist in the nuclear fraction of mouse cells [11]. To determine if this feature is conserved in human cells, we examined Ago1 and Ago2 cellular distribution in the nuclear and cytosolic fractions of PC-3 (prostate adenocarcinoma) and RWPE-1 (normal prostatic epithelial) cells by immunoblot analysis. Nuclear distribution of endogenous Ago1 and Ago2 proteins was readily detectable in both cellular compartments (Figure 1A, 1B). Stable overexpression of exogenous HA-tagged Ago1 (HA-Ago1) or Ago2 (HA-Ago2) in PC-3 was also detected in both nuclear and cytosolic fractions (Figure 1C). Immunofluorescence (IF) analysis confirmed that the distribution of Ago1 and Ago2 was evident in both the cytoplasm and nucleus of PC-3 cells expressing HA or GFP-tagged Ago proteins, although signal appeared more prominent in the cytoplasm when observing whole cell distribution (Figure S1).

To determine if nuclear Ago proteins are associated with chromatin, we adopted a fractionation protocol [15] designed to selectively isolate chromatin-bound factors (Figure 1D). Immunoblot analysis revealed that Ago1 and Ago2 were detected in both chromatin fractions (P1 and S2), as well as present in the Triton X-100 soluble fraction (S1) comprising non-chromatin bound cellular proteins such as tubulin (Figure 1E); consistent with the canonical functions of Ago proteins in post-transcriptional gene silencing (PTGS) mechanisms. RNA polymerase II (RNAP II) was also detected and served as a marker for chromatin association (Figure 1E). Taken together, these results suggest that Ago1 and Ago2 are present in the nucleus of human cells in which a subfraction is bound to chromatin.
To analyze Ago protein distribution in only the nuclear compartment, we performed IF on isolated nuclei from the HA-Ago1 and HA-Ago2 stable cell lines. As shown in Figure 1F, 1G, Ago1 signals were generally scattered throughout the nuclear interior, whereas Ago2 was predominantly found on the inner nuclear periphery. Negative controls omitting the primary antibody or using cells without HA tag yielded no staining at all (Figure S2). This data indicates Ago1 and Ago2 have different nuclear localization patterns, which may reflect differences in their nuclear function.
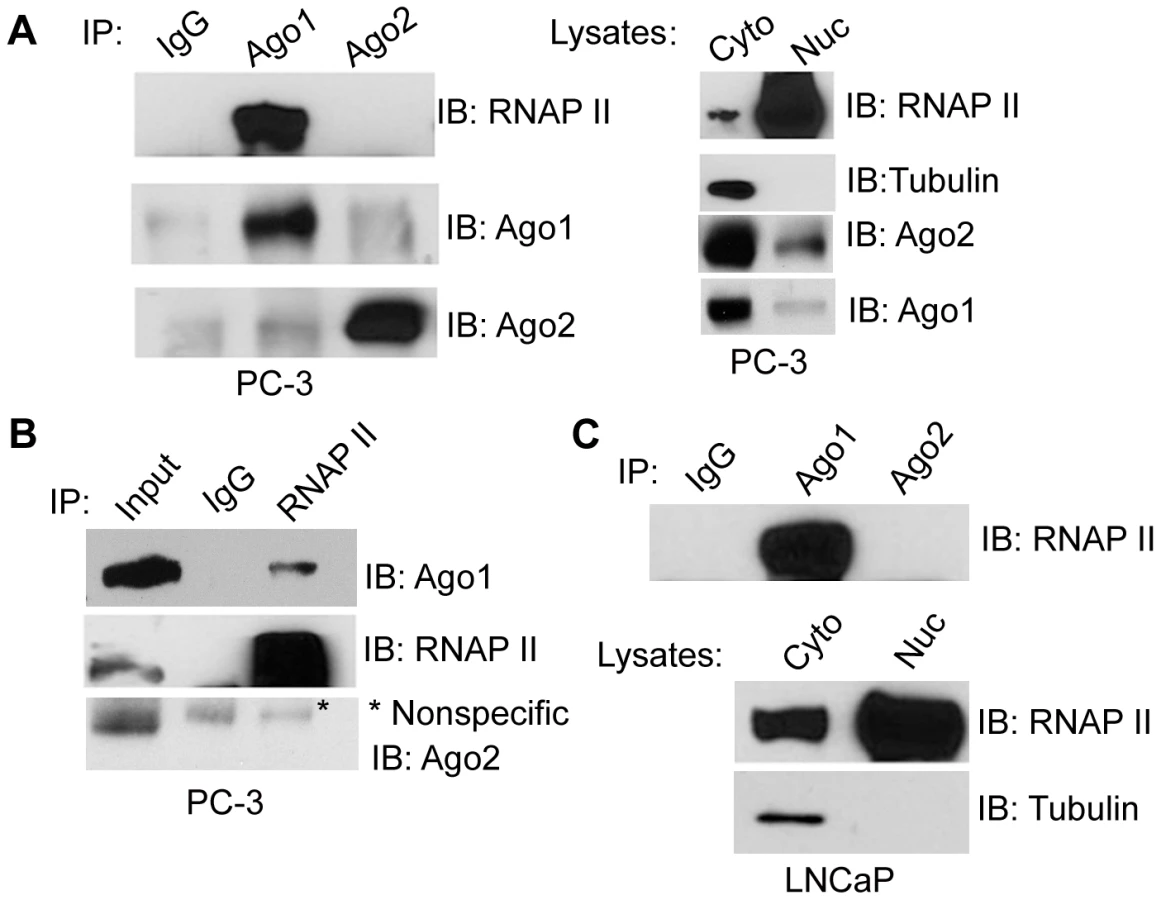
Nuclear Ago1 interacts with RNA polymerase II
Ago proteins have been implicated in regulating transcriptional mechanisms mediated by small RNA duplexes including gene activation and silencing [11], [16]. To determine if Ago proteins directly interact with transcriptional machinery, we performed immunoprecipitation (IP) assays on nuclear extracts from PC-3 cells using antibodies specific to endogenous Ago1 or Ago2 and immunoblotted for RNAP II. As shown in Figure 2A, RNAP II strongly co-precipitated with Ago1, but not Ago2. We further performed reciprocal RNAP II IP experiments followed by immunoblotting for Agos as well as TFIIB, a known RNAP II interacting protein, as a positive control (Figure S3). The result further confirmed RNAP II association with Ago1, but not Ago2 (Figure 2B). This interaction was also conserved in nuclear extracts from LNCaP (human prostate adenocarcinoma) cells (Figure 2C).
To address whether the Ago1-RNAP II interaction requires RNA species as intermediates, nuclear extracts were digested with a cocktail of RNase A and T1 (RNase A/T1) prior to IP (Figure 3A–C). RNase A/T1 treatment did not disrupt interactions between Ago1 and RNAP II (Figure 3A). Although it is possible that RNA molecules may have been protected from digestion by Ago1 or its associated protein complex [17], the data implies Ago1-RNAP II interactions are stable following depletion of nuclear single-stranded RNA species. To determine whether the interactions are DNA dependent, we treated the nuclear extracts with DNase and found that DNase treatment abolished Ago1-RNAP II association (Figure 3B, 3C), suggesting that DNA is required for their interaction.

To test if depletion of miRNA and/or components of the miRNA biogenesis pathway alter the Ago1-RNAP II interaction, we transfected PC-3 cells with siRNA designed to specifically knockdown Dicer (siDicer) or Drosha (siDrosha) (Figure S4A, S4B). Treatment with either siDicer or siDrosha resulted in ≥50% declines in several highly expressed miRNAs implying global downregulation of miRNA maturation (Figure S4C). It should be noted that siDicer and siDrosha treatments also upregulated endogenous protein levels of Ago1 including its nuclear abundance (Figure 3D–G), which may have resulted from a possible compensation mechanism in response to miRNA depletion [18]. Regardless, a moderate decrease in the amount of Ago1-associated RNAP II was observed following Dicer knockdown; the ratio of bound RNAP II to nuclear Ago1 decreased by ∼70% following siDicer treatment (Figure 3E),
Mutation to Dicer at exon 5 has been used to generate a stable cell line (Dicerexon5) derived from HCT116 (colorectal carcinoma) cells with impaired helicase function that interferes with miRNA maturation [19]. IP experiments revealed that co-immunoprecipitation of RNAP II with Ago1 antibody was reduced in Dicerexon5 cells compared to wild-type (WT) controls (Figure 3H), although the protein levels of neither Ago1 nor RNAP II changed in Dicer knockout line compared to its parental cells (Figure 3H). Taken together, these results indicate that Ago1 directly interacts with the core transcription machinery in human cells, which may require Dicer activity and/or the miRNA species it processes.
Genome-wide mapping of Ago1 binding sites
The physical association between Ago1 and RNAP II strongly suggests that Ago proteins may participate in transcriptional gene regulation by interacting with chromatin. Previous studies have demonstrated that Ago proteins programmed with small RNAs can bind to gene bodies or promoters by using chromatin IP (ChIP) assays [11], [12], [20]. To provide a more global view of nuclear Ago interactions, we mapped Ago1 and Ago2 binding in the genome by ChIP coupled with massively parallel sequencing (ChIP-seq). Antibody validation confirmed that ChIP antibodies for Ago1 and Ago2 had no detectable cross-reactivity ([21] and Figure S5A–C, Figure 2A) and are highly specific for RNA-protein IP and ChIP based applications ([20] and Figure S5D). ChIP-seq was also performed for H3K4me3; a histone mark associated with active gene transcription [22]. DNA quality and fragment size distribution for each library was roughly equivalent (Figure S6A). Approximately 80–100 million sequencing reads were obtained from each ChIP-seq library of which ∼80–90% could be uniquely mapped back to the human genome (Table S1, S2). To identify Ago1, Ago2, and H3K4me3-enriched regions, we applied the CCAT (control-based ChIP-seq analysis tool) peak calling algorithm [23] to the raw reads and obtained 110,533 Ago1, 144 Ago2, and 16,729 H3K4me3 peaks (Table S2). By conservatively setting the false discovery rate (FDR) cutoff to 0.054 based on independent ChIP validation results (Figure S6B–D), we obtained 44,684 Ago1 and 16,151 H3K4me3 bona fide peaks (Table S2, S3, S4). None of the Ago2 peaks passed the FDR cutoff (Table S2); therefore, we focused our subsequent analyses only on Ago1.
On average, Ago1 peaks were found once in every 70 kb of genomic sequence (Table S5) having a typical size of ∼1 kb, while the size of H3K4me3 peaks were generally broader (Figure S6E, S6F). Ago1 peaks were neither evenly distributed on chromosomes nor on genes; rather, their distribution on chromosomes correlated strongly with gene density (R2 = 0.75, P<0.0001) and GC% (R2 = 0.468, P = 0.0001), but not with % repetitive sequences (R2 = 0.034) (Figure 4A and Table S5). For example, the highest Ago1 binding density was seen on gene-dense chromosomes 19 and 17, while lowest Ago1 binding was on chromosomes Y and 13, which have the lowest gene density (Figure 4A, Figure S7, and Table S5). When multiple regression analysis was applied, gene density becomes the sole determinant of Ago1 binding density on chromosomes (P<0.001, Table S6). In addition, the majority of Ago1 peaks do not overlap chromosomal “HOT” (high occupancy transcription-related factors binding) regions [24], suggesting that Ago1 peaks we identified are not due to experimental or computational artifacts (Text S1).

Overall, Ago1-bound sequences were largely (64.9%) non-repetitive (Figure 4B). Statistical analysis indicated that Ago1 is associated with significantly less (35.1%) repetitive elements compared to overall abundance in the genome (49%, P = 4.9×10−324) (Figure 4B). Nonetheless, the major fraction of bound repetitive sequence consisted primarily of SINE, LINE, and LTR transposable elements (Figure 4B). SINE (56.8%), low complexity (4.1%) and simple repeat (3.6%) elements were overrepresented compared to their respective frequency in the genome, while LINE (18.2%) and LTR (10.2%) repeats were depleted in Ago1-bound sequences (Figure 4B). Nuclear RNAi has been implicated in transposon regulation in yeast and other eukaryotes by interacting with noncoding transcripts generated from repetitive sequence [25]. It is possible that transposable elements also mediated Ago1 interactions in the nucleus of human cells by a similar manner.
Ago1 is pervasively associated with promoters of actively transcribed genes
Ago1 peaks were also categorized based on gene proximity to include intragenic regions (i.e. introns, exons, and UTRs) and adjacent sequences (i.e. promoters and 3′ flanking region) within 5 kb of gene bodies. Overall, a majority of the reads corresponded to these genic locations. Compared to their respective composition in the genome, all genic regions were overrepresented in the Ago1 library including promoters, 5′UTRs, exons, introns, 3′UTRs, and 3′ flanking regions by 3.61-, 10.25-, 4.83-, 1.1-, 2.36-, and 2.27-fold, respectively (Figure 4C). In contrast, Ago1 peaks were significantly underrepresented in intergenic regions (0.41-fold, P = 5×10−324) (Figure 4C).
Given that Ago1 binding was primarily genic, we evaluated Ago1 peak distribution within ±5 kb of transcription start sites (TSS) of annotated genes. We found that the majority of Ago1 peaks mapped to a region within ±1 kb of TSSs in a distribution pattern similar to H3K4me3 peaks (Figure 4D, 4E). In fact, by further stratifying Ago1-bound genes (AbGs) for the presence or absence of H3K4me3 at TSSs, we found that within the ±1 kb region, 65.2% of Ago1 peaks overlapped with the H3K4me3 mark (Figure 4D). This data implies that Ago1 pervasively associates with chromatin at TSSs of transcriptionally active genes.
Ago1 binding events correlate with active gene regulation
Select examples of AbGs include PIK3CA, PRKCH, CDC6, and RRM1, which have overlapping Ago1 and H3K4me3 peaks proximal to their TSSs (Figure 4F). To determine if RNAP II was also bound to AbGs, we performed ChIP analysis at the promoters of each gene. As shown in Figure 4G, we detected an enrichment of RNAP II as well as Ago1 at each TSS. Collectively, these results indicate Ago1, H3K4me3, and RNAP II are present at the promoters of the example AbGs.
To evaluate the impact of Ago1 perturbation on AbG expression, we performed microarray analysis in PC-3 cells following Ago1 knockdown with a pool of 3 Ago1-specific siRNAs (siAgo1) (Figure S8A). We identified a total of 3156 Ago1-responsive genes (ArGs) including 1592 up - and 1564 downregulated genes defined by >1.2-fold change in expression with a P value<0.05 (Table S7, S8 and Figure S8B). Twenty three genes were selected and independently assessed by qRT-PCR to confirm changes in gene expression (Figure S8C, 8D). AbGs identified by ChIP-seq analysis were subsequently correlated to the changes in global gene expression following Ago1 depletion (Figure 5A). The results indicated that 48.3% of up - and 55.4% of downregulated genes were also bound by Ago1 within 5 kb of their TSSs (Figure 5A) and the overlap between AbGs and ArGs are significantly higher than expected by chance (P = 1.4×10⁻⁶, Figure 5B, blue bars). However, when we stratified ArGs by up and downregulation, correlation was statistically significant only for downregulated ArGs (P = 2.0×10⁻⁷, Figure 5B, green bars) and not upregulated ArGs (red bars, P = 0.1, Figure 5B, red bars), suggesting that AbGs are more likely to be downregulated when Ago1 is perturbed.

Furthermore, we examined the positional effect of Ago1 binding (within ±5 kb distance) on changes in gene expression in response to Ago1 perturbation. To this end, we calculated the correlation between changes in gene expression and Ago1 binding events on the same gene for each location within −5 kb∼+5 kb region shifting one basepair each time. In consistent with the overall correlation analysis (Figure 5B), Ago1 binding events have a better correlation with down - (Figure 5C, green line) than upregulated (Figure 5C, red line) ArGs. The closer Ago1 binding was to the proximal promoter region, the greater the statistical significance was for enrichment of ArGs, especially for downregulated ArGs, with the enrichment for downregulated ArGs peaked at +111 location (P = 1.0×10⁻⁸) and upregulated ArGs at −135 location (P = 0.002) (Figure 5C). Taken together, the correlation between AbGs and downregulated ArGs suggests that Ago1 plays a positive role in maintaining transcription of a subset of genes. It is important to note that our data does not rule out the possibility Ago1 may also be functioning to suppress gene expression through promoter interactions for certain genes.
Ago1-bound sequences contain putative miRNA target sites
miRNAs have been shown to regulate gene transcription by binding to promoter sequences in an Ago-dependent manner [7], [11], [16], [26]. Since Ago proteins do not possess a known DNA binding domain based on protein sequence and structural analysis [27], [28], Ago1-chromosomal interactions might be mediated by miRNAs. As such, we performed miRNA target prediction analysis on the Ago1-bound DNA sequences identified by ChIP-seq. Compared to random selected matched control sequences, the frequency of putative target sites in Ago1-bound peaks were roughly equivalent for most miRNAs (Figure 6A, 6B). However, a total of 49 miRNAs were found to have a statistically higher number of target sites in the Ago1-bound peaks compared to the control sequences (>1.5 fold enrichment, P = 0∼6×10−41), while only 3 miRNAs, function of which is unknown, have higher number of targets in the control sequences (Figure 6A, 6B and Table S9). Interestingly, approximately one third of the 49 miRNAs are known oncomiRs including those from the miR-17-92 and miR-106b-25 clusters, as well as the miR-520/373 family (Figure 6B, Table S9).
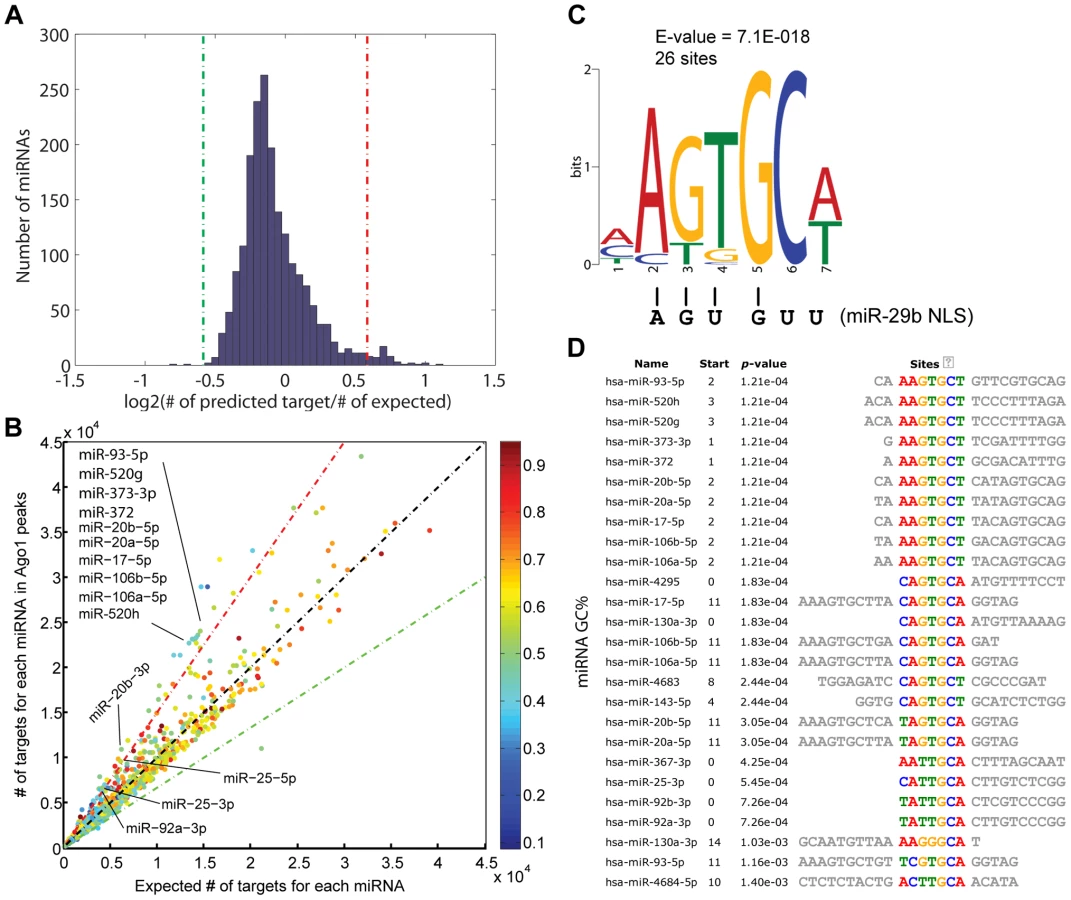
We also preformed motif analysis on each miRNA with enriched target sites in Ago1-bound sequences. A common motif “AGUGCU/A” was found in 19 out the 49 miRNAs; 7 of which contained two incidences of this motif (Figure 6C, 6D). Interestingly, a similar motif (AGUGUU) was identified in the 3′terminus of miR-29b, which functions as a nucleic acid-based nuclear localization signal (NLS) [29]. Although the significance of our motif in context to Ago1-bound sequences is unknown, it shares ∼83% homology with the miR-29b NLS (Figure 6C). As certain miRNAs are known to preferably accumulate in the nucleus [30], the identification of putative target sites at Ago1-bound peaks supports the idea that such miRNAs may play a role in directing Ago1-chromomal interactions.
Ago1 contributes to active gene regulation
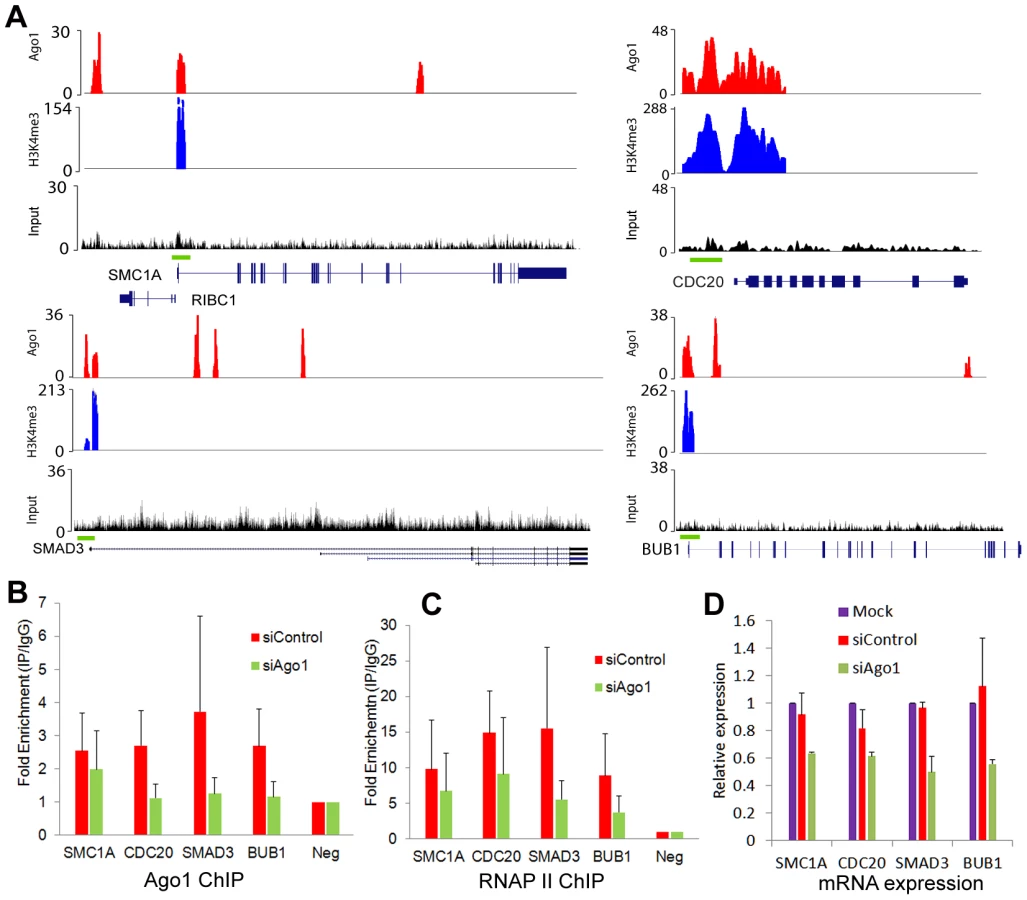
To test the regulatory effect of Ago1 binding on gene promoters, we depleted Ago1 in PC-3 cells using siAgo1 and evaluated its effect on 4 ArGs (i.e. SMC1A, CDC20, SMAD3 and BUB1) with overlapping Ago1 and H3K4me3 peaks at their TSSs (Figure 7A). ChIP analysis revealed reductions in bound Ago1 at the promoters for each gene (Figure 7B). Moreover, knockdown of Ago1 reduced RNAP II occupancy at TSSs (Figure 7C) with corresponding decreases in gene expression levels (Figure 7D). We also generated stable cell lines in RWPE-1 (non-malignant prostate epithelium) cells overexpressing Ago1 or a deletion mutant lacking the PAZ domain (Ago1 dPAZ) (Figure 8A), which is known to interfere with efficient miRNA loading into Ago proteins [31]. Ago1 overexpression resulted in a moderate induction of each gene (Figure 8B), while PAZ deletion attenuated this response (Figure 8B), further supporting a role for miRNAs in directing Ago1-chromosomal interactions. Furthermore, we performed Ago1 ChIP for the 4 example genes and were able to detect in Ago1 overexpressing RWPE-1 cells a concurrent increase in Ago1 binding at the same sites near TSSs detected in PC-3 cells (Figure 8C). Collectively, these results suggest Ago1 contributes to positive gene regulation of select ArGs by interacting with gene promoters and stimulating RNAP II enrichment.

Ago1-bound genes are enriched for cancer-related pathways
Three overlapping AbG sets were defined to include AbGs-5 kb, -1 kb and -0.5 kb, which consist of genes with at least one Ago1 peak within ±5, ±1, and ±0.5 kb away from TSSs, respectively. AbGs-5 kb, -1 kb and -0.5 kb respectively contain 15503, 10074, and 8057 unique genes encompassing 27.5%, 17.9%, and 14.3% of all annotated genes in Ensembl human genome database (Table S10, S11, S12). Interestingly, clustering AbGs-5 kb, -1 kb or -0.5 kb genes by their chromosomal location reveal several cytobands implicated in different human cancers that are highly overrepresented (Figure S9, Table S13, S14). For example, the top-enriched cytobands 19p13.3 and 16p13.3 have been established by numerous studies to be susceptibility loci for several types of cancers including prostate, breast, thyroid, and lymphoma [32]–[35].
Gene pathway enrichment analysis further revealed a number of oncogenic pathways overrepresented by AbGs. The top 5 KEGG pathways highly enriched in AbGs-5 kb genes include “pathways in cancer” (P = 1.9×10⁻¹⁰), “MAPK signaling” (P = 1.7×10⁻⁸), “Wnt signing” (P = 1.1×10⁻⁷), “endocytosis” (P = 4.3×10⁻⁷), and “focal adhesion” (P = 6×10⁻⁷) (Figure 9A). Many proto-oncogenes and proliferation-promoting genes are exemplified in these pathways including growth factors, tyrosine/serine/threonine kinases, G-protein coupled receptors, membrane-associated G-proteins, and nuclear DNA-binding/transcription factors (Table S15). These enrichments hold when AbGs are narrowed down to AbG-1 kb and AbG-0.5 kb genes (Figure S10A, S10B). For instance, SMC1A, CDC20, SMAD3 and BUB1 are all example AbG-0.5 kb genes known to promote cell cycle progression and proliferation in various cancer cell types [36]–[39]. Gene Ontology (GO) classification of AbGs-5 kb genes also show enrichment for gene categories that regulate metabolic processes, transcription, cell cycle, chromatin modification, and cell death (Figure S10C).

KEGG pathway enrichment analysis also revealed that ArGs shared several cancer-related pathways with AbGs-5 kb genes including “MAPK signaling”, “p53 signaling”, “cell cycle”, “prostate cancer”, “colorectal cancer”, etc. (Figure 9B). Further GO analysis revealed that up - and downregulated ArGs were enriched in distinct biological processes with the latter significantly overrepresented by processes important for cancer growth/development including cell cycle, mitosis, DNA repair, chromosome organization, etc. (Figure S11A, S11B).
Analysis of Ago1 protein levels in non-tumorigenic (RWPE-1 and PWR-1E) and cancerous (PC-3, DU145, LNCaP, RV1, CWR22R, and C4-2) prostate cell lines indicated Ago1 is generally expressed at significantly higher levels in cancer cell lines (Figure S12A). Furthermore, knockdown of Ago1 in PC-3 cells caused G0/G1 arrest as indicated by the increase in G0/G1 cell number and corresponding reductions in S and G2/M populations (Figure S12B, S12C). Our data suggests Ago1 may be involved in oncogenic processes, in part, through its nuclear activity by affecting the expression of genes involved in cell growth/survival. In support, integrated analysis of ChIP-seq and gene expression profiling places Ago1 in various major cancer-related signaling pathways involved in regulating DNA damage response, mitogenic signaling, cell cycle, angiogenesis, and apoptosis (Figure 9C).
Discussion
It has become clear that Ago proteins participate in gene regulation at multiple levels. In the present study, we reveal another layer to Ago1 in regulating gene expression within the nucleus of human cancer cells. We provide biochemical evidence that nuclear Ago1, but not Ago2, directly associates with RNAP II. ChIP-seq analysis indicates Ago1 is pervasively bound to multiple genomic loci including repetitive elements of transposons and euchromatic sites as defined by the histone mark H3K4me3. Interestingly, this observation is consistent with the chromosomal binding profiles of drosophila Ago2 (dAGO2); the primary Argonaute for mediating RNAi and miRNA function in the fly [15], [40]. Additionally, Ago1 binding at gene promoters functionally impacts active gene transcription as its loss of function results in reduced Ago1 and RNAP II occupancy at TSSs with corresponding reductions in gene expression, whereas gain of function causes the opposite changes. Our data represents the first landscape of Ago1-chromosomal interactions in human cancer cells, while revealing a novel non-canonical function for Ago1 in regulating gene expression.
It is currently unclear how Ago1 is targeted to selected chromosomal loci. Our analyses imply that miRNA may be involved in mediating interactions between nuclear Ago1, chromatin, and/or RNAP II. Ago1-bound sequences contained putative miRNA target sites and its binding activity to RNAP II was suppressed by perturbing Dicer function; an essential protein involved in miRNA maturation. Additionally, deletion of the RNA-binding domain (PAZ) in Ago1 interfered with gene activation further implicating a role for RNA (i.e. miRNA) in this process. In support, it has been reported that transfection of exogenous miRNA can promote enrichment of Ago proteins at highly-complementary sites in gene promoters to manipulate transcription [7], [11], [16]. Depletion of nuclear single-stranded RNAs by RNase A/T1 did not interfere with Ago1-RNAP II association; however, Ago1 may be loaded with miRNA forming a duplex with complementary target sequence and protecting bound RNA from RNase A/T1 digestion in manner similar to canonical target recognition [17], [41]. As we have not definitely confirmed the presence of miRNAs in these nuclear Ago1 complexes, it is also possible other classes of small RNA species mediate Ago1 interactions with chromatin. For instance, recent deep sequencing studies have shown that Ago1 can associate with small RNA species from non-miRNA sources [42], [43].
In contrast to Ago1, Ago2 apparently lacked pervasive association with chromatin. Additionally, it did not immunoprecipitate with basal transcription machinery (i.e. RNAP II). Although we cannot absolutely rule out technical reasons for the lack of Ago2 binding, the difference in binding may be reflective of their differential nuclear distribution as revealed by IF microscopy (Figure 1E). Ago1 and Ago2 have been reported to exhibit intrinsic preferences when selecting and/or loading RNA molecules. For instance, studies have shown that Ago2 binds perfect-complementary RNA duplexes (e.g. siRNAs) with higher affinity than Ago1; whereas, Ago1 preferably associates with duplexes containing bulges and mismatched bases (e.g. miRNA) [44], [45]. This intrinsic segregation in RNA binding may also be a key determinant in mediating Ago interactions in the nucleus. Alternatively, nuclear Ago2 may be sequestered to the nuclear envelope and only associate with chromatin in a signal-dependent manner. In support, cellular senescence has been shown to trigger nuclear accumulation of Ago2 and binding at gene promoters [8].
It is noteworthy that the magnitudes of gene expression changes for a vast majority of genes in response to Ago1 perturbation were less than two-fold. This observation is consistent with post-transcriptional gene regulation by miRNA [46] and suggests that the role of Ago1 is fine-tuning gene expression in a miRNA dependent manner both at the transcriptional and post-transcriptional levels. The short term (48 hrs) transfection of Ago1 siRNA may also be accounted for the subtle changes in gene expression. We chose this duration to minimize detecting potential secondary regulation but at the same time we might have missed the maximum responsiveness of gene expression to Ago1 perturbation.
In the cytoplasm, Ago proteins elicit pleiotropic effects on gene expression by utilizing miRNA to silence multiple transcripts and regulate various cellular processes [1], [2]. Similarly, nuclear Ago1 also possesses pleiotropy by affecting transcription of multiple genes. In PC-3 cells, Ago1 appeared to preferably drive the expression of genes involved in oncogenic pathways suggesting it may play a role in the cancer phenotype. In support, knockdown of Ago1 by siRNA inhibited cell cycle progression. However, its effects on cancer may be context dependent and vary between different cell types based on both its cytosolic and nuclear activities, as well as the gene profile it regulates. It would be of future interests to understand the crosstalk between Ago-mediated gene regulatory networks and oncogenic signaling pathways.
Materials and Methods
Cell culture
PC-3, LNCaP, DU145, LAPC4, RV1, CWR22R, C4-2, and HCT116 cell lines (ATCC) were maintained in RPMI-1640 media (UCSF Cell Culture Core) supplemented with 10% fetal bovine serum (Hyclone), penicillin G (100 U/mL), streptomycin (100 µg/mL) in a humidified atmosphere of 5% CO2 at 37°C. RWPE-1 and PWR-1E cells were cultured in serum-free keratinocyte medium supplemented with 5 ng/ml human recombinant epidermal growth factor and 0.05 mg/ml bovine pituitary extract.
Plasmids and gene overexpression
Vectors pIRESneo-FLAG/HA-Ago1 (Addgene #10820) and pIRESneo-FLAG/HA-Ago2 (Addgene #10822) were used to establish stable cell lines overexpressing HA-tagged Ago1 (PC3-HA-Ago1) and Ago2 (PC3-HA-Ago2), respectively. Briefly, PC-3 cells were transfected with each corresponding vector and single colonies were subcultured following selection with G418. GFP-Ago1 (Addgene #21534) and GFP-Ago2 (Addgene #11590) plasmids were transiently transfected into PC-3 cells and imaged by fluorescence microscopy. Full-length human Ago1 and the PAZ deletion mutant (Ago1 dPAZ) were amplified from pIRESneo-FLAG/HA-Ago1 and pIRESneo-FLAG/HA-Ago1dPAZ, respectively. Each amplicon was cloned into the lentiviral cDNA expression vector pCDH-EF1-MCS-T2A-copGFP (System Biosciences) via EcoRI and BamHI restriction sites. For lentivirus mediated overexpression, lentivirus particles were generated by the ViraPower Lentiviral Expression System (Invitrogen) and used to infect RWPE-1 cells to generate stable cell lines. Expression of all constructs was confirmed by immunoblot analysis.
Immunofluorescence microscopy
PC-3 cells were seeded on coverslips at 50% confluency. The following day, cells were washed with PBS and fixed in 4% paraformaldehyde at room temperature for 15 min. Cells were permeabilized in PBS containing 0.3% Triton-X-100 for 10 min, rinsed with PBS, and blocked with 10% goat serum at room temperature for 1 hr. Coverslips were incubated with primary antibodies anti-HA (Cell Signaling,cat # 2367, 1∶200) or anti-Ago2 (Wako, cat # 011-22033, 1∶200) diluted in 10% goat serum at room temperature for 1 hr. Cells were washed with PBS and subsequently treated with anti-mouse FITC antibody (Vector Lab; 1∶200) at room temperature for 1 hr. Coverslips were washed and mounted with mounting media containing DAPI. IF images were captured using a Zeiss AxioImager M1 fluorescence microscope. Purified nuclei for IF analysis were isolated as previously described [47]. Nuclei were fixed on slides with fixative reagent (methanol: acetic acid, v/v 3∶1) at room temperature for 5 min and washed with 4×SSC containing 0.1% Tween 20. The slides were subsequently incubated with anti-Ago1 (Santa Cruz Biotechnology, cat #sc-32657, 1∶200), anti-Ago2 (Wako, cat #011-22033, 1∶200), or anti-HA (Cell Signaling, cat #2367, 1∶200) diluted in dilution buffer (1% bovine serum albumin, 4×SSC, and 0.1% Tween 20) at 4°C overnight. Nuclei were washed and incubated with the appropriate Alexa Fluor® 488 secondary antibodies (Molecular Probes; 1∶200) for 30 minutes at 37°C. Following a series of washes, slides were mounted with DAPI II (Abbot Molecular) and IF signals were analyzed using the CytoVision imaging system (Applied Imaging).
Chromatin and subcellular fractionation
Chromatin fractionation was performed as previously described [15]. Cell pellets were collected from two 150 mm plates and washed with PBS. Approximately 1/10th of the cell pellet was resuspended in RIPA buffer (50 mM Tris, pH 7.4, 150 mM NaCl, 1% Triton ×-100, 0.5% deoxycholate, 0.1% SDS, protease inhibitor cocktail, and phosphatase inhibitor) and incubated on ice for 30 min to generate whole cell lysate. The remaining pellet was lysed in cold CSKI buffer [10 mM PIPES, pH 6.8, 100 mM NaCl, 1 mM EDTA, 300 mM sucrose, 1 mM MgCl2, 1 mM DTT, 0.5% (v/v) Triton X-100, and protease inhibitor cocktail (Roche)]. The lysate was divided into two equal portions and centrifuged at 500×g for 3 min at 4°C. The resulting supernatant was collect and referred to as the S1 fraction. One pellet was washed twice in CSKI buffer and resuspended in RIPA buffer to generate the P1 fraction. The other pellet was resuspended in CSKII buffer [10 mM PIPES, pH 6.8, 50 mM NaCl, 300 mM sucrose, 6 mM MgCl2, 1 mM DTT, and protease inhibitor cocktail (Roche)] and treated with DNase (Qiagen) for 30 min. The resulting sample was extracted with 250 mM NH2SO4 for 10 min at room temperature and centrifuged at 1200×g for 6 min at 4°C to generate the S2 (supernatant) and P2 fractions (pellet). The P2 fraction was subsequently resuspended in RIPA buffer. Cytoplasmic and nuclear fractions were prepared by using the NE-PER Nuclear and Cytoplasmic Extraction Reagents (Thermo Scientific). Whole cell lysate was obtained by lysing cells in RIPA buffer for 15 minutes at 4°C. Lysates were clarified by centrifugation for 15 minutes at 14,000 rpm and supernatants were collected. 30 µg of protein from all fractions was analyzed by immunoblot analysis.
Immunoprecipitation
Immunoprecipitation was performed according to Cernilogar et al. [15]. Approximately 400–800 µg of protein from nuclear extracts was mixed with equal volumes immunoprecipitation buffer [10 mM Tris-HCl, pH 8.0, 150 mM NaCl, 1 mM EDTA, 1 mM DTT, 0.1% NP-40, and protease inhibitor cocktail (Roche)]. In Figure 3A–3C, nuclear extract was treated with 2.5 ul of RNase A/T (Ambion) cocktail for 30 min at 25°C or 100 ng/uL of DNAse I (Roche) for 20 min at 37°C. Each sample was subsequently treated with 5 µg of antibody and incubated overnight at 4°C. Antibody treatments included anti-Ago1 (Wako, clone 2A7, cat# 015-22411), anti-Ago2 (Wako, clone 4G8, cat# 011-22033), anti-RNAP II (Millipore, cat# 05-623), or mouse IgG (Millipore, cat# 12-371). The following day, 40 µl protein G dynabeads were added to each sample and rotated for 2 hrs at 4°C. The beads were subsequently washed five times with 500 µl immunoprecipitation buffer and resuspended in SDS-PAGE sample buffer. Immunoprecipitates were boiled for 5 min and the resulting supernatants were analyzed by immunoblot analysis.
Immunoblot analysis
Sample protein concentration was determined by BCA protein assay (Thermo Scientific). Equal amounts of protein were resolved by SDS-PAGE and transferred to 0.45 µm nitrocellulose membranes by voltage gradient. The resulting blots were blocked overnight in 5% nonfat dry milk and subsequently probed with primary antibody. The antibodies were used at the indicated dilutions: anti-Ago1 (Cell Signaling. cat #5053) at 1∶1000, anti-Ago2 (Wako, cat# 011-22033) at 1∶1000, anti-HA 6E2 (Cell Signaling, cat # 2367) at 1∶1000, anti-Tubulin (Sigma, cat # T6074) at 1∶1000, anti-Topoisomerase I (Santa Cruz, cat #sc-10783) at 1∶500, anti-RNAP II (Millipore, cat # 05-623) at 1∶5000, anti-Dicer (Santa Cruz, cat #sc-30226) at 1∶1000, anti-Drosha (Cell Signaling, cat #3364) at 1∶1000, and anti-TFIIB (Cell Signaling, cat #4169) at 1∶1000. Immunodetection occurred by incubating blots with appropriate secondary HRP-linked antibodies and utilizing the SuperSignal West Pico Chemiluminescent kit (Thermo Scientific) to visualize antigen-antibody complexes.
RNAi knockdown
All siRNAs were designed using the BLOCK-iT RNAi Designer Program (Invitrogen). Ago1 knockdown was accomplished by using a pool of 3 siRNAs, while single duplexes were used to knockdown Dicer or Drosha. A pool of 3 non-specific siRNAs served as controls. Transfections were carried out using Lipofectamine RNAiMax (Invitrogen) according to the manufacturer's instructions. All siRNA sequences are listed in Table S16.
RNA extraction and qRT-PCR analysis
Total RNA was isolated by using the RNeasy Mini Kit (Qiagen). ∼1 µg of total RNA was reverse transcribed into cDNA with MMLV reverse transcriptase (Promega) in conjunction with oligo(dT) primers. The resulting cDNA samples were subjected to real-time PCR analysis using gene-specific primers. All primer sequences are listed in Table S16.
Chromatin immunoprecipitation
Chromatin immunoprecipitation (ChIP) was performed as previously described with slight modification [11]. Chromatin was prepared from PC-3 cells following crosslinking with formaldehyde. DNA was sheared to an average size of ∼500 bp using the Bioruptor sonicator (Diagenode) set to ‘high’ with 30 sec ON/OFF pulses for 8 min for a total of 8 cycles. Chromatin was immunoprecipitated overnight at 4°C using 5 µg of the following antibodies: anti-Ago1 (Wako, clone 2A7), anti-Ago2 (Wako, clone 2D4), anti-H3K4me3 (Millipore, cat# 07-473), and mouse IgG (Millipore, cat# 12-371). The following day, the samples were incubated with 25 µl Protein G Dynabeads (Invitrogen) for 2 hrs at 4°C. Immunoprecipitates were sequentially washed with low salt, high salt, and TE buffer. Eluates were collected and reverse crosslinked at 65°C overnight. ChIP DNA was treated with Proteinase K, purified with phenol/chloroform, treated with RNase A, and purified using the Qiaquick PCR purification kit (Qiagen). Target amplification and detection was performed by the 7500 Fast Real-Time System (Applied Biosystems). All reactions were prepared in 10 µl volumes containing 2 µl DNA, 2× Fast SYBR Green master mix (Applied Biosystems), and region-specific primer sets (Table S16). Each sample was analyzed in triplicate. Enrichment was determined by using the 2−ΔCT method relative to input DNA or IgG control. Primer specificity was confirmed by evaluating dissociation curves and independently analyzing amplified product on an agarose gel. For Ago ChIP-western analysis, IP was performed essentially the same way as above and the beads were resuspended in 2× SDS sample buffer and boiled for 5 min. Supernatant was collected and analyzed by western blotting analysis.
Library preparation and ChIP-seq analysis
Each library was prepared by combining the eluates from two ChIP experiments and following the Illumina ChIP-seq library preparation protocol. Briefly, ∼10 ng DNA was end-repaired and subsequently labeled with an additional “A” base on the 3′ ends of the DNA fragments. The resulting DNA samples were ligated to oligonucleotide adaptors and amplified by PCR to construct the individual libraries. Each library was size-selected for DNA fragments ranging between ∼200–300 bp by gel electrophoresis purification. Sample quality was assessed on a Bioanalyzer (Agilent) using the Hypersensitive DNA kit (Agilent) prior to sequencing. Libraries were diluted to 10 nM and sent to the Vincent J. Coates Genomics Sequencing Laboratory at UC Berkeley (http://qb3.berkeley.edu/gsl) for sequencing analysis on a Hiseq2000 Sequencing System (Illumina). Additional detail on ChIP-seq is available in Text S2.
Data access
The ChIP-seq and microarray data from this study have been deposited into the GEO database under the accession numbers GSE40536 and GSE42600.
Other experimental procedures are available in Text S2.
Supporting Information
Zdroje
1. Joshua-TorL, HannonGJ (2011) Ancestral roles of small RNAs: an Ago-centric perspective. Cold Spring Harb Perspect Biol 3: a003772.
2. MeisterG (2013) Argonaute proteins: functional insights and emerging roles. Nat Rev Genet 14 : 447–459.
3. VolpeTA, KidnerC, HallIM, TengG, GrewalSI, et al. (2002) Regulation of heterochromatic silencing and histone H3 lysine-9 methylation by RNAi. Science 297 : 1833–1837.
4. ZilbermanD, CaoX, JacobsenSE (2003) ARGONAUTE4 control of locus-specific siRNA accumulation and DNA and histone methylation. Science 299 : 716–719.
5. MorrisKV, ChanSW, JacobsenSE, LooneyDJ (2004) Small interfering RNA-induced transcriptional gene silencing in human cells. Science 305 : 1289–1292.
6. TingAH, SchuebelKE, HermanJG, BaylinSB (2005) Short double-stranded RNA induces transcriptional gene silencing in human cancer cells in the absence of DNA methylation. Nat Genet 37 : 906–910.
7. KimDH, VilleneuveLM, MorrisKV, RossiJJ (2006) Argonaute-1 directs siRNA-mediated transcriptional gene silencing in human cells. Nat Struct Mol Biol 13 : 793–797.
8. BenhamedM, HerbigU, YeT, DejeanA, BischofO (2012) Senescence is an endogenous trigger for microRNA-directed transcriptional gene silencing in human cells. Nat Cell Biol 14 : 266–275.
9. LiLC, OkinoST, ZhaoH, PookotD, PlaceRF, et al. (2006) Small dsRNAs induce transcriptional activation in human cells. Proc Natl Acad Sci U S A 103 : 17337–17342.
10. JanowskiBA, YoungerST, HardyDB, RamR, HuffmanKE, et al. (2007) Activating gene expression in mammalian cells with promoter-targeted duplex RNAs. Nat Chem Biol 3 : 166–173.
11. HuangV, PlaceRF, PortnoyV, WangJ, QiZ, et al. (2012) Upregulation of Cyclin B1 by miRNA and its implications in cancer. Nucleic Acids Res 40 : 1695–1707.
12. Ameyar-ZazouaM, RachezC, SouidiM, RobinP, FritschL, et al. (2012) Argonaute proteins couple chromatin silencing to alternative splicing. Nat Struct Mol Biol 19 : 998–1004.
13. WangD, ZhangZ, O'LoughlinE, LeeT, HouelS, et al. (2012) Quantitative functions of Argonaute proteins in mammalian development. Genes Dev 26 : 693–704.
14. SuH, TromblyMI, ChenJ, WangX (2009) Essential and overlapping functions for mammalian Argonautes in microRNA silencing. Genes Dev 23 : 304–317.
15. CernilogarFM, OnoratiMC, KotheGO, BurroughsAM, ParsiKM, et al. (2011) Chromatin-associated RNA interference components contribute to transcriptional regulation in Drosophila. Nature 480 : 391–395.
16. YoungerST, CoreyDR (2011) Transcriptional gene silencing in mammalian cells by miRNA mimics that target gene promoters. Nucleic Acids Res 39 : 5682–5691.
17. DeN, YoungL, LauPW, MeisnerNC, MorrisseyDV, et al. (2013) Highly Complementary Target RNAs Promote Release of Guide RNAs from Human Argonaute2. Mol Cell 50 : 344–355.
18. VaucheretH, VazquezF, CreteP, BartelDP (2004) The action of ARGONAUTE1 in the miRNA pathway and its regulation by the miRNA pathway are crucial for plant development. Genes Dev 18 : 1187–1197.
19. CumminsJM, HeY, LearyRJ, PagliariniR, DiazLAJr, et al. (2006) The colorectal microRNAome. Proc Natl Acad Sci U S A 103 : 3687–3692.
20. ChuY, YueX, YoungerST, JanowskiBA, CoreyDR (2010) Involvement of argonaute proteins in gene silencing and activation by RNAs complementary to a non-coding transcript at the progesterone receptor promoter. Nucleic Acids Res 38 : 7736–7748.
21. PeiY, HancockPJ, ZhangH, BartzR, CherrinC, et al. (2010) Quantitative evaluation of siRNA delivery in vivo. RNA 16 : 2553–2563.
22. Santos-RosaH, SchneiderR, BannisterAJ, SherriffJ, BernsteinBE, et al. (2002) Active genes are tri-methylated at K4 of histone H3. Nature 419 : 407–411.
23. XuH, HandokoL, WeiX, YeC, ShengJ, et al. (2010) A signal-noise model for significance analysis of ChIP-seq with negative control. Bioinformatics 26 : 1199–1204.
24. YipKY, ChengC, BhardwajN, BrownJB, LengJ, et al. (2012) Classification of human genomic regions based on experimentally determined binding sites of more than 100 transcription-related factors. Genome Biol 13: R48.
25. CastelSE, MartienssenRA (2013) RNA interference in the nucleus: roles for small RNAs in transcription, epigenetics and beyond. Nat Rev Genet 14 : 100–112.
26. ZardoG, CiolfiA, VianL, StarnesLM, BilliM, et al. (2012) Polycombs and microRNA-223 regulate human granulopoiesis by transcriptional control of target gene expression. Blood 119 : 4034–4046.
27. ElkayamE, KuhnCD, TociljA, HaaseAD, GreeneEM, et al. (2012) The Structure of Human Argonaute-2 in Complex with miR-20a. Cell 150 : 100–110.
28. SchirleNT, MacRaeIJ (2012) The crystal structure of human Argonaute2. Science 336 : 1037–1040.
29. HwangHW, WentzelEA, MendellJT (2007) A hexanucleotide element directs microRNA nuclear import. Science 315 : 97–100.
30. LiaoJY, MaLM, GuoYH, ZhangYC, ZhouH, et al. (2010) Deep sequencing of human nuclear and cytoplasmic small RNAs reveals an unexpectedly complex subcellular distribution of miRNAs and tRNA 3′ trailers. PLoS One 5: e10563.
31. GuS, JinL, HuangY, ZhangF, KayMA (2012) Slicing-independent RISC activation requires the argonaute PAZ domain. Curr Biol 22 : 1536–1542.
32. BertucciF, LagardeA, FerrariA, FinettiP, Charafe-JauffretE, et al. (2012) 8q24 cancer risk allele associated with major metastatic risk in inflammatory breast cancer. PLoS One 7: e37943.
33. NetaG, YuCL, BrennerA, GuF, HutchinsonA, et al. (2012) Common genetic variants in the 8q24 region and risk of papillary thyroid cancer. Laryngoscope 122 : 1040–1042.
34. BrisbinAG, AsmannYW, SongH, TsaiYY, AakreJA, et al. (2011) Meta-analysis of 8q24 for seven cancers reveals a locus between NOV and ENPP2 associated with cancer development. BMC Med Genet 12 : 156.
35. WitteJS (2007) Multiple prostate cancer risk variants on 8q24. Nat Genet 39 : 579–580.
36. HernandoE, OrlowI, LiberalV, NohalesG, BenezraR, et al. (2001) Molecular analyses of the mitotic checkpoint components hsMAD2, hBUB1 and hBUB3 in human cancer. Int J Cancer 95 : 223–227.
37. KidokoroT, TanikawaC, FurukawaY, KatagiriT, NakamuraY, et al. (2008) CDC20, a potential cancer therapeutic target, is negatively regulated by p53. Oncogene 27 : 1562–1571.
38. LuS, LeeJ, ReveloM, WangX, DongZ (2007) Smad3 is overexpressed in advanced human prostate cancer and necessary for progressive growth of prostate cancer cells in nude mice. Clin Cancer Res 13 : 5692–5702.
39. BarberTD, McManusK, YuenKW, ReisM, ParmigianiG, et al. (2008) Chromatid cohesion defects may underlie chromosome instability in human colorectal cancers. Proc Natl Acad Sci U S A 105 : 3443–3448.
40. MoshkovichN, NishaP, BoylePJ, ThompsonBA, DaleRK, et al. (2011) RNAi-independent role for Argonaute2 in CTCF/CP190 chromatin insulator function. Genes Dev 25 : 1686–1701.
41. GagnonKT, CoreyDR (2012) Argonaute and the nuclear RNAs: new pathways for RNA-mediated control of gene expression. Nucleic Acid Ther 22 : 3–16.
42. BurroughsAM, AndoY, de HoonMJ, TomaruY, SuzukiH, et al. (2011) Deep-sequencing of human Argonaute-associated small RNAs provides insight into miRNA sorting and reveals Argonaute association with RNA fragments of diverse origin. RNA Biol 8 : 158–177.
43. PolikepahadS, CorryDB (2012) Profiling of T helper cell-derived small RNAs reveals unique antisense transcripts and differential association of miRNAs with argonaute proteins 1 and 2. Nucleic Acids Res 41 (2) 1164–77.
44. WangB, LiS, QiHH, ChowdhuryD, ShiY, et al. (2009) Distinct passenger strand and mRNA cleavage activities of human Argonaute proteins. Nat Struct Mol Biol 16 : 1259–1266.
45. MescalchinA, DetzerA, WeirauchU, HahnelMJ, EngelC, et al. (2010) Antisense tools for functional studies of human Argonaute proteins. RNA 16 : 2529–2536.
46. EbertMS, SharpPA (2012) Roles for microRNAs in conferring robustness to biological processes. Cell 149 : 515–524.
47. HirayoshiK, LisJT (1999) Nuclear run-on assays: assessing transcription by measuring density of engaged RNA polymerases. Methods Enzymol 304 : 351–362.
Štítky
Genetika Reprodukční medicínaČlánek vyšel v časopise
PLOS Genetics
2013 Číslo 9
- Kazuistika – Perspektivy využití precizované medicíny v rámci personalizované specifické terapie onkologických pacientů
- Nobelova cena za chemii pro genetické nůžky: Objev, který změní naši budoucnost?
- Technologie na bázi RNA v klinické praxi: od přebarvených petúnií k terapii vzácných a dosud jen obtížně léčitelných chorob u lidí
- „Nepředstavovali jsme si, že náš výzkum povede přímo ke vzniku nových léků, dokonce ještě za našeho života“
- Bezplatné služby pro diagnostiku ATTRv amyloidózy pro kardiology
Nejčtenější v tomto čísle
- A Genome-Wide Systematic Analysis Reveals Different and Predictive Proliferation Expression Signatures of Cancerous vs. Non-Cancerous Cells
- Recent Acquisition of by Baka Pygmies
- The Condition-Dependent Transcriptional Landscape of
- Histone Chaperone NAP1 Mediates Sister Chromatid Resolution by Counteracting Protein Phosphatase 2A
Zvyšte si kvalifikaci online z pohodlí domova
Mazová zátka a její řešení
nový kurzVšechny kurzy