
Ras-Induced Changes in H3K27me3 Occur after Those in Transcriptional Activity
Oncogenic signaling pathways regulate gene expression in part through epigenetic modification of chromatin including DNA methylation and histone modification. Trimethylation of histone H3 at lysine-27 (H3K27), which correlates with transcriptional repression, is regulated by an oncogenic form of the small GTPase Ras. Although accumulation of trimethylated H3K27 (H3K27me3) has been implicated in transcriptional regulation, it remains unclear whether Ras-induced changes in H3K27me3 are a trigger for or a consequence of changes in transcriptional activity. We have now examined the relation between H3K27 trimethylation and transcriptional regulation by Ras. Genome-wide analysis of H3K27me3 distribution and transcription at various times after expression of oncogenic Ras in mouse NIH 3T3 cells identified 115 genes for which H3K27me3 level at the gene body and transcription were both regulated by Ras. Similarly, 196 genes showed Ras-induced changes in transcription and H3K27me3 level in the region around the transcription start site. The Ras-induced changes in transcription occurred before those in H3K27me3 at the genome-wide level, a finding that was validated by analysis of individual genes. Depletion of H3K27me3 either before or after activation of Ras signaling did not affect the transcriptional regulation of these genes. Furthermore, given that H3K27me3 enrichment was dependent on Ras signaling, neither it nor transcriptional repression was maintained after inactivation of such signaling. Unexpectedly, we detected unannotated transcripts derived from intergenic regions at which the H3K27me3 level is regulated by Ras, with the changes in transcript abundance again preceding those in H3K27me3. Our results thus indicate that changes in H3K27me3 level in the gene body or in the region around the transcription start site are not a trigger for, but rather a consequence of, changes in transcriptional activity.
Published in the journal:
. PLoS Genet 9(8): e32767. doi:10.1371/journal.pgen.1003698
Category:
Research Article
doi:
https://doi.org/10.1371/journal.pgen.1003698
Summary
Oncogenic signaling pathways regulate gene expression in part through epigenetic modification of chromatin including DNA methylation and histone modification. Trimethylation of histone H3 at lysine-27 (H3K27), which correlates with transcriptional repression, is regulated by an oncogenic form of the small GTPase Ras. Although accumulation of trimethylated H3K27 (H3K27me3) has been implicated in transcriptional regulation, it remains unclear whether Ras-induced changes in H3K27me3 are a trigger for or a consequence of changes in transcriptional activity. We have now examined the relation between H3K27 trimethylation and transcriptional regulation by Ras. Genome-wide analysis of H3K27me3 distribution and transcription at various times after expression of oncogenic Ras in mouse NIH 3T3 cells identified 115 genes for which H3K27me3 level at the gene body and transcription were both regulated by Ras. Similarly, 196 genes showed Ras-induced changes in transcription and H3K27me3 level in the region around the transcription start site. The Ras-induced changes in transcription occurred before those in H3K27me3 at the genome-wide level, a finding that was validated by analysis of individual genes. Depletion of H3K27me3 either before or after activation of Ras signaling did not affect the transcriptional regulation of these genes. Furthermore, given that H3K27me3 enrichment was dependent on Ras signaling, neither it nor transcriptional repression was maintained after inactivation of such signaling. Unexpectedly, we detected unannotated transcripts derived from intergenic regions at which the H3K27me3 level is regulated by Ras, with the changes in transcript abundance again preceding those in H3K27me3. Our results thus indicate that changes in H3K27me3 level in the gene body or in the region around the transcription start site are not a trigger for, but rather a consequence of, changes in transcriptional activity.
Introduction
Epigenetic modification of chromatin is a key mechanism for regulation of gene expression [1], [2]. Trimethylation of histone H3 at lysine-27 (H3K27) is associated with transcriptional repression and is regulated by Polycomb repressive complex 2 (PRC2), a histone methyltransferase specific for H3K27 [3]. This modification of H3K27 (H3K27me3) and Polycomb group proteins are thought to promote the formation of closed chromatin structures and thereby to repress transcription [4], [5]. H3K27me3 controls Hox gene silencing and X chromosome inactivation, and it is therefore essential for normal development [6], [7]. Dysregulation of H3K27me3 is also frequently observed in and is regarded as a hallmark of cancer, with global as well as site-specific increases or decreases in H3K27me3 levels having been detected in several tumor types [8]–[10].
Chromatin immunoprecipitation (ChIP) followed by deep sequencing (ChIP-seq) as well as chip-based ChIP have been applied to map precisely the distribution of H3K27me3 across the entire genome. These approaches have also been adopted to elucidate the relation between the distribution of H3K27me3 and transcriptional activity. Such studies have revealed at least two patterns of H3K27me3 enrichment associated with transcriptional repression: a focal enrichment around the transcription start site (TSS) and a broad enrichment encompassing the entire gene. H3K27me3 around the TSS frequently colocalizes with H3K4me3 and is associated with gene repression especially in undifferentiated cells [11], [12]. A broad enrichment of H3K27me3, also known as a blanket-type pattern or broad local enrichment (BLOC), has been detected over larger genomic regions including the TSS [13]–[17]. This pattern of modification has been associated not only with individual repressed genes but also with repressed gene clusters, and it is frequently observed in differentiated cells. Furthermore, both of these enrichment patterns are highly variable among cell types [18], [19], indicating that the distribution of H3K27me3 is regulated in a manner dependent on the cellular and developmental context.
The small GTPase Ras controls cell growth and survival in part through epigenetic modification including DNA methylation and histone modification. Ras regulates the activity of downstream signaling pathways including those mediated by mitogen-activated protein kinases (MAPKs) [20], [21]. The activating G12V amino acid substitution is one of the most frequent Ras mutations found in human cancer. Ras up-regulates the expression of p16Ink4a, an inhibitor of cyclin-dependent kinases, and this effect is accompanied by a marked decrease in the amount of H3K27me3 at the Ink4a locus in mouse embryonic fibroblasts [22]–[25]. Moreover, Ras-induced oncogenic transformation of mouse NIH 3T3 cells is associated with the down-regulation of Fas, Reck, and Par4 transcription concomitant with an increase in DNA methylation [26]–[28].
Most of the reported associations between H3K27me3 status and transcription are based on correlation. It has thus remained to be determined definitively whether changes in H3K27me3 distribution are causal with regard to regulation of transcription. To elucidate the biological relevance of H3K27me3, we have now investigated the time courses of Ras-induced changes in H3K27me3 level and in transcription at the genome-wide level in NIH 3T3 cells. Our results indicate that changes in H3K27me3 status follow, rather than precede, transcriptional changes induced by Ras signaling.
Results
H3K27me3 is an epigenetic modification regulated by Ras signaling
We established mouse NIH 3T3 cells that express a constitutively active mutant (G12V) of human H-Ras or that were infected with the corresponding empty retroviral vector (referred to hereafter as Ras cells and Vec cells, respectively). Expression of the Ras transgene resulted in increased phosphorylation of the MAPK isoforms Erk1 and Erk2 (Figure 1A) as well as in morphological transformation of the cells (Figure 1B). Moreover, reverse transcription (RT) and quantitative polymerase chain reaction (qPCR) analysis revealed that the Ras cells exhibited transcriptional repression of Fas locus genes including Fas, Acta2, and Stambpl1 (Figure 1C), consistent with previous observations [26], [28].

Fas is a cell surface receptor that mediates the induction of apoptosis by Fas ligand [29]. Although Ras signaling has been reported to increase the level of DNA methylation around the Fas locus [26], [28], we did not detect such an obvious effect (data not shown). To identify histone modifications that might contribute to silencing of the Fas locus, we performed ChIP-qPCR analysis with antibodies to transcriptionally repressive histone marks including H3K9me2, H3K9me3, and H3K27me3 (Figure 1D). Among these marks, only the amount of H3K27me3 was increased at the Fas locus of Ras cells. The H3K27me3-enriched region contained the entire Fas gene as well as the promoter of Acta2. These results thus showed that Ras signaling induces trimethylation of H3K27 as an epigenetic modification.
Identification of H3K27me3-enriched genomic regions associated with transcriptional silencing
To determine whether Ras-induced changes in H3K27me3 abundance are a trigger for or a consequence of changes in transcription, we set out to analyze the time courses of these events at the genome-wide level in NIH 3T3 cells infected with the retrovirus for H-Ras(G12V) at time 0. Transcript and H3K27me3 levels were measured by RNA-seq and ChIP-seq, respectively (detailed sequencing information is provided in Table S1). First, we identified regions of H3K27me3 enrichment associated with silent genes in cells before introduction of H-Ras(G12V) (Ras0 cells) (Figure 2A). H3K27me3 showed broad enrichment domains encompassing several hundred kilobases, consistent with previous observations [13], [15]. To characterize the pattern of H3K27me3 within genes, we divided each gene into the gene body, upstream region, and downstream region, with gene body being defined as the genomic region from the TSS to the transcription termination site (TTS). From a total of 23,232 RefSeq genes, we randomly selected 2000 genes and ordered them according to similarity in the pattern of H3K27me3 enrichment (Figure 2B). This analysis revealed that the pattern of H3K27me3 enrichment fell into three distinct clusters (designated brown, gray, and purple clusters). In the gray cluster, H3K27me3 covered the gene body as well as the region around the TSS. This cluster contained a high proportion of transcriptionally repressed genes, as represented by the bluish color in the FPKM (fragments per kilobase of exon model per million mapped fragments) column. This finding was confirmed by a different method examining all RefSeq genes, as detailed below. We next focused on the H3K27me3 signal in the gene body or in the region around the TSS of each gene (Figure 2C). RefSeq genes were classified into five groups according to their expression level. In the groups containing repressed genes (FPKM of 0 or 0–1), H3K27me3 was localized to the gene body as well as to the region around the TSS (Figure 2D). In contrast, in the groups containing expressed genes (FPKM of 1–10, 10–100, or >100), H3K27me3 was present at a low level in the gene body and in the nucleosome-free region around the TSS. The mean H3K27me3 signals in the gene body and in the region around the TSS of each gene also reflected the transcriptional status of the corresponding genes (Figure 2E). These data indicated that enrichment of H3K27me3 in the gene body as well as in the region around the TSS reflects silenced transcription.

Comprehensive analysis of Ras-induced changes in transcription and H3K27me3 content
We next identified genes whose transcription and H3K27me3 level are both regulated by Ras. We calculated the fold change in mean H3K27me3 level over the gene body for individual genes in cells infected with the Ras retroviral vector for 2, 4, 7, or 12 days relative to that in Ras0 cells. Among a total of 23,232 RefSeq genes, 1027 genes showed at least a twofold change in H3K27me3 level at least one time point (Figure 3A). A total of 933 genes showed a significant change in expression level at at least one time point after Ras introduction (see Materials and Methods). We then subjected the 115 genes whose H3K27me3 level and expression were both regulated by Ras to hierarchical clustering based on the time course of the change in H3K27me3 abundance (Figure 3B). This analysis revealed three distinct patterns of H3K27me3 dynamics induced by Ras: A purple cluster of genes in which the H3K27me3 level increased after Ras activation, and gray and brown clusters in which the H3K27me3 level decreased. Whereas changes in H3K27me3 abundance in the brown cluster were not associated with a characteristic transcriptional trend, those in the purple and gray clusters were inversely correlated with changes in transcription (Figure 3B, Figure S1A and S1B). Moreover, in these transcription-correlated clusters, changes in transcription were apparent within 2 days after Ras activation, whereas the mean H3K27me3 level remained essentially unchanged at this time point (Figure 3C). We calculated “t-half” to evaluate the timing of these two events (Figure S1C). In the purple cluster, the median t-half for mRNA abundance occurred at 1.1 days and that for H3K27me3 level occurred at 6.9 days (Figure 3D). In the gray cluster, the median t-half for mRNA abundance occurred at 3.3 days and that for H3K27me3 level occurred at 4.8 days. These results thus indicated that changes in transcription precede those in H3K27me3 level in the gene body.

We performed a similar analysis for the 196 genes whose H3K27me3 level in the region around the TSS and expression were both regulated by Ras (Figure S2). Similar to the case for H3K27me3 in the gene body, increases in H3K27me3 level in the region around the TSS occurred after decreases in transcription. Together, our genome-wide comprehensive analyses thus revealed that Ras signaling affects transcription before it affects mean H3K27me3 level both in the gene body and in the region around the TSS.
Characterization of genes whose H3K27me3 level is altered after transcriptional changes induced by Ras signaling
We selected three gene loci—Itgb5, Adcy7, and Smad6—for further study to confirm the results of our genome-wide RNA-seq and ChIP-seq analyses. Itgb5 and Adcy7 manifested Ras-induced changes in H3K27me3 level in the gene body (Figure 4A). The time courses of the ChIP-seq and RNA-seq data showed that Ras signaling initially affected transcription and then gradually changed the H3K27me3 content of the gene body for Itgb5 and Adcy7 (Figure 4B) as well as for four additional genes, Plekha4, Ephx1, Bpifc, and Sorcs2 (Figure S3). In the case of Smad6, the H3K27me3 level increased prominently in the region around the TSS but only slightly in the gene body as previously reported (Figure 4A) [30]. Ras signaling again affected transcription first and then gradually changing H3K27me3 content (Figure 4B). In addition to Smad6, we found other genes that showed a prominent increase in H3K27me3 level in the region around the TSS by visual inspection of the genome browser (data not shown). These results for Itgb5, Adcy7, and Smad6 were confirmed by RT-qPCR and ChIP-qPCR analyses (Figure 4C). We also confirmed that changes in gene expression precede those in H3K27me3 level with the use of NIH 3T3 cells that stably express Raf-ER, a fusion protein composed of the catalytic domain of Raf-1 and the ligand binding domain of the estrogen receptor. Treatment of these cells with 4-hydroxytamoxifen (4HT) activates Raf-ER and downstream MAPK pathways [31]. Activation of Raf-ER thus also affected mRNA abundance before H3K27me3 level for Itgb5, Adcy7, and Smad6 (Figure 4D) as well as for four additional genes, Plekha4, Ephx1, Bpifc, and Sorcs2 (Figure S7A).

We also evaluated the Ras-induced changes in transcription and H3K27me3 level in the gene body for Itgb5 and Adcy7 by independent deep sequencing and qPCR with several primer sets (Figure S4), again confirming our results. Total histone H3 level in the gene body of Itgb5 or Adcy7 was affected only slightly by Ras signaling (Figure S4D and S4H). The altered H3K27me3 content of the gene body was thus likely due to a change in H3K27 trimethylation, not to a change in nucleosome density. In addition to H3K27me3, we also examined H3K9me2 and H3K9me3 levels (Figure S5). Among these repressive histone marks, only H3K27me3 was markedly altered by Ras signaling. Together, these data suggested that our genome-wide analyses correctly identified genes that undergo changes in transcription and H3K27me3 level in response to Ras signaling, and they confirmed that the changes in transcription precede those in H3K27me3 level.
Changes in H3K27me3 level are a consequence of those in Ras-induced transcription
Our results suggested that a change in the amount of H3K27me3 is not required for Ras-induced regulation of gene transcription. To verify this hypothesis, we prepared NIH 3T3–Raf-ER cells depleted of H3K27me3 by transfection with small interfering RNAs (siRNAs) for Suz12, a subunit of PRC2 that is indispensable for methyltransferase activity at H3K27 [32]. The cells were transfected with Suz12 siRNA for 48 h before exposure to 4HT for 24 h (Figure 5A), and they were then analyzed for effects on H3K27me3 and transcription. Immunoblot and ChIP-qPCR analyses revealed that knockdown of Suz12 resulted in depletion of H3K27me3 in the total chromatin fraction (Figure 5B) as well as at specific regions such as Itgb5, Adcy7, and Smad6 loci (Figure 5C, Figure S6A–S6C). Depletion of H3K27me3 did not affect the 4HT-induced repression of Itgb5 and Smad6 expression (Figure 5D), indicating that an increase in the level of H3K27me3 is not required for Ras-induced transcriptional silencing of these genes. Furthermore, H3K27me3 depletion did not induce expression of Adcy7 in the absence of 4HT (Figure 5D), indicating that depletion of H3K27me3 is not sufficient to induce transcriptional activation. We obtained similar results with two additional Suz12 siRNAs (Figure S6D–S6F) and four additional genes, Plekha4, Ephx1, Bpifc, and Sorcs2 (Figure S7).
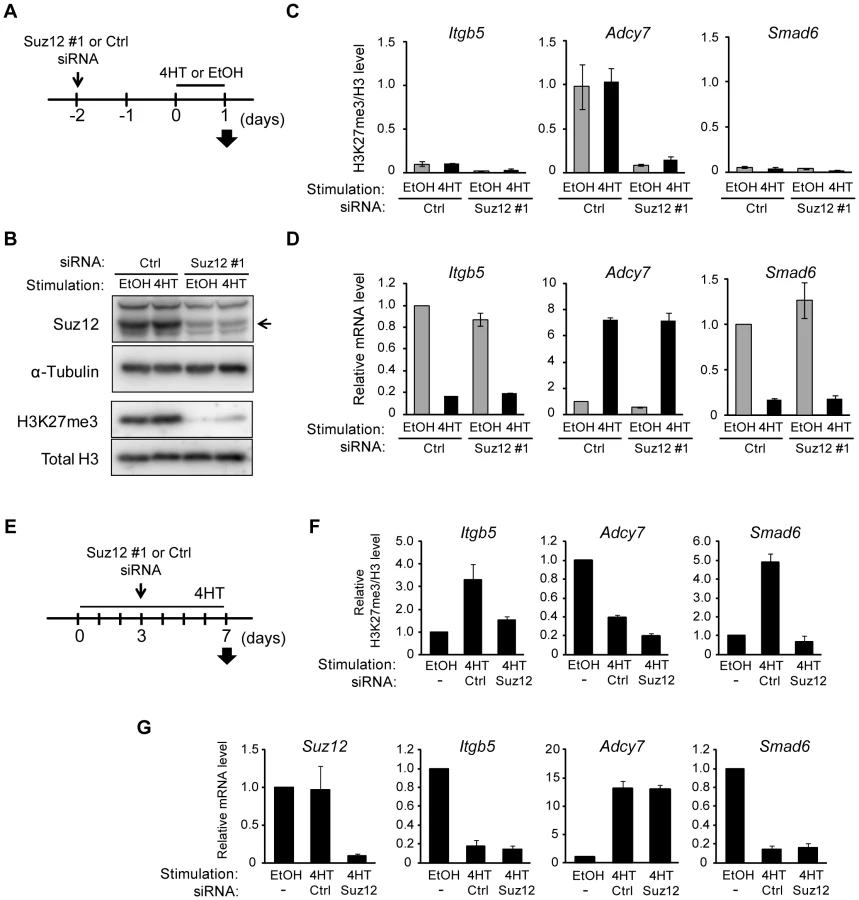
We also examined the effect of H3K27me3 depletion after the activation of Raf signaling by transfecting NIH 3T3–Raf-ER cells with Suz12 siRNA 3 days after exposure to 4HT (Figure 5E and 5G). Analysis of the cells at 7 days after the onset of Raf activation revealed that Suz12 siRNA efficiently suppressed the increase in H3K27me3 level at Itgb5 and Smad6 (Figure 5F). Nevertheless, this effect did not induce expression of Itgb5 and Smad6 (Figure 5G), indicating that depletion of H3K27me3 does not affect transcriptional suppression of Itgb5 and Smad6 by Ras signaling. These data suggested that changes in H3K27me3 abundance do not play a critical role in the induction of gene silencing at later stages of Ras activation.
Together, our observations indicated that a change in the level of H3K27me3 induced by Ras is not a trigger for, but rather a consequence of, a change in transcription.
Accumulation of H3K27me3 is dependent on Ras signaling and reversible
The presence of H3K27me3 at an exogenous transgene was previously shown to maintain the repressed state [33], suggesting the possibility that an increase in H3K27me3 level induced by Ras signaling might be able to maintain repression of gene expression after signaling is inactivated. To test this possibility, we introduced ER-Ras [a fusion protein of human H-Ras(G12V) and the estrogen receptor] into NIH 3T3 cells, exposed the cells to 4HT for 9 days in order to induce changes in both H3K27me3 level and transcription, and then removed 4HT to inactivate Ras signaling (Figure 6A). Immunoblot analysis revealed that ER-Ras was induced by 4HT and that its abundance decreased rapidly after removal of 4HT (Figure 6B), the latter indicative of inactivation of the Ras signal. Changes in the transcription of Itgb5, Adcy7, and Smad6 were also apparent after exposure of the cells to 4HT for 9 days, whereas these changes were completely reversed after 4HT removal (Figure 6C). Moreover, an increase in H3K27me3 content at Itgb5 and Smad6 was observed in the presence of 4HT, whereas H3K27me3 abundance at these genes returned essentially to basal levels after signal inactivation (Figure 6D). The H3K27me3 level at Adcy7 was reduced by exposure of the cells to 4HT and remained low after 4HT removal, suggesting that the dynamics of H3K27 methylation and demethylation might differ. We obtained similar results with four additional genes—Plekha4, Ephx1, Bpifc, and Sorcs2 (Figure S8)—as well as with cells expressing Raf-ER (Figure 6E–6G). From these data, we concluded that changes in H3K27me3 level are dependent on Ras signaling, and that H3K27me3 enrichment is not maintained after inactivation of such signaling, resulting in reactivation of transcription.

Changes in H3K27me3 content in intergenic regions predict the presence of unannotated transcripts
Visual inspection of H3K27me3 distribution revealed that Ras signaling alters H3K27me3 levels in intergenic regions located several kilobases distant from known gene bodies. Two representative loci, Col1a1 and Mink1, are shown in Figure 7A. H3K27me3 was enriched in the region upstream of Col1a1 but was depleted in the region upstream of Mink1 in Ras cells.

Given that changes in H3K27me3 level were frequently observed in the transcribed region of genes such as Itgb5 and Adcy7, we examined whether unannotated transcripts might be produced from the regions upstream of Col1a1 and Mink1. We reanalyzed RNA-seq data obtained by SOLiD sequencing, which contain strand information (see Materials and Methods), and we indeed detected sequence reads for these regions, suggesting the existence of corresponding transcripts (Figure 7A). RT-qPCR analysis confirmed the presence of transcripts derived from the regions upstream of Col1a1 and Mink1 (hereafter referred to as uCol1a1 and uMink1, respectively) (Figure 7B). Ras signaling repressed uCol1a1 expression and activated uMink1 expression, similar to its effects on Col1a1 and Mink1 mRNA levels (Figure 7A). These results thus revealed that changes in the H3K27me3 content of intergenic regions can predict the presence of unannotated transcripts.
To determine whether the changes in uCol1a1 and uMink1 transcription also precede those in H3K27me3 level, we examined the respective time courses with cells expressing Raf-ER (Figure 7C). The expression of uCol1a1 and uMink1 was altered already at 1 day after exposure of the cells to 4HT, whereas H3K27me3 level remained essentially unaffected at this time. The level of H3K27me3 changed at 5 days (uCol1a1) or 3 days (uMink1) after 4HT exposure. We obtained similar results for transcripts derived from another intergenic region, uIl33 (Figure S9). Ras-induced transcription from intergenic regions thus also occurs prior to changes in H3K27me3 level.
To examine whether H3K27me3 is required for regulation of uCol1a1 and uMink1 transcription, we determined the effect of Suz12 knockdown with siRNAs. Depletion of H3K27me3 did not affect the 4HT-induced silencing of uCol1a1, nor did it induce uMink1 expression in the absence of 4HT (Figure 7D). Together, these results suggested that the observed changes in H3K27me3 level in transcribed regions result from changes in transcription.
Discussion
Many genome-wide analyses have claimed that H3K27me3 is an indicator of transcription in diverse cell lines [34], [35]. However, the lack of information about the dynamics of histone modification has left it unclear whether the level of H3K27me3 actually regulates transcriptional activity.
We have now performed RNA-seq and H3K27me3 ChIP-seq in cells at various times after the onset of expression of a constitutively active form of Ras. For RefSeq genes, we found that a Ras-induced change in transcriptional activity was inversely correlated with a change in H3K27me3 level at the gene body and in the region around the TSS. However, genome-wide analysis of the time courses of the changes in H3K27me3 abundance and transcription revealed that Ras-induced changes in transcription occurred before those in H3K27me3 level. This finding was confirmed by qPCR analysis. Furthermore, depletion of H3K27me3 with the use of siRNAs targeted to PRC2 did not affect Ras-induced transcriptional changes. We therefore conclude that Ras-induced changes in H3K27me3 level are not a trigger for, but rather a consequence of, changes in transcription.
We also found that intergenic regions that show a change in H3K27me3 content in response to Ras signaling generate unannotated transcripts. Again, this transcription preceded the change in H3K27me3 level.
Comprehensive analysis based on the mean H3K27me3 level in defined regions
H3K27me3 has been found to manifest at least two distinct enrichment patterns—being abundant in narrow regions around the TSS and in broad domains that include entire genes—and the appearance rate of these patterns differs among cell types [18]. We have now analyzed these patterns in control NIH 3T3 (Ras0) cells. For a simple comparison of H3K27me3 level with transcription in cells at various times after the onset of Ras expression, we used the mean value of H3K27me3 level in a defined region such as the gene body or the region around (±2.5 kb) the TSS to represent the H3K27me3 status of each gene (Figure 2C). We found that enrichment of H3K27me3 not only in the region around the TSS but also in the gene body correlated inversely with transcriptional level in these cells, consistent with previous observations [18]. Comparison of the time courses of mean H3K27me3 level and transcription allowed us to identify genes for which H3K27me3 content changes together with transcriptional activity in response to Ras signaling, suggesting that the mean value of H3K27me3 level in the defined regions provides an indication of H3K27me3 status of individual genes under different cellular conditions.
We noticed by visual inspection the existence of several patterns of H3K27me3 modification within the defined regions. Although the use of mean values of H3K27me3 level disregarded these patterns, we conclude that such mean values provide a relatively simple measure for comparison of H3K27me3 status with transcriptional activity. For example, Itgb5 manifested a typical broad increase in H3K27me3 level, whereas Adcy7 showed two discontinuous regions of H3K27me3 enrichment in the gene body that were depleted in parallel in response to Ras signaling, and Smad6 exhibited a prominent increase in H3K27me3 around the TSS (Figure 4A). Although various internal patterns of H3K27me3 were observed, however, visual inspection revealed that the time courses of H3K27me3 level at each position in the defined regions were similar to those for the mean value (Figure 4A and 4B), indicating that changes in mean H3K27me3 level in the defined regions also represent changes in H3K27me3 status of genes despite differences in the internal patterns within the defined regions. Our approach based on mean H3K27me3 level in defined regions thus allows evaluation of the timing of changes in H3K27me3 abundance relative to those in transcription, and it leads us to the conclusion that Ras-induced changes in H3K27me3 level occur after those in transcription.
Our H3K27me3 ChIP-seq data contain time course information as well as higher positional resolution compared with previously published H3K27me3 ChIP-seq results [11], [15], [30]. Our data are thus amenable to analysis of other aspects of H3K27 trimethylation. For example, temporal analysis of H3K27me3 distribution at base-pair resolution might allow the unveiling of Polycomb response elements (PREs), for which little information is currently available in mammal [36]–[38].
Causal relation between transcription and H3K27me3 status
Our results show that the Ras signaling–induced changes in transcription precede those in H3K27me3 level. Previous studies have also shown that transcriptional regulation is initiated before changes in H3K27me3 content [39]–[41]. We further revealed that an increase in H3K27me3 level induced by Ras is insufficient for maintenance of transcriptional repression after inactivation of Ras signaling. Such increases in H3K27me3 level induced by Ras signaling were thus found to be completely reversed after signal inactivation. Similar reversibility of changes in H3K27me3 level has been described for the FLC gene in Arabidopsis [41], for which transcription and H3K27me3 content are regulated by signaling that is responsive to changes in temperature. It is thus possible that a signal-induced increase in H3K27me3 abundance is dispensable for both initiation and maintenance of transcriptional repression in various cell types and different species.
On the other hand, H3K27me3 has been reported to contribute to maintenance of transcriptional suppression in other experimental systems [33], [42]. The combination of H3K27me3 with other epigenetic marks has also been found to be related to transcriptional repression [6], suggesting the possibility that Ras might regulate only H3K27me3, and not other histone marks required for maintenance of gene silencing. One such possible histone modification is ubiquitylation of histone H2A at lysine-119 [43]. H3K27me3 recruits PRC1, which functions as a ubiquitin ligase for this residue of H2A. Ubiquitylation of H2A by PRC1 results in repression of transcription by blocking the release of RNA polymerase II from promoters [44]. Not all genomic regions that show H3K27me3 enrichment colocalize with ubiquitylated H2A (H2Aub) or PRC1 [45], [46], however, suggesting that both H3K27me3 and H2Aub may be required for maintenance of gene silencing. Given that Ras-induced changes in H3K27me3 level are a consequence of those in transcription, Ras might influence H3K27me3 content without affecting H2Aub level. Further analysis of H2Aub level during Ras activation may provide insight into the function of H3K27me3.
The mechanism of changes in H3K27me3 level and transcription induced by Ras signaling
The mechanism by which Ras signaling regulates H3K27me3 level in NIH 3T3 cells remains unclear. Changes in histone modification are mediated by changes in the expression or localization of the corresponding enzymes [47]. Changes in the expression level of enzymes have thus been found to be responsible for changes in H3K27me3 level in response to Ras signaling [24], [25]. We found that the expression of genes encoding subunits of PRC2 or PRC1 was not altered by Ras activation in NIH 3T3 cells, however (Figure S10A and S10B). Of genes for two known demethylases, the expression of only Jmjd3 was found to be up-regulated by Ras signaling, consistent with previous observations [24], [25]. However, knockdown of Jmjd3 expression did not affect the expression of Adcy7 in the absence or presence of Ras signaling (Figure S10C), suggesting that the change in Jmjd3 expression level is not required for Ras-induced changes in transcription.
Phosphorylation of several sites of Ezh2 by various kinases has been shown to alter the localization of PRC2 [48], [49]. Moreover, Msk1 and Msk2, which are downstream kinases of Ras phosphorylate serine-28 of histone H3 (a residue adjacent to K27) and this phosphorylation prevents PRC2 from recognizing H3K27 and results in passive H3K27me3 demethylation during subsequent progression of the cell cycle [50], [51]. Such phosphorylation might contribute to the regulation of H3K27me3 level by Ras in our system. It is also possible that RNA polymerase II actively erases H3K27me3 by recruiting an H3K27me3 demethylase to the transcribed region, as previously proposed [39]. In support of this idea, we found that the demethylated regions partially coincide with the gene body, along which RNA polymerase II moves. Moreover, we detected unannotated transcripts derived from intergenic regions whose H3K27me3 level is regulated by Ras. These findings indicate that transcription might trigger H3K27me3 regulation and determine the localization of H3K27me3 demethylases. Detailed analysis of H3 modification and the localization of these enzymes may provide insight into the mechanisms determining the specificity of genomic regions subject to changes in H3K27me3 level.
We have found that Ras-induced changes in transcription precede those in H3K27me3 level, suggesting that transcriptional regulation by Ras is initiated by a mechanism independent of H3K27me3. We also performed ChIP-qPCR analysis of active histone modifications and observed changes in acetylation of H3 that were coincident with initiation of transcriptional changes at 2 days after Ras induction (data not shown). Removal of active histone marks by Ras is thus a possible mechanism for Ras-mediated gene silencing. In this case, the repressive H3K27me3 mark might be deposited passively on repressed genes as a result of the loss of acetylation. Further genome-wide and time course analyses of histone acetylation are required to examine this possibility.
Materials and Methods
Cells, culture conditions, retrovirus infection, and 4HT treatment
NIH 3T3 cells were obtained from American Type Culture Collection (CRL-1658) and were cultured in Dulbecco's modified Eagle's medium supplemented with 10% fetal bovine serum, 1% penicillin-streptomycin, 2 mM l-glutamine, 1% MEM–non essential amino acids, and 1% sodium pyruvate (all from Life Technologies, Foster City, CA).
Complementary DNAs encoding human H-Ras(G12V) or a fusion protein of human Raf-1 and the estrogen receptor (Raf-ER) were subcloned into the retroviral vector pMX-puro [52]. A pLNCX2 vector encoding a fusion protein of the estrogen receptor and human H-Ras(G12V) (ER-Ras) was kindly provided by M. Narita [53]. These vectors were introduced into Plat-E packaging cells by transfection with use of the FuGENE6 reagent (Promega, Madison, WI). Culture supernatants containing recombinant ecotropic retroviruses were harvested for infection of proliferating NIH 3T3 cells in the presence of polybrene. The infected cells were then subjected to selection in medium containing puromycin for pMX-puro or G418 for pLNCX2. Activation of Raf-ER or ER-Ras was induced by exposure of cells to 10 or 100 nM 4HT (Sigma, St. Louis, MO), respectively, that had been dissolved in ethanol; the medium supplemented with 4HT was refreshed every day.
RNA interference
Cells were transfected with Suz12, Bmi1, Jmjd3, or control Stealth RNAi duplexes (Life Technologies) with the use of a Neon Transfection System (Life Technologies). The Suz12 siRNA sequences are 5′-UAAAUUCUCUUCUUCCUGGACGAGU-3′, 5′-UUUGAUUGAGGUCAGGAUUCAAAGG-3′, and 5′-UAUCGUUGGUUUCUCCUGUCCAUCG-3′ for #1, #2, and #3, respectively. The Bmi1 siRNA sequence is 5′-CGUCAUGUAUGAAGAGGAACCUUUA-3′, and the Jmjd3 siRNA sequence is 5′-GGAUGACCUCUAUGCGUCCAAUAUU-3′.
Immunoblot analysis
Cells were lysed in a solution containing 50 mM Tris-HCl (pH 7.6), 300 mM NaCl, 0.5% Triton X-100, aprotinin (10 µg/ml), leupeptin (10 µg/ml), 1 mM phenylmethylsulfonyl fluoride, 400 µM Na3VO4, 400 µM EDTA, 10 mM NaF, and 10 mM sodium pyrophosphate. The lysate was centrifuged at 20,000× g for 10 min at 4°C, and the resulting supernatant was isolated as a cytosolic fraction. The pellet was resuspended in lysis solution for use as a chromatin fraction. Proteins in each fraction were resolved by SDS-polyacrylamide gel electrophoresis and transferred to a polyvinylidene difluoride membrane (Millipore, Billerica, MA). Immunoblot analysis was performed with antibodies to H-Ras (sc-520; Santa Cruz Biotechnology, Santa Cruz, CA), to Erk1/2 (9102; Cell Signaling Technology, Beverly, MA), to phosphorylated Erk1/2 (9101; Cell Signaling Technology), to Suz12 (ab12073; Abcam, Cambridge, MA), to α-tubulin (T5168; Sigma), to H3K27me3 (07-449; Millipore), and to histone H3 (ab1791; Abcam). Immune complexes were detected with horseradish peroxidase–conjugated secondary antibodies and Super Signal West Dura Luminol/Enhancer Solution (Thermo Scientific, Rockford, IL). The chemiluminescence signals were quantitated with a digital imaging system (VersaDoc; Bio-Rad, Hercules, CA).
RT-qPCR analysis
Total RNA was isolated from cells and purified with the use of an SV Total RNA Isolation System (Promega). It was then subjected to RT with the use of a PrimeScript RT reagent kit (Takara Bio, Shiga, Japan) followed by real-time PCR analysis with a StepOnePlus Real Time PCR System (Life Technologies) and Fast SYBR Green Master Mix (Life Technologies). Data were analyzed according to the 2−ΔΔCt method and were normalized by the amount of acidic ribosomal phosphoprotein P0 (Arbp) mRNA. The sequences and gene information of PCR primers are listed in Table S2.
ChIP analysis
Cells were fixed with 0.6 or 1.0% formaldehyde for 10 or 5 min, respectively, at room temperature, after which glycine was added to the medium. The cells were then lysed and stored at −80°C until analysis. The lysates were thawed and subjected to ultrasonic treatment with the use of a Bioruptor (Diagenode, Denville, NJ) or Covaris S2 (Covaris, Woburn, MA) instrument in order to obtain chromatin fragments of 200 to 700 bp.
Antibodies to H3K27me3 (07-449; Millipore), to H3K9me2 (ab1220; Abcam), to H3K9me3 (ab8898; Abcam), or to H3 (ab1791; Abcam), or normal mouse (sc2025; Santa Cruz Biotechnology) or rabbit (sc2027; Santa Cruz Biotechnology) immunoglobulin G, were incubated with Protein A Dynabeads or Protein G Dynabeads (Life Technologies) to allow formation of bead-antibody complexes. Chromatin fragments were then subjected to immunoprecipitation with the bead-antibody complexes, after which the beads were washed and immunoprecipitated chromatin fragments were eluted and treated with RNase A and proteinase K. DNA was extracted from the samples with phenol-chloroform and was then precipitated with ethanol and dissolved in TE buffer.
Quantitative PCR analysis of ChIP DNA was performed as described above. Primer sequences and positions are listed in Table S3. Data were analyzed according to the 2−(Ct of IP sample – Ct of input sample) method and are presented as a percentage of input.
ChIP-seq and RNA-seq
For comprehensive analysis of Ras-dependent changes in gene expression and H3K27me content, we performed RNA-seq and ChIP-seq analyses at various times after Ras induction. We sampled cells at 0, 2, 4, 7, and 12 days after infection with the H-Ras(G12V) retroviral vector. We sequenced five and six samples for analysis of gene expression and H3K27me3, respectively. ChIP-seq libraries were prepared from ∼40 ng each of ChIP and input DNA with the use of a TruSeq DNA LT Sample Prep Kit (Illumina, San Diego, CA). RNA-seq libraries were prepared from 2 µg of total RNA with the use of a TruSeq RNA Sample Prep Kit v2 (Illumina). Two flow cells (16 lanes) of an Illumina HiSeq 2000 instrument were used. Libraries were clonally amplified in a flow cell and sequenced with the use of HiSeq Control Software 1.5 (Illumina) and a 48-nucleotide paired-end sequence. Image analysis and base calling were performed with the use of Real Time Analysis (RTA) 1.13 software. A total of 81,877,304 (RNA-seq) or 1,068,022,370 (ChIP-seq) reads was obtained per sample.
For SOLiD sequencing, ChIP-seq libraries were prepared from 20 ng each of ChIP and input samples with the use of a SOLiD Fragment Library Construction Kit with SizeSelect Gels (Life Technologies). For RNA-seq, total RNA (10 µg) was subjected to rRNA depletion (RiboMinus Eukaryote Kit for RNA-seq, Life Technologies) and RNA-seq library construction (SOLiD Whole Transcriptome Analysis Kit, Life Technologies). The libraries were clonally amplified on SOLiD P1 DNA Beads by emulsion PCR and sequenced with the SOLiD3Plus System (Life Technologies) to generate 50-base single-end reads.
Sequencing data of ChIP-seq and RNA-seq are available under the accession number of DRA001075 from DNA Data Bank of Japan Sequence Read Archive (DRA).
Illumina sequence data analysis
FastQC (http://www.bioinformatics.babraham.ac.uk/projects/fastqc) analysis revealed low sequence quality for the last 4 bases of the second read of paired-end reads, and so these bases were trimmed before data analysis. For the sequence data analysis, UCSC mm9 and RefSeq were used as the reference mouse genome and gene model, respectively.
For gene expression analysis, paired-end reads were mapped to the mouse genome with the use of TopHat (ver. 2.0.8) [54]. Cufflinks (ver. 2.0.10) [55] was used to estimate gene expression level on the basis of fragments per kilobase of exon model per million mapped fragments (FPKM). Gene expression level was compared between control (Ras0) cells and Ras cells at 2, 4, 7, or 12 days after activation of Ras signaling with the use of Cuffdiff (ver. 2.0.10). A Q-value of <0.05 was set as a threshold for differential expression, resulting in the extraction of 933 genes as differentially expressed genes.
For H3K27me3 analysis, sequenced reads were mapped to the mouse genome with the use of bwa (ver. 0.5.9) [56]. Paired reads that were uniquely mapped to the genome were extracted. This filtering process discarded 174,644,447 (16.72%) reads per sample, and the remaining 870,116,495 (83.28%) reads were used for subsequent analyses. The sequence depth of our ChIP-seq data set was 40 (including insert), with 90% of bases in the genome being covered by at least one read. As far as we are aware, this is one of the most deeply sequenced histone modification marks to date.
For the purposes of our study, we defined the gene body as the genomic region from the TSS to the TTS. Introns are thus included in the gene body as well as exons. To compare methylation signals associated with genes of different sizes, we calculated the relative position of bins in the gene body as follows:

To examine the methylation pattern across the gene body and adjacent regions, we randomly selected 2000 out of 23,232 RefSeq genes. The methylation signal of each selected gene was normalized so that the mean and standard deviation of the signal were equal to 0 and 1, respectively. A hierarchical clustering was performed according to the normalized methylation signal, and the results were visualized as a heat map in which the intensity of the methylation signal was color coded. Gene expression level was also displayed in the heat map (Figure 2B).
The relation between methylation and gene expression was investigated by comparison of the average methylation signal and FPKM. For this purpose, the average methylation signal in the gene body and in the region around the TSS (defined here as the region from −2.5 to +2.5 kb relative to the TSS) was calculated for each gene at all time points. Gene expression level was categorized into five classes including unexpressed genes (FPKM = 0), and the distribution of the methylation signal in each class is presented as a box-and-whisker plot (Figure 2E).
The average methylation signal in control (Ras0) cells compared with cells at various times after infection with the H-Ras(G12V) retroviral vector as well as the fold change in the methylation signal were calculated. If the latter fold change was ≥2, then the gene was extracted as a differentially methylated gene. A total of 1027 genes (gene body) or 1230 genes (region around the TSS) fulfilled this criterion, and these genes were further examined by comparison with differentially expressed genes. To examine changes in methylation over time, we performed a hierarchical clustering according to average methylation signal as described above (Figure 3B, Figure S2B).
To examine whether gene expression might be causally related to a change in H3K27me3 level, we defined and calculated “t-half” as shown in Figure S1C. Two such values were calculated for each gene, one for gene expression and the other for H3K27me3 level.
SOLiD sequence data analysis
We obtained 130,133,653, 150,914,422, 226,490,377, and 250,941,002 reads from control (Vec) and Ras cells for RNA-seq and from Vec and Ras cells for ChIP-seq, respectively. Sequenced reads were mapped to the mouse genome with the use of the BioScope Map Data program (ver. 1.2). The following analyses were based on the mapping results. Gene expression level was estimated by calculating reads per kilobase of exon model per million mapped reads (RPKM) [57]. Overall gene expression level in Vec and Ras cells was normalized by the expression level of Arbp. To calculate the amount of H3K27me3, we split the mouse genome into 1-kb bins and used the number of reads in each bin as the raw methylation signal. This raw signal was normalized as Vec and Ras cells have the same number of reads and was then smoothed with the lowess function. Obtained signals were converted into wiggle (WIG) format and uploaded to the UCSC Genome Browser for visualization.
Detection of novel transcripts
To identify putative novel transcripts, we mapped sequenced reads to the mouse genome with the use of TopHat (ver. 1.3.3). Given that our SOLiD sequence data included strand information, mapped reads on the Watson and Crick strand were analyzed separately. The number of mapped reads at each genome coordinate was converted to bigWig format and uploaded to the UCSC Genome Browser. Those regions that did not overlap with a RefSeq gene and showed a difference in expression level between Vec and Ras cells were manually inspected.
Supporting Information
Zdroje
1. StrahlBD, AllisCD (2000) The language of covalent histone modifications. Nature 403 : 41–45.
2. LiB, CareyM, WorkmanJL (2007) The role of chromatin during transcription. Cell 128 : 707–719.
3. CaoR, WangL, WangH, XiaL, Erdjument-BromageH, et al. (2002) Role of histone H3 lysine 27 methylation in Polycomb-group silencing. Science 298 : 1039–1043.
4. FrancisNJ, KingstonRE, WoodcockCL (2004) Chromatin compaction by a polycomb group protein complex. Science 306 : 1574–1577.
5. EskelandR, LeebM, GrimesGR, KressC, BoyleS, et al. (2010) Ring1B compacts chromatin structure and represses gene expression independent of histone ubiquitination. Mol Cell 38 : 452–464.
6. SparmannA, van LohuizenM (2006) Polycomb silencers control cell fate, development and cancer. Nat Rev Cancer 6 : 846–856.
7. SimonJA, KingstonRE (2009) Mechanisms of polycomb gene silencing: knowns and unknowns. Nat Rev Mol Cell Biol 10 : 697–708.
8. KondoY, ShenL, ChengAS, AhmedS, BoumberY, et al. (2008) Gene silencing in cancer by histone H3 lysine 27 trimethylation independent of promoter DNA methylation. Nat Genet 40 : 741–750.
9. KeXS, QuY, RostadK, LiWC, LinB, et al. (2009) Genome-wide profiling of histone h3 lysine 4 and lysine 27 trimethylation reveals an epigenetic signature in prostate carcinogenesis. PLoS One 4: e4687.
10. McCabeMT, GravesAP, GanjiG, DiazE, HalseyWS, et al. (2012) Mutation of A677 in histone methyltransferase EZH2 in human B-cell lymphoma promotes hypertrimethylation of histone H3 on lysine 27 (H3K27). Proc Natl Acad Sci U S A 109 : 2989–2994.
11. BernsteinBE, MikkelsenTS, XieX, KamalM, HuebertDJ, et al. (2006) A bivalent chromatin structure marks key developmental genes in embryonic stem cells. Cell 125 : 315–326.
12. MikkelsenTS, KuM, JaffeDB, IssacB, LiebermanE, et al. (2007) Genome-wide maps of chromatin state in pluripotent and lineage-committed cells. Nature 448 : 553–560.
13. BrackenAP, DietrichN, PasiniD, HansenKH, HelinK (2006) Genome-wide mapping of Polycomb target genes unravels their roles in cell fate transitions. Genes Dev 20 : 1123–1136.
14. ZhangX, ClarenzO, CokusS, BernatavichuteYV, PellegriniM, et al. (2007) Whole-genome analysis of histone H3 lysine 27 trimethylation in Arabidopsis. PLoS Biol 5: e129.
15. PaulerFM, SloaneMA, HuangR, ReghaK, KoernerMV, et al. (2009) H3K27me3 forms BLOCs over silent genes and intergenic regions and specifies a histone banding pattern on a mouse autosomal chromosome. Genome Res 19 : 221–233.
16. HawkinsRD, HonGC, LeeLK, NgoQ, ListerR, et al. (2010) Distinct epigenomic landscapes of pluripotent and lineage-committed human cells. Cell Stem Cell 6 : 479–491.
17. BrinkmanAB, GuH, BartelsSJ, ZhangY, MatareseF, et al. (2012) Sequential ChIP-bisulfite sequencing enables direct genome-scale investigation of chromatin and DNA methylation cross-talk. Genome Res 22 : 1128–1138.
18. YoungMD, WillsonTA, WakefieldMJ, TrounsonE, HiltonDJ, et al. (2011) ChIP-seq analysis reveals distinct H3K27me3 profiles that correlate with transcriptional activity. Nucleic Acids Res 39 : 7415–7427.
19. ZhuJ, AdliM, ZouJY, VerstappenG, CoyneM, et al. (2013) Genome-wide chromatin state transitions associated with developmental and environmental cues. Cell 152 : 642–654.
20. SchubbertS, ShannonK, BollagG (2007) Hyperactive Ras in developmental disorders and cancer. Nat Rev Cancer 7 : 295–308.
21. KarnoubAE, WeinbergRA (2008) Ras oncogenes: split personalities. Nat Rev Mol Cell Biol 9 : 517–531.
22. KotakeY, CaoR, ViatourP, SageJ, ZhangY, et al. (2007) pRB family proteins are required for H3K27 trimethylation and Polycomb repression complexes binding to and silencing p16INK4alpha tumor suppressor gene. Genes Dev 21 : 49–54.
23. BrackenAP, Kleine-KohlbrecherD, DietrichN, PasiniD, GargiuloG, et al. (2007) The Polycomb group proteins bind throughout the INK4A-ARF locus and are disassociated in senescent cells. Genes Dev 21 : 525–530.
24. BarradasM, AndertonE, AcostaJC, LiS, BanitoA, et al. (2009) Histone demethylase JMJD3 contributes to epigenetic control of INK4a/ARF by oncogenic RAS. Genes Dev 23 : 1177–1182.
25. AggerK, CloosPA, RudkjaerL, WilliamsK, AndersenG, et al. (2009) The H3K27me3 demethylase JMJD3 contributes to the activation of the INK4A-ARF locus in response to oncogene - and stress-induced senescence. Genes Dev 23 : 1171–1176.
26. PeliJ, SchroterM, RudazC, HahneM, MeyerC, et al. (1999) Oncogenic Ras inhibits Fas ligand-mediated apoptosis by downregulating the expression of Fas. EMBO J 18 : 1824–1831.
27. TakahashiC, ShengZ, HoranTP, KitayamaH, MakiM, et al. (1998) Regulation of matrix metalloproteinase-9 and inhibition of tumor invasion by the membrane-anchored glycoprotein RECK. Proc Natl Acad Sci U S A 95 : 13221–13226.
28. GazinC, WajapeyeeN, GobeilS, VirbasiusCM, GreenMR (2007) An elaborate pathway required for Ras-mediated epigenetic silencing. Nature 449 : 1073–1077.
29. MuschenM, WarskulatU, BeckmannMW (2000) Defining CD95 as a tumor suppressor gene. J Mol Med (Berl) 78 : 312–325.
30. KanedaA, FujitaT, AnaiM, YamamotoS, NagaeG, et al. (2011) Activation of Bmp2-Smad1 signal and its regulation by coordinated alteration of H3K27 trimethylation in Ras-induced senescence. PLoS Genet 7: e1002359.
31. SamuelsML, WeberMJ, BishopJM, McMahonM (1993) Conditional transformation of cells and rapid activation of the mitogen-activated protein kinase cascade by an estradiol-dependent human raf-1 protein kinase. Mol Cell Biol 13 : 6241–6252.
32. PasiniD, BrackenAP, JensenMR, Lazzerini DenchiE, HelinK (2004) Suz12 is essential for mouse development and for EZH2 histone methyltransferase activity. EMBO J 23 : 4061–4071.
33. HansenKH, BrackenAP, PasiniD, DietrichN, GehaniSS, et al. (2008) A model for transmission of the H3K27me3 epigenetic mark. Nat Cell Biol 10 : 1291–1300.
34. ErnstJ, KheradpourP, MikkelsenTS, ShoreshN, WardLD, et al. (2011) Mapping and analysis of chromatin state dynamics in nine human cell types. Nature 473 : 43–49.
35. DunhamI, KundajeA, AldredSF, CollinsPJ, DavisCA, et al. (2012) An integrated encyclopedia of DNA elements in the human genome. Nature 489 : 57–74.
36. RingroseL, ParoR (2007) Polycomb/Trithorax response elements and epigenetic memory of cell identity. Development 134 : 223–232.
37. WooCJ, KharchenkoPV, DaheronL, ParkPJ, KingstonRE (2010) A region of the human HOXD cluster that confers polycomb-group responsiveness. Cell 140 : 99–110.
38. MendenhallEM, KocheRP, TruongT, ZhouVW, IssacB, et al. (2010) GC-rich sequence elements recruit PRC2 in mammalian ES cells. PLoS Genet 6: e1001244.
39. SeenundunS, RampalliS, LiuQC, AzizA, PaliiC, et al. (2010) UTX mediates demethylation of H3K27me3 at muscle-specific genes during myogenesis. EMBO J 29 : 1401–1411.
40. KashyapV, GudasLJ, BrenetF, FunkP, VialeA, et al. (2011) Epigenomic reorganization of the clustered Hox genes in embryonic stem cells induced by retinoic acid. J Biol Chem 286 : 3250–3260.
41. BuzasDM, RobertsonM, FinneganEJ, HelliwellCA (2011) Transcription-dependence of histone H3 lysine 27 trimethylation at the Arabidopsis polycomb target gene FLC. Plant J 65 : 872–881.
42. TakeshimaH, IkegamiD, WakabayashiM, NiwaT, KimYJ, et al. (2012) Induction of aberrant trimethylation of histone H3 lysine 27 by inflammation in mouse colonic epithelial cells. Carcinogenesis 33 : 2384–2390.
43. WangH, WangL, Erdjument-BromageH, VidalM, TempstP, et al. (2004) Role of histone H2A ubiquitination in Polycomb silencing. Nature 431 : 873–878.
44. StockJK, GiadrossiS, CasanovaM, BrookesE, VidalM, et al. (2007) Ring1-mediated ubiquitination of H2A restrains poised RNA polymerase II at bivalent genes in mouse ES cells. Nat Cell Biol 9 : 1428–1435.
45. KuM, KocheRP, RheinbayE, MendenhallEM, EndohM, et al. (2008) Genomewide analysis of PRC1 and PRC2 occupancy identifies two classes of bivalent domains. PLoS Genet 4: e1000242.
46. KallinEM, CaoR, JothiR, XiaK, CuiK, et al. (2009) Genome-wide uH2A localization analysis highlights Bmi1-dependent deposition of the mark at repressed genes. PLoS Genet 5: e1000506.
47. BlackJC, Van RechemC, WhetstineJR (2012) Histone lysine methylation dynamics: establishment, regulation, and biological impact. Mol Cell 48 : 491–507.
48. ChaTL, ZhouBP, XiaW, WuY, YangCC, et al. (2005) Akt-mediated phosphorylation of EZH2 suppresses methylation of lysine 27 in histone H3. Science 310 : 306–310.
49. WeiY, ChenYH, LiLY, LangJ, YehSP, et al. (2011) CDK1-dependent phosphorylation of EZH2 suppresses methylation of H3K27 and promotes osteogenic differentiation of human mesenchymal stem cells. Nat Cell Biol 13 : 87–94.
50. GehaniSS, Agrawal-SinghS, DietrichN, ChristophersenNS, HelinK, et al. (2010) Polycomb group protein displacement and gene activation through MSK-dependent H3K27me3S28 phosphorylation. Mol Cell 39 : 886–900.
51. LauPN, CheungP (2011) Histone code pathway involving H3 S28 phosphorylation and K27 acetylation activates transcription and antagonizes polycomb silencing. Proc Natl Acad Sci U S A 108 : 2801–2806.
52. MoritaS, KojimaT, KitamuraT (2000) Plat-E: an efficient and stable system for transient packaging of retroviruses. Gene Ther 7 : 1063–1066.
53. YoungAR, NaritaM, FerreiraM, KirschnerK, SadaieM, et al. (2009) Autophagy mediates the mitotic senescence transition. Genes Dev 23 : 798–803.
54. TrapnellC, PachterL, SalzbergSL (2009) TopHat: discovering splice junctions with RNA-Seq. Bioinformatics 25 : 1105–1111.
55. TrapnellC, HendricksonDG, SauvageauM, GoffL, RinnJL, et al. (2013) Differential analysis of gene regulation at transcript resolution with RNA-seq. Nat Biotechnol 31 : 46–53.
56. LiH, DurbinR (2009) Fast and accurate short read alignment with Burrows-Wheeler transform. Bioinformatics 25 : 1754–1760.
57. MortazaviA, WilliamsBA, McCueK, SchaefferL, WoldB (2008) Mapping and quantifying mammalian transcriptomes by RNA-Seq. Nat Methods 5 : 621–628.
Štítky
Genetika Reprodukční medicínaČlánek vyšel v časopise
PLOS Genetics
2013 Číslo 8
- Kazuistika – Perspektivy využití precizované medicíny v rámci personalizované specifické terapie onkologických pacientů
- Nobelova cena za chemii pro genetické nůžky: Objev, který změní naši budoucnost?
- Technologie na bázi RNA v klinické praxi: od přebarvených petúnií k terapii vzácných a dosud jen obtížně léčitelných chorob u lidí
- „Nepředstavovali jsme si, že náš výzkum povede přímo ke vzniku nových léků, dokonce ještě za našeho života“
- Bezplatné služby pro diagnostiku ATTRv amyloidózy pro kardiology
Nejčtenější v tomto čísle
- Chromosomal Copy Number Variation, Selection and Uneven Rates of Recombination Reveal Cryptic Genome Diversity Linked to Pathogenicity
- Genome-Wide DNA Methylation Analysis of Systemic Lupus Erythematosus Reveals Persistent Hypomethylation of Interferon Genes and Compositional Changes to CD4+ T-cell Populations
- Associations of Mitochondrial Haplogroups B4 and E with Biliary Atresia and Differential Susceptibility to Hydrophobic Bile Acid
- A Role for CF1A 3′ End Processing Complex in Promoter-Associated Transcription
Zvyšte si kvalifikaci online z pohodlí domova
Mazová zátka a její řešení
nový kurzVšechny kurzy