
Genome-Wide Association of Body Fat Distribution in African Ancestry Populations Suggests New Loci
Central obesity, measured by waist circumference (WC) or waist-hip ratio (WHR), is a marker of body fat distribution. Although obesity disproportionately affects minority populations, few studies have conducted genome-wide association study (GWAS) of fat distribution among those of predominantly African ancestry (AA). We performed GWAS of WC and WHR, adjusted and unadjusted for BMI, in up to 33,591 and 27,350 AA individuals, respectively. We identified loci associated with fat distribution in AA individuals using meta-analyses of GWA results for WC and WHR (stage 1). Overall, 25 SNPs with single genomic control (GC)-corrected p-values<5.0×10⁻⁶ were followed-up (stage 2) in AA with WC and with WHR. Additionally, we interrogated genomic regions of previously identified European ancestry (EA) WHR loci among AA. In joint analysis of association results including both Stage 1 and 2 cohorts, 2 SNPs demonstrated association, rs2075064 at LHX2, p = 2.24×10⁻⁸ for WC-adjusted-for-BMI, and rs6931262 at RREB1, p = 2.48×10⁻⁸ for WHR-adjusted-for-BMI. However, neither signal was genome-wide significant after double GC-correction (LHX2: p = 6.5×10⁻⁸; RREB1: p = 5.7×10⁻⁸). Six of fourteen previously reported loci for waist in EA populations were significant (p<0.05 divided by the number of independent SNPs within the region) in AA studied here (TBX15-WARS2, GRB14, ADAMTS9, LY86, RSPO3, ITPR2-SSPN). Further, we observed associations with metabolic traits: rs13389219 at GRB14 associated with HDL-cholesterol, triglycerides, and fasting insulin, and rs13060013 at ADAMTS9 with HDL-cholesterol and fasting insulin. Finally, we observed nominal evidence for sexual dimorphism, with stronger results in AA women at the GRB14 locus (p for interaction = 0.02). In conclusion, we identified two suggestive loci associated with fat distribution in AA populations in addition to confirming 6 loci previously identified in populations of EA. These findings reinforce the concept that there are fat distribution loci that are independent of generalized adiposity.
Published in the journal:
. PLoS Genet 9(8): e32767. doi:10.1371/journal.pgen.1003681
Category:
Research Article
doi:
https://doi.org/10.1371/journal.pgen.1003681
Summary
Central obesity, measured by waist circumference (WC) or waist-hip ratio (WHR), is a marker of body fat distribution. Although obesity disproportionately affects minority populations, few studies have conducted genome-wide association study (GWAS) of fat distribution among those of predominantly African ancestry (AA). We performed GWAS of WC and WHR, adjusted and unadjusted for BMI, in up to 33,591 and 27,350 AA individuals, respectively. We identified loci associated with fat distribution in AA individuals using meta-analyses of GWA results for WC and WHR (stage 1). Overall, 25 SNPs with single genomic control (GC)-corrected p-values<5.0×10⁻⁶ were followed-up (stage 2) in AA with WC and with WHR. Additionally, we interrogated genomic regions of previously identified European ancestry (EA) WHR loci among AA. In joint analysis of association results including both Stage 1 and 2 cohorts, 2 SNPs demonstrated association, rs2075064 at LHX2, p = 2.24×10⁻⁸ for WC-adjusted-for-BMI, and rs6931262 at RREB1, p = 2.48×10⁻⁸ for WHR-adjusted-for-BMI. However, neither signal was genome-wide significant after double GC-correction (LHX2: p = 6.5×10⁻⁸; RREB1: p = 5.7×10⁻⁸). Six of fourteen previously reported loci for waist in EA populations were significant (p<0.05 divided by the number of independent SNPs within the region) in AA studied here (TBX15-WARS2, GRB14, ADAMTS9, LY86, RSPO3, ITPR2-SSPN). Further, we observed associations with metabolic traits: rs13389219 at GRB14 associated with HDL-cholesterol, triglycerides, and fasting insulin, and rs13060013 at ADAMTS9 with HDL-cholesterol and fasting insulin. Finally, we observed nominal evidence for sexual dimorphism, with stronger results in AA women at the GRB14 locus (p for interaction = 0.02). In conclusion, we identified two suggestive loci associated with fat distribution in AA populations in addition to confirming 6 loci previously identified in populations of EA. These findings reinforce the concept that there are fat distribution loci that are independent of generalized adiposity.
Introduction
Obesity is an important public health problem, reaching epidemic proportions. The prevalence varies by ethnicity, with nearly one-third of European ancestry (EA) and almost one-half of African ancestry (AA) Americans considered obese [1]. Recent studies have suggested that body fat distribution, above and beyond generalized adiposity, is an important metric of metabolic health, as different fat compartments are associated with differential metabolic risk [2]. Specifically, a tendency to deposit fat centrally is associated with diabetes, hypertension, and heart disease [3]–[6], even after accounting for generalized adiposity [7], [8].
Waist circumference (WC) and waist to hip ratio (WHR) are established measures of body fat distribution [9] that differ by ethnicity [10], [11] and demonstrate a genetic component. Twin studies documented heritability of levels for WC and WHR in EA and AA individuals, ranging from 31%–76% [12]–[15] even after accounting for BMI [14]–[16]. A recent meta-analysis of WHR in EA individuals identified 14 loci for body fat distribution [17]. In addition, recent studies among EAs for percent body fat, fatty liver, visceral fat, and pericardial fat reported unique loci for fat distribution and ectopic fat depots above and beyond those associated with generalized adiposity [18]–[21]. Similar studies are not available in AA populations. Thus, the purpose of the present analysis was to perform a collaborative large-scale meta-analysis of waist-based traits in AA individuals.
Results
We analyzed genetic loci for waist circumference (WC) and waist hip ratio (WHR) in up to 23,564 AA participants in the discovery set (Stage 1) and 10,027 AA participants in the replication set (Stage 2). Table 1 presents overall study sample characteristics and Supplementary Table S1 presents stratified sample characteristics by gender. Detailed descriptions of each cohort are shown in Supplementary Table S2 and the Supplementary Materials Text S1. In our GWAS analysis, we applied single genomic control (GC) correction to avoid the overly conservative double GC correction [22], [23] but we also provide double GC-corrected p-values for the joint meta-analysis of stage 1 and stage 2 samples (Table 2).


Stage 1 Genome-Wide Association Analyses for WC and WHR
We conducted genome-wide association analyses for 3.2 million variants, including genotyped and imputed variants, among AA individuals for WC, WC adjusted for BMI (WC-BMI), WHR and WHR adjusted for BMI (WHR-BMI) within each cohort, overall and by sex, and meta-analyzed the results. The Quantile-Quantile and Manhattan plots for all analyses are displayed in Supplementary Figure S1. With concern of overly conservative double GC-correction, we applied single GC-correction p values to select variants for follow-up. Three loci had p<5×10⁻⁸ under single GC-correction; rs2570467 at PCSK1 with WC, rs1345301 at IL1RL2 with WC, and rs17213965 at MYH11 with WHR-BMI, all in men (n = 5967, 5973, 4398, respectively). Across all traits analyzed, an additional 22 independent SNPs had a single GC-corrected p<5.0×10⁻⁶ (Table 2). Heterogeneity tests were examined across all cohorts and none of these 25 SNPs were significant (all p-values>0.05/25) in heterogeneity testing after adjusting for multiple testing, indicating that we did not observe statistically different allelic effects for these 25 SNPs across the participating studies.
Stage 2 Analyses and Joint Meta-Analysis of Stage 1 and Stage 2
We carried forward all 25 SNPs with single GC-corrected p<5×10⁻⁶ from stage 1 and tested their association in Stage 2 with the traits of interest either in the gender-specific or gender-combined data depending on the findings in Stage 1, in up to 10,027 AA individuals with WC and 7,606 AA individuals with WHR. Significance was defined as the joint meta-analysis of stage 1 and stage 2 p-value<5×10⁻⁸. Results for these SNPs from discovery, validation and joint analyses are shown in Table 2, and the imputation quality for these SNPs is provided in Supplementary Table S3. Three SNPs with p<5×10⁻⁸ in the men only analysis of Stage 1 failed to replicate (p>5×10⁻⁸, n<6,000 in stage 1 and n<3,250 in stage 2) but two of the 25 SNPs carried forward from Stage 1 reached genome-wide significance under single genomic control (GC) in the joint meta-analysis of Stage 1 and Stage 2 data: rs2075064 (LHX2, p = 2.24×10⁻⁸) in association with WC-BMI, and rs6931262 (RREB1, p = 2.48×10⁻⁸) in association with WHR-BMI. We note, however, that double GC-corrected p values for these two variants have slightly attenuated p-values: rs2075064 (LHX2, p = 6.5×10⁻⁸) and rs6931262 (RREB1, p = 5.7×10⁻⁸), which were no longer genome-wide significant. The regional association plots for these two loci are presented in Figure 1. The lead SNP rs6931262 at RREB1 is 474 kb away from rs1294421 at LY86, previously identified in the Genetic Investigation of ANthropomorphic Traits (GIANT) consortium [17] of EA studies in association with WHR-BMI (r2 = 0.007, D′ = 0.093 among YRI Hapmap participants).

Further Characterization of LHX2 and RREB1 Loci
Given the tendency of waist-associated SNPs to exhibit sex-specific effects in samples of EA [17], we first tested the two AA waist loci for evidence of sexual dimorphism (Supplementary Table S4). There was no appreciable difference between the beta coefficients for the lead SNPs at LHX2 or RREB1 in women compared to men in the joint analysis of Stage 1 and Stage 2 samples (psex difference >0.46), suggesting little to no sexual dimorphism with respect to these 2 loci.
Next, we tested whether the loci identified in the samples of African ancestry also demonstrate nominal associations in samples of European ancestry. We interrogated the evidence for association, both directional consistency and statistical significance, of these two SNPs in the GIANT consortium meta-analysis of WHR-BMI (n = 77,167 EA participants, http://www.broadinstitute.org/collaboration/giant/index.php/GIANT_consortium) [17]. Neither rs2075064 at LHX2 (p = 0.78) nor rs6931262 at RREB1 (p = 0.13) was statistically significant. The direction of effect for the risk allele was consistent for RREB1 between EA and AA samples, while it was direction-inconsistent for LHX2. However, because linkage disequilibrium patterns with causal SNPs can differ, or allelic heterogeneity can exist across ethnicities, we tested for SNP associations within the 250 kb flanking genomic regions centered at our two top signals to examine whether SNPs in these genomic regions might be associated with WHR-BMI in EA samples. For the LHX2 region, the SNP with the lowest p-value was rs10986172 (MAF = 0.06, p = 2.6×10⁻², ∼30 kb from rs2075064; Figure 2a), which did not reach the Bonferroni-corrected p-value threshold of 6.02×10⁻⁴ (0.05/83 independent tests). For the RREB1 region, the SNP with the lowest p-value in the European Ancestry data was rs9392863 (MAF = 0.26, p = 1.30×10⁻⁴, ∼20 kb from rs6931262, LD with rs6931262: r2 = 0.005 and D′ = 1.00 in HapMap CEU; Figure 2b) which met the Bonferroni-corrected threshold of 6.10×10⁻⁴ (0.05/82) in EA samples. Note that the association for rs9392863 was not significant (p-value = 0.57, LD with rs6931262: r2 = 0.001 and D′ = 1.00 in HapMap YRI) in our AA samples.

Waist circumference may be greater in tall adults. To distinguish the evidence of association with WC-BMI from height, we also tested whether rs2075064 at LHX2 might also be associated with height in the GIANT GWAS of Height (http://www.broadinstitute.org/collaboration/giant/index.php/GIANT_consortium) [23]. No evidence of association was noted (p-value of 0.95).
Local Ancestry Analysis
Recently admixed individuals, such as samples of African ancestry, may have inherited ancestry from more than one ancestral population. However, local ancestry may be confounded with the association signal and lead to spurious association in association analysis. So to further characterize the differences by ancestral groups of our two novel loci (LHX2 and RREB1), we performed a sensitivity analysis by additionally adjusting for local ancestry to account for the effect on our trait of interest due to the local ancestry at the tested variant using 5 Stage 1 African ancestry studies. Local ancestry adjustment resulted in similar effect estimates (Supplementary Table S5), suggesting it is unlikely to account for our reported signals.
Interrogation of Known European WHR Loci in African Ancestry Participants
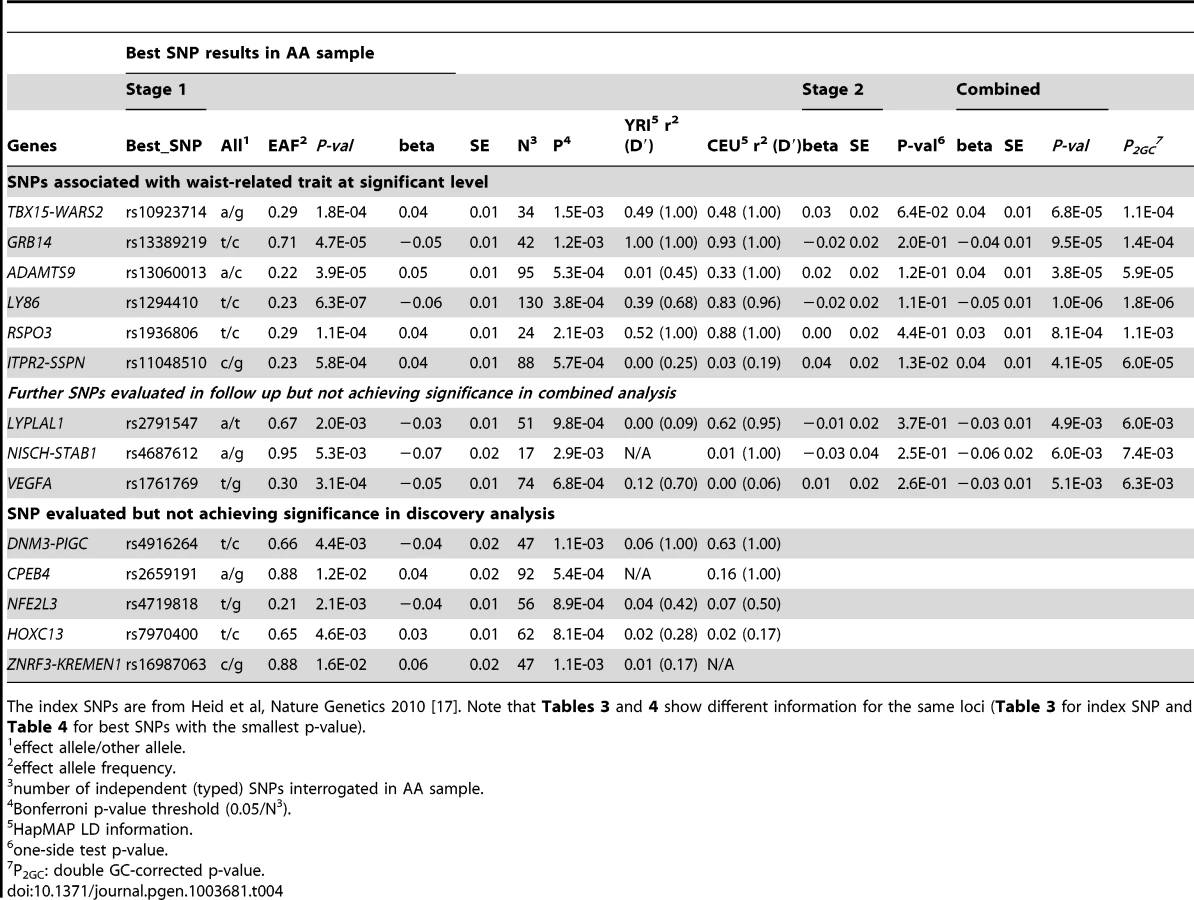
Given the association of the RREB1 locus with WHR-BMI in both AA and EA participants, we next examined fourteen previously published loci in association with WHR-BMI in EA participants [17] in our AA sample (Table 3). Twelve (except rs6861681 and rs1055144) of the fourteen SNPs had the same effect direction with respect to the beta coefficient (binomial distribution p-value = 0.0065), and five demonstrated nominal significance (p<0.05) in our AA Stage 1 sample (p-value range 1.6×10⁻² to 8.5×10⁻⁵). We also conduct two-sample t-test to compare the beta coefficients between EA samples and AA samples. None of these fourteen SNPs displayed significant heterogeneity between the two races. We next interrogated the flanking 250 kb genomic regions centered at each of the 14 SNPs in our AA dataset. Of the 14 SNPs, 9 SNPs met the locus-specific Bonferroni corrected threshold in the Stage 1 sample and were carried forward for Stage 2 validation. In the combined Stage 1 and 2 sample, of these 9 SNPs, 6 remained significant with p-values less than the locus-specific Bonferroni-corrected threshold (0.05 divided by the number of independent SNPs within the flanking region of each index SNP; TBX15-WARS2, GRB14, ADAMTS9, LY86, RSPO3, ITPR2-SSPN, Table 4). Figure 3 presents the regional association plots of these six loci. Except for the ITPR2-SSPN region, the five best AA SNPs were in linkage disequilibrium, r2>0.3 (LD in HapMap II CEU), with the original index SNPs previously reported in EA participants.


Because of the close physical proximity of rs6931262 at RREB1 and rs1294410 at LY86 (r2 0.01, D′ 0.35 in YRI, 474 kb apart), we performed a conditional analysis in the largest contributing study, the Women's Health Initiative. When the SNPs were tested individually, the beta coefficient for rs6931262 was −0.054 (p = 0.0039), and for rs1294410 was 0.048 (p = 0.0145). In the conditional analysis, the betas and p-values were not numerically different (beta −0.052 for rs6931262 and 0.046 for rs1294410; p-values 0.0056 and 0.0145, respectively).
Given the prior evidence for sexual dimorphism at many of these known loci [17], we tested for evidence of sex differences at the 6 replicating AA SNPs in the joint Stage 1 and Stage 2 samples (Supplementary Table S4). We observed little evidence for sexual dimorphism, with the exception of GRB14, which demonstrated a stronger effect size in women as compared to men (p-value = 0.02 for the comparison of the beta coefficients).
Cross-Trait Associations
Given the evidence for association between waist-based traits and other cardiometabolic risk factors in EA individuals [17], we next examined whether there was similar enrichment in AA individuals (Table 5). rs13389219 at GRB14 was associated with HDL-cholesterol (p = 0.014) [24], triglycerides (p = 0.014) [24], and fasting insulin (p = 0.008) [25], while rs13060013 in ADAMTS9 was associated with HDL-cholesterol (p = 0.0009) [24] and fasting insulin (p = 0.002) [25]. There were nominal associations with related anthropometric traits for rs1936806 at RSPO3 in association with BMI [26] (p = 0.003), rs2075064 at LHX2 in association with BMI [26] (p = 0.002), and height (p = 0.02, Christopher Haiman, personal communication).

Discussion
We identified 2 loci at LHX2 and RREB1 with p<5.0×10⁻⁸ under single GC-correction for waist-based traits in African ancestry individuals, which were not genome-wide significant (p = 6.5×10⁻⁸ and p = 5.7×10⁻⁸) with double-GC correction. Population sub-structure may cause spurious associations in genome-wide association studies and GC factors calculated from variants across the genome are conventionally used to scale the test statistic [27]. However, this method was originally proposed under the hypothesis that only a small number of causal variants underlie complex traits. Recent studies have shown that as the number of causal variants increases, more SNPs (in LD with causal variants) will depart from the null distribution even in the absence of population sub-structure [22], [23]. Furthermore, the GC factor is a function of sample size under a constant phenotypic heritability. Therefore, double GC-correction in a large meta-analysis is likely overly conservative. Thus, we report both single and double GC-corrected values. rs6931262 at RREB1 is in a region previously identified by the GIANT consortium in European ancestry individuals, although in low linkage disequilibrium with the variant identified in the present study. Interrogation of 14 regions previously identified by the GIANT consortium identified 6 additional SNPs associated with waist traits in AA participants. Two of these loci at GRB14 and ADAMTS9 were also associated with metabolic traits in AA. Finally, we observed nominal evidence for sexual dimorphism.
These findings support prior GWAS findings that there are genetic loci for body fat distribution which are distinct from loci associated with generalized adiposity. The GIANT consortium identified 14 loci in association with WHR adjusted for BMI, and the majority was not associated with BMI [17]. Similarly, a SNP at IRS1 was identified in association with body percent fat that was not associated with generalized adiposity [18]. More recent GWAS of ectopic fat depots have also identified unique loci in association with fatty liver [19], visceral abdominal fat [20], and pericardial fat [21]. The results from the present analysis extend these observations to AA populations, a group at increased risk for obesity and its complications.
Our findings add to the growing appreciation that SNPs correlated with body fat distribution are also associated with metabolic traits [28]. This finding contrasts with genetic loci for BMI, which generally have not been shown to be associated with metabolic traits [29]. In contrast to prior work [17], [18], [20], we observed little evidence for sexual dimorphism in the present analysis, with the exception of GRB14. Whereas the GIANT consortium observed stronger effect sizes in women than men among the majority of the 14 WHR SNPs they identified, we observed more modest gender differences and in some instances, the effect size was actually stronger in men as compared to women (ITPR2-SSPN and LHX2). This raises several hypotheses that warrant some speculation as to why we did not observe similar sexual dimorphism in AA sample as observed in our prior work in EA samples. First, biologically, associations linking the SNPs and gene regions to body fat distribution traits may be different between women and men of AA as compared to EA. Second, in terms of methodology, the traits themselves may be measuring different phenotypic elements of body fat distribution or muscle mass in women as compared to men. Abdominal adipose composition may vary more in EA than AA as EA have greater visceral adipose tissue than AA of similar gender. Finally, statistically, for some loci (RSPO3 and ADAMTS9), we cannot rule out the presence of modest gender differences given the relatively small sample sizes as compared with other analyses. This is further reinforced by our power analysis to detect sex-specific associations. We conducted this power analysis for a common variant (specifically, MAF of 0.25 here) with an effect size difference of 0.054, which is derived from the largest effect difference indicated in Table 2 of Heid et al [17]. Using these assumptions, we have only 6.7% power to detect the variant (MAF of 0.25) with a sample size of 23564 in our discovery stage and 10.9% power with combined sample size 33738 from stage 1 and stage 2. This suggests that we have limited power to detect sexual dimorphism if it indeed exists.
It is notable that our top SNP at RREB1 is within 1 Mb of LY86 (lymphocyte antigen 86), one of the 14 novel loci identified by the GIANT genome-wide association meta-analysis of WHR [17]. Given the low pairwise linkage disequilibrium and lack of change in the association of the beta coefficient upon conditional analysis in this region, it is likely that there are two independent genetic effects in this chromosomal region. It is also possible that these two SNPs may be partially tagging an untyped variant that explains the underlying association [30]–[32]. Therefore, fine mapping or deep sequencing of this region is needed and may prove relevant to both AA and EA. Our findings also demonstrate the similarity in the genetic architecture of waist related traits in EA and AA, as 12 of the 14 previously identified WHR loci demonstrated direction-consistent effect estimates in AA as compared to EA participants. For five of these signals (TBX15-WARS2, GRB14, ADAMTS9, LY86, RSPO3), upon interrogation of the 250 kb flanking region of the index signal, we identified a better proxy (r2>0.3 in CEU dataset) SNP of the presumably underlying biologically important alleles at these loci. Indeed, these findings may help improve localization of the true association signal.
rs2075064 is in linkage disequilbrium with variants in the LHX2 and DENND1A genes. LHX2 is a member of the LHX protein family, the largest group of LIM-domain proteins. LHX proteins are primarily transcriptional regulators, with a known role in tissue-specific gene expression. They take part in the determination of cell lineage and identity in a wide range of tissues, including the adipocyte differentiation of human adipose-derived stem cells [33]. Variants in DENND1A gene have been associated with polycystic ovarian syndrome in both European ancestry [34] and Chinese women [35]. Taken together, these findings highlight how future studies can further our understanding of how genes in this region may contribute to body fat distribution and related obesity phenotypes.
There are several genes in the region of rs6931262. RREB1 (Ras-responsive element binding protein 1) participates in Ras signaling and cancer progression in bladder cancer [36] prostate cancer [37], and melanoma [38]. RREB1 is not known to play a role in adipose tissue, and SNPs in this gene have previously been associated with serum urate levels [39]. SSR1, CAGE1, and RIOK1 are also located in this genomic region, although SNPs mapping to these genes do not appear to be in linkage disequilibrium with the SNP cluster of interest.
There are several potential implications of this work. First, these analyses highlight how novel loci for body fat distribution, above and beyond generalized adiposity, can be elucidated by performing GWAS in diverse ethnic populations. Second, we demonstrate some important similarities in the associations among AA as compared to EA individuals with regards to the loci uncovered as well as pleiotropy with other cardio-metabolic phenotypes. Finally, while many of the beta coefficients were similar in women as compared to men, we did uncover modest evidence for sexual dimorphism in the present AA sample.
A major strength of this study is the large sample size of AA participants, representing the largest study to date for waist-based phenotypes in AA. This study has similar limitations to other GWAS performed in AA populations. While the overall sample size was large, the discovery sample was still considerably smaller than those for GWAS meta-analysis conducted in samples of primarily EA populations. In the present analysis, to have 80% power to detect an association that explains 0.1% of the trait variance at a MAF of 0.25 would require 39581 participants. With our largest WC sample size (n = 23564) in discovery stage, we have only 28% power to detect common variant explaining 0.1% of the variance of WC. In addition, GWAS panels such as the Affymetrix 6.0 chip were largely designed based on EA populations and have more limited SNP coverage for AA samples. For example, one analysis of 76 genes reported that only approximately 45–55% of SNPs were tagged (r2>0.8) on the Affymetrix 6.0 panel in YRI samples [40]. Kang and colleagues [41] demonstrated that both local and global ancestry estimates similarly attenuated spurious results due to population stratification in their study of AA ancestry individuals. As with all studies in admixed populations, while association analyses were adjusted for global population structure using principal components, there may be residual population substructure leading to false positive results. Given the minimal attenuation that we observed with local ancestry adjustment, our key findings are unlikely to be spurious. We performed 12 analyses, raising the possibility of false positive findings using standard significance thresholds. PCSK1 is a bona fide locus for obesity [42], yet this SNP failed to replicate in our findings. While we can not rule out power as the reason for the lack of replication, this signal may also have represented a false positive finding in our dataset. Heterogeneity between study samples may limit power, but this is an issue in GWAS and not unique to the present investigation. After double GC correction, our findings did not reach genome-wide significance. However, double GC correction may be overly conservative [22], [23]. Finally, a general limitation in GWAS is that coverage of rare (MAF<1%) and low frequency (1%<MAF<5%) variants is poor, and thus associations with rarer variants are likely missed.
GWAS of body fat distribution traits in a large AA sample has revealed two loci likely associated with fat distribution, as well as nominal evidence for association at 6 loci previously identified among EA individuals. These findings highlight similarities and differences in the genetic architecture of body fat distribution in AA and EA individuals, and reinforce the concept that there are loci for fat distribution above and beyond generalized adiposity.
Materials & Methods
Phenotype Definition
We analyzed waist-based traits including waist circumference (WC) and waist-hip ratio (WHR), a measure of body fat distribution [43]. Details regarding trait acquisition within each cohort can be found in the Text S1. Individuals less than 20 years of age were excluded from all analyses. Within each cohort, we created two sets of residuals for WC and WHR, one adjusted for age, age2, study site (if applicable) and another additionally adjusted for BMI. Analyses were conducted separately for men and women. The raw residuals were then transformed through an inverse normal function for each subgroup and these transformed residuals were used as our phenotypes in the association analyses. The cohorts with related individuals additionally performed sex-combined analysis. We analyzed four phenotypes: waist circumference (WC), waist circumference adjusted for BMI (WC-BMI), waist hip ratio (WHR) and waist hip ratio adjusted for BMI (WHR-BMI).
Samples
We conducted analysis of WC and WHR in up to 33738 and 27489 AA individuals, respectively. Specifically, the analysis included for WC up to 23,564 individuals and WHR up to 19,744 individuals in stage 1 while 10,174 AA individuals with WC and 7,745 AA individuals with WHR in stage 2. Stage 1 cohorts were part of the CARe consortium and other cohorts that were identified with GWAS data at the time the study started. Stage 2 cohorts with in silico GWAS data were identified later. Some participating studies, including CFS, Family Heart Study, GENOA, HUFS, HyperGEN, GeneSTAR, JHS, MESA-family and SIGNET (REGARDS, SUGAR), are family studies. The CARe consortium (ARIC, CARDIA, CFS, JHS, MESA) consists of several population-based studies that included African ancestry individuals. The WHI study was a clinical trial. HANDLS is a community-based study. Family Heart Study is a multicenter family-based study. GeneSTAR is a prospective study of vascular diseases. GENOA and HYPERGEN are cohorts of sibships enriched for hypertension. Health ABC is a random sample of Medicare beneficiaries in and surrounding Pittsburgh, Pennsylvania, and Memphis, Tennessee. HUFS is a population-based family study in the Washington, D.C. metropolitan area. MEC is a prospective cohort study including a nested breast cancer case-control study. WCHS is a case-control study of breast cancer in the New York City and New Jersey. CBCS is population-based case-control study on Breast cancer. Both MEC and MDA are Prostate cancer case-control studies. Black Women's Health Study is an ongoing follow-up study of 59,000 African American women from across the U.S. CHS is a population-based study of risk factors for CHD and stroke. REGARDS is an observational cohort and SUGAR is a community based family studies focusing on Type 2 Diabetes. Each participating study has obtained institutional review board approval on research involving human subjects and all subjects provided written informed consent. Details regarding each cohort can be found in the Text S1.
Genotyping and Imputation
Genotype information for each cohort is presented in Supplementary Table S2. As shown in Table 1, the genetic ancestry of our samples, African American, is also partly from European Ancestry. Simply using all YRI sample as reference panel would be inappropriate, given that we generally see an average of 20% CEU admixture. To better capture the genetic structure of our samples, all the genotypes from discovery cohorts were imputed using combined HapMap 1∶1 CEU+YRI as reference panel. This imputation has resulted in an allelic concordance rate of 95.6%, which is compatible to rates calculated with the HapMap 2 YRI individuals [44]. Our follow-up stage (Stage 2) included in silico and de novo follow-up cohorts. In-silico follow-up studies similarly use the combined CEU+YRI in HapMap as their reference panel for genotype imputation. Then the expected allele dosage was used in the association analysis to account for the uncertainty introduced by the genotype imputation. More details regarding imputation were in Supplementary Table S2.
Statistical Methods for Discovery (Stage 1)
In each discovery study, genome-wide tests for association between SNPs and phenotypes were conducted separately for men and women using linear regression with principal components adjustment to adjust for global population substructure. In studies from families, men and women were also combined for analyses. Linear mixed effect models, where appropriate, were used to account for the relatedness in family studies.
In addition to study-specific filters, a centralized quality control procedure was performed to extensively examine and check all study-specific results files before meta-analysis. We examined the plausible values for all reported summary statistics to check for potential errors. The genomic control lambda (λ) value for each set of results was checked for potential p-value inflation. We analyzed SNPs with imputation quality scores greater than 0.3 for studies using MACH or BimBam software, and greater than 0.4 for studies that used other imputation software such as IMPUTE. Additionally, we filtered out SNPs where the minor allele frequency times the number of subjects was smaller than or equal to 5, to ensure robust estimates.
Meta-Analysis
We performed fixed-effects meta-analyses of study-specific genome-wide association results using the inverse-variance weighted approach for the traits described above. Three sets of meta-analyses were conducted for each phenotype using (1) men only results, (2) women only results, and (3) joint men-only and women-only results for studies of unrelated individuals, and sex-combined results for studies with related individuals. The calculated λ genomic control (GC) correction was applied to each cohort's result. Recent studies showed that under polygenic inheritance, test statistics in large meta-analyses are expected to be elevated even when there is no population sub-structure [22], [23]. To avoid an overly conservative adjustment, we focused on the single GC-corrected result. However, we also report the double GC-corrected p-value for the joint meta-analysis of the stage 1 and stage 2 samples.
Local Ancestry Analysis
As a sensitivity analysis, we assessed the impact of local ancestry by including SNP specific local ancestry estimates as a covariate in models for genome-wide significant signals in both the CARE and WHI studies. Locus-specific ancestry (i.e. probabilities of whether an individual has 0, 1, or 2 alleles of African ancestry at each locus) was only available for directly genotyped SNPs and was estimated using a Hidden Markov Model and the local haplotype structure to detect transitions in ancestry along the genome [45]. We considered signals robust to adjustment for local ancestry when the Beta was numerically similar.
Interrogation of GIANT Loci in the Samples of African Ancestry
We applied a procedure to evaluate the transferability of association signals across different ethnicities [46]. Specifically, in addition to validating the previously reported index SNPs identified in studies of EA participants [17], we interrogated the surrounding genomic regions in our AA samples. For each reported index EA SNP, we first examined the results in our AA samples and tested for consistency of direction, with respect to the beta coefficients of index SNPs, between EA and AA samples. To accommodate the difference of LD structure across ethnicities, we then interrogated ±250 kb regions around the index SNPs and identified the SNP with the smallest p-value in AA within the interrogated genomic region. The loci-specific significance threshold was based on Bonferroni correction, defined as 0.05 divided by the number of independent SNPs within an interrogated region. SNPs meeting genome-wide (p<5.0×10⁻⁸) or suggestive (5.0×10⁻⁸<p<5.0×10⁻⁶) in the Stage 1 meta-analysis were carried forward for follow-up in Stage 2 and joint Stage 1 and 2 meta-analysis. To test the consistency of effect directions between AA and EA samples, a p-value was calculated based on the cumulative binomial distribution for the observed or more extreme number of variants with a consistent direction.
Follow-up Analysis (Stage 2) and Joint Analysis of Discovery and Follow-up (Stage 1 and 2) Data
An analysis approach consistent with the discovery stage (ie Stage 1), described above, was used for the Stage 2 studies. In this stage, the variants of interest identified from our analysis of Stage 1 and interrogation of previously published EA WHR-BMI loci were followed up in different samples for follow-up meta-analysis and confirming the association. We then conducted additional joint meta-analysis, including studies from both Stage 1 and Stage 2 discovery and follow-up data. In Stage 2 analysis, the replication was defined as having a beta coefficient consistent with the discovery stage; follow-up p-values are thus represented as one-sided tests. For the joint analysis, we used the standard threshold of p-value<5×10⁻⁸ for genome-wide significance and a locus-specific Bonferroni corrected threshold for the regions identified by the GIANT consortium.
For newly identified SNPs from both genome-wide association analyses and previous region interrogation analyses, we performed sex-specific association analyses and also tested the difference of meta-analyzed sex-specific beta-estimates ( and ) using the t-statistic

Interrogation of Novel AA Loci in GIANT
We also examined the GIANT consortium results [17] for evidence of association for the novel loci identified in the AA samples. We applied similar interrogation procedures detailed in the previous section of the Interrogation of GIANT Loci in the samples of African Ancestry. Briefly, we first looked up the association results for the AA index SNP in GIANT and followed up with the interrogation of its ±250 kb flanking region. The significance was evaluated as 0.05 divided by the number of independent variants within the interrogated region.
Cross-Trait Analyses
For the newly identified SNPs from both GWAS and the interrogation analysis we performed cross-trait association analyses of metabolic risk factor and related anthropometric measures, including BMI [26] , HDL-cholesterol [24], LDL-cholesterol [24], triglycerides [24], glucose and insulin [25], and height (Christopher Haiman, personal communication), in AA samples for the newly identified SNPs from both genome-wide association analysis and the interrogation analysis.
Supporting Information
Zdroje
1. FlegalKM, CarrollMD, OgdenCL, CurtinLR (2010) Prevalence and trends in obesity among US adults, 1999–2008. JAMA 303 : 235–241.
2. PoirierP, DespresJP (2003) Waist circumference, visceral obesity, and cardiovascular risk. J Cardiopulm Rehabil 23 : 161–169.
3. PischonT, BoeingH, HoffmannK, BergmannM, SchulzeMB, et al. (2008) General and abdominal adiposity and risk of death in Europe. N Engl J Med 359 : 2105–2120.
4. CanoyD (2008) Distribution of body fat and risk of coronary heart disease in men and women. Curr Opin Cardiol 23 : 591–598.
5. OhlsonLO, LarssonB, SvardsuddK, WelinL, ErikssonH, et al. (1985) The influence of body fat distribution on the incidence of diabetes mellitus. 13.5 years of follow-up of the participants in the study of men born in 1913. Diabetes 34 : 1055–1058.
6. FolsomAR, KushiLH, AndersonKE, MinkPJ, OlsonJE, et al. (2000) Associations of general and abdominal obesity with multiple health outcomes in older women: the Iowa Women's Health Study. Arch Intern Med 160 : 2117–2128.
7. FordES, MokdadAH, GilesWH (2003) Trends in waist circumference among U.S. adults. Obes Res 11 : 1223–1231.
8. ZhuS, HeymsfieldSB, ToyoshimaH, WangZ, PietrobelliA, et al. (2005) Race-ethnicity-specific waist circumference cutoffs for identifying cardiovascular disease risk factors. Am J Clin Nutr 81 : 409–415.
9. MolariusA, SeidellJC (1998) Selection of anthropometric indicators for classification of abdominal fatness–a critical review. Int J Obes Relat Metab Disord 22 : 719–727.
10. BachaF, SaadR, GungorN, JanoskyJ, ArslanianSA (2003) Obesity, regional fat distribution, and syndrome X in obese black versus white adolescents: race differential in diabetogenic and atherogenic risk factors. J Clin Endocrinol Metab 88 : 2534–2540.
11. BeasleyLE, KosterA, NewmanAB, JavaidMK, FerrucciL, et al. (2009) Inflammation and race and gender differences in computerized tomography-measured adipose depots. Obesity (Silver Spring) 17 : 1062–1069.
12. SourenNY, PaulussenAD, LoosRJ, GielenM, BeunenG, et al. (2007) Anthropometry, carbohydrate and lipid metabolism in the East Flanders Prospective Twin Survey: heritabilities. Diabetologia 50 : 2107–2116.
13. SelbyJV, NewmanB, QuesenberryCPJr, FabsitzRR, CarmelliD, et al. (1990) Genetic and behavioral influences on body fat distribution. Int J Obes 14 : 593–602.
14. NelsonTL, VoglerGP, PedersenNL, MilesTP (1999) Genetic and environmental influences on waist-to-hip ratio and waist circumference in an older Swedish twin population. Int J Obes Relat Metab Disord 23 : 449–455.
15. NelsonTL, BrandonDT, WigginsSA, WhitfieldKE (2002) Genetic and environmental influences on body-fat measures among African-American twins. Obes Res 10 : 733–739.
16. RoseKM, NewmanB, Mayer-DavisEJ, SelbyJV (1998) Genetic and behavioral determinants of waist-hip ratio and waist circumference in women twins. Obes Res 6 : 383–392.
17. HeidIM, JacksonAU, RandallJC, WinklerTW, QiL, et al. (2010) Meta-analysis identifies 13 new loci associated with waist-hip ratio and reveals sexual dimorphism in the genetic basis of fat distribution. Nat Genet 42 : 949–960.
18. KilpelainenTO, ZillikensMC, StancakovaA, FinucaneFM, RiedJS, et al. (2011) Genetic variation near IRS1 associates with reduced adiposity and an impaired metabolic profile. Nat Genet 43 : 753–760.
19. SpeliotesEK, Yerges-ArmstrongLM, WuJ, HernaezR, KimLJ, et al. (2011) Genome-wide association analysis identifies variants associated with nonalcoholic fatty liver disease that have distinct effects on metabolic traits. PLoS Genet 7: e1001324.
20. FoxCS, LiuY, WhiteCC, FeitosaM, SmithAV, et al. (2012) Genome-wide association for abdominal subcutaneous and visceral adipose reveals a novel locus for visceral fat in women. PLoS Genet 8: e1002695.
21. FoxCS, WhiteCC, LohmanK, Heard-CostaN, CohenP, et al. (2012) Genome-Wide Association of Pericardial Fat Identifies a Unique Locus for Ectopic Fat. PLoS Genet 8: e1002705.
22. YangJ, WeedonMN, PurcellS, LettreG, EstradaK, et al. (2011) Genomic inflation factors under polygenic inheritance. Eur J Hum Genet 19 : 807–812 ejhg201139 [pii];10.1038/ejhg.2011.39 [doi]
23. LangoAH, EstradaK, LettreG, BerndtSI, WeedonMN, et al. (2010) Hundreds of variants clustered in genomic loci and biological pathways affect human height. Nature 467 : 832–838 nature09410 [pii];10.1038/nature09410 [doi]
24. LettreG, PalmerCD, YoungT, EjebeKG, AllayeeH, et al. (2011) Genome-wide association study of coronary heart disease and its risk factors in 8,090 African Americans: the NHLBI CARe Project. PLoS Genet 7: e1001300.
25. LiuCT, NgMC, RybinD, AdeyemoA, BielinskiSJ, et al. (2012) Transferability and fine-mapping of glucose and insulin quantitative trait loci across populations: CARe, the Candidate Gene Association Resource. Diabetologia 55 : 2970–84.
26. MondaKL, ChenGK, TaylorKC, PalmerC, EdwardsTL, et al. (2013) A meta-analysis identifies new loci associated with body mass index in individuals of African ancestry. Nat Genet 45 (6) 690–6 doi: 10.1038/ng.2608
27. DevlinB, RoederK (1999) Genomic control for association studies. Biometrics 55 : 997–1004.
28. LiuJ, FoxCS, HicksonDA, MayWD, HairstonKG, et al. (2010) Impact of abdominal visceral and subcutaneous adipose tissue on cardiometabolic risk factors: the Jackson Heart Study. J Clin Endocrinol Metab 95 : 5419–5426.
29. SpeliotesEK, WillerCJ, BerndtSI, MondaKL, ThorleifssonG, et al. (2010) Association analyses of 249,796 individuals reveal 18 new loci associated with body mass index. Nat Genet 42 : 937–948.
30. SpencerC, HechterE, VukcevicD, DonnellyP (2011) Quantifying the underestimation of relative risks from genome-wide association studies. PLoS Genet 7: e1001337.
31. TrynkaG, HuntKA, BockettNA, RomanosJ, MistryV, et al. (2011) Dense genotyping identifies and localizes multiple common and rare variant association signals in celiac disease. Nat Genet 43 : 1193–1201.
32. WoodAR, HernandezDG, NallsMA, YaghootkarH, GibbsJR, et al. (2011) Allelic heterogeneity and more detailed analyses of known loci explain additional phenotypic variation and reveal complex patterns of association. Hum Mol Genet 20 : 4082–4092.
33. DahlL, RichterK, HagglundAC, CarlssonL (2008) Lhx2 expression promotes self-renewal of a distinct multipotential hematopoietic progenitor cell in embryonic stem cell-derived embryoid bodies. PLoS One 3: e2025.
34. WeltCK, StyrkarsdottirU, EhrmannDA, ThorleifssonG, ArasonG, et al. (2012) Variants in DENND1A are associated with polycystic ovary syndrome in women of European ancestry. J Clin Endocrinol Metab 97: E1342–E1347 jc.2011-3478 [pii];10.1210/jc.2011-3478 [doi]
35. CuiL, ZhaoH, ZhangB, QuZ, LiuJ, et al. (2013) Genotype-phenotype correlations of PCOS susceptibility SNPs identified by GWAS in a large cohort of Han Chinese women. Hum Reprod 28 : 538–544 des424 [pii];10.1093/humrep/des424 [doi]
36. NitzMD, HardingMA, SmithSC, ThomasS, TheodorescuD (2011) RREB1 transcription factor splice variants in urologic cancer. Am J Pathol 179 : 477–486.
37. MilonBC, AgyapongA, BautistaR, CostelloLC, FranklinRB (2010) Ras responsive element binding protein-1 (RREB-1) down-regulates hZIP1 expression in prostate cancer cells. Prostate 70 : 288–296.
38. GeramiP, MafeeM, LurtsbarapaT, GuitartJ, HaghighatZ, et al. (2010) Sensitivity of fluorescence in situ hybridization for melanoma diagnosis using RREB1, MYB, Cep6, and 11q13 probes in melanoma subtypes. Arch Dermatol 146 : 273–278.
39. YangQ, KottgenA, DehghanA, SmithAV, GlazerNL, et al. (2010) Multiple genetic loci influence serum urate levels and their relationship with gout and cardiovascular disease risk factors. Circ Cardiovasc Genet 3 : 523–530.
40. BhangaleTR, RiederMJ, NickersonDA (2008) Estimating coverage and power for genetic association studies using near-complete variation data. Nat Genet 40 : 841–843.
41. KangSJ, LarkinEK, SongY, Barnholtz-SloanJ, BaechleD, et al. (2009) Assessing the impact of global versus local ancestry in association studies. BMC Proc 3 (Suppl 7) S107.
42. BenzinouM, CreemersJW, ChoquetH, LobbensS, DinaC, et al. (2008) Common nonsynonymous variants in PCSK1 confer risk of obesity. Nat Genet 40 : 943–945.
43. KrotkiewskiM, BjorntorpP, SjostromL, SmithU (1983) Impact of obesity on metabolism in men and women. Importance of regional adipose tissue distribution. J Clin Invest 72 : 1150–1162.
44. HuangL, LiY, SingletonAB, HardyJA, AbecasisG, et al. (2009) Genotype-imputation accuracy across worldwide human populations. Am J Hum Genet 84 : 235–250.
45. TangH, CoramM, WangP, ZhuX, RischN (2006) Reconstructing genetic ancestry blocks in admixed individuals. Am J Hum Genet 79 : 1–12 S0002-9297(07)60013-5 [pii];10.1086/504302 [doi]
46. LiuCT, GarnaasMK, TinA, KottgenA, FranceschiniN, et al. (2011) Genetic association for renal traits among participants of African ancestry reveals new loci for renal function. PLoS Genet 7: e1002264.
Štítky
Genetika Reprodukční medicínaČlánek vyšel v časopise
PLOS Genetics
2013 Číslo 8
- Kazuistika – Perspektivy využití precizované medicíny v rámci personalizované specifické terapie onkologických pacientů
- Nobelova cena za chemii pro genetické nůžky: Objev, který změní naši budoucnost?
- Technologie na bázi RNA v klinické praxi: od přebarvených petúnií k terapii vzácných a dosud jen obtížně léčitelných chorob u lidí
- „Nepředstavovali jsme si, že náš výzkum povede přímo ke vzniku nových léků, dokonce ještě za našeho života“
- Bezplatné služby pro diagnostiku ATTRv amyloidózy pro kardiology
Nejčtenější v tomto čísle
- Chromosomal Copy Number Variation, Selection and Uneven Rates of Recombination Reveal Cryptic Genome Diversity Linked to Pathogenicity
- Genome-Wide DNA Methylation Analysis of Systemic Lupus Erythematosus Reveals Persistent Hypomethylation of Interferon Genes and Compositional Changes to CD4+ T-cell Populations
- Associations of Mitochondrial Haplogroups B4 and E with Biliary Atresia and Differential Susceptibility to Hydrophobic Bile Acid
- A Role for CF1A 3′ End Processing Complex in Promoter-Associated Transcription
Zvyšte si kvalifikaci online z pohodlí domova
Mazová zátka a její řešení
nový kurzVšechny kurzy