
Whole Genome DNA Binding Analysis of the Bacterial Replication Initiator and Transcription Factor DnaA
DNA binding proteins are involved in many cellular processes. The ability of these proteins to bind DNA is often modulated, either directly or indirectly. We determined the binding properties of Bacillus subtilis DnaA to genomic DNA at single nucleotide resolution using in vitro DNA affinity purification and deep sequencing. DnaA is the replication initiator and transcription factor and a AAA+ ATPase found in virtually all bacteria. Like other AAA+ proteins, DnaA binds ATP or ADP, and the identity of the nucleotide influences protein activity. We found that most DNA binding regions had a slightly higher affinity for ATP-DnaA than ADP-DnaA, but that a few regions had a strong preference for binding ATP-DnaA. Although some chromosomal regions were bound by DnaA both in vitro and in vivo, we observed many differences. Notably, we found regions that were bound in vivo that were not detectably bound in vitro. Binding to these regions in vivo required the nucleoid associated protein Rok. Our findings highlight the importance of other factors in the cell that modify association of DnaA with specific chromosomal regions. The general approach, to date used with only a couple of proteins, should be readily adaptable to many other DNA binding proteins.
Published in the journal:
. PLoS Genet 11(5): e32767. doi:10.1371/journal.pgen.1005258
Category:
Research Article
doi:
https://doi.org/10.1371/journal.pgen.1005258
Summary
DNA binding proteins are involved in many cellular processes. The ability of these proteins to bind DNA is often modulated, either directly or indirectly. We determined the binding properties of Bacillus subtilis DnaA to genomic DNA at single nucleotide resolution using in vitro DNA affinity purification and deep sequencing. DnaA is the replication initiator and transcription factor and a AAA+ ATPase found in virtually all bacteria. Like other AAA+ proteins, DnaA binds ATP or ADP, and the identity of the nucleotide influences protein activity. We found that most DNA binding regions had a slightly higher affinity for ATP-DnaA than ADP-DnaA, but that a few regions had a strong preference for binding ATP-DnaA. Although some chromosomal regions were bound by DnaA both in vitro and in vivo, we observed many differences. Notably, we found regions that were bound in vivo that were not detectably bound in vitro. Binding to these regions in vivo required the nucleoid associated protein Rok. Our findings highlight the importance of other factors in the cell that modify association of DnaA with specific chromosomal regions. The general approach, to date used with only a couple of proteins, should be readily adaptable to many other DNA binding proteins.
Introduction
DnaA is the highly conserved replication initiation protein found in virtually all bacteria [reviewed in 1, 2–6]. DnaA binds to multiple 9 bp "DnaA boxes" (DnaA binding sites; consensus sequence 5'-TTATNCACA) in the origin of chromosomal replication (oriC). Once properly bound to sites in oriC, DnaA causes melting of an AT-rich region and recruitment of the replication machinery. DnaA also binds to DnaA boxes at other chromosomal regions, and in some cases functions as a transcription factor, activating some genes and repressing others. DnaA directly activates transcription of sda [7–11], and appears to directly repress transcription of ywlC, vpr, and the yyzF-yydD, trmE-noc, and ywcI-sacT operons [8, 9, 12, 13].
DnaA is a AAA+ ATPase that is present in cells as both ATP-DnaA and ADP-DnaA. Although both ATP-DnaA and ADP-DnaA bind DNA, where analyzed, ATP-DnaA is required for replication initiation [3, 14–19]. For E. coli DnaA, there are some sites that appear to bind ATP-DnaA and ADP-DnaA equally well, and others that have a preference for ATP-DnaA [reviewed in 3]. The activity of E. coli DnaA is largely controlled by regulation of its ATPase activity and nucleotide exchange [reviewed in 1, 3, 20, 21]. In contrast, the activity of Bacillus subtilis DnaA appears to be largely regulated by several proteins, all of which affect its ability to bind cooperatively to DNA [22–24].
We set out to analyze the binding properties of B. subtilis DnaA to target chromosomal sites, on a genomic scale, in vitro, in the absence of other proteins. We used in vitro DNA affinity purification and sequencing (IDAP-Seq), an approach that is an in vitro analog of chromatin immunoprecipitation or affinity purification followed by deep sequencing, ChIP-Seq or ChAP-Seq, respectively. In IDAP-Seq, purified his-tagged protein (DnaA-his) is mixed with genomic DNA, the DNA bound to protein is isolated by affinity purification, and the bound DNA is analyzed by high throughput DNA sequencing. This approach has been used to analyze DNA binding by the transcriptional regulator CodY [25–27].
Using IDAP-Seq, we defined individual DnaA binding sites throughout the genome, and compared their affinity for ATP-DnaA and ADP-DnaA over a range of DnaA concentrations. We generated a position specific scoring matrix (PSSM) that can be used to predict DnaA binding sites with improved accuracy compared to a simple consensus sequence. The vast majority of sites bound in vitro have not been observed in vivo, suggesting that the amount of DnaA in vivo is limiting, or that other factors prevent binding at these sites under normal growth conditions. Conversely, we found some sites that were bound by DnaA in vivo, but that were not bound in vitro, indicating that at least one additional factor was involved in binding in vivo. We found that the nucleoid associated protein Rok was required for DnaA to bind to these chromosomal regions in vivo. Our results demonstrate that IDAP-Seq data can be used to understand and compare inherent binding properties of different forms of a given protein under defined in vitro conditions. In addition, comparison of IDAP-Seq data with data from in vivo analyses can provide insights into binding regions that require additional factors in vivo.
Results and Discussion
Overview of in vitro DNA affinity purification and sequencing (IDAP-Seq)
The overall goal of our experiments was to identify all regions in the B. subtilis genome capable of binding DnaA, and to compare the binding properties of ATP-DnaA and ADP-DnaA to these regions to gain a better understanding of how DnaA binding is regulated. We incubated various concentrations of purified functional C-terminal hexa-histidine tagged DnaA (DnaA-his) with either ATP or ADP, and mixed each nucleotide-bound form of DnaA-his with purified sheared genomic DNA from B. subtilis. The ATPase activity of DnaA was very low under these conditions, hydrolyzing 2.2 ± 0.6 moles of ATP per mole of DnaA per hr (n = 6). This rate of hydrolysis would cause a small (≤0.2%) decrease in the concentration of ATP over the course of the incubations. Given the rapid rate of exchange between ATP and ADP [23], we expect that after addition of ATP most of the DnaA will be in the ATP-bound form. Genomic DNA with a uniform copy number along the chromosome and nearly random shearing pattern was used in these experiments, facilitating quantitative analysis of the data (see S1 Text). We isolated DnaA-his along with any bound DNA fragments, without crosslinking, using affinity resin for the hexa-histidine tag. We analyzed binding over a range of DnaA concentrations to compare binding at different chromosomal regions and to estimate apparent binding constants. The identity and amounts of genomic regions bound by DnaA were determined by deep sequencing (IDAP-Seq).
Binding of ATP-DnaA-his to genomic DNA in vitro
Using IDAP-seq, we identified the chromosomal regions that had increased binding by DnaA within the range of 55 nM to 4.1 μM DnaA. We found that the number of chromosomal regions bound and the amount of binding to individual regions increased with increasing concentrations of ATP-DnaA-his (Fig 1). There were no specific chromosomal regions recovered in control reactions with no added DnaA, as assessed by the distribution of sequencing reads over the genome (Fig 1A). In contrast, there were eight chromosomal regions predominantly associated with 55 nM ATP-DnaA-his following affinity purification (Fig 1B). These regions were the same as the major DnaA binding regions previously defined in vivo [8, 9, 12, 13, 28]. They have a greater number of DnaA boxes than the other regions detected in vitro that required higher concentrations of DnaA for binding. As the concentration of ATP-DnaA-his was increased (55 nM; 140 nM; 550 nM; 1.4 μM; 4.1 μM), binding to the eight predominant regions increased and appeared to become saturated (Fig 1B–1F and S1 Fig, panels 1–8). In addition, binding to many other regions was detected and increased with increasing concentrations of ATP-DnaA-his. Confirmation that binding was mediated by the DnaA-binding domain of DnaA was obtained for six of the regions, spanning a wide range of affinities, by performing a parallel assay with a mutant DnaA (DnaA∆C-his) that is missing the DNA binding domain (S2 Fig).

We identified 269 chromosomal regions that were bound by 1.4 μM ATP-DnaA-his (S1 Fig and S1 Table). This list includes all the regions that were bound at lower concentrations of DnaA, and also those that had increased binding at 4.1 μM DnaA. There was an approximately 300-fold difference in the amount of DNA detected from the weakest bound regions compared to the strongest sites at 1.4 μM ATP-DnaA-his, the second highest DnaA concentration tested. There were many additional regions bound at 4.1 μM ATP-DnaA-his, the highest concentration tested, that were not detected at the lower concentrations (Fig 1F). Because the amount of binding at these regions was low and was not detected at other concentrations of DnaA, they were not included in the list of binding regions (S1 Table).
The number of binding regions (269) determined in vitro is significantly greater than the previously known binding regions (eight) determined in vivo. Because several different analyses of in vivo binding did not detect these additional regions [8, 9, 12, 13, 28], it seems unlikely that all, or even most, of these 269 regions are occupied by DnaA in vivo. The much larger number of regions bound by DnaA in vitro could be due to a combination factors, including the much higher sensitivity of the in vitro system, the possibility that the amount of DnaA in vivo is limiting, and the fact that DnaA binding is regulated in vivo.
Analysis of binding regions at single nucleotide resolution
We used the IDAP-Seq data to visualize binding by DnaA at single nucleotide resolution (Figs 2 and 3 and S1). In these analyses, the number of sequence reads starting at a specific nucleotide position was determined, and the reads were extended and summed to generate a curve indicative of total binding. If a specific DNA sequence is required for binding, then no sequence reads should start in that region. At 1.4 μM ATP-DnaA-his, the binding patterns for the strongest binding regions with multiple DnaA boxes were complex (Fig 2A–2H), often having plateaus and multiple peaks of read start sites. In contrast, other regions with fewer DnaA boxes typically had a single, well-defined peak on each strand (Figs 2I–2L and 3A–3D).


Analyses and visualization of the binding regions at single nucleotide resolution provided insights into the requirements and contributions of individual DnaA boxes. A characteristic almost symmetric pattern of sequence reads beginning on either side of an otherwise "bare" region was indicative of a simple binding region containing a single DnaA box (Fig 3A and 3B). This footprint-like region defines the binding site and can be used to determine binding sites for uncharacterized proteins. Similarly, a larger bare region flanked by sequence reads on opposite strands was indicative of two binding sites, both of which appear to be required for DnaA to bind the region (Fig 3C and 3D). In more complex regions (e.g., Fig 3E), some DnaA boxes (numbered 1 and 2) appeared to make partial contributions to binding, as evidenced by an abrupt decrease in, but not a complete elimination of, reads at the junctions of the DnaA boxes. In contrast, DnaA boxes 3 and 4 appeared to be required for binding, since no sequence reads started in or between them.
The strongest binding regions contain arrays of DnaA boxes, and had complex binding patterns (Fig 2A–2H and 3F and 3G). In addition to DNA fragments that contained the complete array of DnaA boxes, fragments were also efficiently recovered that had one end within the array and therefore contained only a subset of the DnaA boxes. The requirement for specific DnaA boxes varied with the DnaA concentration. For example, in the sda promoter region, DnaA boxes 4, 5, 6, and 7 (Fig 3F) were required for binding at the lowest concentration (55 nM) of ATP-DnaA-his tested. However, at the highest ATP-DnaA-his concentration (4.1 μM), fragments were efficiently recovered as long as they contained either DnaA boxes 1 and 2 or DnaA boxes 6 and 7 (Fig 3G). The finding that DnaA boxes 1 and 2 contribute to binding is consistent with in vivo results showing that these sites are important for full activation of transcription of sda by DnaA, and that a mutation in either of these individual DnaA boxes causes a reduction in sda expression [7].
The single nucleotide resolution afforded by IDAP-seq is somewhat reminiscent of the resolution obtained with DNA footprinting. Published footprinting data for DnaA binding to B. subtilis DNA is available for two sites: the dnaA promoter region, and the region upstream of the DUE [30]. About half of the DnaA boxes observed by footprinting of these regions were directly supported by our IDAP-seq data. For the remaining footprinted sites, it was not possible to determine whether or not they were bound in our assay. This is because the IDAP-seq method is more analogous to a single nucleotide truncation analysis than footprinting, and in regions that contain arrays of DnaA boxes (including the dnaA promoter and the DUE), removal of one DnaA box from the end will not always give a robust change in DNA recovery if its contribution is small compared the remaining DnaA boxes.
Position-specific scoring matrix for DnaA binding sites
We used a subset of the binding data to establish a position-specific scoring matrix (PSSM) that predicted DnaA binding sites more effectively than a simple consensus sequence. When we searched for potential DnaA binding sites based on the consensus sequence 5'-TTATNCACA-3' [31] we found that restricting the search to one mismatch was overly stringent, whereas allowing two mismatches from the consensus resulted in an excessive number of predicted DnaA boxes throughout the genome. A PSSM was developed to more accurately predict the binding sites observed in our experiments.
We derived a PSSM from 150 DnaA box sequences (S2 Table) that were observed to bind DnaA in our IDAP-Seq data. Whereas the PSSM (Fig 4A and S3 Table) was consistent with the previously determined consensus sequence, it provided a more sensitive measure of the extent to which mismatches are tolerated at each position. We predicted a total of 11,353 DnaA boxes over the whole genome using the PSSM, and in general these putative DnaA boxes were more closely correlated with binding than boxes predicted using the consensus sequence with up to two mismatches (e.g., Fig 4B–4E). In many instances, the PSSM identified functional DnaA boxes that had three mismatches from the consensus (asterisks in Fig 4D and 4E). In contrast, using the consensus sequence and allowing three mismatches predicted one DnaA box every 17 bp of genomic sequence. The vast majority of the 269 regions bound by ATP-DnaA-his contained at least one DnaA box centered at the peak summit or two DnaA boxes flanking the peak summit (S1 Fig and S4 Table). A total of 784 predicted DnaA boxes were found within 150 bp of the summits of these 269 binding regions. A Pearson’s correlation coefficient of 0.74 was observed between the amount of binding observed at each region and how well the DnaA boxes in that region matched the PSSM (S4 Fig).

Many additional predicted DnaA boxes were bound at 4.1 μM ATP-DnaA-his, and others might require yet higher DnaA concentrations to bind. In addition, there are almost certainly some predicted DnaA boxes that are not functional, either because of limitations in the PSSM itself, or due to that fact that the PSSM approach does not take into consideration other factors that could influence binding, including flanking sequences and the number, orientation, and spacing of nearby DnaA boxes.
Apparent binding constants for several regions throughout the genome
We used the IDAP-Seq data to estimate apparent dissociation constants for several of the 269 regions bound at 1.4 μM ATP-DnaA-his. We plotted the amount of DNA recovered as a function of ATP-DnaA-his concentration for each of the 269 binding regions (Figs 5 and S1). For each region the nucleotide position with the maximum amount of DNA (peak summit) was identified, and the relative number of DNA fragments that spanned that position was determined at each DnaA concentration (Materials and Methods; S3 Fig). Genomic DNA (~300 μM of base pairs) was used in the binding reactions, providing an excess of non-specific DNA for competition in binding to DnaA.

For regions with high affinity, the amount of DNA recovered became saturated as the ATP-DnaA-his concentration was increased (Fig 5A–5H). For regions with intermediate affinity, the amount of DNA recovered appeared to begin to saturate at the highest concentration of ATP-DnaA-his (Fig 5I and 5J). For the remaining regions, the amount of DNA recovered increased with the concentration of ATP-DnaA-his, but did not reach saturation (e.g., Fig 5K and 5L). Evaluating relative binding for the weaker binding regions can be done by comparing the relative amount of DNA recovered at 1.4 or 4.1 μM DnaA (S1 Table). DnaA binding to almost all regions was cooperative, consistent with the positive cooperative binding previously observed for B. subtilis DnaA [22–24, 30].
The apparent binding constants determined by IDAP-seq for the eight high affinity binding sites ranged from 0.13–0.33 μM (Table 1, S1 Table), and were several-fold greater than those determined previously by gel mobility shift assays [22, 23]. Although IDAP-seq measurements have inherently higher error owing to the complex experimental protocol, the higher Kd’s can be attributed, in large part, to washing the bound complexes in the IDAP experiments and the absence of caging effects from gel electrophoresis. In gel mobility shift assays, the complexes are loaded directly on a gel, where caging effects of the gel matrix stabilize binding. Other factors, including the heterogeneous nature of the DNA template for binding, the presence of multiple binding regions with similar affinities, and the excess of competitor DNA in the IDAP-Seq experiments, likely also contribute to the higher apparent Kd’s determined with IDAP-Seq compared to those determined by gel shift assays. These differences between IDAP-Seq and gel mobility shift assays likely also affect estimates of cooperativity.
Comparisons of binding by ATP-DnaA-his to that of ADP-DnaA-his
We found that the overall binding patterns for ADP-DnaA-his (S5 Fig) were similar to those for ATP-DnaA-his (Fig 1). At the lowest concentration of DnaA tested, the prominent binding regions were the same eight regions that were bound by ATP-DnaA-his, and the number of bound regions increased at higher concentrations of ADP-DnaA-his (S5 Fig). The amount of binding to any specific region at a given concentration of DnaA was almost always greater with ATP-DnaA-his than with ADP-DnaA-his. This is seen by comparing the ratio of binding (amount of DNA recovered) by ATP-DnaA-his to that by ADP-DnaA-his (Fig 6A). Two regions (the yydA promoter region and the region in oriC between dnaA and dnaN) appeared to have a small preference for ADP-DnaA-his over ATP-DnaA-his, but only at 1.4 μM DnaA (Fig 6A and 6G).

A few regions had a strong preference for ATP-DnaA-his (Fig 6A). Among the eight high affinity regions, the most dramatic differences between ATP-DnaA-his and ADP-DnaA-his were observed in the sda promoter region and the region between the 3’ ends of gcp and ydiF (Fig 6A and 6B and 6C). Approximately 50-fold more DNA from the sda promoter region was recovered with 55 nM ATP-DnaA-his than with 55 nM ADP-DnaA-his. For the region between gcp and ydiF, this difference was 16-fold. The differences between ATP - and ADP-DnaA-his diminished at higher DnaA concentrations as binding became saturated.
Large differences between binding by ATP-DnaA-his and ADP-DnaA-his were also observed for weaker binding regions. For example, there was detectable binding to yhcN by ATP-DnaA-his at a concentration of 140 nM, whereas binding by ADP-DnaA-his was not detected until 550 nM (Fig 6A and 6D). At 550 nM DnaA, there was 73-fold more yhcN DNA bound to ATP-DnaA-his compared to ADP-DnaA-his. Similarly, there was 24-fold more yhdF bound to 550 nM ATP-DnaA-his compared to ADP-DnaA-his (Fig 6A and 6E). Although we cannot be certain that homogeneous DnaA-ATP or DnaA-ADP was present in the respective reactions, if heterogeneity did exist, it would cause an underestimate of the differences between DnaA-ATP and DnaA-ADP.
The basis for some DnaA sites exhibiting much higher affinity for ATP-DnaA than ADP-DnaA is almost certainly due to a combination of factors, including the sequence, orientation and spacing of the DnaA boxes, and the sequences flanking the DnaA boxes. There are not enough regions to define the features that contribute to the large differences.
The dnaA-dnaN oriC region
The oriC region includes two clusters of DnaA binding sites: one in the dnaA promoter region (Fig 2A), and the other between dnaA and dnaN (Fig 2B), just upstream of the DNA unwinding element (DUE). The difference between the nucleotide bound forms for these oriC binding regions are fairly modest—a maximal difference is seen at 140 nM DnaA-his, where 3–4 times more DNA is bound with ATP compared to ADP (Fig 6A and 6F and 6G). It is likely that in vivo, DnaA is bound to the oriC sites regardless of whether DnaA is in the ATP or ADP bound form. Thus far, none of the known regulators of replication initiation in B. subtilis affect nucleotide binding, exchange, or hydrolysis by DnaA. Rather, the four characterized regulators of replication initiation in B. subtilis, YabA [22, 33, 34], Soj [24], SirA [35–37], and DnaD [23, 34], all affect the ability of DnaA to bind DNA. Our findings that DnaA binding to the oriC region is not particularly sensitive to the nucleotide bound state of DnaA are consistent with the emerging view that regulation of nucleotide hydrolysis and exchange may not play a predominant role in the regulation of replication initiation in B. subtilis, in contrast to the regulation in E. coli [6, 38].
sda
Whereas the activity of DnaA during replication initiation appears to be regulated primarily at the level of oligomerization (rather than nucleotide binding) this is not necessarily the case when DnaA functions as a transcription factor. Our finding that ATP-bound DnaA binds to the sda promoter region much more strongly than the ADP-bound form may point to an important role for bound nucleotide in transcriptional regulation at this locus, and perhaps other loci where DnaA functions as a transcriptional regulator.
The sda gene product inhibits activation of Spo0A [7, 10, 11], a transcription factor that functions during stationary phase and sporulation. DnaA activates transcription of sda in vivo, thereby inhibiting entry into sporulation. Because the Sda protein is highly unstable [39], changes in transcription of sda will result in rapid changes in Sda protein levels.
Our findings indicate that transcription from the sda promoter may be highly sensitive to the relative amounts of ATP - and ADP-DnaA. These changes could occur due to modulation of the nucleotide hydrolysis and exchange activities of DnaA, or due to changes in the cellular ratio of ATP and ADP. Further studies will be needed to determine whether these potential mechanisms are important in vivo for DnaA/Sda-mediated activation of stationary phase and sporulation gene expression pathways.
Comparisons of DnaA binding in vitro and in vivo
Our in vitro data on DnaA binding provides a framework for interpreting in vivo DnaA ChIP results, and vice versa. We anticipated three general types of findings when comparing in vitro to in vivo binding by DnaA: 1) binding is detected both in vitro and in vivo; 2) binding is detected in vitro but not in vivo; and 3) binding is detected in vivo, but is not detected in vitro.
Of the 269 binding regions identified in vitro at 1.4 μM ATP-DnaA-his, only the eight strongest binding regions have been readily detected in vivo [8, 9, 12, 13]. The next strongest binding regions in vitro were within the open reading frames of codV (encoding a homologue of the tyrosine recombinase XerC), and rplB (encoding ribosomal protein L2) (Table 1). We estimated that the in vivo concentration of DnaA is ~1–2.5 μM in cells growing exponentially in minimal glucose medium at 30°C. The amount of binding at rplB in vitro at the 1.4 and 4.1 μM ATP-DnaA-his concentrations is 28–46% that observed for the eight sites that are readily observed in vivo. If no other factors affect binding, then this indicates that DnaA could bind rplB in a significant fraction of cells. Instead we found no detectable DnaA binding to rplB in vivo using ChIP-PCR.
We suspect that there are factors in vivo that prevent DnaA from binding to the site within rplB. For example, since the binding site is within the rplB open reading frame, it is possible that transcription prevents stable association of DnaA with the site. Alternatively, the concentration of available DnaA might be limited by titration due to efficient binding at other regions [e.g., 40]. It is also possible that there is some binding in vivo, but that it is below the limit of detection of the ChIP-PCR assay, or that binding occurs under biological conditions that we have not assayed.
DnaA depends on Rok in vivo to bind to some chromosomal regions
We used ChIP-PCR to measure DnaA binding in vivo at four regions that we observed to bind DnaA in preliminary in vivo ChIP-seq experiments. These regions had not been identified in previously reported in vivo ChIP experiments with DnaA [8, 9, 12, 13], perhaps due to lower sensitivity of the detection methods. These are all intergenic regions (between: ywiB-sboA, yuzB-yutJ, yjcM-yjcN, and icsS-braB) and contain promoters in one or both directions [41]. We found that DnaA was consistently associated with these regions in ChIP-PCR experiments (n = 6; Table 2), with mean fold enrichment values ranging from 4.5 (iscS) to 12.8 (sboA), compared to 83-fold for the dnaA promoter, a control site that is readily detected in vivo [8, 9, 12, 13, 28].
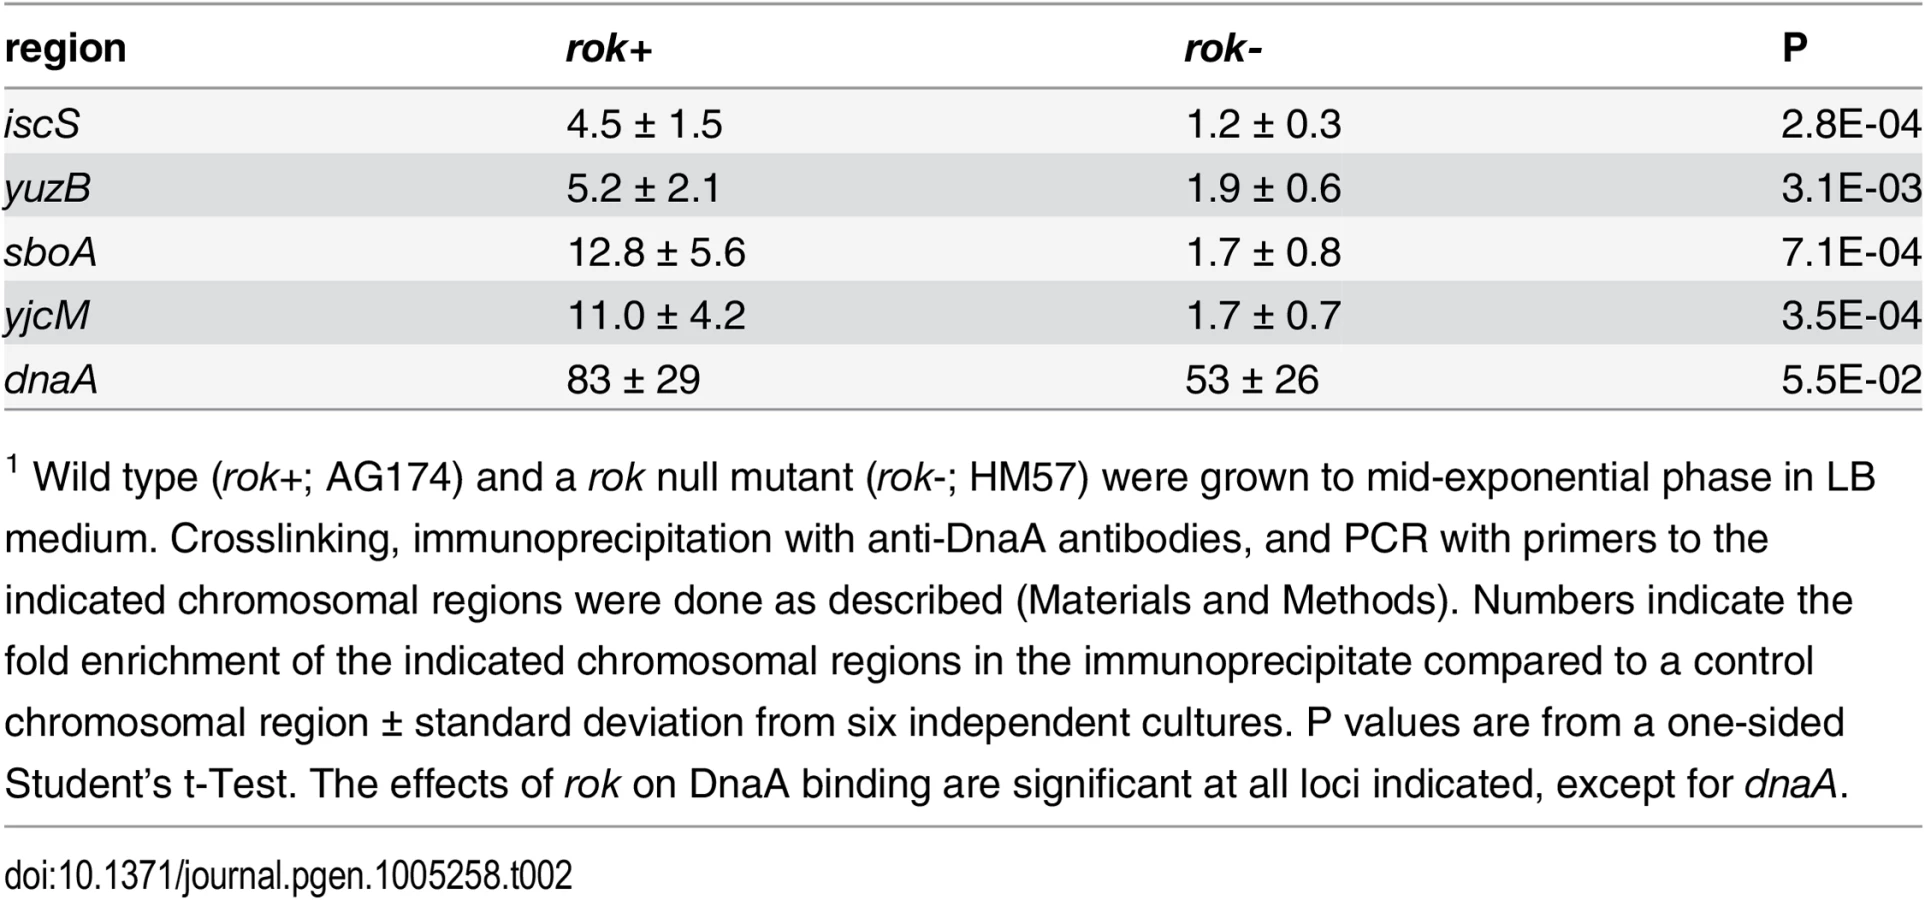
Interestingly, none of these four regions bound DnaA in vitro in our IDAP-seq experiments, even at the highest concentration of DnaA tested. Furthermore, only the sboA region has a recognizable DnaA box near the in vivo binding site. The simple interpretation of these results is that there is a factor needed for binding in vivo that is not present in the purified in vitro binding reactions. Because three of these four regions bound by DnaA in vivo but not in vitro were previously found to be bound in vivo by the nucleoid-associated protein Rok [42], we tested whether Rok might be required for DnaA binding at these regions in vivo. In a rok null mutant, there was much less association of DnaA with these regions compared to wild type cells (Table 2). DnaA protein levels are not substantially different in rok null mutant cells (S6 Fig), indicating that the loss of binding was not due to a decreased amount of DnaA. Consistent with this, binding at the dnaA promoter, which has 12 DnaA boxes and binds DnaA robustly in vitro, was not significantly different between wild type and rok mutant cells (Table 2). These results indicate that Rok is required for association of DnaA with these chromosomal regions in vivo.
General utility of IDAP-Seq approach
The IDAP-Seq approach used here to study DNA binding by DnaA should be a useful for determining the inherent binding properties of many different proteins, and the effects of various ligands, such as the ATP and ADP comparison presented here. It should also be possible to determine the effects of mutations, phosphorylation, acetylation, and other modifications on DNA binding. The effects of regulatory proteins that modulate binding could also be evaluated, provided the two proteins do not have the same tag. In all cases, apparent binding constants can be determined and compared for sites throughout the entire genome.
Experiments to date with DnaA and CodY [25–27] used a his-tagged version of the DNA binding protein, with DNA-protein complexes recovered by metal affinity chromatography. Other tags could potentially be used for purification of complexes. In preliminary experiments, we found that filter binding, which does not require a tag, can also be used to recover DNA-protein complexes. Antibodies could also be used to recover DNA-protein complexes with or without a tag. Our experiments were performed without crosslinking, but for weaker binding proteins, where initially bound fragments might be lost in wash steps, crosslinking protein to DNA could be used in a more standard ChIP-type experiment, either with immunoprecipitation, affinity purification, or filter binding of crosslinked protein-DNA complexes. Comparing in vitro studies of genomic binding using the IDAP-Seq method with more traditional in vivo ChIP experiments should provide valuable clues about how the activities of DNA binding proteins are modulated in cells.
Materials and Methods
Purification of hexa-histidine-tagged DnaA, preparation of sheared genomic DNA, refinement of the catalog of DnaA binding regions, and development of the DnaA box PSSM are described in S1 Text.
DnaA-his
B. subtilis DnaA with the amino acids AAALEHHHHHH added to the C-terminus of DnaA was purified from E. coli (S1 Text). Final DnaA-his preparations were typically 98% pure. A similarly his-tagged DnaA (with 12 instead of six histidines) is functional in vivo [9].
Affinity purification of DNA:DnaA-his complexes
Binding reactions (in 250 μl) were done with DnaA-his (at concentrations of 0, 55 nM, 140 nM, 550 nM, 1.4 μM, and 4.1 μM) and sheared genomic DNA (0.2 mg/ml) in 40 mM HEPES-KOH, pH 7.6, 150 mM potassium glutamate, 2.5 mM ATP or ADP, 10 mM magnesium acetate, 0.2 mM DTT, 50 μg/ml BSA, 0.1 mM EDTA, 20% glycerol, and 4% sucrose for 30 min at room temperature. Genomic DNA was purified from a dnaBts mutant [29, 43, 44]. DnaA-his was bound with nucleotide by preincubating in storage buffer with 2.5 mM ATP or ADP on ice for two hours immediately before using in binding reactions, as described previously [23].
Each reaction was mixed with 100 μl Talon Co+ resin (Clontech) pre-equilibrated with equilibration/wash buffer (40 mM HEPES-KOH, pH 7.6, 150 mM potassium glutamate, 2.5 mM ATP or ADP, 10 mM magnesium acetate, 50 μg/ml BSA, 20% glycerol) and rotated for 30 min at room temperature. Each mixture was transferred to a Poly-Prep column (Bio-Rad, Hercules, CA), and washed three times with 1 ml equilibration/wash buffer, with care taken to ensure that all washes were done under virtually identical conditions. Complexes of DnaA-his bound to DNA were eluted by adding 0.5 ml ChIP elution buffer (50 mM Tris-HCl, pH 8.0, 10 mM EDTA, 1% SDS), capping the bottoms and covering the tops of the columns tightly with foil, and incubating at 65°C for 15 min. The eluate was collected, and the resin was washed twice with 200 μl ChIP elution buffer to recover all of the eluted DNA. The recovered DNA was purified using a QiaQuick PCR purification kit (Qiagen).
DNA sequencing
Sample preparation, including incorporation of a 3’ barcode, selection of 200–400 bp fragments (after addition of adaptors and amplification), and single read sequencing (40 nt) on an Illumina HiSeq were performed by the MIT BioMicro Center.
Seq data processing and peak calling algorithm
Alignment of DNA fragments bound by DnaA-his to the genome of AG1839 (a.k.a., KPL69; GenBank accession number CP008698) [29] was performed using Bowtie [45], with adjustments to compensate for the fact that the chromosome is circular. Peak calling on the 1.4 μM and 4.1 μM ATP-DnaA-his data was done using cisGenome v. 2.0 [46], and in some cases PeakSplitter [47], and visualized in the genome browser MochiView [48] for manual refinement (see S1 Text for details). The genome position of the summit of each peak was determined using data from the 4.1 μM ATP-DnaA-his binding reaction, because the peaks (especially the weaker ones) were better defined at this DnaA concentration. Seq data are available at NCBI under accession SRX648534.
Quantitation of binding and determination of apparent binding constants
To determine the amount of DNA bound by DnaA-his for each chromosomal region, we determined the number of sequence reads across that region. Each sequence read (mapped to the chromosome using Bowtie) was computationally extended by the estimated average fragment length of 250 base pairs (presented schematically in S3A and S3B Fig). The relative coverage at each bp along the chromosome was obtained by summing the number of fragments on both the positive and negative strands that are inferred to span that position (S3C Fig). Custom R scripts were used for these steps. The resulting coverage map allowed different regions along the chromosome to be compared for any given sample.
To compare individual loci under a variety of binding conditions (e.g., ATP v. ADP, or at different concentrations of DnaA), we normalized the number of sequence reads (coverage map amplitudes) to the total amount of DNA recovered in each reaction (S1 Text, S3D–S3G Fig). The amount of DNA that was recovered in each sample increased with increasing amounts DnaA (S3F Fig), due to 1) increases in background binding, 2) increases in binding at regions that have not yet reached saturation, and 3) binding at new weaker binding regions. Measurements of the maximum binding following normalization vs. DNA concentration gave data that could be fit to a binding curve (S3H Fig).
Apparent Kd’s were determined using Prism5 (GraphPad Software). Data were fit to the equation y = (Bmax)(xn)/(Kdn + xn), where Bmax is maximum binding, x is the DnaA-his concentration, y was the amount of binding observed, and n is the Hill constant. For each binding region, the position of the peak was determined in the 4.1 μM DnaA dataset, and the peak height at the same position was determined for the lower DnaA concentrations and used as the amount of binding. For binding regions that approached saturation, Bmax was fitted from the binding data. For several binding regions, Bmax could be determined for ATP - but not ADP-DnaA-his binding. In these cases, the Bmax determined for ATP-DnaA-his was used to fit the ADP-DnaA-his data. In all other instances, Bmax of 0.8 was used to determine an apparent Kd.
Annotation of DnaA boxes
DnaA boxes in the B. subtilis genome were annotated using the PSSM generated as part of this study (S1 Text). This PSSM was used to search the genome sequence of AG1839 genome using RSAT [49] with a p-value cutoff of ≤ 0.0015. Where overlapping DnaA boxes were detected, the one with the higher p-value was discarded. This collection of DnaA boxes was used in all figures and tables. A “DnaA Box Score” for the binding regions was calculated by summing the negative log of the P-value from the PSSM for each binding region.
In vivo DnaA ChIP-PCRs and strains used
DnaA binding to specific chromosomal regions in vivo was determined by ChIP followed by quantitative PCR (ChIP-PCR). Wild type (AG174; genotype: trp, phe) and rok null mutant {HM57; genotype: trp, phe, rok::pDG641rok (mls)} cells were grown at 37°C in LB medium. (The rok null mutation is an integration of plasmid pDG641rok into rok by single crossover, disrupting the rok open reading frame.) Cells in mid-exponential phase were treated with 1% formaldehyde for 20 min to crosslink protein and DNA. Crosslinking was quenched by adding glycine (0.22 M). Preparation of lysates and immunoprecipitations were done essentially as describe previously [50]. DnaA was immunoprecipitated with rabbit polyclonal antiserum and the DNA was recovered using a QiaQuick PCR purification kit (Qiagen). Quantitative PCR was performed on a Roche LightCycler 480, with reduced annealing (48°C), extension (68°C), and acquisition (63°C) temperatures to compensate for the low melting temperatures of many of the loci being examined. Fold-enrichments were calculated as described in [51], using nicK, a region in ICEBs1 [52] that does not bind DnaA, for normalization. The primer pairs used are listed in S5 Table.
Supporting Information
Zdroje
1. Kaguni JM. DnaA: controlling the initiation of bacterial DNA replication and more. Annu Rev Microbiol. 2006;60 : 351–75. 16753031
2. Mott ML, Berger JM. DNA replication initiation: mechanisms and regulation in bacteria. Nat Rev Microbiol. 2007 May;5(5):343–54. 17435790
3. Leonard AC, Grimwade JE. Regulating DnaA complex assembly: it is time to fill the gaps. Curr Opin Microbiol. 2010 Dec;13(6):766–72. doi: 10.1016/j.mib.2010.10.001 21035377
4. Kawakami H, Katayama T. DnaA, ORC, and Cdc6: similarity beyond the domains of life and diversity. Biochem Cell Biol. 2010 Feb;88(1):49–62. doi: 10.1139/o09-154 20130679
5. Duderstadt KE, Berger JM. AAA+ ATPases in the initiation of DNA replication. Crit Rev Biochem Mol Biol. 2008 May-Jun;43(3):163–87. doi: 10.1080/10409230802058296 18568846
6. Katayama T, Ozaki S, Keyamura K, Fujimitsu K. Regulation of the replication cycle: conserved and diverse regulatory systems for DnaA and oriC. Nat Rev Microbiol. 2010 Mar;8(3):163–70. doi: 10.1038/nrmicro2314 20157337
7. Burkholder WF, Kurtser I, Grossman AD. Replication initiation proteins regulate a developmental checkpoint in Bacillus subtilis. Cell. 2001 Jan 26;104(2):269–79. 11207367
8. Breier AM, Grossman AD. Dynamic association of the replication initiator and transcription factor DnaA with the Bacillus subtilis chromosome during replication stress. J Bacteriol. 2009 Jan;191(2):486–93. doi: 10.1128/JB.01294-08 19011033
9. Ishikawa S, Ogura Y, Yoshimura M, Okumura H, Cho E, Kawai Y, et al. Distribution of stable DnaA-binding sites on the Bacillus subtilis genome detected using a modified ChIP-chip method. DNA Res. 2007 Aug;14(4):155–68. 17932079
10. Hoover SE, Xu W, Xiao W, Burkholder WF. Changes in DnaA-dependent gene expression contribute to the transcriptional and developmental response of Bacillus subtilis to manganese limitation in Luria-Bertani medium. J Bacteriol. 2010 Aug;192(15):3915–24. doi: 10.1128/JB.00210-10 20511500
11. Veening JW, Murray H, Errington J. A mechanism for cell cycle regulation of sporulation initiation in Bacillus subtilis. Genes Dev. 2009 Aug 15;23(16):1959–70. doi: 10.1101/gad.528209 19684115
12. Smits WK, Merrikh H, Bonilla CY, Grossman AD. Primosomal proteins DnaD and DnaB are recruited to chromosomal regions bound by DnaA in Bacillus subtilis. J Bacteriol. 2011 Nov 19;193(3):640–8. doi: 10.1128/JB.01253-10 21097613
13. Cho E, Ogasawara N, Ishikawa S. The functional analysis of YabA, which interacts with DnaA and regulates initiation of chromosome replication in Bacillus subtils. Genes Genet Syst. 2008 Apr;83(2):111–25. 18506095
14. Fuller RS, Funnell BE, Kornberg A. The dnaA protein complex with the E. coli chromosomal replication origin (oriC) and other DNA sites. Cell. 1984 Oct;38(3):889–900. 6091903
15. Simmons LA, Felczak M, Kaguni JM. DnaA Protein of Escherichia coli: oligomerization at the E. coli chromosomal origin is required for initiation and involves specific N-terminal amino acids. Mol Microbiol. 2003 Aug;49(3):849–58. 12864864
16. Miller DT, Grimwade JE, Betteridge T, Rozgaja T, Torgue JJ, Leonard AC. Bacterial origin recognition complexes direct assembly of higher-order DnaA oligomeric structures. Proc Natl Acad Sci U S A. 2009 Nov 3;106(44):18479–84. doi: 10.1073/pnas.0909472106 19833870
17. Felczak MM, Kaguni JM. The box VII motif of Escherichia coli DnaA protein is required for DnaA oligomerization at the E. coli replication origin. J Biol Chem. 2004 Dec 3;279(49):51156–62. 15371441
18. Krause M, Ruckert B, Lurz R, Messer W. Complexes at the replication origin of Bacillus subtilis with homologous and heterologous DnaA protein. J Mol Biol. 1997 Dec 5;274(3):365–80. 9405146
19. Speck C, Weigel C, Messer W. ATP - and ADP-dnaA protein, a molecular switch in gene regulation. EMBO J. 1999 Nov 1;18(21):6169–76. 10545126
20. Skarstad K, Katayama T. Regulating DNA replication in bacteria. Cold Spring Harb Perspect Biol. 2013 Apr;5(4):a012922. doi: 10.1101/cshperspect.a012922 23471435
21. Leonard AC, Grimwade JE. Regulation of DnaA assembly and activity: taking directions from the genome. Annu Rev Microbiol. 2011;65 : 19–35. doi: 10.1146/annurev-micro-090110-102934 21639790
22. Merrikh H, Grossman AD. Control of the replication initiator DnaA by an anti-cooperativity factor. Mol Microbiol. 2011 Oct;82(2):434–46. doi: 10.1111/j.1365-2958.2011.07821.x 21895792
23. Bonilla CY, Grossman AD. The primosomal protein DnaD inhibits cooperative DNA binding by the replication initiator DnaA in Bacillus subtilis. J Bacteriol. 2012 Sep;194(18):5110–7. doi: 10.1128/JB.00958-12 22821970
24. Scholefield G, Errington J, Murray H. Soj/ParA stalls DNA replication by inhibiting helix formation of the initiator protein DnaA. EMBO J. 2012 Mar 21;31(6):1542–55. doi: 10.1038/emboj.2012.6 22286949
25. Majerczyk CD, Dunman PM, Luong TT, Lee CY, Sadykov MR, Somerville GA, et al. Direct targets of CodY in Staphylococcus aureus. J Bacteriol. 2010 Jun;192(11):2861–77. doi: 10.1128/JB.00220-10 20363936
26. Belitsky BR, Sonenshein AL. Genome-wide identification of Bacillus subtilis CodY-binding sites at single-nucleotide resolution. Proc Natl Acad Sci U S A. 2013 Apr 23;110(17):7026–31. doi: 10.1073/pnas.1300428110 23569278
27. Chateau A, van Schaik W, Joseph P, Handke LD, McBride SM, Smeets FM, et al. Identification of CodY targets in Bacillus anthracis by genome-wide in vitro binding analysis. J Bacteriol. 2013 Mar;195(6):1204–13. doi: 10.1128/JB.02041-12 23292769
28. Goranov AI, Katz L, Breier AM, Burge CB, Grossman AD. A transcriptional response to replication status mediated by the conserved bacterial replication protein DnaA. Proc Natl Acad Sci U S A. 2005 Sep 6;102(36):12932–7. 16120674
29. Smith JL, Goldberg JM, Grossman AD. Complete genome sequences of Bacillus subtilis subtilis laboratory strains JH642 (AG174) and AG1839. Genome Announc. 2014;2(4):e00663–14. doi: 10.1128/genomeA.00663-14 24994804
30. Fukuoka T, Moriya S, Yoshikawa H, Ogasawara N. Purification and characterization of an initiation protein for chromosomal replication, DnaA, in Bacillus subtilis. J Biochem (Tokyo). 1990 May;107(5):732–9. 2168872
31. Messer W. The bacterial replication initiator DnaA. DnaA and oriC, the bacterial mode to initiate DNA replication. FEMS Microbiol Rev. 2002 Nov;26(4):355–74. 12413665
32. Crooks GE, Hon G, Chandonia JM, Brenner SE. WebLogo: a sequence logo generator. Genome Res. 2004 Jun;14(6):1188–90. 15173120
33. Goranov AI, Breier AM, Merrikh H, Grossman AD. YabA of Bacillus subtilis controls DnaA-mediated replication initiation but not the transcriptional response to replication stress. Mol Microbiol. 2009 Oct;74(2):454–66. doi: 10.1111/j.1365-2958.2009.06876.x 19737352
34. Scholefield G, Murray H. YabA and DnaD inhibit helix assembly of the DNA replication initiation protein DnaA. Mol Microbiol. 2013 Aug 5;90(1):147–59. doi: 10.1111/mmi.12353 23909787
35. Rahn-Lee L, Gorbatyuk B, Skovgaard O, Losick R. The conserved sporulation protein YneE inhibits DNA replication in Bacillus subtilis. J Bacteriol. 2009 Jun;191(11):3736–9. doi: 10.1128/JB.00216-09 19329632
36. Wagner JK, Marquis KA, Rudner DZ. SirA enforces diploidy by inhibiting the replication initiator DnaA during spore formation in Bacillus subtilis. Mol Microbiol. 2009 Sep;73(5):963–74. doi: 10.1111/j.1365-2958.2009.06825.x 19682252
37. Rahn-Lee L, Merrikh H, Grossman AD, Losick R. The sporulation protein SirA inhibits the binding of DnaA to the origin of replication by contacting a patch of clustered amino acids. J Bacteriol. 2011 Mar;193(6):1302–7. doi: 10.1128/JB.01390-10 21239581
38. Zakrzewska-Czerwinska J, Jakimowicz D, Zawilak-Pawlik A, Messer W. Regulation of the initiation of chromosomal replication in bacteria. FEMS Microbiol Rev. 2007 Jul;31(4):378–87. 17459114
39. Ruvolo MV, Mach KE, Burkholder WF. Proteolysis of the replication checkpoint protein Sda is necessary for the efficient initiation of sporulation after transient replication stress in Bacillus subtilis. Mol Microbiol. 2006 Jun;60(6):1490–508. 16796683
40. Okumura H, Yoshimura M, Ueki M, Oshima T, Ogasawara N, Ishikawa S. Regulation of chromosomal replication initiation by oriC-proximal DnaA-box clusters in Bacillus subtilis. Nucleic Acids Res. 2012 Jan;40(1):220–34. doi: 10.1093/nar/gkr716 21911367
41. Nicolas P, Mader U, Dervyn E, Rochat T, Leduc A, Pigeonneau N, et al. Condition-dependent transcriptome reveals high-level regulatory architecture in Bacillus subtilis. Science. 2012 Mar 2;335(6072):1103–6. doi: 10.1126/science.1206848 22383849
42. Smits WK, Grossman AD. The transcriptional regulator Rok binds A+T-rich DNA and is involved in repression of a mobile genetic element in Bacillus subtilis. PLoS Genet. 2010;6(11):e1001207. doi: 10.1371/journal.pgen.1001207 21085634
43. Callister H, Le Mesurier S, Wake RG. Initiation of deoxyribonucleic acid replication in germinating spores of Bacillus subtilis 168 carrying the dnaB (Ts)134 mutation. J Bacteriol. 1977 Jun;130(3):1030–7. 405369
44. Rokop ME, Auchtung JM, Grossman AD. Control of DNA replication initiation by recruitment of an essential initiation protein to the membrane of Bacillus subtilis. Mol Microbiol. 2004 Jun;52(6):1757–67. 15186423
45. Langmead B, Trapnell C, Pop M, Salzberg SL. Ultrafast and memory-efficient alignment of short DNA sequences to the human genome. Genome Biol. 2009;10(3):R25. doi: 10.1186/gb-2009-10-3-r25 19261174
46. Ji H, Jiang H, Ma W, Johnson DS, Myers RM, Wong WH. An integrated software system for analyzing ChIP-chip and ChIP-seq data. Nat Biotechnol. 2008 Nov;26(11):1293–300. doi: 10.1038/nbt.1505 18978777
47. Salmon-Divon M, Dvinge H, Tammoja K, Bertone P. PeakAnalyzer: genome-wide annotation of chromatin binding and modification loci. BMC Bioinformatics. 2010;11 : 415. doi: 10.1186/1471-2105-11-415 20691053
48. Homann OR, Johnson AD. MochiView: versatile software for genome browsing and DNA motif analysis. BMC Biol. 2010;8 : 49. doi: 10.1186/1741-7007-8-49 20409324
49. Thomas-Chollier M, Defrance M, Medina-Rivera A, Sand O, Herrmann C, Thieffry D, et al. RSAT 2011: regulatory sequence analysis tools. Nucleic Acids Res. 2011 Jul;39(Web Server issue):W86–91. doi: 10.1093/nar/gkr377 21715389
50. Lin DC, Grossman AD. Identification and characterization of a bacterial chromosome partitioning site. Cell. 1998 Mar 6;92(5):675–85. 9506522
51. Merrikh H, Machón C, Grainger WH, Grossman AD, Soultanas P. Co-directional replication-transcription conflicts lead to replication restart. Nature. 2011 Feb 24;470(7335):554–7. doi: 10.1038/nature09758 21350489
52. Lee CA, Grossman AD. Identification of the origin of transfer (oriT) and DNA relaxase required for conjugation of the integrative and conjugative element ICEBs1 of Bacillus subtilis. J Bacteriol. 2007 Oct;189(20):7254–61. 17693500
Štítky
Genetika Reprodukční medicínaČlánek vyšel v časopise
PLOS Genetics
2015 Číslo 5
- Kazuistika – Perspektivy využití precizované medicíny v rámci personalizované specifické terapie onkologických pacientů
- Nobelova cena za chemii pro genetické nůžky: Objev, který změní naši budoucnost?
- Technologie na bázi RNA v klinické praxi: od přebarvených petúnií k terapii vzácných a dosud jen obtížně léčitelných chorob u lidí
- „Nepředstavovali jsme si, že náš výzkum povede přímo ke vzniku nových léků, dokonce ještě za našeho života“
- Bezplatné služby pro diagnostiku ATTRv amyloidózy pro kardiology
Nejčtenější v tomto čísle
- Drosophila Spaghetti and Doubletime Link the Circadian Clock and Light to Caspases, Apoptosis and Tauopathy
- Autoselection of Cytoplasmic Yeast Virus Like Elements Encoding Toxin/Antitoxin Systems Involves a Nuclear Barrier for Immunity Gene Expression
- Parp3 Negatively Regulates Immunoglobulin Class Switch Recombination
- PERK Limits Lifespan by Promoting Intestinal Stem Cell Proliferation in Response to ER Stress
Zvyšte si kvalifikaci online z pohodlí domova
Mazová zátka a její řešení
nový kurzVšechny kurzy