
Monoallelic Loss of the Imprinted Gene Promotes Tumor Formation in Irradiated Mice
Cancer-causing mutations typically involve either allele inherited from parents, and the parental source of a mutant allele is not known to influence the cancer phenotype. Imprinted genes are a class of genes whose expression is determined by a specific parental allele, either maternally or paternally derived. Thus, in contrast to most genes, the pattern of inheritance (maternal or paternal-derived) strongly influences the expression of an imprinted gene. Furthermore, imprinted genes can be differentially expressed in different tissue types. This work identifies a novel link between cancer and Grb10, an imprinted gene involved in organismal metabolism and growth. In our mouse model of radiation-induced tumors, we found monoallelic Grb10 gene loss involving the parental allele responsible for protein expression. Tumors harboring genetic loss of the expressed Grb10 allele showed absent transcript and total protein levels, despite an intact remaining wildtype Grb10 allele identified by sequencing. When restored, Grb10 suppressed tumor growth by down-regulating Ras signaling. This work demonstrates a new role for an imprinted gene in tumor formation, and shows that Grb10 functions to negatively regulate Ras signaling and suppress hyperproliferation.
Published in the journal:
. PLoS Genet 11(5): e32767. doi:10.1371/journal.pgen.1005235
Category:
Research Article
doi:
https://doi.org/10.1371/journal.pgen.1005235
Summary
Cancer-causing mutations typically involve either allele inherited from parents, and the parental source of a mutant allele is not known to influence the cancer phenotype. Imprinted genes are a class of genes whose expression is determined by a specific parental allele, either maternally or paternally derived. Thus, in contrast to most genes, the pattern of inheritance (maternal or paternal-derived) strongly influences the expression of an imprinted gene. Furthermore, imprinted genes can be differentially expressed in different tissue types. This work identifies a novel link between cancer and Grb10, an imprinted gene involved in organismal metabolism and growth. In our mouse model of radiation-induced tumors, we found monoallelic Grb10 gene loss involving the parental allele responsible for protein expression. Tumors harboring genetic loss of the expressed Grb10 allele showed absent transcript and total protein levels, despite an intact remaining wildtype Grb10 allele identified by sequencing. When restored, Grb10 suppressed tumor growth by down-regulating Ras signaling. This work demonstrates a new role for an imprinted gene in tumor formation, and shows that Grb10 functions to negatively regulate Ras signaling and suppress hyperproliferation.
Introduction
Diverse types of somatic genetic alterations occur in cancers and play important roles in pathogenesis. A common cancer-promoting mechanism is the homozygous loss of a tumor suppressor gene, for example Tp53 [1]. Classically, loss of tumor suppressor genes requires bi-allelic loss or inactivation, conforming to Knudsen’s two-hit hypothesis.
Tumor-promoting somatic mutations involve either allele, and the parental source of a mutant allele is not known to influence the cancer phenotype. A small fraction of genes, known as imprinted genes, are characterized by monoallelic expression from a single parental allele [2]. Heterozygous loss of the expressed parental allele produces a functionally nullizygous state [3]. Thus, the imprinting mechanism modulates gene expression in a manner that defies Mendelian predictions. To date, imprinted genes are not known to have a role in promoting the development of malignancies.
The tumor suppressor NF1 gene, and its conserved murine homologue Nf1, encode the neurofibromin protein, which is ubiquitously expressed in mammalian cells and necessary for development [4]. Germline heterozygosity for NF1 causes Neurofibromatosis I (NF1), an autosomal-dominant inherited disease with an incidence of 1 in 3000 live-births [5]. The development of benign and malignant neoplasms, typically during childhood, is a well-recognized feature of Neurofibromatosis I [5]. Furthermore, tumor genome analyses of diverse cancers have identified NF1 mutations in sporadic but lethal cancers arising in adults, such as malignant brain tumors, ovarian cancers, and lung cancers [6–9].
The NF1 gene encodes the neurofibromin protein, which functions as a Ras GTPase activating protein (GAP) [10], and loss of neurofibromin promotes hyperactivation of Ras signaling [11]. Oncogenic, constitutively activated Ras is frequently found in human cancers [12] and has been shown to play a causal role in tumor formation in many genetic models [13]. Although neurofibromin is a tumor suppressor protein, NF1 loss alone is not sufficient to promote tumorigenesis. NF1-mediated tumorigenesis may thus require additional mechanisms to pathologically dysregulate Ras signaling, and as a consequence, additional therapeutically actionable steps may exist for inhibiting Ras signaling in the NF1 null context.
To identify novel mutations and mechanisms that promote tumorigenesis with Nf1 loss, we mutagenized mice heterozygous for Nf1 with fractionated ionizing radiation [14,15]. These mouse models recapitulate clinical second malignant neoplasm (SMN) induction observed in NF1 individuals, and provide a novel approach for identifying the molecules cooperating in this process. Ionizing radiation exposure induces mutations, some of which may cooperate with Nf1 heterozygosity to promote tumorigenesis. Mutagenizing Nf1+/- and wildtype mice with ionizing radiation generated diverse malignancies [14,15] from which we generated a unique panel of mouse tumor cell lines. Expression analysis of these lines revealed decreased Growth factor receptor bound protein 10 (Grb10) mRNA in Nf1 null tumor cell lines compared to controls.
Grb10 is an adaptor protein that interacts with multiple receptor tyrosine kinases (RTK) [16,17]. Grb10 possesses a plekstrin homology (PH) domain, a Ras-Association (RA) domain, and a C-terminal Src homology 2 domain (SH2) [18], and associates with the insulin receptor, insulin-like growth factor receptor and epidermal growth factor receptor with variable affinities [19,20]. Grb10 is described to interact with proteins functioning downstream of RTKs such as Raf1 and MEK1 although the biological significance of these interactions are unclear [19]. Grb10 is also linked to Ras signaling through mTORC1 (mammalian target of rapamycin complex 1), which can phosphorylate Grb10 and regulate its levels by influencing protein stability [21,22].
Although biochemical evidence position Grb10 at multiple nodes in RTK signaling, questions persist concerning Grb10’s basic functions. In cell-based studies utilizing cultured fibroblasts, Grb10 promotes cell proliferation and survival [23]. In vivo evidence, however, indicate that Grb10 is an important negative modulator of proliferation and growth in tissues. Overexpression of Grb10 in transgenic mice results in growth retardation and insulin resistance [24,25]. Conversely, in vivo loss of Grb10 in mouse models increases animal size due to hyperproliferation of peripheral tissues, although these animals have no apparent propensity to develop cancers [26]. Analysis of enlarged muscle in Grb10-deleted mice reveals increased myofiber number rather than size, a phenotype that is present at birth and maintained throughout adulthood [27]. Thus, in vivo data support a role for Grb10 as a negative regulator of proliferation and RTK signaling. Grb10 is not known to have a role in tumor suppression, although Grb10 expression is reduced in a wide range of human cancers [21].
Grb10 is an imprinted gene in human and mice [3]. In the mouse, Grb10 is expressed from the maternal allele in non-central nervous system (CNS) tissues [3]. Interestingly, radiation-induced tumors from our models all occur in non-CNS tissues, where Grb10 is expressed from the maternal allele. Analysis of maternal and paternal-specific genetic polymorphisms established that the maternally expressed Grb10 gene was lost in cis with wildtype Nf1 in most radiation-induced tumors, providing a genetic mechanism for functional Grb10 nullizygosity in tumors. Functionally, restoring Grb10 protein in Nf1 null tumors suppressed tumor growth in a MAPK-dependent mechanism. Conversely, Grb10 silencing promotes Ras signaling in and hyperproliferation of MEFs. This effect was Nf1-independent, although the most profound increase in Ras pathway activation occurred when both Grb10 and Nf1 were silenced. In human cancers, we found evidence for co-loss of neurofibromin and Grb10 expression in human glioblastoma, a tumor type in which NF1 is among the most significantly mutated genes [6]. Human tumor sequencing databases reveal that the Grb10 and NF1 genes can be co-mutated in diverse tumor histologies. In summary, this work identifies a role for an imprinted gene in promoting central features of tumorigenesis. In this context, we show that Grb10 is a negative regulator of Ras signaling, and contributes significantly to Ras dysregulation in the setting of Nf1-mediated tumorigenesis. These findings demonstrate a previously undescribed role for an imprinted gene in disease and suggest that mutations in imprinted genes should be considered with regard to parental origin.
Results
Grb10 expression is lost in Nf1-null tumors
In earlier work, we mutagenized Nf1+/- and control wildtype mice to model second malignant neoplasms, severe complications that individuals with the NF1 syndrome develop can develop after radiotherapy [15]. C57Bl/6/129Sv Nf1+/- mice exposed to focal, fractionated ionizing radiation developed diverse malignancies, including soft tissue sarcomas, mammary carcinomas and squamous cell carcinomas. We established multiple tumor cell lines from primary radiation-induced tumors, two arising from wildtype mice (cell lines 867 and 963) and ten arising from Nf1+/- mice [14,15]. Using single nucleotide polymorphism and microsatellite analysis as previously described [15], we found that tumors from mutagenized Nf1+/- mice commonly lose the wildtype Nf1 allele, rendering these tumors null for Nf1. Tumor formation in irradiated Nf1+/- mice is driven by complete loss of Nf1, which is also a hallmark of tumor formation in NF1 patients [28] and thus represents an early and necessary event. To identify mechanisms that are commonly altered in Nf1- mediated tumorigenesis and might function as second events, we interrogated our tumor cell lines using a targeted expression array to compare expression of known PI3K pathway regulators and effectors amongst our tumor lines (Fig 1A). This analysis identified Grb10 expression as most uniformly reduced in tumors as compared to control untransformed Nf1+/- MEFs. We then confirmed by immunoblotting that loss of Grb10 expression observed in Fig 1A was not neurofibromin-dependent (Fig 1B). Using quantitative PCR we independently verified Grb10 expression in wildtype and Nf1 mutant tumor cell lines relative to controls, and found that Grb10 expression varied among multiple postnatal organs included as controls (Fig 1C), with greatest expression in brain and muscle as previously described [29]. In addition to brain and muscle, mammary and skin tissues were included as controls to represent the tissue types in which tumors originated (mammary carcinoma, sarcoma and squamous cell carcinoma). Grb10 expression in 11 of 12 cell lines derived from our mouse models (the 867 cell line being the sole exception) was significantly reduced or undetectable (Fig 1C). Western blotting demonstrated that Grb10 protein was undetectable in all 12 tumor cell lines, including the 867 cell line (Fig 1D).
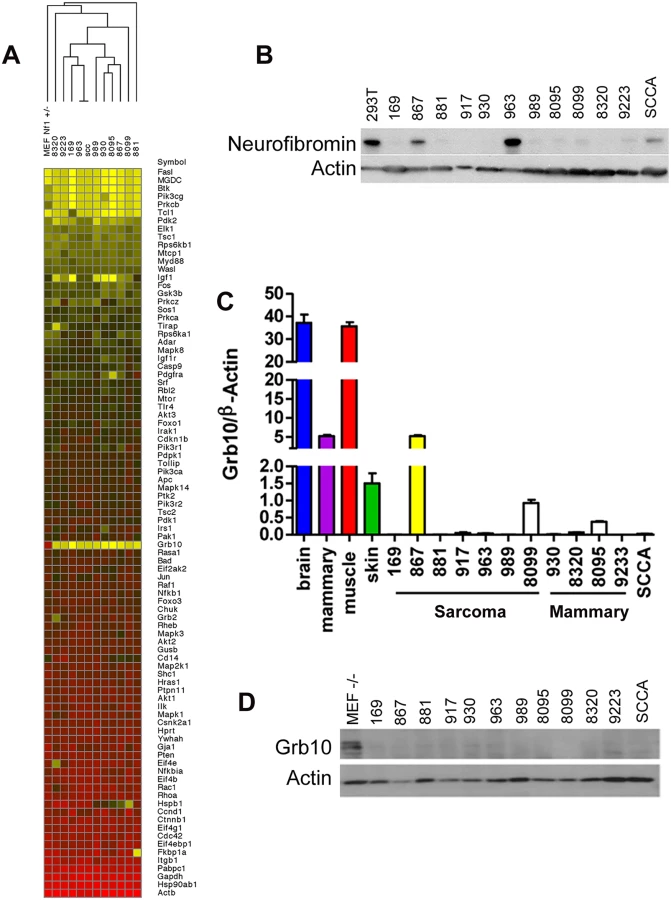
Grb10 belongs to a family of proteins that include Grb2, Grb7, and Grb14, whose members share protein domains but whose functions are not well-defined. To examine whether loss of Grb10 expression might result in compensatory overexpression of these related Grb family members, we performed quantitative PCR to determine whether Grb2, Grb7 or Grb14 transcript levels increased when Grb10 expression was reduced or lost. Similar to Grb10, Grb2, Grb7 and Grb14 expression varied among different control organs examined, however none were overexpressed in any tumor cell line compared to control tissues, arguing against compensatory overexpression of Grb family members in response to reduced Grb10 expression (S1 Fig).
The imprinted Grb10 allele is lost in cis with the wildtype Nf1 and Trp53 alleles in tumors from Nf1+/- mice
The Grb10 gene, initially named Maternally expressed gene 1 (Meg1), is imprinted in mice and humans [26,30–32]. Grb10 expression from either the paternal or maternal allele segregates between the central nervous system (CNS) and non-CNS tissues [3]. In mice, paternally-derived Grb10 is expressed exclusively in the CNS, while maternally-derived Grb10 is expressed in remaining non-CNS tissues, such as muscles [3,33]. This pattern of tissue restriction is conserved in humans (CNS versus non-CNS), although the allelic contribution is reversed (i.e. maternal expression in the CNS). Because Grb10 expression is imprinted, monoallelic deletion, depending on the affected cell type, can functionally reproduce homozygous allelic loss [34]. Consistent with this, mouse models with targeted loss of either the paternal or maternal Grb10 allele demonstrate loss of expression in discrete tissue compartments and non-overlapping phenotypes [3].
Grb10 expression is reduced in a variety of human cancers [21], although the underlying mechanism for this reduction has not been defined. Earlier data implicate Grb10 as a candidate modifier gene cooperating with Nf1 loss to promote tumors. Indeed, astrocytoma formation in mice after co-loss of Nf1 and Trp53 is strongly influenced by the parental origin of the mutant chromosome 11 [32,35], on which Nf1,Trp53, and Grb10 genes reside. A mechanism for Grb10 contributing to tumorigenesis either in human or mouse tumors is currently undefined.
We have shown previously that the Nf1 gene and the Trp53 genes on chromosome 11 are co-lost in tumors arising in Nf1+/- mice [15]. To determine whether there was a similar genetic basis for Grb10 loss in our tumors, we exploited the F1 background of our model to analyze for loss of heterozygosity (LOH) in Grb10. Tumors from Nf1 mutant mice were analyzed using Illumina Medium density array-based SNP genotyping to assess for LOH along chromosome 11. Consistent with our earlier findings [15], LOH occurred in chromosomal regions spanning across Nf1 (Fig 2A, S1 Table), and this pattern of chromosomal loss was present in all three major tumor histologies arising from our mouse models (carcinoma, sarcoma and pheochromocytoma). Interestingly, LOH on chromosome 11 extended beyond the Nf1 locus to involve most of the chromosome, raising the possibility that a gene centromeric to the Nf1 gene drives this loss. The extent of LOH on chromosome 11 was similar between carcinomas, sarcomas, and pheochromocytomas arising in Nf1 mutant mice. Interestingly, the Grb10 gene localizes to a region involved with LOH (Fig 2A), suggesting that genetic loss of the expressed Grb10 allele may underlie the absence of Grb10 transcripts in Nf1 mutant tumor cell lines (Fig 1).
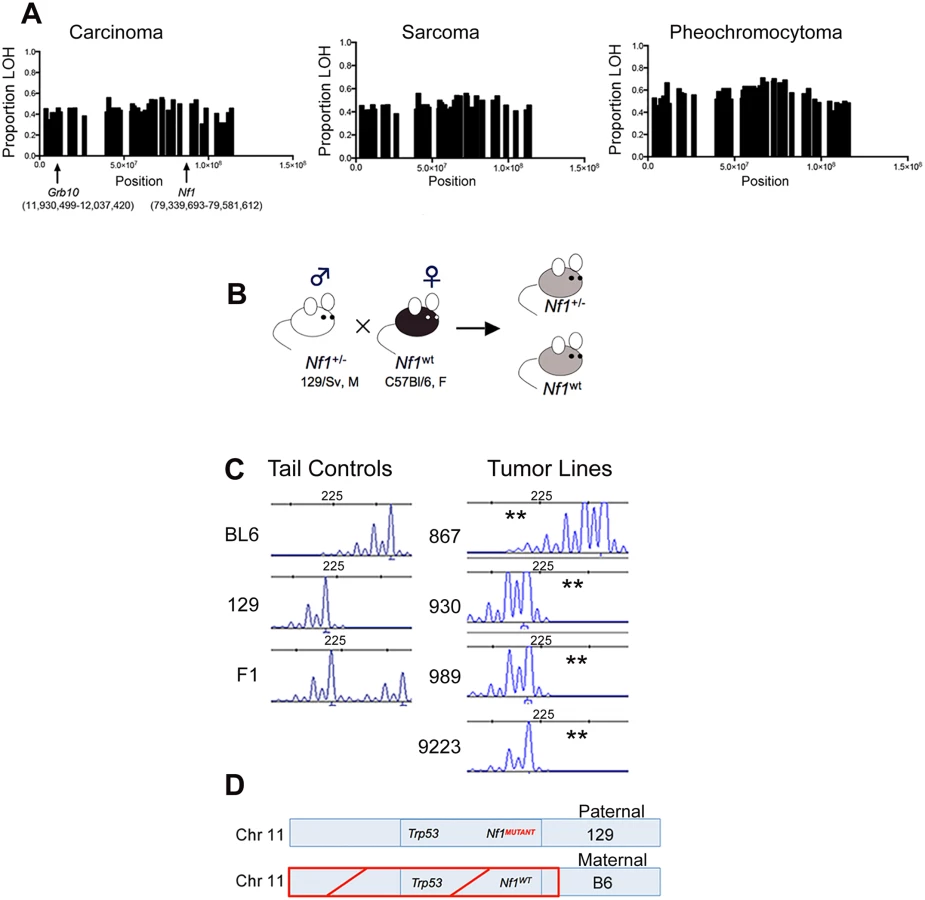
To orthogonally validate a genetic mechanism for the loss of Grb10 expression in our tumors we performed microsatellite-based loss of heterozygosity (LOH) analysis. The design of our mouse models employed a fixed breeding schema in which the wildtype Nf1 allele was always maternally-derived (Fig 2B). Our mouse models also utilize an F1 background so that parental alleles can be distinguished at specific loci (Fig 2C). Because the tumors isolated from our mouse models are non-CNS tumors, Grb10 expression would be derived from the maternal Grb10 allele. Analysis of primary tumor samples identified 19 tumors from Nf1+/- mice in which Nf1 and Grb10 status could be co-determined. 17 of these 19 (89%) demonstrated LOH of the maternal Grb10 allele, and 2/19 (11%) had LOH of the paternal allele. Among the 17 tumors demonstrating LOH of the maternal Grb10 allele, in 12/17 (71%) loss occurred in cis with the wildtype Nf1 gene. Loss of the paternally-derived Grb10 allele (in trans) with Nf1 and Trp53 alleles occurred in only 1/19 tumors, and 1/19 tumors showed LOH of paternal Grb10 without Nf1 co-loss. In summary, this analysis independently confirmed Grb10 LOH in the majority of tumors from Nf1+/- mice and localized loss to involve the maternal allele.
Among radiation-induced tumors from wildtype mice, Nf1 and Grb10 status was determined in 7 tumors. Four of 7 (57%) demonstrated maternal Grb10 loss, and the remaining 3 (43%) showed loss of the paternal allele. Of the 4 tumors with maternal Grb10 loss, 2 (50%) had loss of Nf1 (1 in cis and 1 in trans), and in the remaining 2 tumors LOH of Nf1 was not detected (heterozygosity was intact).
Taken together, these data localize the majority of Grb10 loss in both Nf1 mutant and wildtype tumors to the maternal allele, on which the wildtype Nf1 and Trp53 alleles are also lost in Nf1 mutant tumors (Fig 2C and 2D). The co-loss of all three of these genes in cis from chromosome 11 suggests a common genetic mechanism or event driving these losses.
We also performed Grb10 microsatellite analysis on our tumor cell lines (the corresponding primary tumors from which these lines are derived were analyzed above) shown in Fig 1. All lines except for 867 demonstrated LOH of the maternally-derived Grb10 allele (in cis with the wildtype Nf1 allele). The 867 tumor cell line, which was established from a tumor arising in an irradiated wildtype mouse and expresses Grb10 transcript levels similar to normal tissues (Fig 1), demonstrates loss of the paternal Grb10 allele (Fig 2C). 867 is a sarcoma cell line, and loss of the silenced paternal allele (with retention of the maternal allele) likely explains why this tumor has detectable Grb10 transcripts. However, immunoblotting for total Grb10 protein demonstrates absence of Grb10 protein in all tumor cell lines, including 867, suggesting that Grb10 loss in the 867 cell line results from alternative, possibly post-translational mechanisms. We sequenced the Grb10 exons in all our tumor cell lines, which revealed no mutations in the remaining paternal Grb10 allele (sequence data from representative cell lines 881, 963 and 989 are archived at http://www.ebi.ac.uk/ena/browse) and is consistent with preferential loss of the maternal Grb10 allele resulting in functional nullizygosity (Fig 2D). These data support the idea that genetically-mediated loss of Grb10 expression suggests a role for Grb10 in suppressing tumorigenesis.
Restoration of Grb10 expression in Grb10 null tumor cell lines reduces tumorigenicity in vitro and suppresses Ras signaling
As a negative regulator of growth factor signaling, Grb10 restoration is predicted to reduce Ras signaling through the downstream PI3K and MAPK pathways. To test whether Grb10 restoration altered tumor formation or Ras signaling, retrovirus was used to stably express either wildtype or mutant Grb10 protein (AA) in multiple Nf1 mutant tumor cell lines. The Grb10 AA mutant bears mutations of the mTORC1 phosphorylation sites Serine 501 and Serine 503 to alanines (AA) [21]. Although serine phosphorylation has been proposed to increase protein stability [21], the level of mutant Grb10 expression was similar to that of wildtype Grb10 in our cell lines (Fig 3A).

Restoring wildtype Grb10 significantly reduced soft agar colony formation by the Nf1 null cell lines 989 (shown in Fig 3B and 3C) compared to control and mutant Grb10. To explore the possible mechanism of Grb10-mediated inhibition of colony formation we assessed signaling downstream of Ras in these cells. Cells expressing wildtype Grb10 demonstrated reduced phosphorylated ERK after serum starvation as well as after insulin stimulation compared to control cells (Fig 3D). These data indicate that restoration of Grb10 can profoundly reduce colony formation, attenuate pro-oncogenic signaling, and decrease basal proliferation in Grb10 deficient tumor cell lines. These data thus identify the loss of Grb10 as a mechanism that supports a significant growth advantage that may be selected for during tumorigenesis.
Expression of the Grb10 AA mutant resulted in colony formation intermediate between wildtype Grb10 and control, suggesting that the mutated Serine 501/503 residues produce partial loss of function.
Mutant Grb10 expression had unexpected effects on signaling, characterized by suppression of MAPK pathway signaling after serum starvation as well as after stimulation with insulin, compared to control. Phosphorylated Akt levels were similar to control, but basal phosphorylated S6 levels were reduced and stimulation was delayed.
Phosphorylation of Akt after insulin exposure was similar in amplitude and duration among the three cell lines. Ras-GTP levels in cells expressing wildtype Grb10 paralleled the phosphorylation of ERK (Fig 3D). The difference in ERK1/2 phosphorylation kinetics after insulin exposure between the wildtype and mutant Grb10, coupled with the colony formation data in Fig 3B, suggests that the mutant Grb10’s less effective inhibition of MAPK signaling may underlie the more modest suppression of colony formation observed with this variant.
Grb10 silencing promotes cell proliferation in untransformed wildtype and Nf1 mutant MEFs
Hyperproliferation is a hallmark feature of transformation. Inappropriate cell proliferation occurs early in tumor development, and increasing cell proliferation rates typically correlate with tumor progression and aggressive clinical behavior [36]. Oncogenic activation of Ras signaling pathways in normal cells triggers compensatory mechanisms and negative feedback to suppress inappropriate proliferation, a phenomenon known as oncogene-induced senescence [37]. The feedback mechanisms underlying this protective response are not well-defined, but require p53 and Rb [37,38].
Grb10 expression is reduced in diverse human tumors [21], but the timing of Grb10 loss in tumorigenesis and whether Grb10 loss mediates early features of tumorigenesis are completely unknown. If Grb10 loss occurred as an important event early in tumorigenesis, a likely consequence could be increased cell proliferation, the basis for pre-malignant hyperplasia. Interestingly, the pattern of LOH characterized by Grb10 loss in cis with Nf1 and Trp53 in our tumors is suggestive of a chromosomal break that produced this extensive chromosomal loss early in tumor development. To replicate this genetic signature as an early event in untransformed cells we used lentivirus to stably express shRNA targeting Trp53 alone or with shRNA targeting Grb10 in Nf1 null MEFs (Fig 4A). Silencing Grb10 alone produced no significant change in basal MEF proliferation, as measured by cell counts (Fig 4B). Silencing of Trp53 alone, however, significantly increased cell proliferation rates (Fig 4B), and co-silencing of Trp53 and Grb10 further significantly increased cell proliferation by Nf1 null MEFs over that associated with Trp53 silencing alone (Fig 4B). Hyperproliferation associated with co-silencing was sustained over several days (Fig 4C), indicating that cells failed to invoke compensatory mechanisms to suppress proliferation. We then tested whether the MEF hyperproliferation mediated by Grb10 loss was influenced by Nf1 status, and silenced Trp53 with and without Grb10 in wildtype, Nf1+/- and Nf1-/- MEFs (Fig 4D). Adding Grb10 silencing to Trp53 silencing further increased cell proliferation by day 6 for all genotypes (Fig 4D), indicating that this effect does not require Nf1 loss. However, co-loss of Nf1 and Grb10 was associated with greater cell proliferation as compared to proliferation with silencing of each alone; thus over time, Grb10 loss produced the greatest relative increase in cell proliferation when combined with Nf1 loss, either heterozygous or homozygous (Fig 4D). To further determine whether the increased cell numbers associated with Grb10 silencing reflect proliferation as opposed to altered cell loss, we assessed the proliferative index by BrdU labeling (S2 Fig). This data indicates that Grb10 silencing in MEFs significantly increases BrdU incorporation, consistent with Grb10 silencing promoting proliferation.

We tested multiple unique shRNAs against Grb10 and expressed each of these in Nf1-/- MEFs, then assessed the efficacy of silencing by immunoblotting and the quantifying the effect on proliferation. Our panel of Grb10 shRNAs achieved variable degrees of silencing (Fig 4E), and cell hyperproliferation correlated with the degree of Grb10 silencing, with significantly increased cell proliferation requiring near-complete depletion of Grb10 protein levels (Fig 4F).
Grb10 silencing increases Ras signaling in untransformed MEFs independent of genotype
Grb10 restoration in Nf1 mutant tumor cells reduced colony formation, proliferation, and suppressed Ras signaling, suggesting Grb10’s tumor suppressive effects are mediated by modulating Ras pathway activation. As shown above, Grb10 silencing increased the proliferation of untransformed cells. To determine whether MEF hyperproliferation after Grb10 silencing, similar to tumor cells, involved Grb10-dependent effects on Ras signaling, we used phospho-specific immunoblotting to assess Ras effector activation in the presence or absence of Grb10 silencing. After stably silencing Grb10 and Trp53 in Nf1+/- or Nf1-/- MEFs, cells were serum starved for 18 hours, stimulated with insulin (75 nM), and lysates were collected at 0 and 5 minutes. Immunoblotting for total Grb10 protein confirmed the silencing achieved with shRNA, and interestingly revealed that basal Grb10 protein levels increase when Nf1 is fully lost (Fig 5A), suggesting that Grb10 can be dynamically modulated to negatively regulate Ras signaling. Immunoblotting with phospho-specific antibodies showed that silencing Grb10 increased phosphorylated Akt and ERK levels after serum starvation (Fig 5A, comparing lanes 1 to 3, and lanes 5 to 7) as well as after stimulation, with the greatest absolute levels of phosphorylated Akt and ERK attained in Nf1-/- MEFs after Grb10 silencing (Fig 5A). Paralleling the effects on Ras effectors, Grb10 silencing increased Ras-GTP levels in serum starved Nf1 mutant MEFs stimulated with insulin (Fig 5B). Assessing Akt and ERK phosphorylation at later timepoints revealed that Grb10 silencing was associated with hyperactivation of Akt and ERK at 45 minutes post stimulation with either insulin or EGF (Fig 5C and 5D). Ras signaling hyperactivation mediated by Grb10 loss was independent of Trp53 silencing, as MEFs expressing shRNA against Grb10 only demonstrated increased Akt and ERK phosphorylation after insulin (Fig 5C) and EGF (Fig 5D) stimulation.
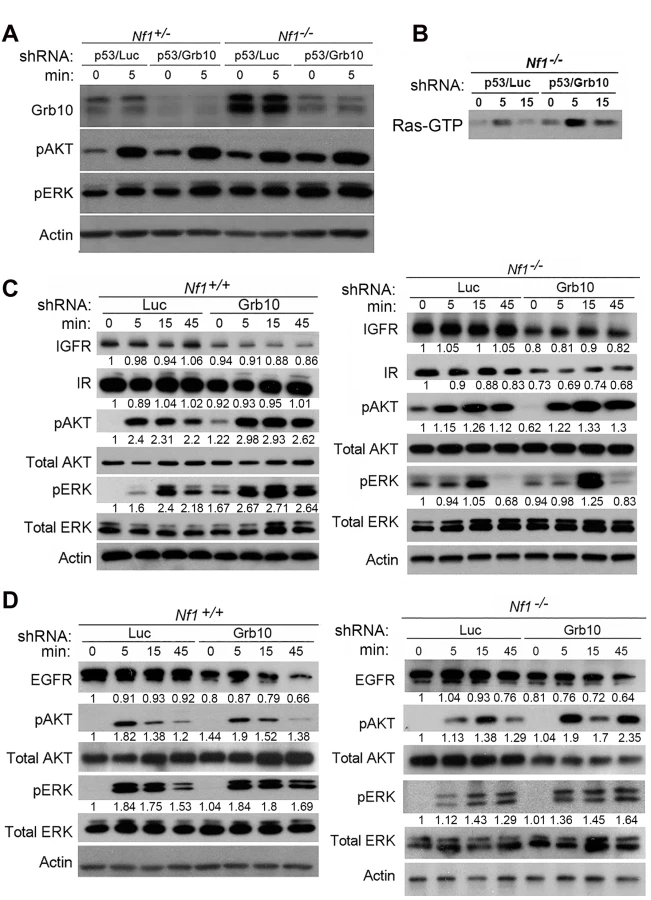
To determine whether Grb10 silencing altered levels of the receptors through which stimulation is mediated, we assessed total protein levels of Insulin Receptor (IR), Insulin-like Growth Factor Receptor (IGFR) and Epidermal Growth Factor Receptor (EGFR) in cells after Grb10 silencing (Fig 5C and 5D). Grb10 silencing was associated with decreased total levels of IR, IGFR and EGFR (Fig 5C), indicating a multi-receptor downregulation in response to Grb10 silencing. Furthermore, Grb10 silencing in both wildtype and Nf1 null MEFs was associated with a reduction of total EGFR levels at 45 minutes post-stimulation (Fig 5D). These reductions in total receptor levels would be predicted to reduce proliferation and growth signaling in response to insulin or Epidermal Growth Factor. Although Grb10 silencing reduced total levels of insulin receptor, phosphorylated insulin receptor levels were increased in the setting of serum starvation as well as after insulin stimulation in Grb10-silenced MEFs (wildtype and Nf1-/-) (S3 Fig), suggesting that Grb10 protein suppresses receptor autophosphorylation and degradation. Despite this, Grb10 loss, in an Nf1-independent manner, renders cells resistant to downregulation of Ras signaling by serum starvation, and increases activation of Ras signaling in response to insulin and EGF. Together, these data indicate that Grb10 modulates Ras signaling in untransformed cells as well as tumor cells, and that loss of Grb10 in untransformed cells increases the magnitude and duration of Ras effector activation despite reduced insulin receptor levels.
Expression of constitutively activated MEK abrogates the effect of wildtype Grb10 expression on colony formation
Although Grb10 levels influence both PI3K and MAPK signaling in untransformed MEFs, in our tumor lines MAPK pathway activation was suppressed by Grb10 restoration. To determine whether Grb10-mediated suppression of colony formation by tumor cells requires inhibition of MAPK signaling, we expressed a constitutively activated Flag tagged-MEK (MEK DD) [39] alone or with wildtype Grb10 in 989 tumor cells. We confirmed expression by immunoblotting (Fig 6A) and assessed phosphorylated Akt and ERK levels (Fig 6A). Restoring Grb10 expression in 989 cells reduced phosphorylated Akt and ERK levels (Fig 6B). Expression of mutant MEK DD restored phosphorylated ERK levels but not phosphorylated Akt (Fig 6A). Comparing colony formation between the cell lines showed a significant reduction in colony formation by 989 tumor cells after Grb10 expression as compared to control, which was rescued with co-expression of MEK DD with Grb10 (Fig 6B and 6C).

Grb10 expression reduces the proliferation of mouse and human tumor cells in multiple oncogenic backgrounds
Our data are consistent with Grb10 functioning to negatively regulate Ras activation, with Grb10 loss resulting in downstream activation of PI3K and MAPK pathways paralleling Ras-GTP levels. This function had been identified in an Nf1 mutant tumor cell line. To determine whether this effect in tumors was Nf1 dependent, we expressed Grb10 in the sarcoma line 963, which arose in a wildtype mouse and expresses neurofibromin protein. Grb10 restoration significantly decreased pERK levels and proliferation in these tumor cells, indicating that Grb10-mediated growth suppression does not require Nf1 loss (Fig 7A and 7B). We then tested whether Grb10 over-expression suppresses Ras signaling in cells transformed by oncogenically-mutated Ras, a common mechanism for Ras pathway hyperactivation in tumors. We expressed Flag-tagged wildtype Grb10 in human astrocytes transformed with retrovirus encoding V16HRas [40], a mutant Ras that is constitutively activated. Flag-tagged wildtype Grb10 was also expressed in the Nf1 mutant/Grb10 null mouse tumor cell line 881 (neurofibromin and Grb10 protein levels previously shown in Fig 1B and 1D) for comparison. Grb10 expression was confirmed by immunoblotting, which showed that Ras-transformed human astrocytes demonstrated marked overexpression of Grb10 compared to 881 tumor cells (Fig 7C). Grb10-overexpressing V16HRas-transformed human astrocytes demonstrated sustained phosphorylated ERK, in contrast to the Nf1 mutant tumor cell line 881, which similar to the 989 tumor cell line showed significantly reduced MAPK signaling and slightly reduced Akt phosphorylation (Fig 7C). We assessed cell proliferation to determine whether similar to the MEFs and Nf1 mutant tumor cell lines Grb10 expression suppressed cell proliferation of Ras-transformed cells. Grb10 restoration significantly decreased proliferation by the Nf1 null 881 tumor cells, and to a lesser extent, reduced cell proliferation in V16HRas-transformed human astrocytes (Fig 7D). This modest effect in V16HRas-transformed human astrocytes may reflect the known resistance of mutant Ras to modulation and may be mediated by Grb10’s effect on endogenous wildtype Ras present in these tumors cells. Together these results point to a mechanism of Grb10 action upstream of Ras activation.

We assessed human malignant peripheral nerve sheath tumors that arose in individuals with NF1 for total Grb10 protein levels. SNF02.2, SNF94.3 and SNF96.2 are established human MPNST cell lines harboring mutant NF1 [41]. Two out of the 3 lines examined (lines 02.2 and 94.3) showed decreased levels of Grb10 protein (Fig 7E). Restoring Grb10 expression in lines 02.2 reduced MAPK, but not PI3K activity, as measured by phosphorylated ERK and AKT, respectively (Fig 7F). Grb10 restoration also decreased proliferation in line 02.2, mirroring the previous effects observed in the sarcoma line 989 from our mouse model (Fig 7G).
Discussion
This work identified Grb10 as genetically lost in most tumors developing in our Nf1 mutant-based mouse model. Our subsequent functional studies show that Grb10 loss promotes oncogenic signaling through hyperactivation of Ras signaling as well as the downstream MAPK pathway. The biochemical data are consistent with Grb10 protein functioning as a negative regulator of growth factor receptor signaling, and when lost with another negative regulator of Ras contributes to tumorigenesis. Although the initial identification of lost Grb10 expression was made in our Nf1 mutant-based mouse model of cancer, studies in human tumor cell lines as well as malignant cells generated from Nf1 wildtype backgrounds suggest that Grb10 loss may have tumor-promoting consequences in other oncogenic contexts.
This work sheds light on the cellular responses to Grb10 loss, alone and when combined with Nf1. Total Grb10 protein levels increased in MEFs with Nf1 loss alone. These findings indicate that Grb10 levels are modulated in response to alterations in Ras pathway control, suggesting that increased Grb10 expression is a compensatory response to Nf1 loss. However, this compensation is incomplete and the physiologic increases in Grb10 protein observed in Nf1 null MEFs fail to functionally replace neurofibromin, as gauged by Ras pathway activation. This is evidenced by the fact that Nf1 null MEFs demonstrate significantly increased Ras pathway activation compared to Nf1+/- MEFs (Fig 5A) despite increased Grb10 expression. Our experiments employing shRNA in MEFs show that silencing Grb10 increases Ras signaling in an Nf1-independent manner, and in an Nf1 null context Ras activation can be increased further by Grb10 silencing, and this is associated with a proliferative advantage exceeding that conferred by Nf1 loss alone (Fig 4). Total Grb10 protein levels are rapidly modulated in other cellular contexts with physiologic consequences, for example adipocytes exposed to pharmacologic mimetics of cold stress [42]. We also found that Grb10 silencing has upstream consequences at the level of membrane receptors. Grb10 silencing was associated with decreased protein levels of multiple growth-promoting receptors, namely EGFR, IR and IGFR. Together, these data implicate Grb10 as a player in the dynamic modulation of receptor tyrosine kinases and the regulation of Ras signaling.
Grb10 is a substrate for mTORC [21,22], and in brown adipocytes, it was recently described that Grb10 functions in a feedback loop with the insulin receptor and raptor to inhibit mTORC1 signaling [42]. In that work, transient overexpression of wildtype Grb10 in HEK293 cells was associated with decreased phosphorylation of S6Kinase after insulin exposure [42], an effect that was abrogated when mTORC1 phosphorylation sites on Grb10 were mutated to alanine. In our study, restoration of wildtype Grb10 expression in Nf1 mutant tumor cells lacking Grb10 expression failed to suppress phosphorylation of S6Kinase upon exposure to insulin (Fig 3D). This difference between HEK293 cells and our Nf1 mutant tumor cells may reflect the possibility that a Grb10-mediated negative feedback loop acting upon mTOR also requires fully intact Ras regulation, such as neurofibromin. Furthermore, Grb10 has tissue-specific functions in vivo, and an additional possibility is that Grb10’s function in a transformed cell may be specific to both the cell of origin as well as the mutational background.
Grb10 restoration in Ras-transformed human astrocytes decreased cell proliferation (Fig 7D), suggesting that even in cells expressing mutant Ras, Grb10 levels influence tumor growth. This finding does not invalidate the observation that Nf1 mutant cells benefit from Grb10 loss. Thus, Grb10 loss may not be limited to NF1 mutant tumors, but may operate in other genetic contexts to promote hyperproliferation.
As a negative regulator of Ras signaling, Grb10 also modulates PI3K and MAPK signaling pathways, although our experiments involving untransformed MEFs and tumor cells suggest that the precise downstream effects may differ depending on context. Grb10 knockdown in Nf1 WT and null MEFs increased both ERK and Akt phosphorylation, consistent with Ras activation and somewhat symmetric activation of downstream PI3K and MAPK signaling arms of the Ras pathway cascade. This activation pattern contrasts with the signaling consequences of Grb10 restoration observed in tumor cells. In the tumor cell lines tested here, Grb10-mediated growth suppression is largely mediated by dampening MAPK rather than PI3K signaling, possibly reflecting intrinsic dependencies of these tumors on activated MAPK signaling. The Grb10 protein is phosphorylated by mTORC1, which stabilizes it and supports its function as a negative regulator of PI3K, thus completing a negative feedback loop that has been described in MEFs [21]. Consistent with this model, we found that Grb10 silencing increased phosphorylated Akt levels, however phosphorylated ERK and Ras-GTP levels also increased, consistent with Ras activation. In Nf1 null tumors, restoration of Grb10 reduced levels of ERK and Akt, although the magnitude of this effect was unequal between these pathways.
Grb10 possesses multiple functional domains and phosphorylation sites [21], however the functional roles of these areas are not well understood. Our data suggest that alterations in Grb10 phosphorylation sites influence the dynamics of the signaling, which are evident in the signaling differences observed between wildtype Grb10 and mutant Grb10 AA. While 989 cells expressing wildtype Grb10 demonstrate the predicted response to insulin stimulation characterized by transient increase in pERK levels, peaking at 5 minutes post-stimulation, and followed by attenuation of the signal by 15 minutes, 989 cells expressing the mutant Grb10 AA have a decreased phosphorylated ERK with serum starvation and more sustained ERK phosphorylation in response to stimulation (Fig 3D). Wildtype Grb10 normalizes the signal upon stimulation with insulin, while Grb10 AA decreases ERK phosphorylation after serum starvation, without affecting the dynamics of the signal. Furthermore, expression of the mutant Grb10 AA was associated with elevated Ras-GTP levels at 5 minutes, which is not concordant with ERK phosphorylation. This difference may reflect specific functions of the Serine 501/503 residues that are mutated in the Grb10 AA protein. Functional analysis of Grb10’s domains will enable better characterization of Grb10’s effects on signaling by Ras and its effectors, which may be context-dependent.
Given Grb10’s functional connection to well-described tumor promoting signal transduction pathways, the literature suggests that Grb10 function could contribute to cancer development. Grb10 has not previously been shown to be intrinsically oncogenic either in vivo or in vitro, nor have tumor-promoting functions of mTOR, the best understood phosphorylator of Grb10, been shown to be Grb10-dependent. However, mTOR clearly links proliferative signaling to protein translation and plays an important role in many cancers [43–46]. mTORC1-driven inhibition of the PI3K pathway signaling occurs through Grb10 [22], and this negative feedback mechanism from mTOR to PI3K signaling suggests a potential role for Grb10 loss to promote cell proliferation. Although speculative, Grb10 likely functions in a complex network with mTOR and its other effectors, and its contribution to oncogenic signaling may depend upon both the signaling and cellular backgrounds.
Our data indicates that Grb10-associated tumorigenesis is conditional on Grb10 loss cooperating with other tumor-promoting genetic events, as Grb10 silencing alone failed to confer anchorage independent growth to MEFs. This is also consistent with the Grb10 mutant phenotype in vivo, as Grb10 knock-out mice do not spontaneously develop tumors [3]. Genetic loss was responsible for loss of Grb10 expression in the majority of our tumors. In humans, the genetic basis for GRB10 and NF1 co-loss differs from the genetics in murine tumors, because the GRB10 and NF1 genes reside on different chromosomes (chromosome 7 and 17, respectively). Therefore, loss of these genes in human cancers will be independent events rather than occurring by a single genetic event as suggested by our mouse model. In addition, non-genetic alternative mechanisms might be operational in human cancers promoted by GRB10 and NF1 co-loss. Indeed, our data suggest the presence of post-translational mechanisms mediating Grb10 loss, as among our tumor cell lines one tumor (the 867 tumor cell line) demonstrated Grb10 transcript levels comparable to normal control tissues but lacked detectable Grb10 protein. However, there are likely post-translational mechanisms mediating Grb10 loss, as among our tumor cell lines one tumor (the 867 tumor cell line) demonstrated Grb10 transcript levels comparable to normal control tissues but lacked detectable Grb10 protein. Given multiple potential mechanisms for Grb10 protein function, Grb10 protein levels may be more informative than genetic or transcript analysis alone in determining GRB10 status in human cancers.
This work illustrates that Nf1-mediated tumorigenesis can be promoted by loss of another negative regulator of Ras signaling, and raises the possibility that other negative regulators may contribute to Nf1-driven tumorigenesis in other contexts. Potential candidates for these alternative negative regulators might include some Grb protein family members. This family includes Grb7, Grb10 and Grb14, which are structurally related multi-domain adapter proteins with overlapping and distinct functions. All three family members share a polyproline stretch, PH, RA, SH2 and PBS domains, however their functions differ. While Grb7 was shown to play a role in adhesion/migration by associating with membrane regions of focal adhesion kinases and the EphB1 receptor [47], Grb10 and Grb14 have been implicated in the regulation of insulin receptor and insulin growth factor receptor signaling, and potentially other receptor tyrosine kinases [48]. Mouse models of Grb10 and Grb14 demonstrate the overlapping, distinct, and tissue-specific in vivo functions of Grb10 and Grb14 in insulin signaling regulation. Specifically, Grb14 has IR-mediated growth inhibitory effects in the liver and retina, whereas Grb10 plays a role in insulin signaling regulation in the muscle and adipose tissue [48–50]. As such, Grb10 mutant mice with loss of the expressed allele have a 30% increase in body size, whereas Grb14-/- mice are of normal size. Recent structural studies have also shown that Grb10 and Grb14 have different affinities for binding RTKs, with Grb10 having a higher affinity of binding to phosphor-inositol phosphates on the membrane through its PH domain, while Grb14 has greater affinity for binding Ras molecules [18,51]. In our studies, Grb10 was found to be uniformly lost in the mouse tumors but we found no evidence of a compensatory increase in the levels of other Grbs, including Grb14, the most closely related Grb family member. Perhaps this is not surprising, given that most of the tumors from the irradiated Nf1+/- mice are sarcomas derived from muscle tissue, where Grb10 has a more prominent role than Grb14 [27,52].
This work describes a previously unknown role for an imprinted gene as a tumor suppressor. Conceptually, restricting gene expression to originate from a single allele creates haploinsufficiency, which can expose an organism to disorders caused by loss of protein expression, cancer being an example. Presumably imprinting confers a compelling organismal advantage to offset this risk, and recent data support the idea that Grb10 imprinting is evolutionarily driven by nutrient utilization during development, and Grb10 influences proportions of lean and fat tissues during development [53]. An intriguing connection between Grb10 and tumorigenesis suggests that genetic mechanisms that initially developed to confer an advantage in energy storage and utilization during development might in later life limit a cell’s ability to suppress inappropriate proliferation.
Imprinting means that loss of either allele will impact different cell types variably, and that the cellular context determines the consequence of genetic loss. This feature of imprinted genes has implications for the types of tumors that can be expected to arise after Grb10 loss. The breeding schema of our mouse model produced F1 mice inheriting the mutant Nf1 copy paternally, and subsequent co-loss of Grb10 in cis with Nf1 from the maternal copy of chromosome 11 is equivalent to Grb10 nullizygosity in non-CNS tissues, where only the maternally-inherited Grb10 allele is expressed. This pattern of loss does not produce Grb10 nullizygosity in tissues expressing the paternal Grb10, for example tissues of the nervous system. In our breeding schema, the paternal Grb10 allele is located in cis with the mutant Nf1 allele, and we postulate that the Grb10 imprinting unique to tissues of the nervous system confers resistance to tumorigenesis in the nervous system. Indeed, irradiated F1 mice in our mouse models do not develop CNS tumors [14], despite the fact that optic pathway gliomas (OPGs) are a type of CNS tumor that arises in 15–20% of children with NF1 [54]. The genetic factors responsible for OPG development in NF1 are not fully understood, however our experimental model provides a robust context in which to assess possible tumor promotion by loss of the imprinted paternal Grb10 allele. In prior studies, Grb10 has been proposed as a candidate modifier gene in Nf1 mutant mice [32,35]. Analysis of tumors from our mouse models supports this role of Grb10 and sheds light on the mechanism and consequences of its loss. Additional experiments in Grb10 mutant mice will also be important for further elucidating the function of this protein in vivo. Apart from the development of malignant tumors in the Nf1 mutant mouse background, genetic modifiers may hold broader relevance for the NF1 mutant phenotype in humans. The severity of Neurofibromatosis I varies amongst family members sharing a germline mutation [55], and our data supports the concept that imprinted alleles function as disease modifiers and may be involved in mediating this variability. Candidate genetic modifiers have been identified in multiple sporadic human cancers [56,57]. Interestingly, polymorphism analysis of gliomas in NF1 patients found correlation between specific polymorphisms in the human adenylate cyclase 8 gene with glioma development in a sex-specific manner [58]. Sex-specific modifiers are driven by the sex of the affected individual and fundamentally differ from imprinted modifiers, which are defined by the parental allele involved. Finally, imprinted genes may influence an individual’s susceptibility to tumor development as well as potentially other diseases and represent a novel genetic mechanism that defines both normal physiology and disease.
Materials and Methods
Ethics statement
Tumor samples obtained from previously described mouse models were analyzed. All animal procedures were approved by the UCSF IACUC (Approved protocol numbers: AN078941 and AN080665). These practices conform to regulations defined by the Animal Welfare Act and the US Department of Agriculture.
Cell lines and culture conditions
Mouse tumor cell lines were grown as previously described [40]. Cell lines used were established from tumors arising in irradiated Nf1+/- F1 mice [14,15,59]. Human cell lines were obtained from ATCC.
Retroviral vectors including HA-tagged retroviral WT-Grb10 and Grb10-AA (S501A–S503A) constructs were kindly provided by Dr. Yonghao Yu, (University of Texas Southwestern Medical Center). To generate retrovirus Ecopack packaging (5 μg) plasmids were co-transfected with the Grb10 plasmids (10–15 μg) into HEK 293 T cells using lipofectamine 2000 (Invitrogen). Lentivirus vectors including Flag-tagged WT-Grb10 and MEKDD constructs were cloned as described in the section Gateway Cloning.
To generate lentivirus, Grb10, MEKDD or GFP (9μg) plasmids were co-transfected with packaging plasmids Δ8.9 (9 μg) and VSVG (4.5 μg) into HEK293T cells using lipofectamine 2000 (Invitrogen).
Two days after transfection, retroviral or lentiviral supernatants were harvested and filtered. Recipient cells were infected in the presence of antibiotic-free, serum-containing medium supplemented with 8 μg/ml polybrene. Following infection, cell lines stably expressing the Grb10 constructs were selected using puromycin. Stable expression was confirmed by Western analysis to visualize the HA tag.
Cell counting
Cells from all experimental groups were plated in triplicates at the same density (ranging from 50,000 to 150,000 cells/well in 6-well plates depending on the experiment). Cells were trypsinized and re-suspended in 2 mLs of complete media. Cell counting and assessment of viability by trypan blue staining were performed using an automated cell counter, Vi-CELL XR (Beckman Coulter, Fullerton, CA).
Anchorage independent growth assay
Cell were plated 4 x 10⁴ cells per 6 cm plate in 1x DMEM as previously described [40]. One day following plating, the plates were treated with drug to indicated concentration, or DMSO carrier as control, diluted in DMEM.
Western blotting
For signaling pathway Western blots, cells were collected at 70% confluence. Cells were washed twice in PBS and lysed in RIPA lysis buffer (1% Sodium Deoxycholate, 0.1% SDS, 25 mM Tris, 150 μM NaCl, 1% Triton-X, 0.2 mM EDTA, 10 mM NaF, 1 mM Sodium Vanadate, 10 nM Calyculin A, Protease Inhibitors). Lysate protein concentration was determined by Pierce BCA Protein Assay Kit (Thermo Scientific). 20–50 μg of cell lysate was run on SDS-PAGE 10–20% gradient gels (Novex). Most antibodies were purchased from Cell Signaling Technologies. Primary antibodies were diluted at 1 : 2000, and included Beta-actin (Cat No. 4967L), phospho-S473-Akt (Cat No. 4060), phospho-S6 (Cat No. 2211), phospho-p44/42 MAPK (Cat No. 4376), IRβ (Cat No.3025), Flag (Cat No. 8146), Phospho-Tyrosine (Cat No. 8954), HA (Cat No.2367). Anti-Grb10 and EGFR antibodies were purchased from Santa Cruz (Cat No. sc-1026, and sc-31157 respectively). Anti-IGFR antibody was purchased from Millipore (Cat No. 05–656). Secondary antibodies were diluted at 1 : 2000 and included anti-rabbit IgG-HRP (Cat No. 7074) and anti-mouse IgG-HRP (Cat No. 7076). NIH Image 1.49j or Li-Cor Image Studio Lite 4.0.21 softwares were used for densitometric quantification of phosphorylated proteins and receptor levels. For the quantification of receptor levels in the stimulation experiments, receptor band intensities were normalized to Actin as an internal reference. Subsequently all the values were normalized to the initial experimental condition: Luc/ time point “0”. For quantification of phosphorylated protein levels, Total AKT, pAKT, Total ERK, pERK intensity levels were first all normalized to Actin as an internal control, and the normalized values were used to calculate the ratio of pAKT/Total AKT and pERK/Total ERK. Quantifications displayed under the corresponding bands correspond to the values obtained for the represented experiment.
PCR array
RNA was extracted with the RNAeasy kit (Qiagen). RNA purity was assessed by UV spectrophotometry using a Nanodrop p1000 (Thermo Scientific). cDNA was generated from 1 μg RNA with the Qiagen RT2 First Strand Kit. Genomic DNA was removed with the Qiagen Genomic DNA Elimination Mix. Reverse-transcription mix was added to purified RNA, mixed with the RT2 SYBR Green Mastermix and added to the 96-well PI3K (Cat No. PIMM058A) PCR array plates per Qiagen protocol. RT-PCR was performed over 40 cycles on a Stratgene MX3000P qPCR system. CT values were exported into a Microsoft Excel spreadsheet and uploaded into the Qiagen RT2 Profiler PCR Array Data Analysis Webportal software (v3.5) for analysis (http://pcrdataanalysis.sabiosciences.com/pcr/arrayanalysis.php). Data QC was verified and housekeeping genes were selected for data normalization. Fold change was calculated and used to generate the heat map.
BrdU incorporation analysis
Equal numbers (250,000 cells) of WT and Nf1 null MEFs expressing shRNA against Luciferase (Luc) or Grb10 were plated in 6-well plates. BrdU was added to the culture medium overnight, and the cells were trypsinized and harvested the next day. The cells were fixed and stained with APC-labeled anti-BrdU antibodies as recommended by the BD BrdU flow kit protocol (BDB552598). Percent BrdU incorporation was assessed by flow cytometric analysis (FACSDiva LSRII). For mitotic enrichment 250,000 cells were plated in 6-wells plates and treated with 25 μM MG132 for 2 hrs prior to labeling with BrdU as discussed previously.
Immunoprecipitation
Cells were lysed with modified Ripa buffer (50 mM Tris-Cl, pH 7.5, 150 mM NaCl, 1% Nonidet P40, 0.5% sodium deoxycholate, 0.1% SDS, 10 mM NaF, 1 mM Sodium Vanadate, 10 nM Calyculin A, Protease Inhibitors). Lysates were centrifuged at 15,000 g for 20 min at 4°C, and protein concentration was determined by Pierce BCA Protein Assay Kit (Thermo Scientific). 100μg of protein was diluted in a total of 200μl of modified Ripa buffer then precleared with protein A agarose beads (Life Technologies) at 4°C for 1 hr. The supernatants were then incubated with 1 μg of anti-insulin receptor antibody (Cell Signaling) at 4°C overnight. Twenty microliters of protein A agarose beads were then added/ml of lysate, and incubated at 4°C for 1 hr. The agarose beads (with the antibody-protein complex) were then collected by centrifugation (10 min, 14,000 g, 4°C). Supernatants were discarded and beads were washed 3 × with PBS. Finally, the beads were re-suspended in 20 μl of 2 × sample buffer, boiled for 5 min, electrophoresed on 10% Tris-glycine gels (Novex).
Statistical analysis
Prizm v.4 (GraphPad) was used to calculate paired student’s t tests. Experiments were performed at least three times and means with p <0.05 were considered statistically significant.
See S1 Text for additional experimental procedures.
Supporting Information
Zdroje
1. Bieging KT, Mello SS, Attardi LD (2014) Unravelling mechanisms of p53-mediated tumour suppression. Nat Rev Cancer 14 : 359–370. doi: 10.1038/nrc3711 24739573
2. Ferguson-Smith AC (2011) Genomic imprinting: the emergence of an epigenetic paradigm. Nat Rev Genet 12 : 565–575. doi: 10.1038/nrg3032 21765458
3. Garfield AS, Cowley M, Smith FM, Moorwood K, Stewart-Cox JE, et al. (2011) Distinct physiological and behavioural functions for parental alleles of imprinted Grb10. Nature 469 : 534–538. doi: 10.1038/nature09651 21270893
4. Gutmann DH, Collins FS (1993) The neurofibromatosis type 1 gene and its protein product, neurofibromin. Neuron 10 : 335–343. 8461130
5. Ferner RE (2007) Neurofibromatosis 1 and neurofibromatosis 2: a twenty first century perspective. Lancet Neurol 6 : 340–351. 17362838
6. Cancer Genome Atlas Research Network (2008) Comprehensive genomic characterization defines human glioblastoma genes and core pathways. Nature 455 : 1061–1068. doi: 10.1038/nature07385 18772890
7. Cancer Genome Atlas Research Network (2011) Integrated genomic analyses of ovarian carcinoma. Nature 474 : 609–615. doi: 10.1038/nature10166 21720365
8. Holmfeldt L, Wei L, Diaz-Flores E, Walsh M, Zhang J, et al. (2013) The genomic landscape of hypodiploid acute lymphoblastic leukemia. Nat Genet 45 : 242–252. doi: 10.1038/ng.2532 23334668
9. The Cancer Genome Atlas Research Network (2012) Comprehensive genomic characterization of squamous cell lung cancers. Nature 489 : 519–525. doi: 10.1038/nature11404 22960745
10. Bollag G, McCormick F (1991) Differential regulation of rasGAP and neurofibromatosis gene product activities. Nature 351 : 576–579. 1904555
11. Bollag G, Clapp DW, Shih S, Adler F, Zhang YY, et al. (1996) Loss of NF1 results in activation of the Ras signaling pathway and leads to aberrant growth in haematopoietic cells. Nat Genet 12 : 144–148. 8563751
12. Kan Z, Jaiswal BS, Stinson J, Janakiraman V, Bhatt D, et al. (2010) Diverse somatic mutation patterns and pathway alterations in human cancers. Nature 466 : 869–873. doi: 10.1038/nature09208 20668451
13. Stephen AG, Esposito D, Bagni RK, McCormick F (2014) Dragging ras back in the ring. Cancer Cell 25 : 272–281. doi: 10.1016/j.ccr.2014.02.017 24651010
14. Nakamura JL, Phong C, Pinarbasi E, Kogan SC, Vandenberg S, et al. (2011) Dose-dependent effects of focal fractionated irradiation on secondary malignant neoplasms in Nf1 mutant mice. Cancer Res 71 : 106–115. doi: 10.1158/0008-5472.CAN-10-2732 21199799
15. Choi G, Huang B, Pinarbasi E, Braunstein SE, Horvai AE, et al. (2012) Genetically mediated Nf1 loss in mice promotes diverse radiation-induced tumors modeling second malignant neoplasms. Cancer Res 72 : 6425–6434. doi: 10.1158/0008-5472.CAN-12-1728 23071067
16. He W, Rose DW, Olefsky JM, Gustafson TA (1998) Grb10 interacts differentially with the insulin receptor, insulin-like growth factor I receptor, and epidermal growth factor receptor via the Grb10 Src homology 2 (SH2) domain and a second novel domain located between the pleckstrin homology and SH2 domains. J Biol Chem 273 : 6860–6867. 9506989
17. Stein EG, Gustafson TA, Hubbard SR (2001) The BPS domain of Grb10 inhibits the catalytic activity of the insulin and IGF1 receptors. FEBS Lett 493 : 106–111. 11287005
18. Depetris RS, Wu J, Hubbard SR (2009) Structural and functional studies of the Ras-associating and pleckstrin-homology domains of Grb10 and Grb14. Nat Struct Mol Biol 16 : 833–839. doi: 10.1038/nsmb.1642 19648926
19. Nantel A, Mohammad-Ali K, Sherk J, Posner BI, Thomas DY (1998) Interaction of the Grb10 adapter protein with the Raf1 and MEK1 kinases. J Biol Chem 273 : 10475–10484. 9553107
20. Desbuquois B, Carre N, Burnol AF (2012) Regulation of insulin and type 1 insulin-like growth factor signaling and action by the Grb10/14 and SH2B1/B2 adaptor proteins. FEBS J.
21. Yu Y, Yoon SO, Poulogiannis G, Yang Q, Ma XM, et al. (2011) Phosphoproteomic analysis identifies Grb10 as an mTORC1 substrate that negatively regulates insulin signaling. Science 332 : 1322–1326. doi: 10.1126/science.1199484 21659605
22. Hsu PP, Kang SA, Rameseder J, Zhang Y, Ottina KA, et al. (2011) The mTOR-regulated phosphoproteome reveals a mechanism of mTORC1-mediated inhibition of growth factor signaling. Science 332 : 1317–1322. doi: 10.1126/science.1199498 21659604
23. Deng Y, Zhang M, Riedel H (2008) Mitogenic roles of Gab1 and Grb10 as direct cellular partners in the regulation of MAP kinase signaling. J Cell Biochem 105 : 1172–1182. doi: 10.1002/jcb.21829 18985678
24. Shiura H, Miyoshi N, Konishi A, Wakisaka-Saito N, Suzuki R, et al. (2005) Meg1/Grb10 overexpression causes postnatal growth retardation and insulin resistance via negative modulation of the IGF1R and IR cascades. Biochem Biophys Res Commun 329 : 909–916. 15752742
25. Cao XR, Lill NL, Boase N, Shi PP, Croucher DR, et al. (2008) Nedd4 controls animal growth by regulating IGF-1 signaling. Sci Signal 1: ra5. doi: 10.1126/scisignal.1160940 18812566
26. Wang L, Balas B, Christ-Roberts CY, Kim RY, Ramos FJ, et al. (2007) Peripheral disruption of the Grb10 gene enhances insulin signaling and sensitivity in vivo. Mol Cell Biol 27 : 6497–6505. 17620412
27. Holt LJ, Turner N, Mokbel N, Trefely S, Kanzleiter T, et al. (2012) Grb10 regulates the development of fiber number in skeletal muscle. FASEB J 26 : 3658–3669. doi: 10.1096/fj.11-199349 22623587
28. Cichowski K, Jacks T (2001) NF1 tumor suppressor gene function: narrowing the GAP. Cell 104 : 593–604. 11239415
29. Riedel H (2004) Grb10 exceeding the boundaries of a common signaling adapter. Front Biosci 9 : 603–618. 14766395
30. Miyoshi N, Kuroiwa Y, Kohda T, Shitara H, Yonekawa H, et al. (1998) Identification of the Meg1/Grb10 imprinted gene on mouse proximal chromosome 11, a candidate for the Silver-Russell syndrome gene. Proc Natl Acad Sci U S A 95 : 1102–1107. 9448292
31. Arnaud P, Monk D, Hitchins M, Gordon E, Dean W, et al. (2003) Conserved methylation imprints in the human and mouse GRB10 genes with divergent allelic expression suggests differential reading of the same mark. Hum Mol Genet 12 : 1005–1019. 12700169
32. Tuskan RG, Tsang S, Sun Z, Baer J, Rozenblum E, et al. (2008) Real-time PCR analysis of candidate imprinted genes on mouse chromosome 11 shows balanced expression from the maternal and paternal chromosomes and strain-specific variation in expression levels. Epigenetics 3 : 43–50. 18188004
33. Charalambous M, Smith FM, Bennett WR, Crew TE, Mackenzie F, et al. (2003) Disruption of the imprinted Grb10 gene leads to disproportionate overgrowth by an Igf2-independent mechanism. Proc Natl Acad Sci U S A 100 : 8292–8297. 12829789
34. Reilly KM (2004) The importance of genome architecture in cancer susceptibility: location, location, location. Cell Cycle 3 : 1378–1382. 15492507
35. Reilly KM, Tuskan RG, Christy E, Loisel DA, Ledger J, et al. (2004) Susceptibility to astrocytoma in mice mutant for Nf1 and Trp53 is linked to chromosome 11 and subject to epigenetic effects. Proc Natl Acad Sci U S A 101 : 13008–13013. 15319471
36. Bachmann IM, Halvorsen OJ, Collett K, Stefansson IM, Straume O, et al. (2006) EZH2 expression is associated with high proliferation rate and aggressive tumor subgroups in cutaneous melanoma and cancers of the endometrium, prostate, and breast. J Clin Oncol 24 : 268–273. 16330673
37. Courtois-Cox S, Jones SL, Cichowski K (2008) Many roads lead to oncogene-induced senescence. Oncogene 27 : 2801–2809. doi: 10.1038/sj.onc.1210950 18193093
38. Serrano M, Lin AW, McCurrach ME, Beach D, Lowe SW (1997) Oncogenic ras provokes premature cell senescence associated with accumulation of p53 and p16INK4a. Cell 88 : 593–602. 9054499
39. Emery CM, Vijayendran KG, Zipser MC, Sawyer AM, Niu L, et al. (2009) MEK1 mutations confer resistance to MEK and B-RAF inhibition. Proc Natl Acad Sci U S A 106 : 20411–20416. doi: 10.1073/pnas.0905833106 19915144
40. Nakamura JL, Garcia E, Pieper RO (2008) S6K1 plays a key role in glial transformation. Cancer Res 68 : 6516–6523. doi: 10.1158/0008-5472.CAN-07-6188 18701474
41. Mo W, Chen J, Patel A, Zhang L, Chau V, et al. (2013) CXCR4/CXCL12 mediate autocrine cell - cycle progression in NF1-associated malignant peripheral nerve sheath tumors. Cell 152 : 1077–1090. doi: 10.1016/j.cell.2013.01.053 23434321
42. Liu M, Bai J, He S, Villarreal R, Hu D, et al. (2014) Grb10 Promotes Lipolysis and Thermogenesis by Phosphorylation-Dependent Feedback Inhibition of mTORC1. Cell Metab.
43. Zoncu R, Efeyan A, Sabatini DM (2011) mTOR: from growth signal integration to cancer, diabetes and ageing. Nat Rev Mol Cell Biol 12 : 21–35. doi: 10.1038/nrm3025 21157483
44. Wagle N, Grabiner BC, Van Allen EM, Hodis E, Jacobus S, et al. (2014) Activating mTOR mutations in a patient with an extraordinary response on a phase I trial of everolimus and pazopanib. Cancer Discov 4 : 546–553. doi: 10.1158/2159-8290.CD-13-0353 24625776
45. Grabiner BC, Nardi V, Birsoy K, Possemato R, Shen K, et al. (2014) A diverse array of cancer-associated MTOR mutations are hyperactivating and can predict rapamycin sensitivity. Cancer Discov 4 : 554–563. doi: 10.1158/2159-8290.CD-13-0929 24631838
46. Liu P, Gan W, Inuzuka H, Lazorchak AS, Gao D, et al. (2013) Sin1 phosphorylation impairs mTORC2 complex integrity and inhibits downstream Akt signalling to suppress tumorigenesis. Nat Cell Biol 15 : 1340–1350. doi: 10.1038/ncb2860 24161930
47. Shen TL, Guan JL (2004) Grb7 in intracellular signaling and its role in cell regulation. Front Biosci 9 : 192–200. 14766359
48. Holt LJ, Siddle K (2005) Grb10 and Grb14: enigmatic regulators of insulin action—and more? Biochem J 388 : 393–406. 15901248
49. Holt LJ, Lyons RJ, Ryan AS, Beale SM, Ward A, et al. (2009) Dual ablation of Grb10 and Grb14 in mice reveals their combined role in regulation of insulin signaling and glucose homeostasis. Mol Endocrinol 23 : 1406–1414. doi: 10.1210/me.2008-0386 19541746
50. Cooney GJ, Lyons RJ, Crew AJ, Jensen TE, Molero JC, et al. (2004) Improved glucose homeostasis and enhanced insulin signalling in Grb14-deficient mice. EMBO J 23 : 582–593. 14749734
51. Rajala RV, Rajala A, Gupta VK (2012) Conservation and divergence of Grb7 family of Ras-binding domains. Protein Cell 3 : 60–70. doi: 10.1007/s13238-012-2001-1 22271596
52. Mokbel N, Hoffman NJ, Girgis CM, Small L, Turner N, et al. (2014) Grb10 deletion enhances muscle cell proliferation, differentiation and GLUT4 plasma membrane translocation. J Cell Physiol 229 : 1753–1764. doi: 10.1002/jcp.24628 24664951
53. Cowley M, Garfield AS, Madon-Simon M, Charalambous M, Clarkson RW, et al. (2014) Developmental programming mediated by complementary roles of imprinted Grb10 in mother and pup. PLoS Biol 12: e1001799. doi: 10.1371/journal.pbio.1001799 24586114
54. Fisher MJ, Avery RA, Allen JC, Ardern-Holmes SL, Bilaniuk LT, et al. (2013) Functional outcome measures for NF1-associated optic pathway glioma clinical trials. Neurology 81: S15–24. doi: 10.1212/01.wnl.0000435745.95155.b8 24249802
55. Szudek J, Joe H, Friedman JM (2002) Analysis of intrafamilial phenotypic variation in neurofibromatosis 1 (NF1). Genet Epidemiol 23 : 150–164. 12214308
56. Peterlongo P, Chang-Claude J, Moysich KB, Rudolph A, Schmutzler RK, et al. (2015) Candidate Genetic Modifiers for Breast and Ovarian Cancer Risk in BRCA1 and BRCA2 Mutation Carriers. Cancer Epidemiol Biomarkers Prev 24 : 308–316. doi: 10.1158/1055-9965.EPI-14-0532 25336561
57. Kuchenbaecker KB, Ramus SJ, Tyrer J, Lee A, Shen HC, et al. (2015) Identification of six new susceptibility loci for invasive epithelial ovarian cancer. Nat Genet 47 : 164–171. doi: 10.1038/ng.3185 25581431
58. Warrington NM, Sun T, Luo J, McKinstry RC, Parkin PC, et al. (2015) The Cyclic AMP Pathway Is a Sex-Specific Modifier of Glioma Risk in Type I Neurofibromatosis Patients. Cancer Res 75 : 16–21. doi: 10.1158/0008-5472.CAN-14-1891 25381154
59. Chao RC, Pyzel U, Fridlyand J, Kuo YM, Teel L, et al. (2005) Therapy-induced malignant neoplasms in Nf1 mutant mice. Cancer Cell 8 : 337–348. 16226708
Štítky
Genetika Reprodukční medicínaČlánek vyšel v časopise
PLOS Genetics
2015 Číslo 5
- Kazuistika – Perspektivy využití precizované medicíny v rámci personalizované specifické terapie onkologických pacientů
- Nobelova cena za chemii pro genetické nůžky: Objev, který změní naši budoucnost?
- Technologie na bázi RNA v klinické praxi: od přebarvených petúnií k terapii vzácných a dosud jen obtížně léčitelných chorob u lidí
- „Nepředstavovali jsme si, že náš výzkum povede přímo ke vzniku nových léků, dokonce ještě za našeho života“
- Bezplatné služby pro diagnostiku ATTRv amyloidózy pro kardiology
Nejčtenější v tomto čísle
- Drosophila Spaghetti and Doubletime Link the Circadian Clock and Light to Caspases, Apoptosis and Tauopathy
- Autoselection of Cytoplasmic Yeast Virus Like Elements Encoding Toxin/Antitoxin Systems Involves a Nuclear Barrier for Immunity Gene Expression
- Parp3 Negatively Regulates Immunoglobulin Class Switch Recombination
- PERK Limits Lifespan by Promoting Intestinal Stem Cell Proliferation in Response to ER Stress
Zvyšte si kvalifikaci online z pohodlí domova
Mazová zátka a její řešení
nový kurzVšechny kurzy