
The bHLH Factors Extramacrochaetae and Daughterless Control Cell Cycle in Imaginal Discs through the Transcriptional Regulation of the Phosphatase
Precise control of cell proliferation is critical for normal development and tissue homeostasis. Members of the inhibitor of differentiation (Id) family of helix-loop-helix (HLH) proteins are key regulators that coordinate the balance between cell division and differentiation. These proteins exert this function in part by combining with ubiquitously expressed bHLH transcription factors (E proteins), preventing these transcription factors from forming functional hetero - or homodimeric DNA binding complexes. Deregulation of the activity of Id proteins frequently leads to tumour formation. The Daughterless (Da) and Extramacrochaetae (Emc) proteins are the only members of the E and Id families in Drosophila, yet their role in the control of cell proliferation has not been determined. In this study, we show that the elimination of emc or the ectopic expression of da arrests cells in the G2 phase of the cell cycle. Moreover, we demonstrate that emc controls cell proliferation via Da, which acts as a transcriptional repressor of the Cdc25 phosphatase string. These results provide an important insight into the mechanisms through which Id and E protein interactions control cell cycle progression and therefore how the disruption of the function of Id proteins can induce oncogenic transformation.
Published in the journal:
. PLoS Genet 10(3): e32767. doi:10.1371/journal.pgen.1004233
Category:
Research Article
doi:
https://doi.org/10.1371/journal.pgen.1004233
Summary
Precise control of cell proliferation is critical for normal development and tissue homeostasis. Members of the inhibitor of differentiation (Id) family of helix-loop-helix (HLH) proteins are key regulators that coordinate the balance between cell division and differentiation. These proteins exert this function in part by combining with ubiquitously expressed bHLH transcription factors (E proteins), preventing these transcription factors from forming functional hetero - or homodimeric DNA binding complexes. Deregulation of the activity of Id proteins frequently leads to tumour formation. The Daughterless (Da) and Extramacrochaetae (Emc) proteins are the only members of the E and Id families in Drosophila, yet their role in the control of cell proliferation has not been determined. In this study, we show that the elimination of emc or the ectopic expression of da arrests cells in the G2 phase of the cell cycle. Moreover, we demonstrate that emc controls cell proliferation via Da, which acts as a transcriptional repressor of the Cdc25 phosphatase string. These results provide an important insight into the mechanisms through which Id and E protein interactions control cell cycle progression and therefore how the disruption of the function of Id proteins can induce oncogenic transformation.
Introduction
Cell proliferation is a critical event in organ formation and it is regulated by multiple cellular signals. During development, individual cells interpret these signals to determine whether to continue proliferating or to induce cell cycle arrest and initiate differentiation. The way that cells integrate these different signals to control the cell cycle machinery is a crucial issue that has received a great deal of attention [1]–[2] although many aspects of this process have yet to be elucidated.
The basic Helix-Loop-Helix (bHLH) family of transcription factors are key regulatory molecules that control multiple developmental processes in species from yeast to humans [3]. In metazoans, bHLH proteins orchestrate cell cycle control, cell lineage commitment and cell differentiation (reviewed in [4]). Dimerization of the HLH domain allows these proteins to form homo - or heterodimers, while their basic domain is responsible for their capacity to bind to DNA [5]–[6]. The bHLH proteins are classified into different categories according to their function, distribution and DNA-binding properties. Class II encompasses bHLH proteins that are expressed in tissue-specific patterns, including MyoD, Myogenin, NeuroD/BETA2, MASH, HAND and TAL. The activity of these factors is related to the acquisition of particular developmental fates or potentials. These tissue-specific HLH factors dimerize with ubiquitous bHLH proteins called E proteins, which are “class I” bHLH factors. Vertebrate class I bHLH proteins are encoded by differentially spliced transcripts from the E2A (E12, E47 and E2-5/ITF1 proteins), E2-2/ITF2 and HEB/HTF4 genes. The currently accepted model is that in these heteromers, the tissue-specific class II factors confer spatial and temporal specificity, whereas the ubiquitous class I factors drive DNA binding and transcriptional activation [7]–[9]. The basic domains of the dimers contact a DNA target site known as the E-box, which is responsible for transcriptional activation. As dimerization is essential for DNA binding and transcriptional activity in vivo [10], [4], proteins that prevent the formation of these complexes act as negative regulators. These negative regulators, which contain an HLH domain but lack a basic region, are members of the Inhibitor of Differentiation (Id) protein family, composed of Id1-4. These factors represent “class V” proteins and they bind to ubiquitous bHLH proteins to inhibit their activity [11]–[13].
Although Id proteins were discovered due to their ability to prevent cell differentiation, they play a broad range of biological roles during development and significantly contribute to tumour development [reviewed in 14]–[15]. In addition to the widely accepted function of E proteins as regulators of tissue specific gene expression, they are also believed to serve as cell cycle effectors. However, this latter function remains controversial due to the diversity of cell cycle-specific target genes identified for E proteins [16]–[19]. The functional redundancy between the members of these two families has also complicated the study of their influence on cell proliferation [20]–[21]. However, the problem of redundancy is eliminated in Drosophila, in which Daughterless (Da) and Extramacrochaetae (Emc) are the only representatives of classes I and V [22]–[24], thereby facilitating functional studies. The interaction between these proteins and with other bHLH proteins is a determinant of cell fate decisions in different developmental contexts [25]–[27]. Moreover, null mutations for emc cause severe defects in cell division, suggesting that emc may be necessary to maintain a proliferative state during organ development [28]–[29].
An evolutionary conserved regulatory network between Da and Emc, in which Da controls its own activity by enhancing emc expression, was described recently [30]. According to this model, Emc functions as a negative feedback regulator that prevents runaway self-stimulation of da expression. Thus, changes in the expression of emc by different extracellular signals modulate the levels of Da. Furthermore, because Emc can bind directly to Da, elimination of Emc promotes an increase in Da homodimers. Nevertheless, little is known about how Emc and Da control cell proliferation. In vertebrates, Id2 is thought to bind to the retinoblastoma tumour suppressor protein (pRB), abolishing its growth-suppressor activity [31]–[32], although no physical association between pRb and Emc has been detected in Drosophila [33]. To date, the role of da in regulating proliferation has not been studied.
In the present study, we investigated the control of cell proliferation by Da and Emc, and we found that both emc and da were required for the G2/M transition in the cell cycle. In eukaryotic cells, the main activator of mitosis is the (Cdc25) phosphatase String, which triggers the G2/M transition. We observed that defects in cell proliferation seen in emc mutant cells and da overexpressing cells were a result of reduced string expression. Thus, our results indicate that Da functions as a transcriptional repressor of string, thereby regulating G2/M transition.
The role of bHLHs in integrating signals and permitting cell fate acquisition has been studied previously, yet these proteins are also essential for cell proliferation and tissue growth. It is well established that Id factors regulate G1-S transition in vertebrate cells, and our data indicate that at least in Drosophila, E proteins can also control the G2/M transition in conjunction with Id factors. Thus, here we have described the first mechanism through which interacting class I and class V bHLHs intercede in this cell cycle transition.
Results
emc mutant cells are retained in the G2 phase of cell cycle
It was shown previously that cells completely lacking emc function do not survive in imaginal discs, suggesting a role for this gene in controlling cell proliferation and/or survival. In order to have a better understanding of the function of emc in the control of cell proliferation during discs development, we studied proliferation-related parameters in mitotic recombination clones of emc mutant cells generated using the mosaic analysis with repressible cell marker (MARCM) technique [34]. In these clones, GFP was positively expressed by all the mutant cells. Since clones of emc null cells do not survive, we used the strong hypomorphic emc1 allele.
Clones of emc1 mutant cells induced 60 h after egg laying (AEL) and analysed 48 h later were always smaller than the control clones (10.3±0.61 cells vs 23.8±1.2 in control clones, n = 40, p-value<0.001: Figure 1 A, B). In adult wings, these clones are elongated, they frequently appear to run along the veins and are much smaller than control clones. We also analysed the effects caused by emc1 mutant clones when they have a proliferative advance upon surrounding cells using the Minute (M) technique. Clones of M+ cells can out-compete the surrounding heterozygous Minute− cells, therefore these clones can grow into large wing territories. In adult wings, control M+ clones tend to be restricted to the regions defined by veins (inter-vein regions), hence their sizes depend on the number of intervein regions that they occupy [28]. As expected, emc1 M+ clones, induced 60 h AEL and analysed in adult wings, are larger than emc1 clones, albeit smaller than control clones (1.3±0.7 intervein regions, n = 85 vs 2.2±1, in controls, n = 35) [35], [28], [29]. These mutant clones always caused a reduction in the size of the regions they occupy and can induce the fusion of adjacent veins, giving rise to the elimination of entire intervein regions [28] (Figure S1 A). These data indicate that despite the proliferative advantage provided by M+, cell proliferation was impaired in emc1 M+ mutant cells.

The size reduction in emc mutant territories might have been due to increased cell death or cell cycle arrest or delay. To address whether the defects observed in these clones were caused by cell death, we blocked apoptosis in emc1 mutant cells by simultaneously eliminating the proapoptotic reaper (rpr), grim and hid genes, using the deficiency Df(3L)H99. The deletion of these genes blocks apoptosis in Drosophila [36]. Clones of emc1 Df(3L)H99 M+ mutant cells, induced 60 h AEL and analysed in adult wings, were indistinguishable from emc1 M+ clones. The sizes of both emc1 Df(3L)H99 M+ and emc1 M+ clones were identical (1.3±0.63 inter-vein regions, n = 28 vs 1.3±0.7 in emc1 M+). In addition, as previously described for emc1 M+ clones, the regions occupied by clones of emc1 Df(3L)H99 M+ cells were heavily reduced in size, and they can induce the fusion of adjacent veins, causing the elimination of entire inter-vein regions (Figure S1 A).
Finally, in emc1 clones we did not find apoptotic cells, as assayed by Caspase 3 staining in third instar wing discs (data not shown). All these data indicate that cell death was not the primary cause of the small size of emc mutant clones. We then investigated whether cell cycle progression was altered in emc1 cells by determining cell doubling time [37]. The emc1 clones induced at 60±12 h AEL and analysed 60±12 h later exhibited a prolonged cell doubling time that was delayed by 4.4 h compared to control clones (16.40 h in mutant vs 12 h in wt). This delay increased to 5 h when clones were analysed at 84±12 h after induction.
These results indicate that the rate of division of emc cells is slower than that of control cells, suggesting that the cell cycle is either blocked or delayed in these mutant cells. Based on these findings, we determined the proportion of emc mutant cells in the different stages of the cell cycle by Fluorescence-Activated Cell Sorting (FACS). To generate large emc mutant regions, we blocked emc activity by expressing a UAS-emcRNAi using the Gal4/UAS system. This UAS-emcRNAi was co-expressed with UAS-GFP, which allowed us to study the changes in cell cycle progression caused by the absence of emc in a defined cell population (GFP+ cells) and compare this to control cells in ap-Gal4 UAS-GFP discs. The adult wing phenotypes displayed by mutant flies after expression of the UAS-emcRNAi construct under the regulation of ap-Gal4 were very similar to those produced by large emc M+ mutant clones [28]. Thus, UAS-emcRNAi ap-Gal4 wings exhibited wing vein fusion that resulted in the elimination of inter-vein regions (Figure 1 D). Accordingly, we detected a strong reduction in the number of dividing cells in the dorsal compartment of these discs (35% reduction in the number of dividing cells compared to control discs, revealed by staining for the phospho-histone 3 mitotic marker (PH3)).
The FACS analysis revealed that a greater proportion of the emc mutant cells were in the G2 phase compared to the control cells in ap-Gal4 UAS-GFP discs (40% and 61% in control and mutant cells, respectively, n = 4, p-value<0.05: Figure 1 E, F). Similar results were obtained when the UAS-emcRNAi was expressed in the entire wing pouch under the regulation of the nubbin-Gal4 driver (data not shown). Overall, these data indicate that although emc mutant cells can divide, they persist in the G2 phase for longer than control cells.
The ectopic expression of Da retains cell cycle progression in the G2 phase
It was recently demonstrated that most of the effects of eliminating emc function are caused by increased Da expression in these mutant cells. Indeed, eliminating da in emc mutant cells was sufficient to rescue the poor viability of these cells in the Drosophila eye disc [30]. This hypothesis was confirmed in the imaginal wing discs in which clones of emcAP6 cells barely survived, whereas da emc double mutant clones achieved a relatively normal size (Figure S2 A–C).
We examined whether the ectopic expression of da mimicked the effects of emc depletion on cell cycle progression. To this end we generated clones of da-expressing cells using the Gal4/UAS system combined with the Flip-out technique (see Matherials & Methods). As seen in clones of emc mutant cells, clones of cells ectopically expressing da were very small compared to controls (Figure 2 A, B). Accordingly, overexpression of da in the central region of the wing blade using salEPv-Gal4 (salEPv-Gal4 UAS-GFP/UAS-da) reduced the size of this region in third instar wing discs (Figure 2 C, D, and Figure 3) and adult flies (Figure 4 C). In these adult wings, several veins were fused, provoking the elimination of inter-vein regions (compare Figures 4 C with 4 A). This effect was correlated with a reduction in the mitotic index (PH3-positive cells/size of salEPv-GFP region in pixel) in the domain of salEPv expression (3.13±0.18 mitotic index in control vs 1.08±0.09 in mutant discs, n = 20, p-value<0.001: Figure 2 C, D).
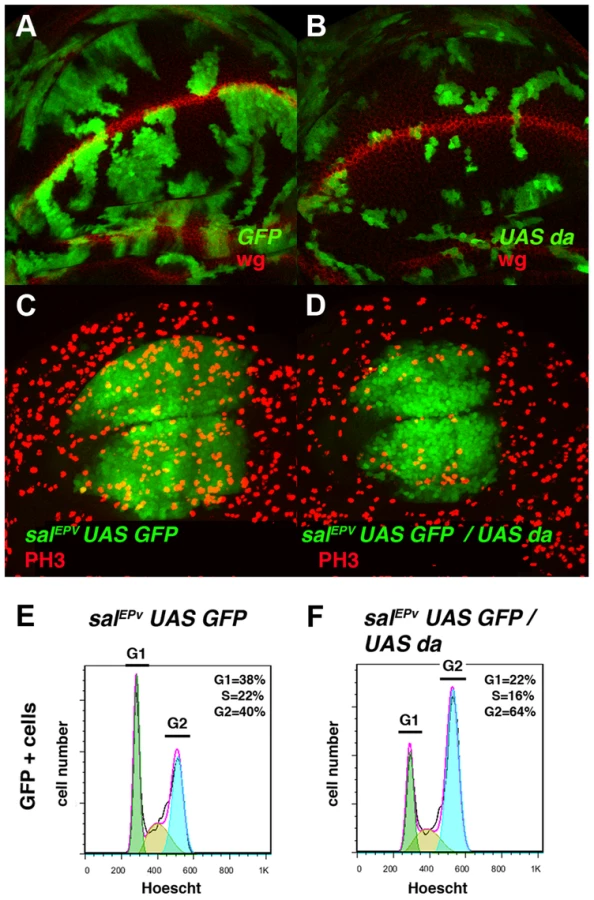


In concordance with the results found when emc was reduced in the discs, a FACS analysis in salEPv-Gal4 UAS-GFP/UAS-da discs revealed an increase in the proportion of cells in the G2 phase of the cell cycle in cells overexpressing da (39.79% in control salEPv-Gal4 UAS-GFP/+ vs 64.49% in salEP -Gal4/UAS-da discs, n = 3, p-value<0.05: Figure 2 E, F). Consistently with the model in which Emc titrates Da, we observed that the overexpression of emc partially suppressed the cell proliferation defects caused by the overexpression of da. Thus, we found that when UAS-da and UAS-emc were simultaneously overexpressed under the control of salEPv-Gal4 UAS-GFP, the density of PH3 positive cells in the domain of expression of salEPv was significantly higher than in wing discs in which only UAS-da was overexpressed (mitotic index of salEPv-Gal4/UAS-da; UAS emc discs 1.51±0.32 compared with 1±0.14 when only UAS-da was overexpressed; n = 8, p-value = 0.004: Figure S2 H–K). Consequently, the size reduction of the adult wings caused by the overexpression of da was strongly suppressed in these doubly mutant wings (Figure S2 D–G). We then studied whether cell death was causing the size reduction phenotype produced by da overexpression. To this end, we co-expressed the apoptosis inhibitor Diap I in flies that simultaneously overexpressed da. The overexpression of diap suppressed neither the reduced wing size phenotype caused by the ectopic expression of UAS-da nor the deficiency of mitotic cells observed in wing discs than solely overexpressed UAS-da (mitotic index of salEPv-Gal4/UAS-da; UAS-diap discs 0.98±0.21 vs 1±0.14 for UAS-da discs; n = 10; Figure S1 B–G). Moreover, we detected no apoptotic cells in wing discs containing clones of da-expressing cells (data not shown). As previously described in mutant condition for emc, these data support the idea that cell death was not the primary cause of the defect found when da was overexpressed.
Taken together, our data support the hypothesis that in emc mutant cells the increased expression of da reduces the rate of cell division, arresting cell cycle progression in the G2 phase or slowing G2/M transition.
Emc and Da regulate the expression of string
Based on the accumulation of cells in the G2 phase caused by the downregulation of emc or the overexpression of da, we examined the expression of regulators of the G2/M transition in cells overexpressing da. The CycB-CDK1 complex is essential for the transition from the G2 to M phase and this complex is dephosphorylated, and thereby activated, by the universal activator of mitosis in eukaryotic cells, the Cdc25 phosphatase String. The transcriptional activation of string triggers mitosis. We found that the expression of CycB in salEPv-Gal4 UAS-GFP/UAS-da was comparable to that which is seen in control discs (Figure 3 A, B) and we therefore examined string mRNA expression in these discs by in situ hybridization. Interestingly, the expression of string mRNA was strongly reduced in the central region of salEPv-Gal4 UAS-GFP/UAS-da wing discs compared to control discs (Figure 3 C, D).
We further analysed the regulation of stg by da through quantitative Real-Time PCR (qRT-PCR). Using the Gal4/Gal 80Ts system, we overexpressed da in third instar engrailed-Gal4 (en-Gal4)/UAS-da; tub-Gal80ts wing discs and we quantified the total amount of stg mRNA 48 h after the induction of da. The expression of stg mRNA was reduced in mutant discs compared to control discs. Similar results were obtained when emc function was blocked by overexpressing an UAS-emcRNAi throughout development under the regulation of ap-Gal4 (Figure 3 E). In contrast, the levels of expression of mRNA of cycB, which is also specifically expressed in the G2 phase of the cell cycle, were not affected after the overexpression of da (data not shown). This result suggests that the overexpression of da was not indiscriminately affecting the expression of all the genes required for the G2/M transition.
The downregulation of string caused by the ectopic expression of da could account for the accumulation of cells in the G2 phase. Alternatively, da may repress other factors that regulate G2/M transition. To investigate these possibilities we co-expressed da and string under the regulation of salEPv-Gal4. As mentioned above, overexpression of da in the domain of salEPv expression reduced the size of this region in adult wings (compare Figures 4 A and 4 C). Strikingly, this reduction was almost completely suppressed by UAS-string co-expression (compare Figure 4 D with 4 C). Accordingly, in third instar wing discs co-expressing UAS-da and UAS-string, PH3 staining revealed the restoration of cell division (Mitotic index: salEPv-Gal4 UAS-GFP: 3.01±0.04; salEPv-Gal4 UAS-GFP/UAS-da: 1.71±0.04; salEPv-Gal4 UAS-GFP/UAS-stg: 7.04±0.17; salEPv-Gal4 UAS-GFP-UAS-da/UAS-stg: 4.43±0.17) (compare Figure 4 F with 4 E). Since adult wings overexpressing da and stg were slightly smaller than the salEPv-Gal4 controls, we cannot rule out the possibility that Da might be required for the regulation of other cell cycle regulators in addition to string. We observed that CycB expression was downregulated, indicating that G2/M transition was accelerated, as occurred when string alone was overexpressed (Figure 4 E′–F′ and data not shown). Interestingly, extra-bristle differentiation continued in the rescued adult wings, indicating that the influence of da on mitosis and differentiation is distinct (Figure 4 C, D). Similar results were obtained when string was overexpressed in emc mutant cells (Figure 4 G–I). Thus, the average number of cells that formed UAS-string emc1 double mutant clones increased to 20.4±1.28 (23.8±1.2 in control clones) from 10.3±0.61 in emc1 clones (Figure 4 J). Moreover, clones formed by more than 20 cells, which were absent in emc1 discs, reappeared in the UAS-string emc1 double mutant clones (Figure 4 J), and the extended doubling time of emc1 clones was restored by string overexpression (13.88 h in UAS-string emc1 clones vs 13.08 h in control clones). Finally, the proliferative defect observed following emc depletion by UAS-emcRNAi was also suppressed by string overexpression (Figure S3).
These results indicate that loss of string expression is the main cell cycle defect caused by the overexpression of da or the absence of emc. Although our results demonstrate that da plays an important role in repressing the transcription of string, the downregulation of da was insufficient to increase string expression, as revealed by in situ hybridization and quantitative Real-Time PCR of stg mRNA in ap-Gal4 UAS-da-RNAi wing discs (Figure S4). Different alternatives can explain these apparently contradictory results (see Discussion).
Da binds to the string promoter region
Our results are consistent with the view that string is repressed by Da. Considering that Da is a transcriptional factor, the simplest molecular mechanism to explain this regulatory effect would be that Da acts directly on the stg promoter. To test this idea, we scanned the promoter region of string for putative Da-binding sites, given that Da binds to the E box consensus sequence CAC/GCTG. The transcription of string in Drosophila is regulated by a large 5′ region (>40 kb) that contains many regulatory elements [38], including multiple putative Da binding sites that we could identify in the string promoter.
To further investigate whether these binding sites were involved in the regulation of stg expression, we first examined the stg promoter to map transcriptional control elements required to regulate its expression during disc development. To this end we analysed the LacZ expression of a collection of string-LacZ reporters containing promoter fragments (between −1 kb and +5 kb) thought to regulate string expression in wing discs [38] (Figure 5). None of these reporters were expressed in third instar imaginal wing disc (data not shown), suggesting that the regulatory regions required to activate string expression in the wing discs are located in other regions of the promoter. In the light of these data, we decided to extend our study to the rest of the promoter region. We subsequently examined the pattern of expression of a collection of Gal4 lines that were under the control of defined sequence fragments from flanking non-coding or intronic regions of different genes throughout Drosophila genome (GMR_Brain_exp_1 or Rubin Gal4 lines, Janelia Farm). We selected the lines that contained fragments of the stg promoter (Figure 5). When these lines were combined with UAS-GFP, we found that the GMR_32B06, GMR_32C11 and GMR_32F08 lines expressed UAS-GFP in third instar imaginal wing disc. The GMR_32F08 line drove the expression of UAS-GFP in all the cells of the wing discs, whereas the GMR_32B06 and GMR_32C11 lines expressed UAS-GFP in a defined pattern. Thus, the GMR_32B06 line drove UAS-GFP expression in the region corresponding to the putative hinge of the wing disc, while in the GMR_32C11 line the expression of UAS-GFP was restricted to wing blade region, where it was expressed at higher levels in the putative wing margin and in a band of cells at the anterior/posterior compartment boundary, in a manner similar to the expression of string in third instar wing discs (Figure 5 and Figure S5).

To determine whether the regulatory regions contained in the GMR_32B06, GMR_32C11 and GMR_32F08 Gal4 lines were regulated by Da, we analysed the expression of UAS-GFP driven by these lines when da was overexpressed. To this end, we crossed these Gal4 lines combined with UAS-GFP by UAS-da and studied the levels of GFP in third instar wing discs. Transcriptional reporter activity was established by quantifying GFP levels in control third instar discs (no UAS-da) and comparing them to the levels of GFP observed in discs that also overexpressed UAS-da (see Matherials & Methods). We found that increasing da levels in the wing disc reduced the levels of expression of GFP in the three lines analysed (Figure 6 A–I). Thus, when da was overexpressed under the control of GMR_32B06 and GMR_32C11 lines, both the number of cells expressing GFP and the levels of expression of this protein were reduced (Figure 6 A–C and G–I). In wing discs in which UAS-GFP and UAS-da were under the control of the GMR_32F08 line, we found that although UAS-GFP was expressed in all the cells of the discs, its levels of expression were strongly reduced compared to the control disc (Figure 6 D–F).

To further investigate the function of da regulating the transcriptional activity of stg promoter in the wing blade region, we used a Lac-Z reporter construct (stg-107–112 LacZ, kindly provided by C.S. Lopes. and F. Casares) containing almost the entire fragment presented in the GMR_32C11 and GMR_32F08 Gal4 lines (Figure 5 B). This reporter was sufficient to drive ß-Gal expression in most of the wing blade cells, with higher levels in the cells of the wing margin and in a band of cells in the A/P boundary, in a pattern resembling the one obtained with the line GMR_32C11 (Figure 5 A and 6). Interestingly, the expression of this reporter was very similar to the pattern of expression of emc (Figure S5). Consistent with our previous results, we found that ß-Gal expression driven by stg-107–112 LacZ was strongly reduced in the dorsal compartment of third instar wing discs, in which da was overexpressed under the control of ap-Gal4 (ap-Gal4 UAS-GFP/UAS-da) (Figure 6 J–K).
The expression activity of this reporter was not affected when da was downregulated. Thus, when the function of da was reduced in third instar en-Gal4 UAS-GFP/stg-107–112 LacZ; UAS-daRNAi wing discs, we found that ß-Gal expression driven by 107–112 LacZ reporter in the anterior control compartment was comparable to the expression of this reporter in the posterior compartment (Figure S4 F–F′). This result is consistent with the observation that the reduction in da function was not sufficient to increase string mRNA expression (see above).
Taken together, these data indicate that Da can transcriptionally control different regulatory elements present in the promoter region of stg.
As was mentioned previously, we identified multiple putative Da binding sites throughout string promoter. Interestingly, a map of the Drosophila melanogaster regulatory genome was recently produced on the basis of different chromatin immunoprecipitation data sets, including thirty-eight site-specific transcription factors (modENCODE cis-regulatory annotation project) [39]. One of the transcriptional factors used in this work was Da. The data presented in this study indicate that Da binds in vivo to multiple regions in the promoter region of stg (Figure 5 A, B). We found five putative Da binding sites in the regulatory region that we have identified as being involved in the regulation of string expression in wing discs (between nucleotides 25.106 and 25.113) (Figure 5 B). The modENCODE cis-regulatory annotation indicates that Da binds to this region in vivo (Figure 5 B). We conducted an additional ChIP assay using an antibody specific against Da. To quantify the amount of precipitated DNA, quantitative Real-Time PCR was preformed after the ChIP, using primers for stg, achaete and CG12255 promoters. We used achaete as a positive control, as it has been previously reported that Da binds to this promoter, and CG12255 as a negative control, as it does not contain putative Da binding sites. For the stg promoter we analysed two regions, one located between 25.081.039–25.081.121 (Chr3R) (between nucleotides −976 and −205 upstream of the first transcriptional initiation site), and the other between nucleotides 25.111.328–25.111.401 (Chr3R) (29 Kb from the first transcriptional initiation site), including one putative Da binding site that lies in the regulatory region that we have identified to be required to control string expression during wing disc development (Figure 5 B) (see Matherials & Methods). We found that compared to the CG12255, DNA from both stg regulatory regions was enriched at the same levels as the achaetae promoter (Figure 5 C). This result confirms the data reported by modENCODE, and indicates that Da binds to the regulatory regions that we have identified as being involved in the regulation of string expression in wing discs.
Tissue-specific bHLH proteins of the E(spl) and Ac/Sc complexes do not mediate the effects of Da on cell proliferation
It has been proposed that heterodimers formed between Da and other bHLH factors promote the transcriptional activation of different target genes. Since our results suggest that Da behaves as a transcriptional repressor of string, this effect could be mediated by other bHLH factors, as Da could partner any number of bHLH proteins expressed during disc development. Indeed, it has been proposed that the heterodimers formed by Da and the bHLH protein Twist result in the repression of somatic myogenesis [40].
During wing disc development, the tissue-specific bHLH factors Achaete (ac) and Scute (sc) are expressed in the presumptive wing margin. These proneural genes prefigure the pattern of sensory elements and they are required to define the sensory organs of the wing discs. At this stage, the cells located in the presumptive wing margin are arrested in the G2 phase of the cell cycle and they establish the so-called zone of non-proliferative cells (ZNC) [41]–[42]. Ectopic expression of sc in the ZNC results in the loss of stg expression [43], suggesting that these proneural genes might interact with Da and mediate its repressor activity. However, ac and sc depletion does not reverse the proliferative defects observed in emc mutant cells, as clones of emc Df(sc)19 cells are similar to emc mutant clones [35]. The capacity of Sc to repress stg expression in the ZNC could be explained if Sc directly or indirectly alters Da levels. To test this possibility, we overexpressed sc in third instar en-Gal4/UAS-sc wing discs and analysed the expression of Da. We found that in these discs the expression of Da was strongly enhanced in the posterior compartment compared to the anterior compartment (Figure 7 A, A′). Taken together, these data indicate that Da regulates cell proliferation independently of Sc and Ac. They also suggest that the capacity of Sc to repress stg expression, and hence proliferation in the ZNC, is due to its ability to modulate the levels of Da, although further studies are required to confirm the mechanistic details of this regulation.

Other bHLH proteins dynamically expressed in epithelial cells are encoded by the seven genes that comprise the Enhancer-of-split complex (E(spl)C) [44]–[46]. During wing disc development, the E(spl) genes are required to single out sensory organ precursors and vein patterning, and they at least partially mediate the role of Notch signalling in the regulation of cell proliferation [47]–[48]. To study whether members of the E(spl) complex mediate the function of Da in the control of cell proliferation, we examined the phenotype of clones for a deficiency of E(spl) (E(spl)b32.2) that simultaneously overexpressed UAS-da. These clones were much smaller than control clones and similar in size to the clones of da-expressing cells (Figure 7 B–E). These results indicate that high levels of Da expression can alter cell proliferation even in the absence of E(spl) genes.
To further investigate whether the ectopic expression of Da alone is sufficient to repress string expression, we studied the activity of a string reporter in S2 cells, which do not express most of the tissue-specific bHLH class II proteins (FlyBase). We analysed the activity of the luciferase gene under the regulation of a region of 0.7 Kb of the stg promoter (from −976 bp to −205 bp, 0 represents the first transcriptional initiation site). Although none of the Lac-Z reporters containing this region was sufficient to express ß-Gal at detectable levels in third instar imaginal (see above), probably because this region lacks the regulatory regions that we have identified to be necessary to activate string to its normal levels in the wing discs, it has previously been proposed that this fragment was required to regulate string activity during disc growth [38]. Thus, string transgenes possessing this 0.7 Kb region were sufficient to strongly rescue cell proliferation in stg mutant cells during disc development [38]. We have found that this reporter had a high activity in S2 cells (Figure 8 C). In this fragment we have identified two putative Da binding sites, between nucleotides −976 and −205 (Figure 8 A). An Electrophoretic Mobility Shift Assay was performed using a Da-GST fusion protein and the 0.7 Kb string minimal promoter containing the putative Da binding site. This assay showed that Da could bind to this fragment. Our results indicate that this binding was specific, because it could not be competed by oligonucleotides with a mutated binding site (Figure 8 B). Different results indicate that Da could bind to this region in physiological condictions. Thus, this 0.7 Kb string promoter fragment has been identified as an in vivo binding site for Da by Drosophila modENCODE project (Figure 5 A). We confirmed this result in the ChIP assay that we carried out to study stg promoter region (Figure 5 C).

We found that the activity of luciferase under the regulation of the 0.7 Kb string promoter was strongly down-regulated in S2 cells in the presence of Da (Figure 8 C).
When we deleted the two Da-binding sites contained in the 0.7 Kb string promoter, the activity of the mutant reporter was no longer repressed by Da, implying that the Da binding sites present in the 0.7 Kb string reporter are essential for its repressive activity (Figure 8 C). Surprisingly, luciferase expression driven by the mutant form of the reporter was less than that which is driven by the control reporter, suggesting that Da-binding sites are necessary to promote the normal activity of the string reporter. Although our results do not rule out the possibility that Da could form heterodimers with different factors to mediate this function, they indicate that the overexpression of Da is sufficient to initiate the repression of string.
The Rep domain of the Da protein has recently been shown to mediate the repression of Da/Twist heterodimer activity during myogenesis [40]. We investigated whether this domain was also involved in the repression of string. Overexpression of a truncated form of Da that lacks this domain (salEPv-Gal4 UAS-GFP/+; UAS-da-Δ -Rep) caused the same defects in cell division as wild type Da overexpression (Figure S6 A–G) and it also repressed string expression (Figure S6 H–J). We therefore concluded that this domain is not involved in the regulatory effect of Da on cell growth.
Discussion
It is widely accepted that basic helix-loop helix (bHLH) transcription factors, E proteins and their inhibitors, the Id factors, play important roles in controlling the balance between proliferation and differentiation that determines the correct proportion of differentiated cell types in the adult nervous system. In addition to their influence on nervous system precursors, these factors act as essential proliferative factors for a large variety of cell types in which they are expressed [16]–[18], [20], [49], [50]. In Drosophila, most epithelial cells express the sole representatives of class I and V bHLH factors found in this organism, Daughterless and Extramacrochaetae, respectively. In the present and previous studies, overexpression of da or the absence of emc in different tissues has been shown to block cell proliferation. These findings are consistent with the hypothesis that the expression of these factors defines thresholds for the differentiation of most cells, controlling the timing of differentiation and exit from the cell cycle [51]–[52].
In Drosophila, an evolutionarily conserved cross-interacting regulatory network that links E proteins and class V gene expression was recently identified [30]. Accordingly, changes in Emc levels alter da expression, and moreover, the effects of emc depletion on the control of cell proliferation are mediated by the upregulation of da expression. The present findings confirm that the elimination of da in emc mutant cells suppresses the growth defects caused by emc. Understanding how E proteins control cell proliferation is crucial to identify the mechanism by which emc regulates this process. Very little is known about the role of Da in controlling cell proliferation. Our results indicate that the elimination of emc or the overexpression of da results in a greater accumulation of cells in the G2 phase. Strikingly, the growth defects observed in these mutants were almost abolished by ectopic expression of string. Moreover, we present different results that indicate that Da transcriptionally regulates string expression. Our data are consistent with a model in which da binds to the stg promoter to regulate its expression. We have defined a regulatory region upstream of the transcriptional initiation site of stg that drives the expression of this gene in the wing discs and that is transcriptionally regulated by Da. In this region as well as throughout stg promoter we have identified multiple putative Da binding sites. The results obtained with our ChIP experiments, as well as the data from the modENCODE annotation project, suggest that Da binds in vivo to different regions of the stg promoter, including the regulatory region that we have identified as required for the regulation of the stg expression in the discs. Considered together, these results suggest that Da exerts this function binding to different regions of string promoter to repress its expression. Based on these findings, we propose that the main mitotic defect provoked by the overexpression of da or the absence of emc is the transcriptional downregulation of string.
Given the regulatory network that exists between Emc and Da [30], changes in Emc expression can modulate the levels of Da. Thus, when the levels of Emc were reduced, the levels of Da would increase. When the levels of Da rise above a certain threshold, the expression of string would be reduced, and then the cells will be retained in the G2 phase. Therefore, Da levels must be kept below this threshold in order for cells to remain in the proliferative cycle. Although our data indicate that the main mitotic defect caused by the overexpression of da, is the transcriptional down-regulation of string, some of our observations also suggest that da might be also affecting other factors that regulate cell cycle. Thus, whereas emc1 mutant cells exhibited a prolonged cell doubling time compared with control cells, alterations in other G/M regulators did not change the total duration of cell cycle [53]. A plausible explanation for this discrepancy is that the expression of different target genes involved in the control of cell cycle might be regulated by Da.
According to our model, we would expect the loss of da to increase string expression. However, neither the ectopic expression of emc nor the elimination of da induced the ectopic expression of stg. Although we do not fully understand the reasons for this, one possibility is that the system ensures its robustness through the existence of genetic redundancy. This redundancy may occur with other bHLH genes or another transcriptional repressor, and could ensure that cell proliferation will be precisely regulated even in the absence of one or more genes. Alternatively, it has previously been shown that different antagonistic transcriptional regulators control the expression of stg. For example, during eye development, it has been proposed that Pointed, an activator, and Tramtrack69, a repressor, directly regulate the transcription of string. The absence of the repressor was not sufficient to promote the transcription of stg, as a positive signal is necessary to activate its transcription [54].
The absence of emc blocks cell proliferation in different tissues. However, the proliferation of cells completely null for emc function can be recovered using the Minute technique [55], suggesting that while emc is not absolutely required for cell division, its activity is necessary for the competitive success of cells. We have shown that string downregulation is the main mitotic defect caused by the absence of emc or the overexpression of da. Cells homozygous for a null stg allele divide only once, generating clones of two cells that are eliminated by cell competition [56], [37]. Interestingly, very large clones of string mutant cells can be generated when the function of string is not completely eliminated and clones are induced using the Minute technique [37]. Hence, the longer cell cycle of cells in which string is depleted would appear to result in slower growth than that which is seen in wild-type neighbours, which subsequently outcompete the string-deficient cells. Accordingly, the downregulation of string caused by the elimination of emc or overexpression of da can produce a similar growth defect.
A large body of evidence demonstrates the involvement of Id proteins in the control of cell proliferation. This family of proteins has been extensively linked to cancer in humans and it mediates several processes that are regarded as hallmarks of cancer [57]. Id proteins trigger entry into S-phase, relieving E2F transcription from the inhibitory influence of pRB. Moreover, Ids interfere with the transcriptional activation by bHLH proteins of the cyclin-dependent kinase inhibitor p21/WAF1/CIP1. While much less is known about the role of E proteins as cell cycle regulators, our data from Drosophila define a new mechanism through which the E protein Da and its inhibitor, the Id orthologue emc, regulate cell cycle progression. In our model, emc is required to downregulate da, which in turn triggers mitosis via the transcriptional activation of a universally conserved cell cycle component, Cdc25. Since the mechanisms controlling cell cycle progression are evolutionarily conserved, it seems possible that the mechanism described here will be conserved in organisms other than Drosophila, and that mammalian E and Id proteins may also regulate cell proliferation. It will be important to ascertain whether E proteins repress mitosis by downregulating cdc25 expression. Although the role of Id factors in regulating G1-S transition is well documented, our data suggest that E proteins and class V factors also influence the G2 phase of the cell cycle. If the only role of Id factors were to promote the G1-S transition, they might simply arrest cells in the next phase of the cell cycle, the G2-M transition. However, the fact that Id proteins are associated with the development of tumours suggests that these factors drive cells through the different phases of the cell cycle.
Materials and Methods
Drosophila genetic strains
The Gal4 Drosophila ap-Gal4, en-Gal4 and salEPv-Gal4 lines were used in these experiments. We also used the Janelia Gal4 GMR_32B06, GMR_32C11 and GMR_32F08 lines. To restrict the expression of the Gal4 lines, we used tubG80ts, which inhibits Gal4 at 25°C. We used the UAS lines UAS-GFP, UAS-mCD8-GFP, UAS-da (kindly provided by I. Rodriguez and N. Baker), UAS-sc (kindly provided by S. Campuzano), UAS-diap I, UAS-emc and UAS-stg, as well as UAS lines to express the interference RNAs emc-RNAi (VDCR 100587), and da RNAi (VDRC 51300). The stg-107–112 LacZ (chr3R: 25.107.755–25.112.777) line was kindly donated by C.S. Lopes and F. Casares.
Generation of mosaics
Mitotic clones were generated by FLP-mediated mitotic recombination. Clones lacking emc were obtained by crossing emc1FRT2A with y w hsflp/FM7; tub-Gal4-UAS-GFP/Cyo; tub-Gal80-FRT2A/TM6B. Control clones were generated using the FRT2A chromosome. Clones of emcAP6 were generated by crossing y w hsflp; emcAP6 FRT80/TM6B with y w hsflp; Ubi-GFP-FRT80/TM6B flies. Clones lacking both emc and da were generated by crossing y w hsflp; da3 ck FRT40; p(da+)Ubi-GFP-FRT80/SM6a-TM6B with w; da3 ck FRT40; emcAP6 FRT80/S-T (the emcAP6 and da3 alleles were kindly provided by N. Baker). The clones lacking the E(spl) complex and simultaneously overexpressing UAS-da were generated by crossing UAS-da; E(spl)b32.2 FRT82 with y w hsflp tub-Gal4-UAS-GFP; tub-Gal80-FRT82/TM6B. The progeny of these crosses were heat-shocked at 37°C for 1 hour between 48 and 72 hours after egg laying (AEL).
Clones of cells expressing Gal4 [58] were induced 48–72 hours after egg laying by heat shock at 37°C for 12 minutes in larvae FLP1.22; Act5C<FRTyellow+FRT>Gal4 UAS-GFP/+ UAS-da.
To obtain clones expressing UAS-da using the Gal4/Gal80 system, we crossed UAS-da; FRT82 flies with y w hsflp tub-Gal4-UAS-GFP; tub-Gal80-FRT82/TM6B. The progeny of these crosses were heat-shocked at 37°C for 1 hour between 48 and 72 hours after egg laying.
emc1 Df(3L)H99 M+ and emc1 M+ clones were induced by crossing emc1mwh Df(3L)H99 and emc1 mwh flies by M(3)i55. The progeny of these crosses were irradiated between 48–72 hours after egg laying. Mitotic recombination was induced by X-ray in a Philips MG X-ray source operated at 100 KV, 15 mA; 2-mm A1 filter at a dose of 1000rad.
Discs were dissected and analysed 3 days after clonal induction. The clone size was quantified by counting the number of GFP-positive cells after staining with the nuclear marker TOPRO.
Cell doubling time was calculated as described previously [35].
Mitotic index
We calculated the mitotic index as the average value of the ratio between the number of cells in mitosis (PH3-positive cells) in salEPv-Gal4 or en-Gal4 domains and the area defined by the domains of expression these Gal4 lines in pixels (PH3-positive cells/size of salEPv-Gal4 or en-Gal4 domains). The salEPV-Gal4 and en-Gal4 domains of expression were defined by the expression of UAS-GFP. We analyzed at least 5 discs for each experiment. We only considered the wing blade and hinge territories. We measured the area using Photoshop.
All experiments were compared by Student's t-test. A p-value ≤ 0.05 was considered statistically significant.
Immunohistochemistry
Immunostaining of imaginal wing discs was performed according to standard protocols and using the following antibodies: rabbit anti-phospho-Histone 3 (1∶1000; Cell Signalling), rabbit anti-Emc (1∶50; kindly provided by Y.N. Jan), rabbit anti-Da (1∶100; kindly provided by C. Crominller), and mouse anti-ß-Gal (Promega). Mouse anti-Wg (1∶50) and mouse anti-CycB (1∶10) were obtained from the Developmental Studies Hybridoma Bank at the University of Iowa. Phalloidin-TRITC (Sigma) and TOPRO (Invitrogen) were also used to stain cell membranes and nuclei, respectively. All secondary antibodies (Molecular Probes) were used at dilutions of 1∶200.
Fluorescence Activated Cell Sorting (FACS)
Third instar wing imaginal discs from 30 larvae ap-Gal4 UAS-GFP/+; emc-RNAi/+ and ap-Gal4 UAS-GFP/+ (control discs) or salEPv-Gal4 UAS-GFP/UAS-da and salEPv-Gal4 UAS-GFP/+ (control discs) were incubated for 30 minutes at 28°C in 300 µl of trypsin solution (trypsin-EDTA, Sigma T4299) containing 1 µl of Hoechst (Hoechst 33342, trihydrochloride trihydrate H3570, Molecular Probes) in agitation. Trypsin digestion was stopped by the addition of 200 µl of 1% foetal bovine serum (FBS, Sigma 9665) in PBS. After centrifugation at 3500 rpm at 4°C, cells were suspended in 200 µl of 1% FBS and the cell cycle profiles of GFP-positive and GFP-negative cells were quantified on a FACS Vantage 2 (Becton Dickinson). The cell cycle profile of at least 3 independent experiments for each genotype was analysed using FloJo 7.5 software, and the differences were considered statistically significant at p-value ≤ 0.05.
In situ hybridization
The digoxigenin-labelled stg RNA probe was synthesized by Baonza and Freeman (2002) [54]. To perform the in situ hybridization protocol, third instar larvae were dissected in cold PBS-DEPC and fixed for 20 minutes in 4% formaldehyde, washed three times for 5 minutes in PBT (PBS-DEPC - 0.1% Tween 20), and fixed a second time for 30 minutes in 4% formaldehyde in PBT. After a further 3 washes in PBT, larvae were kept at −20°C in Hybridization Solution (HS: 50% formamide, 5× SSC, 100 mg/ml salmon sperm DNA, 50% heparin, 0.1% Tween 20). The hybridization was carried out overnight at 55°C with the probe at 1/50 dilution in HS, previously denaturalized by 10 minutes' incubation at 80°C. The discs were washed three times at 55°C in HS for 5 minutes, and washed again for several times in PBT. The discs were incubated for 2 h with an anti-digoxigenin antibody (Roche) in a 1∶4000 dilution in PBT. The colour reaction was carried out in 100 mM NaCl, 50 mM MgCl2, 100 mM Tris-HCl pH 9.5, 0.1% Tween 20, Nitroblue Tetrazolium Chloride (NBT) and Bromo-Chloro-Indolylphosphate (BCIP) (Roche). After colour was developed, the dissected larvae were rinsed several times in PBT and the discs were mounted in 70% glycerol. The discs were photographed with a Spot digital camera and a Zeiss Axioplan microscope.
RNA isolation and quantitative Real-Time PCR
Total RNA was isolated from a pool of 60 imaginal wing discs of the following genotypes: WT, ap-Gal4/+; UAS-emcRNAi and en-Gal4/UAS-da; tubG80ts/+ (maintained at 29°C for 48 h during larval development to allow Gal4 expression), using the TriPure extraction protocol (Roche). After DNAse treatment (DNA-free DNAse Treatment and Removal Reagents, Applied Biosystems), total RNA (1 µg) was used for reverse transcription employing the Superscript III First Strand Synthesis Supermix kit for qRT-PCR (Invitrogen). Quantitative PCR analysis was performed in a Cfx 384 Real-Time System (BioRad) using the following primers:
stg 5′ CAGCATGGATTGCAATATCAGTA 3′ and 5′ ACGACAGCTCCTCCTGGTC 3′.
cycB 5′ GATGCGGCACAGAAAAGACTC 3′ and 5′ TTCTTCCAGTGGCTGTCCA 3′
To adjust the differences between cDNA samples, we studied the expression of three genes that showed constitutive expression in the wing discs; they were act42A, tub84A and rpl32. We chose act42A expression to normalize the data. stg and cycB expression in control Wild Type flies was considered 1 and was compared to the expression in ap-Gal4/+; UAS-emcRNAi and en-Gal4/UAS-da; tub-Gal80ts flies. Four independent experiments were performed, and the cDNA variation was compared by Student's t-test. A p-value ≤ 0.05 was considered statistically significant.
Electrophoretic mobility shift assay (EMSA)
A Da-GST fusion protein was generated. da DNA was amplified by PCR with KOD enzyme (Novagen) using the primers 5′ CACCATGGGCGACCAGTGACGATG 3′ and 5′ CTATTGCGGAAGCTGGGCGTG 3′, using the EST LD29375 as template. The purified PCR product was cloned directionally into the pENTR/D-TOPO vector (Invitrogen). To generate the GST fusion protein, we used the LR Clonase II enzyme to introduce da into the pDEST 15 vector which contains a GST sequence N-terminal to the recombination sites (Invitrogen). Selected positive clones were verified by sequencing. The da - pDEST 15 construct was transformed into E. coli BL21 DE3 strain. Protein expression was induced with 1 mM IPTG for 2 h at 30°C, and soluble proteins were extracted following standard procedures. The Da-GST fusion protein was purified by affinity chromatography using a Glutathione Sepharose 4B column (GE Healthcare). Purified proteins were eluted with 10 mM Glutathione. Protein-containing fractions were concentrated using Amicon Ultra 10K columns (Millipore) and analysed in a 10% polyacrylamide gel stained with Coommasie Blue. Protein concentration was determined using Bio Rad DC protein assay.
Band-shift assays were performed using the following primers:
Stg prom cy3 and cy5: 5′ TAGCTCATCAGCTGATCGTGA 3′ and 3′ TCACGATCAGCTGATGAGCTA 5′;
Stg prom cy5*: 5′ TAGCTCATACTAGTATCGTGA 3′ and 5′ TCACGATACTAGTATGAGCTA 3′.
The mutated primer was generated by switching purine for pyrimidine bases. Double-stranded primers (50 ng) were incubated with 5 mg of Da-GST protein for 30 minutes at room temperature in the following 5X buffer: 50 mM HEPES (pH 7.6), 200 mM KCl, 2 mM EDTA, 5 mM MgCl2, 1.5 mM DTT. Samples were run in a 6% DNA Retardation Gel (Invitrogen) for 3 h at 90 V protected from the light and then analysed in a fluorescence scanner.
Chromatin immunoprecipitation and quantitative Real-Time PCR assay
To perform this assay we followed the protocol published in [59], but on a smaller scale. For each chromatin preparation we fixed 200 mg of 0–24 h WT embryos in 670 µl crosslinking solution, 33 µl Formaldehyde 40% and 2 ml n-Heptane, shaking vigorously for 15 minutes. After washing steps, we performed cell lysis steps in 1 ml volume. After nuclear lysis, the 1-ml aliquots were split into 100-µl aliquots for the sonication step. This was performed on a Bioruptor NextGen (Diagenode), in 30 cycles of 30 sec ON/30 sec OFF. 50 µl of sonicated chromatin were kept to perform the chromatin quality check and the rest was liquid nitrogen-frozen and stored at −80° until use. The size distribution of the sonicated chromatin was analysed in a 1% agarose gel stained with EtBr. Chromatin fragments obtained were distributed between 1 Kb and 100 bp, with a predominance of the 500 bp fragments.
Immunoprecipitation was carried out with 200 µl of sonicated chromatin per experiment. To assess the capability of Daughterless to bind different regions of DNA, we used an anti-Da rabbit polyclonal antibody at a 1∶200 dilution, kindly provided by C. Cronmiller. All the immunoprecipitations were eluted in the final step in a 10 µl final volume.
We analysed three different DNA regions that were candidate to be Da targets. As a positive control, we amplified a fragment of the achaete promoter (chrX: 262.623–265.355) containing two Da binding sites. This gene has been extensively studied as a direct target of Da transcriptional activity [60]. Inside the string regulatory region, we studied the promoter region, located in chr3R: 25,081,039–25,081,121 (named in Figure 5 as stg prom). We also analysed a region included in the stg-107–112 LacZ line and the Janelia GMR_32F08 line that contains an stg enhancer that directs its expression in the wing disc (Figure 5). This fragment was previously annotated as a Da target in the modENCODE project. It contains several putative binding sites for Da, symbolized in Figure 5. We amplified a small fragment inside this region located in chr3R: 25,111,328–25,111,401 (named in Figure 5 as stg 25.111). As negative control, we used the gene CG12255 that codes for the Cuticular Protein 72Eb (chr3L: 16,358,278–16,358,337). This gene does not contain any Da putative binding site.
Quantitative PCR analysis was performed in an AB 7900HT (Applied Biosystems), using the following primers:
ac promoter
Fw 5′ GGTATCAGGGCCTAGGGATCC 3′
Rv 5′ GATCCTTCAGTGATGATGCTGTTG 3′
stg promoter
Fw 5′ CGCGCCCATTAGCTCATC 3′
Rv 5′ CGAATGTGCTGAATATGCCG 3′
stg 25.111
Fw 5′ GTTTGCTTTAGCGGGAAACTC 3′
Rv 5′ CGGATTGCGCAAGAACAG 3′
CG12255
Fw 5′ CCGTGGATGGTGTGATCC 3′
Rv 5′ TCTGGGTTTCGCCATTTG 3′
Since DNA concentration was very low in the immunoprecipitated samples, we charged 2 µl of DNA on each PCR. We also ran 5 ng of a non-immunoprecipitated sample (Input) to check the availability of the sequences and that the primers functioned correctly.
To estimate the differences in DNA content between the different immunoprecipitated samples, we compared the results obtained for the different regions in study (achaete and string regulatory regions) with the data obtained for the cg12255. More specifically, we subtracted the Quantification Cycles (Cq) value from the mean Cq obtained for the CG12255 (ddCq), and then calculated the Relative Quantity of template (RQ) using the formula RQ = −2ddCq.
All experiments were repeated at least 3 times and the DNA variation was compared by Student's t-test. A p-value ≤ 0.05 was considered statistically significant.
Luciferase reporter experiments
A 770 bp (−976 to −205) region upstream of the transcriptional initiation site was amplified using KOD enzyme (Novagen) by PCR using the stg 10.5 line (kindly provided by B. Edgar) as template, using the following primers: 5′ TGGGGCTCCACACTATTTTC 3′ and 5′ GATGGTAGTCCTTGGTTTTTGG 3′. The PCR product was cloned into the pGL2 vector downstream of the HS43 promoter using the KpnI (5′) and XhoI (3′) restriction endonucleases (NE Biolabs). To mutate the two E-boxes present in this fragment, we used Pfu enzyme (Promega) to perform PCR using the aforementioned stg-pGL2 construct as template to sequentially eliminate both binding sites. The PCR products were subsequently digested with the DpnI enzyme (Roche). Deletion of both E-boxes was confirmed by sequencing. The following primers were used:
Deletion of first binding site,
5′ CGCCCATTAGCTCATATCGTGATCGGCCGG 3′
5′ CCGGCCGATCACGATATGAGCTAATGGGCG 3′;
Deletion of second binding site,
5′ GGGTGCGGTTATAAAAACCTCGGCATATTCAGC 3′
5′ GCTGAATATGCCGAGGTTTTATAACCGCACCC 3′.
To overexpress Da in the S2 cells, the Da coding sequence was amplified with KOD enzyme (Novagen) by PCR using the EST LD29371 as template. The primers 5′ ATGGCGACCAGTGAC 3′ and 5′ CTATTGCGGAAGC 3′ containing the restriction endonucleases EcoRV (5′) and NotI (3′) were used. The purified PCR product was cloned into the pAC5.1 vector using T4 ligase (Promega). Subconfluent Drosophila S2 cells (2×10⁶) were transfected with 2 µg of total DNA by electroporation using Nucloeofector (Lonza), and different concentrations of da-pAC5.1 (0.25 to 1 µg) were transfected with similar repressive results. Renilla plasmid (30 ng) was co-transfected in each experiment as a control for transfection efficiency. Cells were grown after transfection for 24 h at 25°C in 10% FBS Insect Xpress media (Lonza) and the Dual-Luciferase Reporter Assay Kit (Promega) was used to develop luciferase activity. All experiments were performed at least three times and compared by Student's t-test. A p-value≤0.05 was considered statistically significant.
Quantification of the levels of GFP
GFP reporter activity was established by quantifying GFP levels in imaginal wing discs expressing UAS-da and UAS-GFP under the control of the different Gal4 used, and comparing them with GFP expressed by the same Gal4 lines without expressing UAS-da. ImageJ was used to measure the intensity of GFP in the wing blade. For each experiment, at least 9 wing discs were quantified using the measurement function. We calculated the average levels of GFP activity. We used the mean grey value to define the intensity of the GFP. In all cases, the images of the discs were obtained in a confocal microscope using the same settings. All experiments were compared by Student's t-test. A p-value≤0.05 was considered statistically significant
Supporting Information
Zdroje
1. EdgarBA, LehnerCF (1996) Developmental control of cell cycle regulators: a fly's perspective. Science 274 : 1646–1652.
2. ThompsonBJ (2010) Developmental control of cell growth and division in Drosophila. Curr Opin Cell Biol 22 : 788–794.
3. AtchleyWR, FitchWM (1997) A natural classification of the basic helix-loop-helix class of transcription factors. Proc Natl Acad Sci U S A 94 : 5172–5176.
4. MassariME, MurreC (2000) Helix-loop-helix proteins: regulators of transcription in eucaryotic organisms. Mol Cell Biol 20 : 429–440.
5. EllenbergerT, FassD, ArnaudM, HarrisonSC (1994) Crystal structure of transcription factor E47: E-box recognition by a basic region helix-loop-helix dimer. Genes Dev 8 : 970–980.
6. MaPC, RouldMA, WeintraubH, PaboCO (1994) Crystal structure of MyoD bHLH domain-DNA complex: perspectives on DNA recognition and implications for transcriptional activation. Cell 77 : 451–459.
7. HenthornP, McCarrick-WalmsleyR, KadeschT (1990) Sequence of the cDNA encoding ITF-1, a positive-acting transcription factor. Nucleic Acids Res 18 : 677.
8. AronheimA, ShiranR, RosenA, WalkerMD (1993) The E2A gene product contains two separable and functionally distinct transcription activation domains. Proc Natl Acad Sci U S A 90 : 8063–8067.
9. AronheimA, ShiranR, RosenA, WalkerMD (1993) Cell-specific expression of helix-loop-helix transcription factors encoded by the E2A gene. Nucleic Acids Res 21 : 1601–1606.
10. LassarAB, DavisRL, WrightWE, KadeschT, MurreC, et al. (1991) Functional activity of myogenic HLH proteins requires hetero-oligomerization with E12/E47-like proteins in vivo. Cell 66 : 305–315.
11. BenezraR, DavisRL, LockshonD, TurnerDL, WeintraubH (1990) The protein Id: a negative regulator of helix-loop-helix DNA binding proteins. Cell 61 : 49–59.
12. RiechmannV, van CruchtenI, SablitzkyF (1994) The expression pattern of Id4, a novel dominant negative helix-loop-helix protein, is distinct from Id1, Id2 and Id3. Nucleic Acids Res 22 : 749–755.
13. SunXH, CopelandNG, JenkinsNA, BaltimoreD (1991) Id proteins Id1 and Id2 selectively inhibit DNA binding by one class of helix-loop-helix proteins. Mol Cell Biol 11 : 5603–5611.
14. PerkJ, IavaroneA, BenezraR (2005) Id family of helix-loop-helix proteins in cancer. Nat Rev Cancer 5 : 603–614.
15. LingMT, WangX, ZhangX, WongYC (2006) The multiple roles of Id-1 in cancer progression. Differentiation 74 : 481–487.
16. EngelI, MurreC (2004) E2A proteins enforce a proliferation checkpoint in developing thymocytes. Embo J 23 : 202–211.
17. PeveraliFA, RamqvistT, SaffrichR, PepperkokR, BaroneMV, et al. (1994) Regulation of G1 progression by E2A and Id helix-loop-helix proteins. Embo J 13 : 4291–4301.
18. SongS, CoopermanJ, LettingDL, BlobelGA, ChoiJK (2004) Identification of cyclin D3 as a direct target of E2A using DamID. Mol Cell Biol 24 : 8790–8802.
19. RothschildG, ZhaoX, IavaroneA, LasorellaA (2006) E Proteins and Id2 converge on p57Kip2 to regulate cell cycle in neural cells. Mol Cell Biol 26 : 4351–4361.
20. LydenD, YoungAZ, ZagzagD, YanW, GeraldW, et al. (1999) Id1 and Id3 are required for neurogenesis, angiogenesis and vascularization of tumour xenografts. Nature 401 : 670–677.
21. YokotaY, MansouriA, MoriS, SugawaraS, AdachiS, et al. (1999) Development of peripheral lymphoid organs and natural killer cells depends on the helix-loop-helix inhibitor Id2. Nature 397 : 702–706.
22. BotasJ, Moscoso del PradoJ, García-BellidoA (1982) Gene-dose titration analysis in the search of trans-regulatory genes in Drosophila. EMBO J 1 : 307–310.
23. EllisHM, SpannDR, PosakonyJW (1990) extramacrochaetae, a negative regulator of sensory organ development in Drosophila, defines a new class of helix-loop-helix proteins. Cell 61 : 27–38.
24. GarrellJ, ModolellJ (1990) The Drosophila extramacrochaetae locus, an antagonist of proneural genes that, like these genes, encodes a helix-loop-helix protein. Cell 61 : 39–48.
25. CampuzanoS (2001) Emc, a negative HLH regulator with multiple functions in Drosophila development. Oncogene 20 : 8299–8307.
26. BrownNL, SattlerCA, PaddockSW, CarrollSB (1995) Hairy and Emc negatively regulate morphogenetic forrow progression in the Drosophila eye. Cell 80 : 879–887.
27. BaonzaA, FreemanM (2001) Notch signalling and the initiation of neural development in the Drosophila eye. Development 128 : 3889–3898.
28. de CelisJF, BaonzaA, Garcia-BellidoA (1995) Behavior of extramacrochaetae mutant cells in the morphogenesis of the Drosophila wing. Mech Dev 53 : 209–221.
29. BaonzaA, Garcia-BellidoA (1999) Dual role of extramacrochaetae in cell proliferation and cell differentiation during wing morphogenesis in Drosophila. Mech Dev 80 : 133–146.
30. BhattacharyaA, BakerNE (2011) A network of broadly expressed HLH genes regulates tissue-specific cell fates. Cell 147 : 881–892.
31. IavaroneA, GargP, LasorellaA, HsuJ, IsraelMA (1994) The helix-loop-helix protein Id-2 enhances cell proliferation and binds to the retinoblastoma protein. Genes Dev 8 : 1270–1284.
32. LasorellaA, IavaroneA, IsraelMA (1996) Id2 specifically alters regulation of the cell cycle by tumor suppressor proteins. Mol Cell Biol 16 : 2570–2578.
33. PopovaMK, HeW, KorenjakM, DysonNJ, MoonNS (2011) Rb deficiency during Drosophila eye development deregulates EMC, causing defects in the development of photoreceptors and cone cells. J Cell Sci 124 : 4203–4212.
34. LeeT, LuoL (1999) Mosaic analysis with a repressible cell marker for studies of gene function in neuronal morphogenesis. Neuron 22 : 451–461.
35. Garcia-AlonsoL, Garcia-BellidoA (1988) extramacrochaetae, a trans-acting gene of the achaete-scute complex of Drosophila is involved in cell communication. Roux's Arch. Dev. Biol 197 : 328–338.
36. WhiteK, GretherME, AbramsJM, YoungL, FarrellK, et al. (1994) Genetic control of programmed cell death in Drosophila. Science 264 : 677–682.
37. NeufeldTP, de la CruzAF, JohnstonLA, EdgarBA (1998) Coordination of growth and cell division in the Drosophila wing. Cell 93 : 1183–1193.
38. LehmanDA, PattersonB, JohnstonLA, BalzerT, BrittonJS, et al. (1999) Cis-regulatory elements of the mitotic regulator, string/Cdc25. Development 126 : 1793–1803.
39. NègreN, BrownCD, MaL, BristowCA, MillerSW, et al. (2011) Nature 471 : 527–31.
40. WongMC, CastanonI, BayliesMK (2008) Daughterless dictates Twist activity in a context-dependent manner during somatic myogenesis. Dev Biol 317 : 417–429.
41. O'BrochtaD, BryantPJ (1985) A zone of non-proliferating cells at a lineage restriction boundary in Drosophila. Nature 313 : 138–141.
42. PhillipsRG, WhittleJRS (1993) wingless expression mediates determination of peripheral nervous system elements in late stages of Drosophila wing disc development. Development 118 : 427–438.
43. JohnstonLA, EdgarBA (1998) Wingless and Notch regulate cell-cycle arrest in the developing Drosophila wing. Nature 394 : 82–84.
44. DelidakisC, Artavanis-TsakonasS (1992) The Enhancer of split locus of Drosophila encodes seven independent helix-loop-helix proteins. Proc Nat Acad Sci USA 89 : 8731–8735.
45. KnustE, SchronsH, GraweF, Campos-OrtegaJA (1992) Seven genes of the Enhancer of split complex of Drosophila melanogaster encode Helix-loop-Helix protein. Genetics 132 : 505–518.
46. JenningsB, PreissA, DelidakisC, BrayS (1994) The Nocth signalling pathway is requiered for Enhancer of split bHLH protein expression during neurogenesis in the Drosophila embryo. Development 120 : 3537–3548.
47. de CelisJF, de CelisJ, LigoxiarsP, PreissA, DelidakisC, et al. (1996) Functional relationships between Notch and bHLH genes of the E(spl) complex: the E(spl) genes mediate only a subset of Notch activies during imaginal development. Development 122 : 2719–2728.
48. San JuanBP, Andrade-ZapataI, BaonzaA (2012) The bHLH factors Dpn and members of the E(spl) complex mediate the function of Notch signalling regulating cell proliferation during wing disc development. Biol Open 1 : 667–676.
49. HaraE, YamaguchiT, NojimaH, IdeT, CampisiJ, et al. (1994) Id-related genes encoding helix-loop-helix proteins are required for G1 progression and are repressed in senescent human fibroblasts. J Biol Chem 269 : 2139–2145.
50. LasorellaA, BoldriniR, DominiciC, DonfrancescoA, YokotaY, et al. (2002) Id2 is critical for cellular proliferation and is the oncogenic effector of N-myc in human neuroblastoma. Cancer Res 62 : 301–306.
51. VaessinH, BrandM, JanLY, JanYN (1994) daughterless is essential for neuronal precursor differentiation but not for initiation of neuronal precursor formation in Drosophila embryo. Development 120 : 935–945.
52. BrownNL, SattlerCA, PaddockSW, CarrollSB (1995) Hairy and emc negatively regulate morphogenetic furrow progression in the Drosophila eye. Cell 80 : 879–887.
53. ReisT, EdgarBA (2004) Negative regulation of dE2F1 by cyclin-dependent kinases controls cell cycle timing. Cell 117 : 253–264.
54. BaonzaA, MurawskyCM, TraversAA, FreemanM (2002) Pointed and Tramtrack69 establish an EGFR-dependent transcriptional switch to regulate mitosis. Nat Cell Biol 4 : 976–980.
55. BhattacharyaA, BakerNE (2009) The HLH protein Extramacrochaetae is required for R7 cell and cone cell fates in the Drosophila eye. Dev Biol 327 : 288–300.
56. KylstenP, SaintR (1997) Imaginal tissues of Drosophila melanogaster exhibit different modes of cell proliferation control. Dev Biol 192 : 509–522.
57. LasorellaA, UoT, IavaroneA (2001) Id proteins at the cross-road of development and cancer. Oncogene 20 : 8326–8333.
58. ItoK, AwanoW, SuzukiK, HiromiY, YamamotoD (1997) The Drosophila mushroom body is a quadruple structure of clonal units each of which contains a virtually identical set of neurones and glial cells. Development 124 : 761–771.
59. SandmannT, JakobsenJS, FurlongEM (2007) ChIP-on-chip protocol for genome-wide analysis of transcription factor binding in Drosophila melanogaster embryos. Nature protocols 1 : 2839–2855.
60. MurreC, McCawPS, VäsinH, CaudyM, JanLY, et al. (1989) Interactions between heterologous helix-loop-helix proteins generate complexes that bind specifically to a common DNA sequence. Cell 58 : 537–544.
Štítky
Genetika Reprodukční medicínaČlánek vyšel v časopise
PLOS Genetics
2014 Číslo 3
- Kazuistika – Perspektivy využití precizované medicíny v rámci personalizované specifické terapie onkologických pacientů
- Nobelova cena za chemii pro genetické nůžky: Objev, který změní naši budoucnost?
- Technologie na bázi RNA v klinické praxi: od přebarvených petúnií k terapii vzácných a dosud jen obtížně léčitelných chorob u lidí
- „Nepředstavovali jsme si, že náš výzkum povede přímo ke vzniku nových léků, dokonce ještě za našeho života“
- Bezplatné služby pro diagnostiku ATTRv amyloidózy pro kardiology
Nejčtenější v tomto čísle
- Worldwide Patterns of Ancestry, Divergence, and Admixture in Domesticated Cattle
- Genome-Wide DNA Methylation Analysis of Human Pancreatic Islets from Type 2 Diabetic and Non-Diabetic Donors Identifies Candidate Genes That Influence Insulin Secretion
- Genetic Dissection of Photoreceptor Subtype Specification by the Zinc Finger Proteins Elbow and No ocelli
- GC-Rich DNA Elements Enable Replication Origin Activity in the Methylotrophic Yeast
Zvyšte si kvalifikaci online z pohodlí domova
Mazová zátka a její řešení
nový kurzVšechny kurzy