
Epigenetic Control of Effector Gene Expression in the Plant Pathogenic Fungus
Effectors are key players in pathogenicity of microbes toward plants. Effector genes usually show concerted expression during plant infection but how this concerted expression is generated remains a largely unexplored research topic. Epigenetic mechanisms are involved in genome maintenance and integrity but are increasingly considered as important for regulation of gene expression in numerous and diverse organisms. Here we show that the genomic environment has impact on expression of Leptosphaeria maculans effector genes, and that an epigenetic mechanism that relies on two proteins involved in heterochromatin formation and maintenance, HP1 and DIM-5, modulates this expression, leading to repression during growth in axenic culture. Chromatin decondensation by removal of histone H3 lysine 9 methylation and/or HP1 is presumably a prerequisite for effector gene expression during primary infection of oilseed rape. Thus we show chromatin-based transcriptional regulation that can act on effector gene expression in fungi. Our study highlights the importance of heterochromatic landscapes, not only for genome maintenance but also in rapid and efficient adaptation of organisms to changing environmental situations.
Published in the journal:
. PLoS Genet 10(3): e32767. doi:10.1371/journal.pgen.1004227
Category:
Research Article
doi:
https://doi.org/10.1371/journal.pgen.1004227
Summary
Effectors are key players in pathogenicity of microbes toward plants. Effector genes usually show concerted expression during plant infection but how this concerted expression is generated remains a largely unexplored research topic. Epigenetic mechanisms are involved in genome maintenance and integrity but are increasingly considered as important for regulation of gene expression in numerous and diverse organisms. Here we show that the genomic environment has impact on expression of Leptosphaeria maculans effector genes, and that an epigenetic mechanism that relies on two proteins involved in heterochromatin formation and maintenance, HP1 and DIM-5, modulates this expression, leading to repression during growth in axenic culture. Chromatin decondensation by removal of histone H3 lysine 9 methylation and/or HP1 is presumably a prerequisite for effector gene expression during primary infection of oilseed rape. Thus we show chromatin-based transcriptional regulation that can act on effector gene expression in fungi. Our study highlights the importance of heterochromatic landscapes, not only for genome maintenance but also in rapid and efficient adaptation of organisms to changing environmental situations.
Introduction
During infection, plant pathogenic microbes secrete a set of molecules collectively known as effectors, pathogenicity determinants that modulate plant innate immunity and enable parasitic infection [1]. Effectors are either targeted to the apoplast or the cytoplasm of the plant where they are mainly involved in overcoming the host immune defence system, nutrient uptake and, eventually, symptom development [2]. In many plant pathogenic microbes, effectors show common features. They are small proteins, potentially secreted (as many possess signal peptide sequences), generally cysteine-rich and usually have no homology to known proteins in databases [3]. Thus, these proteins are referred to as Small Secreted Proteins (SSPs). Bioinformatic analyses based on common features of effectors aim to identify the complete repertoire of candidate effector genes of several oomycetes [4], [5] and filamentous fungi [6]–[8]. These studies highlighted another common trait of effector genes: their concerted up-regulation upon plant infection which suggests co-operation between a subset of effectors at different time points [9], [10].
While high throughput functional analyses of effectors are in progress in several research groups (e.g. in Ustilago maydis [6], in Magnaporthe oryzae [11] and in Phytophthora infestans [12]), less effort has focused on the regulation of effector gene expression. Effector genes of filamentous plant pathogens are often located close to dispersed transposable elements (TEs) or in TE-rich regions of the genome, like dispensable chromosomes or telomeres [13]. For example, in Leptosphaeria maculans, the effector gene encoding AvrLm11 was found to be located on a conditionally dispensable chromosome (CDC) [14], while the avirulence gene of M. oryzae Avr-Pita is located in a sub-telomeric region [15]. In Fusarium oxysporum, all known effector genes are located in one of its four dispensable chromosomes [16], and in P. infestans effector genes are located in highly plastic genomic regions, enriched in TEs [5]. The location of effector genes in dynamic genomic regions, enriched in TEs is suggested to have an impact on adaptability to new host plants [17], [18]. Here we postulate that it could also influence their expression.
L. maculans is an ascomycete fungus belonging to the Dothideomycete class that causes stem canker of oilseed rape (Brassica napus). Sequencing of the L. maculans genome has revealed an unusual genome structure compared to other fungi as it contains alternating GC-equilibrated (∼51% GC) and AT-rich (∼33.9% GC) blocks, which we call “GC-” and “AT-isochores”. The GC-isochores are enriched in housekeeping genes whereas the AT-isochores are gene-poor, enriched in TEs truncated and degenerated by Repeat-Induced Point mutation (RIP) and comprise 36% of the genome but only 5% of the genes [7]. One hundred and twenty-two (∼20%) of all genes encoding SSPs have been identified in the AT-isochores [7] including the CDC of L. maculans. These genes include five with experimentally demonstrated effector activity (AvrLm1, AvrLm6, AvrLm4-7, LmCys2 and AvrLm11; [14], [19]–[21], and our unpublished data). These effector genes share similar expression profiles, namely very low expression in axenic culture and a drastic increase in expression during primary leaf infection, with a peak of expression 7 days post inoculation (dpi). This expression pattern is a common characteristic of SSP-encoding genes located in AT-isochores, as 73% of these genes are overexpressed at 7 dpi (compared to 19% of SSP-encoding genes in GC-isochores) when compared to growth in axenic culture [7]. AT-isochores in L. maculans were postulated to be heterochromatic regions because they share characteristics of heterochromatin in many organisms: (i) they are rich in TEs affected by RIP [7], [22], [23]), (ii) they are gene poor and (iii) they show lower rates of recombination compared to GC-isochores [7]. Based on this, we speculated that AT-isochores may be targets of reversible epigenetic modifications that affect the regulation of effector genes and would thus be instrumental in concerted expression at the onset of plant infection.
Most eukaryotic DNA is associated with histones and non-histone proteins to form chromatin. At least two different states of chromatin are commonly distinguished: gene-rich euchromatin and gene-poor heterochromatin [24]. Euchromatin is less condensed, more accessible and generally more easily transcribed than heterochromatin. The latter is highly condensed and less accessible to the transcriptional machinery. Additionally, heterochromatin is discriminated into “constitutive heterochromatin”, mainly found at centromeres, sub–telomeres and rDNA clusters, and is thought to be involved in genome stability and integrity, and “facultative heterochromatin” that is dispersed throughout the genome. Facultative heterochromatin has attracted considerable attention, as it allows for epigenetic regulation of gene expression by changing chromatin states. Chromatin states can be classified by distinct combinations of post-translational modifications targeted to histones, commonly referred to as the “histone code” [25], [26]. Heterochromatin is enriched in specific modifications, which are thought to be heritable and reversible, and thus called “epigenetic”. These modifications include lysine hypoacetylation of histone H3 and H4, as well as trimethylation of H3 lysine 9 (H3K9me3) and lysine 27 (H3K27me3) [27]. Other hallmarks are presence of Heterochromatin Protein 1 (HP1) and cytosine DNA methylation [24]. In fungi, mechanisms of heterochromatin formation have been investigated mostly in Neurospora crassa, where H3K9me3 is catalysed by DIM-5 [28], [29]. The HP1 ortholog of N. crassa binds to H3K9me3 via its chromo domain and recruits the DNA methyltransferase DIM-2 via HP1 chromo-shadow domain, resulting in DNA methylation in essentially all AT-rich heterochromatic regions [28]–[32].
On the basis of the specific location of effector genes in AT-isochores of the genome of L. maculans, we investigated whether the concerted expression of these effector genes is influenced by their genomic environment. We generated L. maculans transformants in which expression of the L. maculans orthologs of DIM-5 and HP1 (LmDIM5 and LmHP1) was decreased, analysed chromatin states in the transformants by cytology and performed oligoarray experiments to study the influence of LmHP1 and LmDIM5 on gene expression, with a focus on effector genes. We also analysed effects of changing genomic environment from AT - to GC-isochores on effector gene expression. Our data showed HP1 - and DIM-5-mediated repression of effector genes during growth in axenic culture and strongly suggest an epigenetic mechanism is the basis of concerted expression of effector genes during plant infection.
Results
Identification and RNAi silencing of orthologs of HP1 and DIM-5 in L. maculans
Orthologs of N. crassa DIM-5 and HP1 were identified in L. maculans by bidirectional best hits with BLASTp [28], [30]. LmHP1 encodes a protein of 237 amino acids (37% of all residues are identical to N. crassa HP1), containing the typical N-terminal chromo domain (IPR000953) and the C-terminal chromo-shadow domain (IPR008251; Figure 1) [33]. LmHP1 was further annotated by RACE-PCR. Five introns, a 5′UTR of 140 bp and a 3′UTR of 444 bp were identified (GenBank accession number CBX96122). LmDIM5 encodes a protein of 516 amino acids (36% identity with N. crassa DIM-5). This family of Su(var)3–9 histone methyltransferases was first identified in Drosophila melanogaster [34] and is evolutionarily conserved. LmDIM5 exhibits the two typical domains of DIM-5 proteins described so far, a central Pre-SET (or CXC) domain (IPR007728) and a C-terminal SET domain (IPR001214) (Figure 2) [35]. The N-terminal region of DIM-5 is less conserved (Figure 2), as some proteins (i.e. Su[var]3–9 from D. Melanogaster, Homo sapiens and Clr4 from Schizosaccharomyces pombe [34], [36], [37]) have a chromo domain, which is absent from the protein in filamentous ascomycetes (Figure 2). Six introns, a 5′UTR of 259 bp and a 3′UTR of 262 bp were identified in LmDIM5 by RACE-PCR (GenBank accession number CBX92341).


LmHP1 and LmDIM5 were silenced by RNAi. While all primary LmDIM5 transformants grew, only one-third (30/89) of the LmHP1 transformants were able to grow after primary transformants were plated on a second round of selection medium. Expression of LmHP1 and LmDIM5 during mycelial growth was determined by qRT-PCR in a subset of transformants (Figure 3). Six transformants showed only 12–20% of LmDIM5 expression compared to the wild type strain, while expression of LmHP1 was never lower than 33% of wild type expression (Figure 3). Five transformants per construct were selected for further characterisation, four transformants with significant levels of silencing and one control transformant each for which LmHP1 or LmDIM5 expression was similar to that of wild type.

Silencing of LmDIM5 and LmHP1 result in growth defects but only LmDIM5 silencing reduces pathogenicity
Transformants in which either LmHP1 or LmDIM5 were silenced showed an average linear growth reduction of 34% in axenic culture when compared to wild type and non-silenced transformants (Figures 4A and 4B). These transformants were not affected in sexual reproduction when crossed with strain v24.1.2 (data not shown). No pathogenicity defect was associated with silencing of LmHP1 (Figure 4C) but silencing of LmDIM5 resulted in reduced pathogenicity (Figure 4D).

Chromatin decondensation is observed in nuclei of silenced-LmDIM5 transformants during mycelial growth
We used LmHP1 as a convenient cytological marker for heterochromatin. As the nuclear localisation of HP1 depends on the action of N. crassa DIM-5 [30], we investigated localisation of LmHP1 in nuclei of wild type and in silenced-LmDIM5 transformants. A LmHP1-GFP fusion under the control of the LmHP1 endogenous promoter was introduced in the wild type strain and in two different silenced-LmDIM5 transformants (.1 and .4, with residual LmDIM5 expression of 20 and 16%, respectively). Nuclei were visualised by DAPI staining. In the wild type strain, LmHP1-GFP was located within strongly fluorescent foci throughout the nucleus and the same kind of dense foci were revealed by DAPI staining demonstrating coexistence of condensed and relatively open chromatin states along the chromosomes, and the preferential localisation of LmHP1-GFP to densely DAPI-stained chromatin regions (Figure 5). In the two silenced-LmDIM5 transformants, DAPI staining in nuclei was more diffuse with fewer foci, and LmHP1-GFP was also seen as more diffuse staining throughout nuclei, with only the silenced-LmDIM5.1 showing a few clear foci in the nuclei (12 nuclei out of 100). The LmHP1-GFP localisation observed in the wild type strain and in the silenced-LmDIM5 transformants is consistent with changes of HP1 localisation observed in N. crassa dim-5 mutants [30]. Thus, LmHP1 localises in an LmDIM5-dependent manner to heterochromatic regions in L. maculans, and the silencing of LmDIM5 triggers at least partial chromatin decondensation.

Silencing of LmHP1 and LmDIM5 results in up-regulation of pathogenicity-related genes during mycelial growth
We compared expression of all L. maculans gene models during growth in axenic culture of a wild type isolate, the silenced-LmDIM5.4 transformant (with 16% residual expression of LmDIM5, and for which chromatin decondensation was more pronounced; Figure 5) and the silenced-LmHP1.5 transformant (with 35% residual expression of LmHP1) using oligoarrays. The expression level of eight or six percent of the L. maculans gene models were respectively influenced by the silencing of LmDIM5 or LmHP1 (978 or 746 out of 12,012 genes with a transcriptomic support). Regarding genes down-regulated compared to the wild type strain, 72% and 59% encode proteins with no homology or hypothetical proteins with unknown functions in respectively the silenced-LmHP1 and the silenced-LmDIM5 transformants. Among the genes encoding proteins with predicted functions, we identified respectively six and four percent of putative SSP-encoding genes (Tables S1 and S2). We also found a gene encoding a protein putatively related to pathogenesis down-regulated in the silenced-LmDIM5 transformant (Table S2). In the silenced-LmDIM5 transformant, among the 390 up-regulated genes compared to the wild type isolate (Table S3), 283 encoded predicted proteins with no homology detected by BLAST or hypothetical proteins with unknown functions. The remaining up-regulated genes were mainly putative SSP-encoding genes, transporters and enzymes known to be accessory enzymes involved in the biosynthesis and transport of secondary metabolites (such as oxidases, MFS transporters, dehydrogenases and cytochrome P450 monooxygenases), CAZymes and the ortholog of the sterigmatocystin cluster regulatory gene in Aspergilli, AflR [38] (Table S3). Overall, the same functional categories of up-regulated genes were observed in the silenced-LmHP1 background, where we found 369 up-regulated genes, including 206 genes with predicted functions (Table S4). In addition, we also identified seven genes involved in DNA repair, including three genes encoding DNA repair proteins of the Rad family (Table S4), suggesting that silencing of LmHP1 may somehow trigger DNA damage. We further investigated the 71 genes that were up-regulated in both silenced-LmDIM5 and -LmHP1 transformants (Table S5). About half of these genes encode predicted or hypothetical proteins. Among genes encoding proteins with predicted functions most encode putative SSPs, cytochrome P450, transporters and CAZymes (Table S5). Notably, of the 31 highest up-regulated genes in both silenced-LmDIM5 and -LmHP1 transformants (fold-change>4; Table S5), 52% were putative SSP-encoding genes, while they only represent 5.1% of the genes in the genome [7]. This suggests a specific and strong effect of LmHP1 and LmDIM5 silencing on the expression of effector-encoding genes. We observed a stronger de-repression of gene expression in the silenced-LmDIM5 transformant compared to the silenced-LmHP1 transformant (Tables S3 and S4) that could result from the lower residual expression of LmDIM5 compared to that of LmHP1 in the transformants selected.
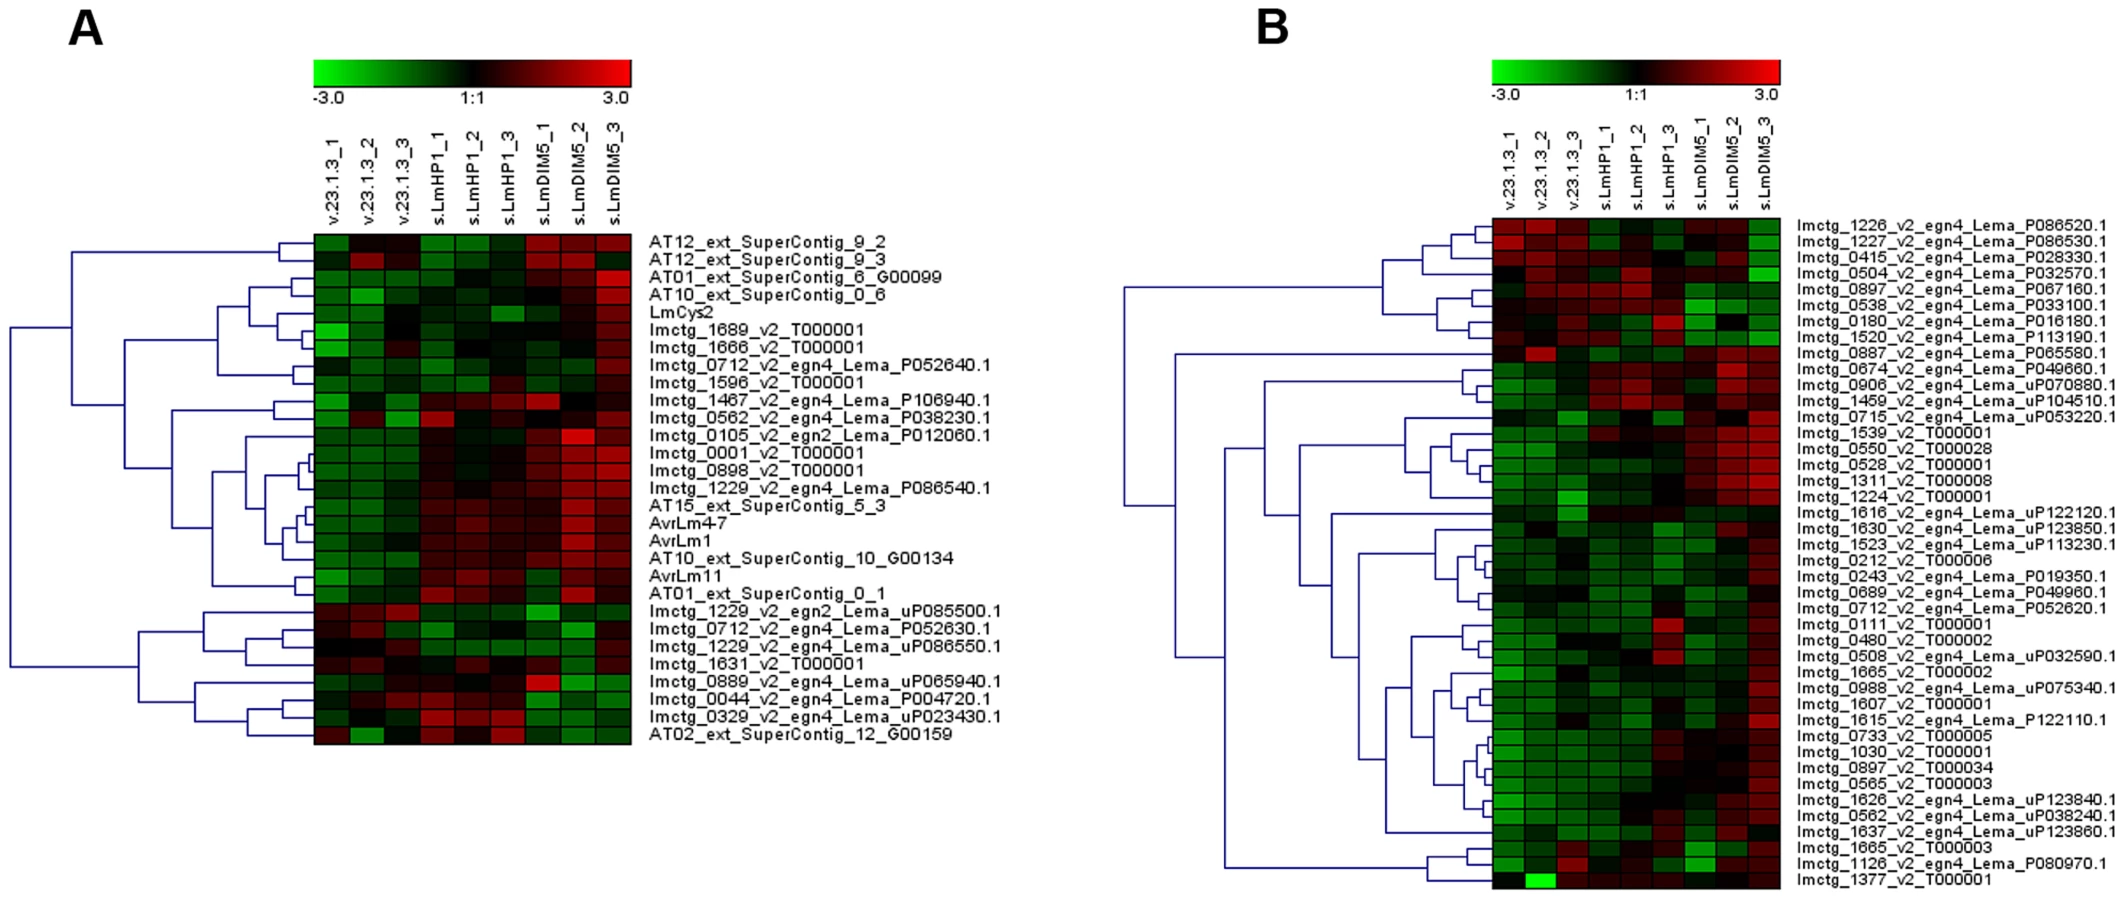
We next investigated the effect of LmDIM5 and LmHP1 silencing on the transcriptional behaviour of genes according to their genomic environment (Table 1). Whereas silencing of LmDIM5 and LmHP1 led to an up-regulation of ∼3% of genes located either in GC-isochores or in GC-equilibrated islands located in the middle of AT-isochores, 34% and 28% of genes located in AT-isochores were up-regulated in silenced-LmDIM5 or -LmHP1 backgrounds (Table 1). Remarkably, this effect was even more pronounced for the SSP-encoding genes as 41% of these genes, including AvrLm1, AvrLm4-7 and AvrLm11 were up-regulated when compared to the wild type strain (Table 1, Figures 6A and 6B). These observations support the idea that expression is regulated directly by alteration of H3K9me3 in AT-isochores of transformants in which LmDIM5 and LmHP1 are silenced. Moreover, genes located in AT-isochores that were up-regulated in both silenced-LmHP1 and -LmDIM5 backgrounds were all found up-regulated at 7 dpi during plant infection in the wild type isolate (Table 2). Taken together, these data support the idea that LmDIM5 and LmHP1 exert an epigenetic control on specific regions of the genome, and mainly on the AT-isochores that are expected to be associated with heterochromatic nucleosomes.


We analysed the expression of three effector genes located in AT-isochores (AvrLm1, AvrLm4-7, LmCys2) and one effector gene located in a GC-equilibrated island (LmCys1; I. Fudal and B. Profotova, unpublished data) by qRT-PCR during mycelial growth. Consistent with results from our oligoarray study, we observed a strong overexpression of AvrLm1 and AvrLm4-7 in the silenced-LmHP1 (∼80 - and 148-fold respectively; Figure 7A) and -LmDIM5 transformants (∼25 - and 63-fold respectively; Figure 7B), and less overexpression for LmCys2 (∼10 - and 2-fold in the silenced-LmHP1 and -LmDIM5, respectively; data not shown). In contrast, LmCys1, the gene located in a GC-equilibrated island, was repressed (∼0.25 - and 0.1-fold expression in the silenced-LmHP1 and -LmDIM5, respectively; Tables S1 and S2). Thus, we found derepression of LmCys2 in both silenced-LmHP1 and -LmDIM5 by qRT-PCR while no derepression was found using oligoarrays. These results confirm the oligoarray data but also suggest that oligoarrays likely underestimate the number of genes affected by the silencing, as well as the magnitude of derepression.

Induced gene expression is correlated with a reduction of H3K9 trimethylation at AvrLm1 and AvrLm4-7 loci in axenic culture
To investigate whether induction of effector gene expression in axenic culture after silencing of LmDIM5 or LmHP1 was associated with changes of the H3K9me3 level, we performed chromatin immunoprecipitation (ChIP) experiments on strain v23.1.3, and the silenced-LmHP1.5 and -LmDIM5.4 transformants. We assayed AvrLm1 and AvrLm4-7 coding regions, their promoters and used the histone H2A gene as a control. To precipitate nucleosomes associated with H3K9me3, we used an antibody that had been used successfully in studies with N. crassa [39], [40], Trichoderma reesei [41], [42], Fusarium fujikuroi [43] and Fusarium graminearum [44]. In the wild type isolate, we observed higher levels of H3K9me3 in the promoters of AvrLm1 and AvrLm4-7 compared to their coding regions (Figures 8A and 8B). H3K9me3 levels were strongly reduced in AvrLm1 and AvrLm4-7 for all regions tested in both the silenced-LmHP1 and -LmDIM5 transformants when compared to the wild type strain (Figures 8A and 8B); as expected, silencing of LmDIM5 or LmHP1 had no effect on the low H3K9me3 level in the H2A gene. Thus, overexpression of at least AvrLm1 and AvrLm4-7 observed in axenic culture in the silenced-LmHP1 and -LmDIM5 transformants is correlated to a measurable decrease in H3K9me3 levels in these genomic regions. Precipitations with H3K4me2 antibody were done in parallel as controls for ChIP efficiency (Figure S1). This modification has been described as associated with active regions of chromatin [45]. Accordingly, levels of H3K4me2 in the constitutively expressed gene, H2A, are high either in the WT strain or in both silenced-LmHP1 and -LmDIM5 transformants. In the WT strain, levels of H3K4me2 are reduced by 12 to 614 times in the coding sequences and promoters of AvrLm1 or AvrLm4-7 compared to the coding sequence of H2A (Figure S1), consistently with a repression of effector gene during axenic culture. However, in L. maculans, and based on levels of H3K4me2 observed in the silenced-LmDIM5 and -LmHP1 transformants, no correlation seems to exist between induction of effector gene expression and a modification in H3K4me2 levels (Figure S1).

Silencing of LmHP1 or LmDIM5 does not alter the pattern of effector gene expression during primary infection
Expression of AvrLm1, AvrLm4-7, LmCys1 and LmCys2 was monitored during oilseed rape infection (3, 7 and 14 dpi) by qRT-PCR in the silenced-LmHP1 and -LmDIM5 transformants (Figures 9A and 9B; data not shown) and compared to the wild type strain or to non-silenced transformants. Expression profiles were similar in all isolates, with a peak of expression at 7 dpi. Thus, silencing of either LmHP1 or LmDIM5 did not alter the profiles of effector gene expression during primary infection.

Genomic environment of effector genes has an impact on their expression level
As previously described, Agrobacterium tumefaciens-mediated transformation (ATMT) of L. maculans mainly results in integration of transgenes in GC-isochores [46]. Isolates naturally lacking the effector genes AvrLm1, AvrLm6, AvrLm4-7 and LmCys2 were subjected to ATMT complementation [19]–[21]. Thermal Asymmetric InterLaced (TAIL)-PCRs were performed on 66 transformants in order to check that the integrated T-DNA was indeed located into GC-isochores. T-DNA flanking sequences were recovered for 54% of the transformants (Table S6) and were identified in the L. maculans genome using BLAST. After screening, 16 transformants with identified T-DNA sequences were kept for further study (24% of the sequences; see Table S6 for details), corresponding to insertions in GC-isochores of 12 different supercontigs; ten were inserted into coding sequences, two into promoters and four into intergenic regions (see Table S7 for details on insertions). In all cases, expression of AvrLm1, AvrLm6, LmCys2 and AvrLm4-7 in axenic culture was greatly increased, varying from 8 - to 1270-fold compared to that of the wild type isolate (Table 3). Expression profiles in planta were similar to that of the wild type isolate with a peak of expression at 7 dpi (Figure 10), except for transformants NzT4-AvrLm4-7-16 and -18. These data corroborated the effect of LmHP1 and LmDIM5 silencing, which led to overexpression of effector genes in axenic culture with no altered expression pattern during primary infection. Our data strongly suggest that chromatin structure of AT-isochores represses expression of effector genes embedded in these regions, at least during growth in axenic culture. In contrast, during primary leaf infection, expression of effector genes located in AT-isochores did not depend on the chromatin context alone.


Discussion
AT-isochores of the L. maculans genome were found to be enriched in effector genes sharing common expression profiles, with repression of expression during mycelial growth but drastic induction during the early stages of oilseed rape leaf infection [7]. We recently showed that the location of effector genes in this genomic environment has selective advantages by allowing extremely rapid responses to resistance gene selection generated by mutation and/or recombination [47] as it was also reported for Phytophthora infestans [17]. Here, we show that the genomic environment is important for control of gene regulation, and thus may confer a second adaptive advantage as it allows repression of genes specifically needed for pathogenicity during vegetative growth and possibly allows rapid induction of genes required for infection. To elucidate the mechanism involved, we investigated possible chromatin-mediated epigenetic repression through histone H3K9 trimethylation in strains where key players involved in heterochromatin formation (LmHP1 and LmDIM5) were silenced by RNAi.
Roles of LmHP1 and LmDIM5 in L. maculans
The domain structures of HP1 and DIM-5 proteins and their functions are well conserved in various eukaryotes, from plants to mammals. The homologue of the N. crassa histone H3 methyltransferase DIM-5 identified in L. maculans revealed functional domains typical of Suvar39/Clr4/DIM-5 orthologs. Notably, nine cysteines shaping the zinc cluster of the pre-SET domain [35], as well as three residues (N, H, Y) with catalytic roles are well conserved [48] (Figure 2). Consistent with data obtained from N. crassa [28] and Aspergillus fumigatus [49], the silenced-LmDIM5 transformants of L. maculans showed growth defects. In contrast to DIM-5 mutants of A. fumigatus [49], silenced-LmDIM5 isolates showed pathogenicity defects. HP1 is an adapter protein that recognises and binds H3K9 trimethylation [50], though the closest Arabidopsis thaliana homologue, LHP1, also binds histone H3 lysine 27 methylation (H3K27me3) [51]–[53]. In N. crassa, HP1 recruits the DNA methyltransferase DIM-2, and has been shown to be essential for all DNA methylation in heterochromatic regions [30]–[32]. The HP1 protein of L. maculans revealed functional domains typical of all HP1 orthologs. Notably, the three aromatic residues of the chromo domain, forming a binding pocket for the N-methyl groups of the H3 tail [54] are conserved from N. crassa to H. sapiens (Figure 1). Besides heterochromatin formation, multiple roles are attributed to HP1, including involvement in centromere maintenance, genome integrity, sister-chromatin cohesion, and DNA repair [40], [55]–[57], but defects observed depend on the organism studied to date. Growth defects are observed in all HP1 mutants of N. crassa [30], and we found here similar defects in transformants in which LmHP1 was only partially silenced by RNAi. No such growth defects have been reported in HP1 mutans of F. graminearum or A. nidulans [58], [59]. HP1 mutations trigger larval death in D. melanogaster [60], [61]. In L. maculans, we observed that only one-third of primary LmHP1 transformants could be recovered following the first step of selection. In addition, the residual expression of LmHP1 in silenced isolates remained high (always more than 30% of the control), in contrast to what we observed for the silenced-LmDIM5 transformants. These data suggest that, as for D. melanogaster, LmHP1 deletion may be lethal. In contrast to transformants with silenced LmDIM5, transformants with silenced LmHP1 showed no pathogenicity defects. Whether maintenance of pathogenicity of silenced-LmHP1 transformants is due to the lack of drastic silencing of LmHP1 is an open question, as the involvement of HP1 in pathogenicity has not been analysed in any other plant pathogen. The silencing of LmDIM5 was associated with a decrease in pathogenicity ability that did not depend on the level of effector gene expression during infection. As LmHP1 and LmDIM5 silencing resulted in a deregulation of expression of a considerable number of genes, we can assume that the pathogenicity defect could also be linked to another physiological defect that would be important for infection processes that would be affected. As HP1 localisation in N. crassa relies on H3K9me3, catalysed by DIM-5, we investigated LmHP1 localisation in the wild type strain and in silenced-LmDIM5 transformants. As in N. crassa, LmHP1 location in L. maculans relies on proper function of LmDIM5, and there seems to be at least some defect in chromatin structure in the silenced-LmDIM5 background. Our ChIP experiments showed that LmHP1 and LmDIM5 are responsible for generating heterochromatic regions at two L. maculans avirulence gene loci, and that induction of effector gene expression in axenic cultures in either silenced-LmHP1 or -LmDIM5 transformants relied on reduction of H3K9me3 levels in these regions. Interestingly, the level of H3K9me3 is slightly higher in promoters of AvrLm1 and AvrLm4-7 compared to the coding regions, suggesting that promoters are the preferred targets for epigenetic regulation of gene expression. Overall, our native ChIP experiments tend to support the idea that AT-isochores with effector genes represent epigenetically controlled facultative heterochromatin. The reduction of H3K9me3 in a silenced-LmDIM5 background is consistent with DIM-5 function. We also showed here that levels of H3K9me3 is reduced in coding sequences and promoters of AvrLm1 and AvrLm4-7 while HP1 acts downstream of DIM-5. In S. pombe, the HP1 ortholog Swi6, through self-association, is required for interaction with H3K9me3 but also for the recruitment of the DIM-5 ortholog, Clr4 [62] which is in accordance with the reduction of H3K9me3 levels observed here in a silenced-LmHP1 background. Regarding H3K4me2, our results suggest that this modification does not replace H3K9me3 when genes located in facultative heterochromatin are actively transcribed. Such behaviour for this modification was also observed in F. graminearum [44].
In our oligoarray analyses, in addition to genes located in AT-isochores largely affected in both the silenced-LmHP1 and the silenced-LmDIM5 transformants, we also found 49 genes located in GC-isochores up-regulated, such as genes encoding for nine SSPs and a cytochrome P450 protein. This suggests that hotspots in GC-isochores may also be subject to chromatin-based regulation; alternatively, this up-regulation may be indirect and a consequence of expression of genes located in AT-isochores. Additional ChIP and ChIP-sequencing studies are underway to address this question. To our knowledge, up-regulation of numerous genes involved in DNA repair in transformants with silenced-LmHP1 is a novel finding. Previous results suggest that some heterochromatin mutants, including dim-5 but not hpo (N. crassa HP1) are mutagen sensitive [63]. Silencing or deletion of HP1 may trigger DNA damage, which would explain pleiotropic effects that have been also observed in other organisms as previously mentioned.
Pathogenicity-related genes are often under a double control
We show here that an epigenetic mechanism efficiently tunes effector gene expression and that by removal of H3K9me3, expression of these genes can be rapidly activated in response to changing environmental conditions. It is known that an intimate link sometimes exists between epigenetic regulation of gene expression and transcription factors, the latter triggering chromatin condensation or decondensation, and the three dimensional structure of the chromatin governs promoter access to regulatory proteins such as transcription factors. There is precedence for this idea, as transcription factors can be recruited to promote the reversion of epigenetic silencing, as for example, the BZLF1 transcription factor of the Epstein-Barr virus initiates virus synthesis [64]. In contrast, in Plasmodium falciparum, PfSIP2 initiates the formation of heterochromatin leading to epigenetic silencing of genes involved in pathogenesis [65]. Transcription factors are recruited after chromatin decondensation to specifically regulate certain genes; for example, expression of secondary metabolite gene clusters in Aspergilli requires modulation of H3K9me3 levels and action of AflR, a specific transcription factor [38], [66], [67], thus generating multi-layered control. Based on this, we could suspect that such a multiple control may regulate effector gene expression in L. maculans. Nevertheless, whether one, or several, transcription factor(s) is involved in the concerted expression of effector genes in L. maculans remains to be elucidated. A few transcriptional regulators involved in effector gene expression have already been identified, such as SGE1 of F. oxysporum, which is essential for parasitic growth and Fox1 of U. maydis, a forkhead transcription factor which is also required for pathogenic development into the plant [68], [69].
Epigenetic-mediated control of pathogenicity-related gene expression: An efficient and universal mechanism?
While all the cells in an organism contain the same genetic information, epigenetic modifications enable a specialisation of function during development, stress or infection mechanisms. In 1942, Conrad Waddington named these different states “epigenotypes”, to indicate that conditions set up under one particular situation to switch gene expression on or off can efficiently and quickly adapt to a new situation, independently of the genotype [70]. If genetic mutations can help an organism to adapt and survive along evolution, the presumed epigenetic code provides a more sensitive and rapid way to respond to environmental stress than DNA sequences themselves. For example, in viruses like human Herpes Simplex Virus 1 and 2, epigenetic modifications determine either latency of this virus, i.e. its quiescent state when there is no de novo production of the virus or lytic infection, i.e. its active state when a large number of viral genes are expressed leading to cell death [71]. As mentioned above, effector genes show common features, notably they remain globally silenced during mycelial growth and are strongly up-regulated upon infection. Producing effectors implies an energy cost for the organism. Thus, it seems plausible that effector production is tightly regulated to avoid wasting energy under conditions when the gene products are not needed. Epigenetic repression is lifted at the precise stage where effectors are required, allowing for finely tuned regulation.
The work presented here is, to our knowledge, the first report of chromatin-mediated epigenetic control of fungal effector gene expression. In organisms as phylogenetically distant and diverse as Apicomplexa, Euglenozoa, Eozoa or Ascomycota (including Plasmodium spp., Trypanosoma spp., Leishmania spp., Giardia lamblia and Candida spp.), families of genes involved in pathogenicity are frequently located in subtelomeric regions and are variantly expressed, to escape the host immune system, through an epigenetic control [72]–[74].
In fungi, particularly Aspergilli, epigenetic control is involved in the regulation of secondary metabolite genes. Genes involved in secondary metabolites production are often organised in clusters [75], including their respective transcriptional activators (e.g. AflR for aflatoxin and sterigmatocystin production; [38], [66], [67]). Clusters are often near the chromosome ends (“subtelomeric”), which may allow for regional regulation mediated by chromatin modifications. These modifications appear to be controlled by a global regulator, LaeA [76], a putative histone methyltransferase, as well as HP1 and DIM-5 homologues [59], [77]. A similar system has been described in F. graminearum [58]. In L. maculans, we found that LmHP1 modulates the expression of three polyketide synthase and nonribosomal peptide synthetase genes, and both LmHP1 and LmDIM5 influence transcription of genes encoding accessory enzymes involved in the modifications of secondary metabolites.
To date, L. maculans is the only fungus for which an isochore-like structure of the genome has been published [7] but there is evidence for the existence of this genome structure from other fungi. In the hemibiotrophic dothideomycete Venturia inaequalis, the region containing the avirulence gene AvrVg is located in isochores with widely different GC content, which may be consistent with an isochore-like genome structure [78]. This organisation is also identifiable in the genomes of two additional dothideomycetes, Mycosphaerella fijiensis (http://genome.jgi.doe.gov/Mycfi2/Mycfi2.home.html) and Cladosporium fulvum, which contain effector-encoding genes in repeat-rich regions, which were presumably mutated by RIP [79]. Thus, similar epigenetic mechanisms to control expression of genes located in these highly dynamic regions may occur in these organisms. Moreover, the location of effector genes in subtelomeric regions, regions enriched in repeats or on CDC is a common feature of plant pathogenic fungi. Like Nectria haematococca [80] and F. oxysporum [16], L. maculans genome contains a CDC, invaded by repeats. This CDC harbours an effector gene, AvrLm11 [14], which is up-regulated in axenic culture in a silenced-LmHP1 background. This suggests that genes located on supernumerary chromosomes in N. haematococca or F. oxysporum may be likewise regulated. In combination, these data strongly suggest that in the course of evolution some epigenetic mechanisms to repress and control expression of genes involved in pathogenicity have been conserved across kingdoms.
Switch from repression to expression: What could be the signal?
Mechanisms controlling gene activation or repression at the chromatin level are under intense scrutiny but signals triggering the switch between two chromatin states remain largely unknown. Here, we show that effector genes are repressed under axenic conditions and that repression is lifted upon leaf infection. This suggests that a particular signal is recognised by L. maculans to abolish epigenetic silencing of pathogenicity-related genes. While signals produced by plant roots begin to be characterised [81], nothing is known about the plant signals produced by leaves that could induce effector gene expression. As mentioned above, production of fungal secondary metabolites is under both general chromatin-mediated as well as specific transcription factor-mediated control, both of which likely respond to various environmental factors, for example nitrogen [43], [82]. Considering the induction of effector gene expression, the Avr9 gene is the only effector gene induced upon nitrogen starvation in C. fulvum [83] but so far no effects of nitrogen levels on the expression of effector genes in L. maculans [19] or other fungi have been found. Identification of environmental factors triggering effector gene expression as well as plant genotypes that will be less favourable for the expression of effector genes is thus a promising field for research to prevent or limit disease development.
Materials and Methods
Fungal isolates
The isolates v23.1.3 (AvrLm1-AvrLm4-AvrLm6-AvrLm7) and v29.3.1 (avrLm1-AvrLm4-avrLm6-AvrLm7), NzT4 (AvrLm1-avrLm4-avrLm6-avrLm7) of L. maculans [84] were used as hosts for genetic transformations. Transformants used here to assess effect of genomic context on effector gene expression were previously described [19]–[21] and our unpublished data, and generated during the positional cloning of AvrLm1, AvrLm6 and AvrLm4-7: v29.3.1-AvrLm1, v29.3.1-AvrLm6, v29.3.1-LmCys2 and NzT4-AvrLm4-7. v29.3.1-AvrLm1, v29.3.1-AvrLm6 and v29.3.1-LmCys2 transformants corresponded to v29.3.1 isolates in which AvrLm1, AvrLm6 or LmCys2 allele of v23.1.3 were introduced using vector pBBH [19] or pBHt2 [85] (11, 13 and 15 transformants, respectively, were tested). NzT4-AvrLm4-7 transformants corresponded to NzT4 isolate in which the AvrLm4-7 allele of v23.1.3 was introduced using vector pPZPnat1 [86] (27 transformants tested). Fungal cultures, sporulating cultures and conidia production were maintained or collected as previously described [87]. For chromatin immunoprecipitation, tissue was grown on V8 agar medium at room temperature in the dark for 10 days. Mycelium was inoculated into 75 ml of Fries liquid medium in 250 ml Erlenmeyer flasks. Tissue was harvested after growing for 7 to 12 days in the dark at 27°C.
Pathogenicity and growth of isolates
Pathogenicity assays were performed as described [88] on cotyledons of 15-day-old plantlets of cultivar Westar, a highly susceptible cultivar of Brassica napus. Plants were incubated in a growth chamber at 16/24°C (night/day) with a 12 h photoperiod. Symptoms were scored on 10–12 plants, at 14 days after inoculation using the IMASCORE rating scale comprising six infection classes (IC), where IC1 to IC3 correspond to various level of resistance of the plant and IC4 to IC6 to full susceptibility [89], with two biological replicates. Growth assays were performed by deposition of a 5-mm plug at the centre of 90-mm Petri dishes (containing 25 ml of V8 juice agar medium). Radial growth was measured at 10 days after incubation in a growth chamber, with three biological replicates.
Fungal crosses
Assessment of sexual reproduction of silenced-LmHP1 and silenced-LmDIM5 transformants compared to non silenced transformants was performed by crossing with the v24.1.2 strain, a near isogenic isolate of v23.1.3, but of opposite mating type [90]. Crosses of v23.1.3 with v24.1.2 were performed as a control.
DNA and RNA manipulation
For PCR, genomic DNA was extracted from conidia with the DNAeasy 96 plant Kit (Qiagen S.A., Courtaboeuf, France) and PCR amplifications were done as previously described [20]. Sequencing was performed using a Beckman Coulter CEQ 8000 automated sequencer (Beckman Coulter, CA, U.S.A) according to the manufacturer's instruction. Procedures for gel electrophoresis have been reported [91] and were adapted from procedures described by Sambrook and Russell [92]. Total RNA was extracted from mycelium grown for one week in Fries liquid medium, and from infected leaf tissues as previously described [20].
Native Chromatin ImmunoPrecipitation (N-ChIP)
We first attempted to adapt the ChIP protocol developed for N. crassa and Fusarium species [28], [43], but found that sonication or bead-beating and formaldehyde crosslinking resulted in very poor shearing or yields of precipitated DNA. We thus subjected L. maculans to “native ChIP” (no crosslinking) and isolated mono - and dinucleosomes after digesting ∼300 mg of mycelium per sample with microccocal nuclease (MNase) for 25 min at 37°C (L.R. Connolly and M. Freitag, unpublished data). Input (40 µl of the whole cell lysate) was stored (−20°C) for each sample and used to normalise data from qPCR and qualitative PCR. For immunoprecipitation, each sample was split into two replicates of 250 µl lysate each and 3.5 µl H3K9me3 antibody (Active Motif 39161) was added for a total of two replicates per sample. Precipitations with H3K4me2 antibody (Millipore 07-030) were done in parallel as controls for ChIP efficiency. Because we used a native ChIP protocol, yields were consistently lower than from ChIP experiments with crosslinked chromatin.
TAIL-PCR experiments
To recover DNA sequences flanking AvrLm1, AvrLm6, LmCys2 or AvrLm4-7 in transformants v29.3.1-AvrLm1, v29.3.1-AvrLm6, v29.3.1-LmCys2 and NzT4-AvrLm4-7 respectively, TAIL-PCR [85], [93] was used. pPZPnat1 sequence-specific primers were designed to match primer characteristics as described [85] (Table S8). For pBBH and pBHt2 vectors, primers used were as designed previously [85], [88] (Table S8). Arbitrary Degenerated (AD) primers used in association with the vector-specific TAIL-PCR primers were identical to primer AD2 [93]. For v29.3.1-AvrLm1 transformants, TAIL-PCR was performed as described [93], while for v29.3.1-AvrLm6, v29.3.1-LmCys2 and NzT4-AvrLm4-7 transformants, TAIL-PCR was performed as described [85]. Tertiary TAIL-PCR products were purified using the Nucleospin Extract II purification Kit (Macherey-Nagel, Hoerd, France) and were used as template for DNA sequencing using the specific tertiary border primer (LB3) as a sequencing primer (Table S8).
qRT-PCR
Quantitative RT-PCR was performed using a model 7900 real-time PCR machine (Applied Biosystems) and Absolute SYBR Green ROX dUTP Mix (ABgene, Courtaboeuf, France) as previously described [20]. For each condition tested, two different RNA extractions from two different biological samples and two reverse transcriptions for each biological repeat were performed. Primers used for qRT-PCR are described in Table S8. Ct values were analysed as described [94] for analyses of expression profiles. β -Lmtubulin was used as a constitutively expressed reference gene. Expression of Lmactin relative to β-Lmtubulin was used as control.
For qPCR on ChIP DNA, primers were designed to amplify products between 50 to 150 bp (Table S8). For each reaction, we used 1 µl of the sample and performed reaction in duplicates. The “percent of input” method was used to calculate the immunoprecipitated fraction for each primer pair according to the following formula: %of input = 100×(1+E)∧(Ctinput−Ctbound), where E is the primer efficiency of each primer pair designed to amplify the amplicon, Ct input is the Ct of the fraction recovered after digestion by MNase and Ct bound is the Ct of the immunoprecipitated sample.
Whole-genome oligoarray analyses of expression of L. maculans genes
To compare expression of effector genes located in AT - and GC-isochores, oligoarray data previously obtained [7] and deposited in the Gene Expression Omnibus (GEO) under accession code GSE27152 were used. Additional L. maculans whole-genome expression arrays were manufactured by NimbleGen Systems Limited (Madison, WI) in order to compare whole genome expression in mycelium of wild type isolate v23.1.3 and transformants silenced for LmHP1 or LmDIM5. These arrays contain 5 independent, non-identical, 60-mer probes per gene model, each duplicated on the array. Gene models included were 12,457 EuGene-predicted gene models and 467 additional genes, 2,008 random 60-mer control probes and labelling controls. The oligoarray data are available from the NCBI GEO under the accession number GSE50616. Total RNA was extracted using TRIzol reagent (Invitrogen) according to the manufacturer's protocol from mycelium grown for one week in Fries liquid medium. Total RNA was treated with RNase-Free DNase I (New England Biolabs). Total RNA preparations (three biological replicates for each sample) were amplified by PartnerChip (Evry, France) using the SMART PCR cDNA Synthesis Kit (Invitrogen) according to the manufacturer's instructions. Single dye labeling of samples, hybridisation procedures, data acquisition, background correction and normalisation were performed at the PartnerChip facilities following the standard protocol defined by NimbleGen [95], [96]. Average expression levels were calculated for each gene from the independent probes on the array and were further analysed.
Gene-normalised data were subjected to Analysis of NimbleGen Array Interface Suite (ANAIS; http://anais.versailles.inra.fr; [97]). ANAIS performs an ANOVA test on log10 transformed data to identify statistically differentially expressed genes. This test uses the observed variance of gene measurements across the three replicated experiments. To account for multiple tests, the ANOVA p values are further subjected to Bonferroni correction. Transcripts with p values<0.05 and >1.5-fold change in transcript levels were considered as significantly differentially expressed in the silenced-LmHP1 or in the silenced-LmDIM5 compared to the wild type strain v23.1.3. To estimate the signal-to-noise threshold (signal background), ANAIS calculates the median of the intensity of all of the random probes present on the oligoarray, and provides adjustable cut-off levels relative to that value. Gene models with an expression higher than three-times the median of random probe intensities in at least two of three biological replicates were considered as transcribed.
Vector construction and fungal transformation
Vectors pPZPnat1-LmHP1 and pPZPnat1-LmDIM5 for RNAi-mediated silencing of LmHP1 and LmDIM5 genes were constructed as described [98] with some modifications [20]. pJK11 vector contains a Glomerella cingulata gpdA promoter fragment and an A. nidulans trpC terminator fragment, separated by a multiple locus site where inverted repeats of coding sequence of LmHP1 and LmDIM5 have been cloned using the primers described in Table S8. The LmHP1 sense fragment of the inverted repeat was amplified from cDNA of v23.1.3 mycelium using primers SilentLmHP1-HindIII+ and SilentLmHP1-BamHI − and digested with HindIII and BamHI. The antisense region was amplified with primers SilentLmHP1-BamHI+ and SilentLmHP1-EcoRI - and digested with BamHI and EcoRI. Sense and antisense fragments were ligated into an EcoRI-HindIII digested pJK11. The expression cassette was excised by digestion with SpeI and XhoI and inserted into the binary vector pPZPnat1 digested with SpeI and XhoI, creating the vector pPZPnat1-LmHP1. The pPZPnat1 vector, that contains the nourseothricin resistant gene NAT1 (nourseothricin acetyltransferase gene), is used for gene silencing in L. maculans via agro-transformation. The same strategy was used to obtain the pPZPnat1-LmDIM5 vector; the sense fragment was obtained using primers SilentLmDIM5-HindIII+ and SilentLmDIM5-BamHI−; the antisense fragment using primers SilentLmDIM5-BamHI+ and SilentLmDIM5-XmaI-.
Vector pBHt2-LmHP1-GFP was created by fusing the GFP coding sequence (p-EGFP-1, Clontech) downstream the coding sequence of LmHP1 under the control of its own promoter in the binary vector pBHt2 containing the hygromycin B resistance gene (hph). The LmHP1 entire sequence containing 5′ and 3′ UTR was amplified from cDNA of v23.1.3 mycelium using primers LmHP1-EcoRI and LmHP1-XbaI digested with EcoRI and XbaI and ligated into an EcoRI-XbaI digested pBHt2. The stop codon was excised by amplification of the pBHt2-LmHP1 vector with C-LmHP1-SpeI and C-LmHP1-ClaI. The GFP coding sequence was amplified eGFP-ClaI and C-eGFP-SpeI from the p-EGFP-1 plasmid, digested with ClaI and SpeI and ligated into a ClaI-SpeI pBHt2-LmHP1 digested vector, thus creating pBHt2-LmHP1-GFP vector. Primers used are detailed in Table S8.
The constructs were introduced into A. tumefaciens strain C58 by electroporation (1.5 kV, 200 ohms and 25 µF). A. tumefaciens-mediated transformation (ATMT) of L. maculans was performed as previously described [99] with minor modifications [19]. Transformants were plated on minimal media complemented with nourseothricin (50 mg/l) for pPZPnat1-LmHP1 and pPZPnat1-LmDIM5 or hygromycin (50 mg/l) for pBHt2-LmHP1-GFP and cefotaxime (250 mg/l).
Confocal microscopy
Axenic mycelia from a Petri dish with minimal medium were stained by incubating for 15 min in 10 µg/µl DAPI solution (Sigma-Aldrich) at room temperature to observe nuclei. Analyses were performed on a Leica TCS SPE laser scanning confocal microscope. Excitation of GFP was at 488 nm and emission was captured with a 505–530 nm broad pass filter. DAPI was excited at 543 nm and emission was captured with a 580–615 nm broad pass filter. The detector gain was 800 with an amplifier offset from −0.2. All images represent the average of 4 scans.
In silico analyses and gene annotations
HP1 and DIM-5 orthologs were identified with the NCBI BLAST program http://blast.ncbi.nlm.nih.gov/Blast.cgi [100]; functional domains have been identified using InterProScan http://www.ebi.ac.uk/Tools/pfa/iprscan. Annotation of untranslated regions (UTR), transcriptional start and stop sites and intron positions were performed following PCR amplification and sequencing of 3′ - and 5′-ends of cDNA using Creator SMART cDNA Library Construction Kit (Clontech, Palo Alto, CA) according to manufacturer's recommendation and using HP1-5UTRL1, HP1-5UTRL2, HP1-3UTRU1, HP1-3UTRU2 and DIM5-5UTRL1, DIM5-5UTRL2, DIM5-3UTRU2; DIM5-3UTRU1 as specific primers (Table S8). Hierarchical clustering analyses were carried out using GENESIS [101], multiple alignements with COBALT [102].
Statistical analyses
Disease scorings and radial growth of each isolate were analysed using ANOVA. For qRT-PCR analyses, Cttarget gene-CtβLmtubuline was calculated for each isolate and analysed using ANOVA. Isolates were compared using a Fisher test (α = 0.05). Transformants were compared to v23.1.3 by a Dunnet multiple comparison test (α = 0.05). All statistical analyses were performed using XLStat 7.5 software.
Supporting Information
Zdroje
1. OlivaR, WinJ, RaffaeleS, BoutemyL, BozkurtTO, et al. (2010) Recent developments in effector biology of filamentous plant pathogens. Cell Microbiol 12 : 705–715.
2. Tyler BM, Rouxel T (2013) Effectors of fungi and oomycetes: their virulence and avirulence functions and translocation from pathogen to host. In: Molecular Plant Immunity, Guido Sessa (Ed.) John Wiley & Sons, Inc. pp. 123–167.
3. StergiopoulosI, de WitPJGM (2009) Fungal effector proteins. Annu Rev Phytopathol 47 : 233–263.
4. KamounS (2006) A catalogue of the effector secretome of plant pathogenic oomycetes. Annu Rev Phytopathol 44 : 41–60.
5. HaasBJ, KamounS, ZodyMC, JiangRH, HandsakerRE, et al. (2009) Genome sequence and analysis of the Irish potato famine pathogen Phytophthora infestans. Nature 461 : 393–398.
6. KämperJ, KahmannR, BölkerM, MaLJ, BrefortT, et al. (2006) Insights from the genome of the biotrophic fungal plant pathogen Ustilago maydis. Nature 444 : 97–101.
7. RouxelT, GrandaubertJ, HaneJK, HoedeC, van de WouwAP, et al. (2011) Effector diversification within compartments of the Leptosphaeria maculans genome affected by Repeat-Induced Point mutations. Nat Commun 2 : 202.
8. SaundersDGO, WinJ, CanoLM, SzaboLJ, KamounS, et al. (2012) Using hierarchical clustering of secreted protein families to classify and rank candidate effectors of rust fungi. PLoS One 7: e29847.
9. WangQ, HanC, FerreiraAO, YuX, YeW, et al. (2011) Transcriptional programming and functional interactions within the Phytophthora sojae RXLR effector repertoire. Plant Cell 23 : 2064–2086.
10. HacquardS, JolyDL, LinYC, TisserantE, FeauN, et al. (2012) A comprehensive analysis of genes encoding small secreted proteins identifies candidate effectors in Melampsora larici-populina (poplar leaf rust). Mol Plant Microbe Interact 25 : 279–293.
11. Giraldo MC, Dagdas YF, Gupta YK, Mentlak TA, Yi M, et al. (2013) Two distinct secretion systems facilitate tissue invasion by the rice blast fungus Magnaporthe oryzae. Nat Commun 4: doi:10.1038/ncomms2996.
12. SchornackS, HuitemaE, CanoLM, BozkurtTO, OlivaR, et al. (2009) Ten things to know about oomycete effectors. Mol Plant Pathol 10 : 795–803.
13. SchmidtSM, PanstrugaR (2011) Pathogenomics of fungal plant parasites: what have we learnt about pathogenesis? Curr Opin Plant Biol 14 : 392–399.
14. BalesdentMH, FudalI, OllivierB, BallyP, GrandaubertJ, et al. (2013) The dispensable chromosome of Leptosphaeria maculans shelters an effector gene conferring avirulence towards Brassica rapa. New Phytol 198 : 887–898.
15. OrbachMJ, FarrallL, SweigardJA, ChumleyFG, ValentB (2000) A telomeric avirulence gene determines efficacy for the rice blast resistance gene Pi-ta. Plant Cell 12 : 2019–2032.
16. MaLJ, van der DoesHC, BorkovichKA, ColemanJJ, DaboussiMJ, et al. (2010) Comparative genomics reveals mobile pathogenicity chromosomes in Fusarium. Nature 464 : 367–373.
17. RaffaeleS, FarrerRA, CanoLM, StudholmeDJ, MacLeanD, et al. (2010) Genome evolution following host jumps in the Irish potato famine pathogen lineage. Science 330 : 1540–1543.
18. KasugaT, KozanitasM, BuiM, HüberliD, RizzoDM, et al. (2012) Phenotypic diversification is associated with host-induced transposon derepression in the sudden oak death pathogen Phytophthora ramorum. PLoS One 7: e34728.
19. GoutL, FudalI, KuhnML, BlaiseF, EckertM, et al. (2006) Lost in the middle of nowhere: the AvrLm1 avirulence gene of the Dothideomycete Leptosphaeria maculans. Mol Microbiol 60 : 67–80.
20. FudalI, RossS, GoutL, BlaiseF, KuhnML, et al. (2007) Heterochromatin-like regions as ecological niches for avirulence genes in the Leptosphaeria maculans genome: map-based cloning of AvrLm6. Mol Plant Microbe Interact 20 : 459–470.
21. ParlangeF, DaverdinG, FudalI, KuhnML, BalesdentMH, et al. (2009) Leptosphaeria maculans avirulence gene AvrLm4-7 confers a dual recognition specificity by the Rlm4 and Rlm7 resistance genes of oilseed rape, and circumvents Rlm4-mediated recognition through a single amino acid change. Mol Microbiol 71 : 851–863.
22. GoutL, KuhnML, VincenotL, Bernard-SamainS, CattolicoL, et al. (2007) Genome structure impacts molecular evolution at the AvrLm1 avirulence locus of the plant pathogen Leptosphaeria maculans. Environ Microbiol 9 : 2978–2992.
23. FudalI, RossS, BrunH, BesnardAL, ErmelM, et al. (2009) Repeat-Induced Point mutation (RIP) as an alternative mechanism of evolution toward virulence in Leptosphaeria maculans. Mol Plant Microbe Interact 22 : 932–941.
24. GrewalSI, JiaS (2007) Heterochromatin revisited. Nat Rev Genet 8 : 35–46.
25. TurnerBM (2000) Histone acetylation and an epigenetic code. Bioessays 22 : 836–845.
26. JenuweinT, AllisCD (2001) Translating the histone code. Science 293 : 1074–1080.
27. JamiesonK, RountreeMR, LewisZA, StajichJE, SelkerEU (2013) Regional control of histone H3 lysine 27 methylation in Neurospora. Proc Natl Acad Sci U S A 110 : 6027–6032.
28. TamaruH, SelkerEU (2001) A histone H3 methyltransferase controls DNA methylation in Neurospora crassa. Nature 414 : 277–283.
29. TamaruH, ZhangX, McMillenD, SinghPB, NakayamaJ, et al. (2003) Trimethylated lysine 9 of histone H3 is a mark for DNA methylation in Neurospora crassa. Nat Genet 34 : 75–79.
30. FreitagM, HickeyPC, KhlafallahTK, ReadND, SelkerEU (2004) HP1 is essential for DNA methylation in Neurospora. Mol Cell 13 : 427–434.
31. HondaS, SelkerEU (2008) Direct interaction between DNA methyltransferase DIM-2 and HP1 is required for DNA methylation in Neurospora crassa. Mol Cell Biol 28 : 6044–6055.
32. RountreeMR, SelkerEU (2010) DNA methylation and the formation of heterochromatin in Neurospora crassa. Heredity 105 : 38–44.
33. HiragamiK, FestensteinR (2005) Heterochromatin Protein 1: a pervasive controlling influence. Cell Mol Life Sci 62 : 2711–2726.
34. TschierschB, HofmannA, KraussV, DornR, KorgeG, et al. (1994) The protein encoded by the Drosophila position-effect variegation suppressor gene Su(var)3-9 combines domains of antagonistic regulators of homeotic gene complexes. EMBO J 13 : 3822–3831.
35. ZhangX, TamaruH, KhanSI, HortonJR, KeefeLJ, et al. (2002) Structure of the Neurospora SET domain protein DIM-5, a histone H3 lysine methyltransferase. Cell 111 : 117–127.
36. ReaS, EisenhaberF, O'CarrollD, StrahlBD, SunZW, et al. (2000) Regulation of chromatin structure by site-specific histone H3 methyltransferases. Nature 406 : 593–599.
37. IvanovaAV, BonaduceMJ, IvanovSV, KlarAJ (1998) The chromo and SET domains of the Clr4 protein are essential for silencing in fission yeast. Nat Genet 19 : 192–195.
38. YinW, KellerNP (2011) Transcriptional regulatory elements in fungal secondary metabolism. J Microbiol 49 : 329–339.
39. SmithKM, SancarG, DekhangR, SullivanCM, LiS, et al. (2010) Transcription factors in light and circadian clock signaling networks revealed by genome wide mapping of direct targets for Neurospora White Collar complex. Eukaryotic Cell 9 : 1549–1556.
40. SmithKM, PhatalePA, SullivanCM, PomraningKR, FreitagM (2011) Heterochromatin is required for normal distribution of Neurospora CenH3. Mol Cell Biol 31 : 2528–2542.
41. SeibothB, Karimi-AghchehR, PhatalePA, LinkeR, SauerDG, et al. (2012) The putative protein methyltransferase LAE1 controls 1 cellulase gene expression in Trichoderma reesei. Mol Microbiol 84 : 1150–1164.
42. Karimi-AghchehR, BokJW, PhatalePA, SmithKM, BakerSE, et al. (2013) Functional analyses of Trichoderma reesei LAE1 reveal conserved and contrasting roles of this regulator. G3 (Bethesda) 3 : 369–378.
43. WiemannP, SieberCM, von BargenKW, StudtL, NiehausEM, et al. (2013) Deciphering the cryptic genome: genome-wide analyses of the rice pathogen Fusarium fujikuroi reveal complex regulation of secondary metabolism and novel metabolites. PLoS Pathog 9: e1003475.
44. ConnollyLR, SmithKM, FreitagM (2013) The Fusarium graminearum Histone H3 K27 methyltransferase KMT6 regulates development and expression of secondary metabolite gene clusters. PLoS Genet 9: e1003916.
45. MikkelsenTS, KuM, JaffeDB, IssacB, LiebermanE, et al. (2007) Genome-wide maps of chromatin state in pluripotent and lineage-committed cells. Nature 448 : 553–560.
46. BourrasS, MeyerM, GrandaubertJ, LapaluN, FudalI, et al. (2012) Incidence of genome structure, DNA asymmetry, and cell physiology on T-DNA integration in chromosomes of the phytopathogenic fungus Leptosphaeria maculans. G3 (Bethesda) 2 : 891–904.
47. DaverdinG, RouxelT, GoutL, AubertotJN, FudalI, et al. (2012) Genome structure and reproductive behaviour influence the evolutionary potential of a fungal phytopathogen. PLoS Pathog 8: e1003020.
48. ChengX, CollinsRE, ZhangX (2005) Structural and sequence motifs of protein (histone) methylation enzymes. Annu Rev Biophys Biomol Struct 34 : 267–294.
49. PalmerJM, PerrinRM, DagenaisTR, KellerNP (2008) H3K9 methylation regulates growth and development in Aspergillus fumigatus. Eukaryot Cell 7 : 2052–2060.
50. FischleW, WangY, JacobsSA, KimY, AllisCD, et al. (2003) Molecular basis for the discrimination of repressive methyl-lysine marks in histone H3 by Polycomb and HP1 chromodomains. Genes Dev 17 : 1870–1881.
51. TurckF, RoudierF, FarronaS, Martin-MagnietteML, GuillaumeE, et al. (2007) Arabidopsis TFL2/LHP1 specifically associates with genes marked by trimethylation of Histone H3 Lysine 27. PLoS Genet 3 : 855–866.
52. ZhangX, GermannS, BlusBJ, KhorasanizadehS, GaudinV, et al. (2007) The Arabidopsis LHP1 protein colocalizes with histone H3 Lys27 trimethylation. Nat Struct Mol Biol 14 : 869–871.
53. ExnerV, AichingerE, ShuH, WildhaberT, AlfaranoP, et al. (2009) The chromodomain of LIKE HETEROCHROMATIN PROTEIN 1 is essential for H3K27me3 binding and function during Arabidopsis development. PLoS One 4: e5335.
54. NielsenPR, NietlispachD, MottHR, CallaghanJ, BannisterA, et al. (200) Structure of the HP1 chromodomain bound to histone H3 methylated at lysine 9. Nature 416 : 103–107.
55. DinantC, LuijsterburgMS (2009) The emerging role of HP1 in the DNA damage response. Mol Cell Biol 29 : 6335–6340.
56. FischerT, CuiB, DhakshnamoorthyJ, ZhouM, RubinC, et al. (2009) Diverse roles of HP1 proteins in heterochromatin assembly and functions in fission yeast. Proc Natl Acad Sci U S A 106 : 8998–9003.
57. KangJ, ChaudharyJ, DongH, KimS, BrautigamCA, et al. (2011) Mitotic centromeric targeting of HP1 and its binding to Sgo1 are dispensable for sister-chromatid cohesion in human cells. Mol Biol Cell 22 : 1181–1190.
58. Reyes-DominguezY, BoediS, SulyokM, WiesenbergerG, StoppacherN, et al. (2012) Heterochromatin influences the secondary metabolite profile in the plant pathogen Fusarium graminearum. Fungal Genet Biol 49 : 39–47.
59. Reyes-DominguezY, BokJW, BergerH, ShwabEK, BasheerA, et al. (2010) Heterochromatic marks are associated with the repression of secondary metabolism clusters in Aspergillus nidulans. Mol Microbiol 76 : 1376–1386.
60. EissenbergJC, HartnettT (1993) A heat shock-activated cDNA rescues the recessive lethality of mutations in the heterochromatin-associated protein HP1 of Drosophila melanogaster. Mol Gen Genet 240 : 333–338.
61. LuBY, EmtagePC, DuyfBJ, HillikerAJ, EissenbergJC (2000) Heterochromatin protein 1 is required for the normal expression of two heterochromatin genes in Drosophila. Genetics 155 : 699–708.
62. HaldarS, SainiA, NandaJS, SainiS, SinghJ, et al. (2011) Role of Swi6/HP1 self-association-mediated recruitment of Clr4/Suv39 in establishment and maintenance of heterochromatin in fission yeast. J Biol Chem 286 : 9308–9320.
63. LewisZA, AdhvaryuKK, HondaS, ShiverAL, KnipM, et al. (2010) DNA methylation and normal chromosome behavior in Neurospora depend on five components of a histone methyltransferase complex, DCDC. PLoS Genet 6: e1001196.
64. WoellmerA, Arteaga-SalasJM, HammerschmidtW (2012) BZLF1 governs CpG-methylated chromatin of Epstein-Barr Virus reversing epigenetic repression. PLoS Pathog 8: e1002902.
65. FlueckC, BartfaiR, NiederwieserI, WitmerK, AlakoBTF, et al. (2010) A major role for the Plasmodium falciparum ApiAP2 protein PfSIP2 in chromosome end biology. PLoS Pathog 6: e1000784.
66. KellerNP, HohnTM (1997) Metabolic pathway gene clusters in filamentous fungi. Fungal Genet Biol 21 : 17–29.
67. FernandesM, KellerNP, AdamsTH (1998) Sequence-specific binding by Aspergillus nidulans AflR, a C6 zinc cluster protein regulating mycotoxin biosynthesis. Mol Microbiol 28 : 1355–1365.
68. MichielseCB, van WijkR, ReijnenL, MandersEM, BoasS, et al. (2009) The nuclear protein Sge1 of Fusarium oxysporum is required for parasitic growth. PLoS Pathog 5: e1000637.
69. ZahiriA, HeimelK, WahlR, RathM, KämperJ (2010) The Ustilago maydis forkhead transcription factor Fox1 is involved in the regulation of genes required for the attenuation of plant defenses during pathogenic development. Mol Plant Microbe Interact 23 : 1118–1129.
70. WaddingtonCH (1942) The epigenotype. Endeavour 1 : 18–20.
71. KnipeDM, CliffeA (2008) Chromatin control of herpes simplex virus lytic and latent infection. Nat Rev Microbiol 6 : 211–221.
72. LanzerM, FischerK, Le BlancqSM (1995) Parasitism and chromosome dynamics in protozoan parasites: is there a connection? Mol Biochem Parasit 70 : 1–8.
73. Freitas-JuniorLH, Hernandez-RivasR, RalphSA, Montiel-CondadoD, Ruvalcaba-SalazarOK, et al. (2005) Telomeric heterochromatin propagation and histone acetylation control mutually exclusive expression of antigenic variation genes in malaria parasites. Cell 121 : 25–36.
74. MerrickCJ, DuraisinghMT (2006) Heterochromatin-mediated control of virulence gene expression. Mol Microbiol 62 : 612–620.
75. SmithDJ, BurnhamMK, BullJH, HodgsonJE, WardJM, et al. (1990) Beta-lactam antibiotic biosynthetic genes have been conserved in clusters in prokaryotes and eukaryotes. EMBO J 9 : 741–747.
76. BokJW, KellerNP (2004) LaeA, a regulator of secondary metabolism in Aspergillus spp. Eukaryot Cell 3 : 527–535.
77. PalmerJM, KellerNP (2010) Secondary metabolism in fungi: does chromosomal location matter? Curr Opin Microbiol 13 : 431–436.
78. Broggini GAL (2007) Identification of apple scab avirulence gene AvrVg candidates. PhD Thesis. University of Zurich 112 pp.
79. de WitPJGM, van der BurgtA, OkmenB, StergiopoulosI, Abd-ElsalamKA, et al. (2012) The genomes of the fungal plant pathogens Cladosporium fulvum and Dothistroma septosporum reveal adaptation to different hosts and lifestyles but also signatures of common ancestry. PLoS Genet 8: e1003088.
80. ColemanJJ, RounsleySD, Rodriguez-CarresM, KuoA, WasmannCC, et al. (2009) The genome of Nectria haematococca: contribution of supernumerary chromosomes to gene expansion. PLoS Genet 5: e1000618.
81. PlettJM, MartinF (2012) Poplar root exudates contain compounds that induce the expression of MiSSP7 in Laccaria bicolor. Plant Signal Behav 7 : 12–15.
82. BrakhageAA (2012) Regulation of fungal secondary metabolism. Nat Rev Microbiol 11 : 21–32.
83. ThommaBP, BoltonMD, ClergeotPH, De WitPJGM (2006) Nitrogen controls in planta expression of Cladosporium fulvum Avr9 but no other effector genes. Mol Plant Pathol 7 : 125–130.
84. BalesdentMH, AttardA, Ansan-MelayahD, DelourmeR, RenardM, et al. (2001) Genetic control and host range of avirulence toward Brassica napus cultivars Quinta and Jet Neuf in Leptosphaeria maculans. Phytopathology 91 : 70–76.
85. MullinsED, ChenX, RomaineP, RainaR, GeiserDM, et al. (2001) Agrobacterium-Mediated Transformation of Fusarium oxysporum: an efficient tool for insertional mutagenesis and gene transfer. Phytopathology 91 : 173–180.
86. GardinerDM, HowlettBJ (2004) Negative selection using thymidine kinase increases the efficiency of recovery of transformants with targeted genes in the filamentous fungus Leptosphaeria maculans. Curr Genet 45 : 249–255.
87. Ansan-MelayahD, BalesdentMH, BueeM, RouxelT (1995) Genetic characterization of AvrLm1, the first avirulence gene of Leptosphaeria maculans. Phytopathology 85 : 1525–1529.
88. BlaiseF, RémyE, MeyerM, ZhouL, NarcyJP, et al. (2007) A critical assessment of Agrobacterium tumefaciens-mediated transformation as a tool for pathogenicity gene discovery in the phytopathogenic fungus Leptosphaeria maculans. Fungal Genet Biol 44 : 123–138.
89. BalesdentMH, LouvardK, PinochetX, RouxelT (2006) A large scale survey of races of Leptosphaeria maculans occurring on oilseed rape in France. Eur J Plant Pathol 114 : 53–65.
90. GallC, BalesdentMH, RobinP, RouxelT (1994) Tetrad analysis of acid phosphatase, soluble protein patterns, and mating type in Leptosphaeria maculans. Phytopathology 84 : 1299–1305.
91. AttardA, GoutL, RossS, ParlangeF, CattolicoL, et al. (2005) Truncated and RIP-degenerated copies of the LTR retrotransposon Pholy are clustered in a pericentromeric region of the Leptosphaeria maculans genome. Fungal Genet Biol 42 : 30–41.
92. Sambrook J, Russell DW (2001) Molecular cloning: a laboratory manual. Cold Spring Harbor Laboratory Press, Cold Spring Harbor, NY, U.S.A.
93. LiuYG, MitsukawaN, OosumiT, WhittierRF (1995) Efficient isolation and mapping of Arabidopsis thaliana T-DNA insert junctions by thermal asymmetric interlaced PCR. Plant J 8 : 457–463.
94. MullerPY, JanovjakH, MiserezAR, DobbieZ (2002) Processing of gene expression data generated by quantitative real-time RT-PCR. BioTechniques 32 : 1372–1379.
95. BolstadBM, IrizarryRA, AstrandM, SpeedTP (2003) A comparison of normalization methods for high density oligonucleotide array data based on variance and bias. Bioinformatics 19 : 185–193.
96. IrizarryRA, HobbsB, CollinF, Beazer-BarclayYD, AntonellisKJ, et al. (2003) Exploration, normalization, and summaries of high density oligonucleotide array probe level data. Biostatistics 4 : 249–264.
97. SimonA, BiotE (2010) ANAIS: analysis of NimbleGen arrays interface. Bioinformatics 26 : 2468–2469.
98. FitzgeraldA, Van KanJA, PlummerKM (2004) Simultaneous silencing of multiple genes in the apple scab fungus, Venturia inaequalis, by expression of RNA with chimeric inverted repeats. Fungal Genet Biol 41 : 963–971.
99. de GrootMJ, BundockP, HooykaasPJ, BeijersbergenAG (1998) Agrobacterium tumefaciens-mediated transformation of filamentous fungi. Nat Biotechnol 16 : 839–842.
100. AltschulSF, GishW, MillerW, MyersEW, LipmanDJ (1990) Basic local alignment search tool. J Mol Biol 215 : 403–410.
101. SturnA, QuackenbushJ, TrajanoskiZ (2002) Genesis: cluster analysis of microarray data. Bioinformatics 18 : 207–208.
102. PapadopoulosJS, AgarwalaR (2007) COBALT: constraint-based alignment tool for multiple protein sequences. Bioinformatics 23 : 1073–1079.
Štítky
Genetika Reprodukční medicínaČlánek vyšel v časopise
PLOS Genetics
2014 Číslo 3
- Kazuistika – Perspektivy využití precizované medicíny v rámci personalizované specifické terapie onkologických pacientů
- Nobelova cena za chemii pro genetické nůžky: Objev, který změní naši budoucnost?
- Technologie na bázi RNA v klinické praxi: od přebarvených petúnií k terapii vzácných a dosud jen obtížně léčitelných chorob u lidí
- „Nepředstavovali jsme si, že náš výzkum povede přímo ke vzniku nových léků, dokonce ještě za našeho života“
- Bezplatné služby pro diagnostiku ATTRv amyloidózy pro kardiology
Nejčtenější v tomto čísle
- Worldwide Patterns of Ancestry, Divergence, and Admixture in Domesticated Cattle
- Genome-Wide DNA Methylation Analysis of Human Pancreatic Islets from Type 2 Diabetic and Non-Diabetic Donors Identifies Candidate Genes That Influence Insulin Secretion
- Genetic Dissection of Photoreceptor Subtype Specification by the Zinc Finger Proteins Elbow and No ocelli
- GC-Rich DNA Elements Enable Replication Origin Activity in the Methylotrophic Yeast
Zvyšte si kvalifikaci online z pohodlí domova
Mazová zátka a její řešení
nový kurzVšechny kurzy