
Parent-of-Origin Effects Implicate Epigenetic Regulation of Experimental Autoimmune Encephalomyelitis and Identify Imprinted as a Novel Risk Gene
Even with recent progress in determining the genetic basis of complex diseases, the issue of ‘missing heritability’ remains and its potential sources are frequently speculated about but rarely explained. Parent-of-origin effects might contribute to the ‘missing heritability’ and involve genetic and epigenetic mechanisms of inheritance. Our study is the first that establishes (i) the magnitude and (ii) the type of parent-of-origin effects in the pathogenesis of a multiple sclerosis-like disease, experimental autoimmune encephalomyelitis (EAE) in rat, using a strategy designed to identify genes that confer risk only when inherited from either mother or father. A striking 37-54% of all risk loci depended on parental origin. Accounting for parent-of-origin enabled more powerful and precise identification of novel risk factors for EAE, such as the imprinted Dlk1gene. Disease-predisposing alleles conferred lower Dlk1 expression in rats and transgenic Dlk1 mice demonstrated that lower Dlk1 drives more severe EAE and modulates adaptive immune responses. Because parental-origin effects are epigenetically regulated, our data implicate a contributory role for epigenetic mechanisms in complex diseases. Considering parent-of-origin effects in complex disease has enabled more powerful and precise identification of novel risk factors.
Published in the journal:
. PLoS Genet 10(3): e32767. doi:10.1371/journal.pgen.1004265
Category:
Research Article
doi:
https://doi.org/10.1371/journal.pgen.1004265
Summary
Even with recent progress in determining the genetic basis of complex diseases, the issue of ‘missing heritability’ remains and its potential sources are frequently speculated about but rarely explained. Parent-of-origin effects might contribute to the ‘missing heritability’ and involve genetic and epigenetic mechanisms of inheritance. Our study is the first that establishes (i) the magnitude and (ii) the type of parent-of-origin effects in the pathogenesis of a multiple sclerosis-like disease, experimental autoimmune encephalomyelitis (EAE) in rat, using a strategy designed to identify genes that confer risk only when inherited from either mother or father. A striking 37-54% of all risk loci depended on parental origin. Accounting for parent-of-origin enabled more powerful and precise identification of novel risk factors for EAE, such as the imprinted Dlk1gene. Disease-predisposing alleles conferred lower Dlk1 expression in rats and transgenic Dlk1 mice demonstrated that lower Dlk1 drives more severe EAE and modulates adaptive immune responses. Because parental-origin effects are epigenetically regulated, our data implicate a contributory role for epigenetic mechanisms in complex diseases. Considering parent-of-origin effects in complex disease has enabled more powerful and precise identification of novel risk factors.
Introduction
Complex diseases, like common chronic inflammatory conditions, arise from an interplay between multiple risk genes and environmental factors. Etiology is often largely unknown with variable penetrance and expressivity making it difficult to identify contributing factors.
Epigenetic mechanisms might act at the interface between the genome and environmental signals and determine stable and heritable changes in gene expression that do not require changes in the DNA sequence. Such states are mediated by DNA methylation and post-translational modifications to core histones that have an impact on gene expression [1]. Thus, it is not surprising that deregulated epigenetic mechanisms can lead to pathological conditions extensively studied in tumor biology. Therefore, while the DNA sequence confers the primary information for expression and protein structure, epigenetic mechanisms are dynamic and can mediate information about the cellular environment to regulate the specific establishment and maintenance of gene expression. Studies in mice have shown that maternal diet is associated with changes in DNA methylation in offspring [2], [3]. Additionally, monozygotic twins acquire differences in chromatin structure during their life span [4], [5]. Such altered epigenetic states might confer differences in disease susceptibility between monozygotic twins, as shown in systemic lupus erythematosus [6]. Moreover, some environmentally-associated epigenetic changes might even be transmitted through generations, as suggested in humans [7], [8] and demonstrated in mice and rats [9]–[11].
A number of recent studies implicate epigenetic mechanisms in the inheritance of multiple sclerosis (MS), a chronic inflammatory disease of the central nervous system (CNS). For example, there is a significantly higher risk for maternal half-siblings to develop MS compared to paternal half-siblings [12]. Similar parent-of-origin effects have recently been demonstrated for the major MS risk factor, the HLA haplotype [13], [14]. HLA is also under direct and indirect epigenetic regulation as DNA methylation has been demonstrated to alter the expression of HLA and its transcriptional activator [15]. The increasing prevalence of MS among women during the last several decades is speculated to result from changes in the environment [16] and the risk for MS is increased in children of affected mothers [17]. Thus, there is emerging evidence for complex interactions between genetic, environmental and epigenetic mechanisms underlying the pathogenesis of MS.
We here sought to dissect the extent of parent-of-origin effects in the etiology of an experimental MS-like disease, myelin oligodendrocyte glycoprotein (MOG)-induced experimental autoimmune encephalomyelitis (EAE) in rodents. We used a backcross strategy between susceptible DA and resistant PVG.AV1 rat strains designed to identify the parental origin of disease-predisposing alleles. Typically, DA rats display a relapsing-remitting disease course with an average onset around two weeks after immunization with MOG antigen, which is used to trigger the immune response in this model. Conversely, PVG.AV1 rats are nearly completely resistant to the same induction protocol [18]. Our study establishes the magnitude and the type of parent-of-origin effects in inheritance of rat EAE, a robust MS model that mimics many features of the human disease [19] providing valuable insight into the mechanism of susceptibility to complex inflammatory diseases and identifying new risk factors.
Results
Parent-of-origin effects reflect a combination of genetic and epigenetic mechanisms. In order to investigate them, we created two experimental populations by back crossing heterozygous F1 hybrids with either the susceptible DA strain (DABC, N = 421) or the resistant PVG strain (PVGBC, N = 471) (Figure 1). Within each population, two reciprocal crosses were established that were used to identify parent-of-origin dependent quantitative trait loci (QTL), while either of the two populations were used to validate QTLs identified in the other population of two reciprocal crosses.

Genetic parent-of-origin effects: Sex chromosomes and mitochondria
Genes on the sex chromosomes are inherited in a parent-of-origin dependent manner and the influence of the Y chromosome has been well documented in mouse EAE [20], [21]. To assess the impact of the sex chromosomes in EAE in rats, we bred rats that have the X and the Y chromosome inherited either from the EAE-susceptible DA or from the EAE-resistant PVG rat strain (Figure 1). The F1xDA male offspring (N = 104) that carry the susceptible DA Y chromosome had an overall higher EAE incidence with earlier disease onset and more severe disease than DAxF1 offspring males (N = 104) that carry resistant PVG Y chromosome (Table 1). Thus, the Y chromosome from the susceptible DA strain conferred higher incidence and more severe EAE. This is further supported by absence of a difference in disease susceptibility between PVGxF1 (N = 106) and F1xPVG (N = 126) offspring males that inherited the Y chromosome from the resistant PVG strain (Table 1, Figure 1). Potential interactions between Y and nuclear genes could not be explored due to the backcross design where the Y effect in the DABC population segregates between reciprocal crosses together with the parent-of-origin effects. Furthermore, we did not observe any global influence of the X chromosome in this study (Table 1).

Exclusively maternally inherited are genes encoded by the mitochondrial genome. To date, the influence of mitochondria has not been unequivocally established in EAE [22]. To assess the impact of mitochondria on EAE in rats, we bred rats that inherited mitochondria either from the DA or from the PVG strain (Figure 1). We did not detect robust differences between rats with varying mitochondrial genomes (Table 1, Text S1).
Therefore considering parental effects of sex chromosomes and mitochondria, the Y chromosome is primarily responsible for MOG-induced EAE in these rat strains.
Parent-of-origin effects at autosomes: Imprinted loci
In the next stage, we investigated the impact of epigenetic mechanisms such as imprinting on inheritance of EAE. To that end, we identified genome-wide QTLs, which are genomic loci that encode EAE risk genes with the disease status dependent on the genotype at these loci (presence of either DA = D or PVG = P alleles). To identify parent-of-origin dependent QTLs, we used a reciprocal backcross breeding strategy that allowed the risk alleles inherited from mothers to be unequivocally discriminated from those of fathers in the heterozygous animals [23]. QTLs detected in DABC were considered as parent-of-origin dependent QTLs if they showed an effect in only one of the reciprocal crosses, either DAxF1 (PVG alleles are paternally inherited) or F1xDA (PVG alleles are maternally inherited). We also detected overlapping or additional parent-of-origin QTLs in PVGBC that showed an effect in only one of the reciprocal crosses, either PVGxF1 (DA alleles are paternally inherited) or F1xPVG (DA alleles are maternally inherited). This pattern of inheritance, whereby a gene variant affects the phenotype only when expressed from the maternal or the paternal copy is typical for imprinted genes.
Proof of concept for reciprocal backcross strategy: A parent-of-origin dependent QTL comprises the imprinted IGF2 gene
The reciprocal backcross strategy was first tested on the weight of naïve rats, which is a physiological phenotype not related to EAE. PVG rats are typically heavier than age-matched DA rats, and several QTLs regulate this trait in DABC (Figure S1A). We detected a QTL on chromosome 1 in females with the peak around 185 Mb (Figure S1B) where the PVG allele predisposed for higher weight preferentially when paternally inherited (Figure S1C). The same locus predisposed for higher weight when paternally inherited in the validation population of PVGBC females (p<0.001).
The IGF2 gene, known to regulate growth and weight and to be expressed only from the paternal copy [24], is encoded in this locus. Concordantly, the weight of newborn F1 hybrid pups was higher when the PVG allele was paternally inherited (p<0.05) (Figure S1D). To confirm IGF2 imprinting in our rat strains, we measured allele-specific IGF2 expression utilizing a single nucleotide polymorphism (SNP) in the 5′ UTR of IGF2 that segregates between DA and PVG (Figure S1E). IGF2 was exclusively expressed from the paternal copy in livers of newborn rats. Together, these data suggest that the gene responsible for weight regulation in a parent-of-origin manner in this QTL is likely IGF2. It also shows that the reciprocal backcross strategy can be used to identify parent-of-origin dependent QTLs.
Identification and validation of parent-of-origin dependent QTLs in EAE
We then used the reciprocal backcross strategy to carry out identification of QTLs that control EAE susceptibility (reflected by incidence and onset), EAE severity (reflected by maximum score and duration) and subclinical disease (reflected by weight loss). We performed genome-wide linkage analysis in DABC and PVGBC populations using forward selection followed by backward elimination model in R/qtl [25]). In total, 16 and 11 loci showed evidence for linkage with different EAE phenotypes in DABC and PVGBC, respectively (Table S1). We next performed genome-wide linkage analysis in the separate reciprocal crosses to identify parent-of-origin dependent QTLs. All reciprocal crosses had similar and sufficient power to detect QTLs of effects typical for EAE (Table S2, Table S3). Of all EAE QTLs, 44% (7/16) and 73% (8/11) showed parent-of-origin dependent transmission of risk alleles in DABC and PVGBC, respectively (Table 2, Table 3). The experimental design, comprising two independent populations (DABC and PVGBC), allows validation of identified parent-of-origin dependent QTLs (Figure 1). Six out of 8 (75%) QTLs that showed linkage in only one of the reciprocal crosses in the DABC population (Table 2) also showed evidence for linkage in one of the reciprocal crosses within the independent PVGBC population (Table 3), with the same type of parental transmission of risk, i.e. maternal or paternal. Likewise, six out of 8 (75%) QTLs, identified in only one reciprocal cross in the PVGBC population (Table 3) were confirmed in one of the reciprocal crosses within the independent DABC population (Table 2), with the same type of parental transmission.


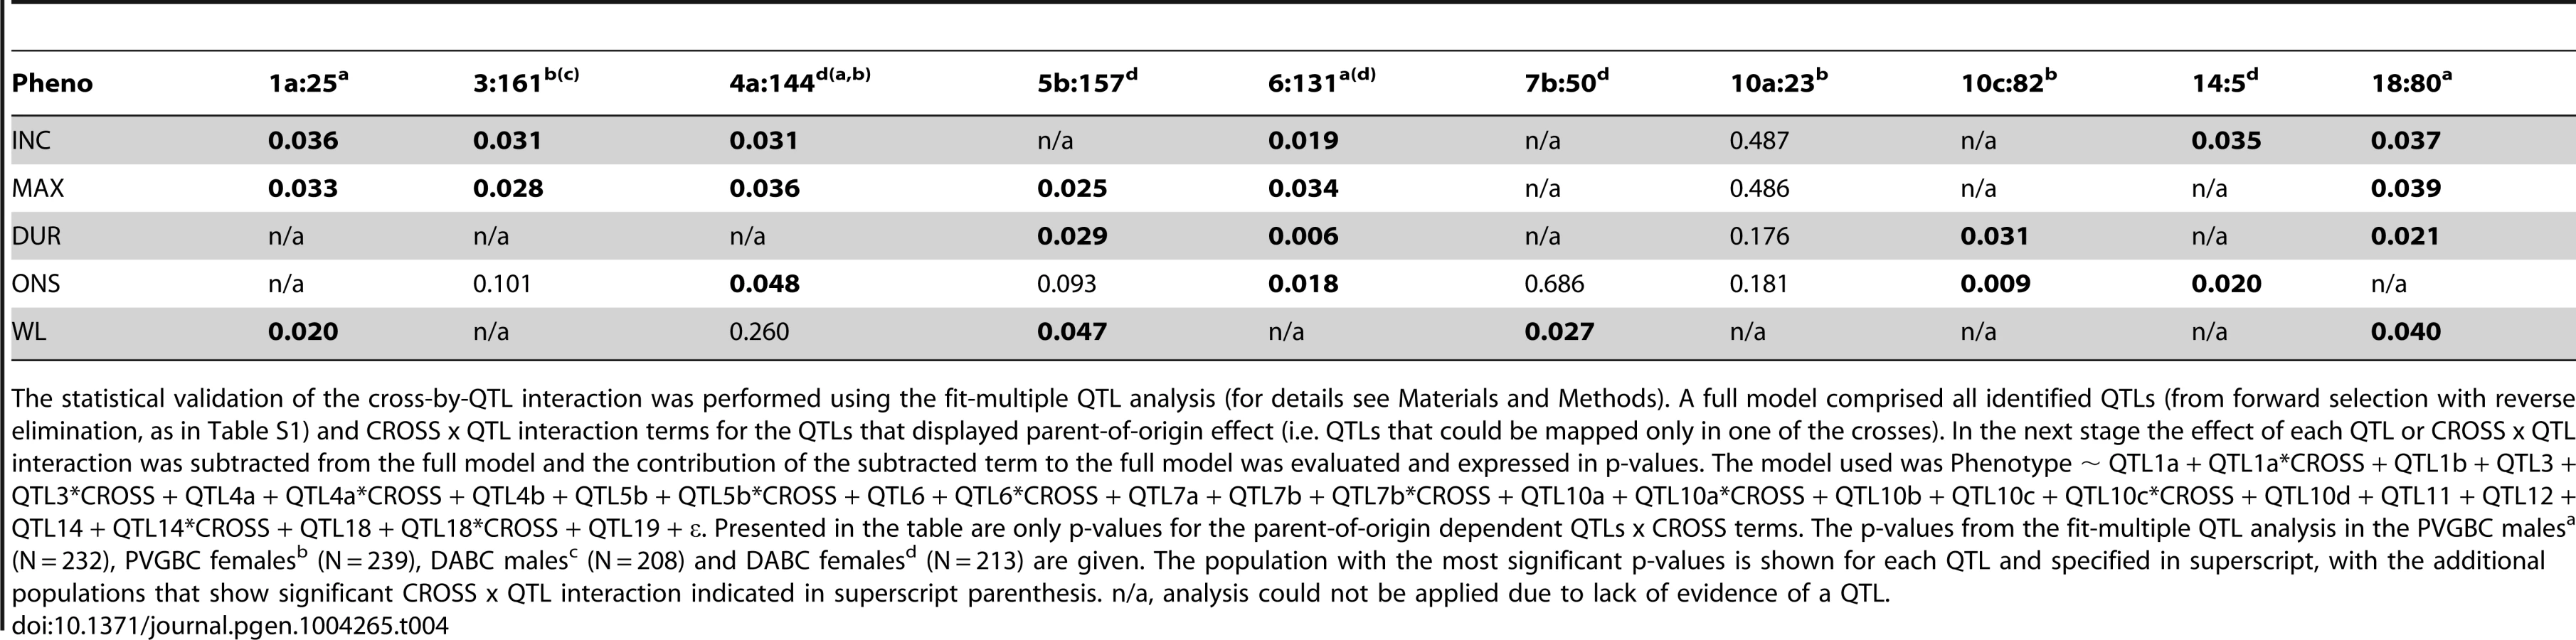
To additionally confirm that these are true parent-of-origin QTLs and not a failure to detect a significant QTL in one of the crosses, we performed analysis of cross-by-QTL interactions, which is a statistical way of showing that the parental origin of the allele (inferred by the “cross”) affects the expressivity of the QTL. The majority of identified parent-of-origin QTLs (80%) showed significant dependence on the cross/origin (Table 4). Only a QTL on chromosome 10 (peak at 23 Mb) failed to show interaction and a QTL on chromosome 7 (peak at 50 Mb) showed significance only for one phenotype.
Nonetheless, we wanted to confirm the parent-of-origin dependent QTLs in an entirely different experimental population. For that purpose we used 794 rats originating from the same DA and PVG.AV1 parental strains that were randomly bred for 10 generations (G10) and induced with EAE. We repeated the QTL interaction analysis described above in this large population. We found a significant origin-by-QTL interaction in G10 for the same QTLs that showed evidence of cross-by-QTL interaction in the backcrosses (Table 5). Only two out of 10 QTLs, on chromosomes 6 and 18, could not be tested because there was no significant evidence for a QTL in G10. To confirm that parent-of-origin QTLs were not just randomly detected effects, we tested loci (N = 9) that represent main-effect EAE QTLs that did not show evidence of parent-of-origin in the backcross (Table S4) and randomly selected loci (N = 10) (Table S5) for origin-by-QTL interaction. None of the main-effect QTLs in G10 or randomly selected loci showed a level of evidence that was considered to be substantial enough for parent-of-origin QTLs. These analyses demonstrate that the majority of detected parent-of-origin QTLs is genuine. Considering only QTLs that demonstrated significant interaction with the cross/origin, 37% (6/16) and 54% (6/11) of loci displayed significant parent-of-origin dependent transmission of risk alleles in DABC and PVGBC populations, respectively (summarized in Table 6).


Moreover, accounting for the parent-of-origin defines risk factors that explain a 2–4 fold higher percentage of disease variance compared to the factors identified in populations where parental origin is not considered (Figure 2, Table S1, Table S6). Contribution from more QTLs can be established if analyses are done in separate reciprocal crosses (Table S1).

Maternal transmission of EAE-predisposing alleles
We identified parent-of-origin QTLs with maternal transmission of EAE-predisposing alleles only in the F1xDA and F1xPVG reciprocal crosses, i.e. QTLs on chromosomes 1, 3, 4, 5, 14 and 18 (Table 2, Table 3). A QTL on chromosome 4 (peak at 144 Mb) was identified in two independent experimental populations (DABC and PVGBC) with the DA allele predisposing for disease only when maternally inherited. In PVGBC, the DA allele predisposed for EAE only in F1xPVG offspring, which inherited the DA allele maternally (Figure 3A). Interestingly, in DABC females, analysis in reciprocal backcrosses separated what originally appeared to be one wide QTL, with a peak at 185 Mb, into two QTLs at 144 Mb and 185 Mb (Table 2, Figure 3b). The first of them overlapped the QTL identified in PVGBC (peak at 144 Mb) and also displayed linkage in only one of the reciprocal crosses, F1xDA. Additionally, this QTL displayed significant cross-by-QTL interactions in all three populations, DABC, PVGBC and G10 for multiple phenotypes (Table 4, Table 5). The genetic variants (EAE-promoting DA vs. EAE-protective PVG) at this QTL could exert the effect on EAE only when present on the maternally inherited chromosome, resembling genomic imprinting. This pattern of transmission of risk alleles implicates that the underlying gene is preferentially expressed from the maternal copy while it is fully or partially repressed on the paternal copy.

Paternal transmission of EAE-predisposing alleles
We then investigated parent-of-origin QTLs that depend on paternal transmission, identified only in the DAxF1 and PVGxF1 reciprocal crosses, i.e. QTLs on chromosomes 6, 7 and 10 (Table 2, Table 3). A QTL on chromosome 6 (peak at 131 Mb) was identified in PVGBC and confirmed in DABC females (Table 3, Table 2). In PVGBC, the paternal PVG allele predisposed for EAE only in PVGxF1 offspring (Figure 4A). Accordingly, in DABC, the PVG allele predisposed for EAE only in DAxF1 offspring, which inherited the PVG allele paternally (Figure 4B). The QTL displayed significant cross-by-QTL interaction in the backcross population (Table 4). The genetic variants (DA vs. PVG) at this QTL could exert the effect on EAE only when present on the paternally inherited chromosome, resembling genomic imprinting. This pattern of transmission of risk alleles implicates that the underlying gene is preferentially expressed from the paternal copy while it is fully or partially repressed on the maternally inherited copy.

Dlk1 is a candidate gene underlying paternally transmitted EAE QTL on rat chromosome 6
QTL confidence intervals in backcross populations usually comprise large genomic intervals. To narrow the QTL on chromosome 6, we used probability mapping. The most likely interval to harbor the EAE-predisposing gene was between 130–134 Mb and 131–134 Mb in PVGBC and DABC, respectively. This region overlaps with a well-known cluster of imprinted genes, Dlk1-Dio3, on rat chromosome 6 and syntenic mouse and human chromosomes 12 and 14, respectively [26]–[28]. The predicted intergenic differentially methylated region (IG-DMR), known to control the imprinting status of the locus [29], showed around 50% methylation in spleens of backcross rats, which is typical for imprinted genes (data not shown). Thus, paternally expressed genes in the cluster, Dlk1, Rtl1 and Dio3 [28], [30], could explain paternal transmission of EAE risk allele at chromosome 6. We did not find any coding SNPs between DA and PVG in the Dlk1, Rtl1 and Dio3 genes (whole-genome SOLiD sequencing, Bäckdahl et al, manuscript). Therefore, we investigated if their expression levels are under parent-of-origin dependent regulation. Indeed, the PVG risk allele predisposed for lower levels of Dlk1 in spleen compared to DA alleles only when paternally transmitted (Figure 5). Rats that inherited the PVG allele from their fathers had lower expression of Dlk1 compared to rats with paternally inherited DA allele, in the two independent DABC and PVGBC populations (Figure 5A, B). This was further confirmed in reciprocal F1 hybrids with offspring rats that inherited PVG allele from their father displaying lower Dlk1 expression in spleen compared to rats with paternally inherited DA allele (Figure 5C). We found no evidence for parent-of-origin dependent expression differences of Rtl1 and Dio3 (Figure 5). Additionally, Dlk1 has previously been shown to be involved in regulation of immune responses [31]–[33]. Taken together, these findings suggest that Dlk1 may at least in part, be responsible for the effect of the parent-of-origin dependent QTL on chromosome 6, and that PVG alleles can promote EAE by means of lower Dlk1 expression when paternally inherited.

Dlk1 controls EAE and immune responses in mice
We next investigated the effect of differential Dlk1 expression on EAE using transgenic C57BL/6 mice that express a double dosage of Dlk1 in multiple tissues [34]. The Dlk1 transgenic mice were created by pronuclear injection of a bacterial artificial chromosome (BAC) transgene that encompasses the entire Dlk1 gene and endogenous flanking sequences but without the imprinting control region and the other genes in the cluster [34]. We first confirmed that levels of Dlk1 were elevated in three different immune tissues of transgenic mice compared to wild type littermate controls (Figure 6A). As expected from the backcross data, lower expression of Dlk1 in wild type mice predisposed to more severe EAE while higher expression of Dlk1 in transgenic mice was protective against EAE (Figure 6B). The observed differences in clinical disease were accompanied with differences in the immune response with lower frequency of activated CD4+ T cells and B cells in protected transgenic mice compared to their wild type littermate controls (Figure 6C). Furthermore, during the in vitro differentiation of naïve T cells into IFNγ-producing Th1 cells, known to have a pathogenic role in EAE [35]–[37], we observed that transgenic mice produced lower numbers of Th1 cells compared to wild type controls (Figure 6D).

Taken together, our data demonstrate parent-of-origin effects in EAE, including imprinting-like patterns of transmission of disease-predisposing alleles. Furthermore, we show that imprinted Dlk1 specifically modulates the adaptive immune responses and regulates susceptibility to EAE in vivo.
Discussion
Our data demonstrate that a striking 37–54% of loci predisposed for EAE in a parent-of-origin dependent manner. One of the very few studies in EAE that used a reciprocal backcross design in mice similarly demonstrated that 50% of EAE loci depend on parental transmission, although this result was based on a total of two out of four identified QTLs [38]. Parent-of-origin dependent loci on chromosomes 6, 10 and 18 identified in this study have been previously reported [39]–[42] as well as the majority of identified loci that did not depend on parental transmission [22], [39]–[42]. Replication of EAE loci in independent populations and strain combinations is important as it justifies investments in further candidate gene identification, which can also be significantly facilitated by exploiting information about locus segregation between multiple inbred strains. Additionally, replication of the majority of the loci that did not depend on parental origin confirms that our study was adequately powered to investigate parent-of-origin effects. Indeed, taking into account parent-of-origin enabled identification of multiple new risk loci on chromosomes 3, 4, 5, 7, 10 and 14, which have not been previously identified in rat EAE. Also, the loci on chromosomes 4 and 5 previously displayed linkage to immunological sub-phenotypes: IgG levels and the number of MHC class II positive cells in rat CNS, respectively [40], [43], but did not link to the clinical disease phenotypes. This likely reflects the lack of power in previous studies to identify disease QTLs at these loci in populations that are confounded by the parent-of-origin.
Parent-of-origin dependent EAE loci identified in this study overlap with experimentally confirmed or clusters of highly predicted imprinted genes (Figure S2). One example is the well-studied GNAS complex locus located at the peak of the maternally transmitted EAE QTL on chromosome 3. This locus comprises multiple gene products including maternally expressed G-protein a-subunit transcripts [44] that couple many receptors to cAMP signaling that is important in the immune and the nervous systems. Other known imprinted gene clusters are contained within the maternally transmitted EAE QTL on chromosome 1, including maternally inherited insulin growth factor 2 receptor (Igf2r) [45]. IGF2R has been shown to have an important role in T cell activation [46]. The maternally transmitted EAE locus on chromosome 14 comprises growth factor independence 1 (Gfi1) predicted though not shown to be maternally expressed in mice [47]. GFI1 has recently emerged as an important transcriptional repressor involved in lymphocyte development and activation (reviewed by [48]). Further functional studies in cell types relevant for EAE pathogenesis will demonstrate if known or novel imprinted genes are EAE loci.
In this study, we addressed the locus on chromosome 6 that overlaps well known imprinted Dlk1-Dio3 cluster. Taking parent-of-origin of inherited alleles into consideration enabled us to identify Dlk1 as a novel candidate risk gene for EAE. Indeed, predisposition to develop more severe EAE when the risk allele was exclusively paternally transmitted strongly implicated paternally expressed genes, Dlk1, Rtl1 or Dio3, encoded in the EAE QTL on chromosome 6 [30]. Furthermore, the paternally inherited risk allele at chromosome 6 predisposed for lower expression of Dlk1 in spleen in both DABC and PVGBC populations and in reciprocal hybrids between DA and PVG strains. The Dlk1 protein is shown to be involved in signaling pathways like the ERK/MAPK pathway [49], [50] and the FGF signaling pathway [51]. Moreover, Dlk1 protein, which is very similar to the signaling molecules of the Notch delta family [52], is an atypical Notch ligand suggested to inhibit Notch signaling [52]–[54]. The fact that Notch signaling has been strongly implicated in EAE and MS pathogenesis [55] thus suggests that lower levels of Dlk1 might fail to appropriately control Notch signaling thereby predisposing for a more severe disease in rats.
To directly establish a role of the Dlk1 gene in EAE pathogenesis, we used Dlk1 transgenic mice [34] and we demonstrated that the mice express elevated levels of Dlk1 in several immune tissues and, importantly, develop less severe EAE. This observation may, at least in part, be attributed to a role of Dlk1 in blocking Notch signaling. Accordingly, inhibiting Notch signaling has been shown to prevent and ameliorate EAE and decrease production of the proinflammatory cytokine IFN-γ [56], [57]. Nevertheless, besides its role in the immune system, Dlk1 might affect cells in the target organ in EAE/MS as Notch has been shown to suppress oligodendrocyte differentiation [55] and Dlk1 has been shown to affect neurogenesis [58]. Thus, the exact molecular mechanisms underlying a role for Dlk1 in EAE pathogenesis remain to be investigated. In the present study, higher Dlk1 expression ameliorated EAE and was associated with reduced frequency of activated CD4+ T cells in peripheral lymphoid tissues. This is of particular interest since CD4+ T cells have been ascribed a driving role in EAE, which can be induced with the transfer of CD4+ T cells reactive against CNS antigens [59]. In this regard, it has been previously shown that enhanced Notch signaling increases T cell proliferation [60] and protects activated T cells from going into apoptosis [61]. Accordingly, we observed that Dlk1 transgenic mice fail to differentiate the same number of IFN-γ secreting Th1 cells compared to the wild type controls. This can explain lower severity of EAE in Dlk1 mice considering the well documented pathogenic role of Th1 cells [35]–[37]. Because of the known association of Notch protein with nuclear-factor-kB (NF-kB), we hypothesize that less Notch protein would be able to bind to NF-kB in the Dlk1 transgenic mice and thereby lead to less T cell activation, in general, and less IFN-γ producing Th1 cells, in particular. Moreover, Dlk1 transgenic mice displayed lower frequency of B cells in peripheral lymphoid tissues, which is in line with a previously demonstrated effect of Dlk1 deletion on B cell differentiation and function [31]. In addition, Notch signaling has been shown to regulate B cell activation and differentiation into antibody secreting cells [62], [63]. This is important given that B cells exert important roles not only as antigen presenting cells that activate T cells, but also as cells that produce anti-MOG antibodies, which can cause demyelination in MOG-EAE. Our study highlights for the first time Dlk1 as a regulator of the adaptive immune responses and an autoimmune disease that models MS.
Our findings also have important implications for genetic studies of complex human diseases, currently dominated by genome-wide association studies (GWAS) that do not take into account parental origin of alleles. It is generally accepted that GWAS have a ‘missing heritability’ component, some of which may reside in parent-of-origin effects. Our study supports that parent-of-origin should be accounted for and could be one of many explanations for why all the identified risk variants together explain typically less than 30% of heritability [64]. For example, 180 loci identified in GWAS explain around 12% of height heritability [65]. In Crohn's disease, 71 risk genes explain less than 25% of heritability [66]. Similarly, in MS we found that 61 genetic variants explain ∼20% of genetic risk for disease [67]. Kong et al used the detailed genealogical information and long-range phasing of haplotypes to determine the parent-of-origin of alleles in Icelanders to identify five additional SNPs in imprinted genes that associate with disease [68]. Thus, information on the parental transmission of risk alleles is likely to add to the ‘missing heritability’ of complex diseases. Our data advocate family studies that can address the impact of parent-of-origin combined with the development of more powerful statistical methods to detect parent-of-origin effects in human populations. Indeed, Wallace et al identified a SNP neighboring the Dlk1 locus that strongly associates with type 1 diabetes depending on the parental origin [69] supporting our findings of a role of Dlk1 in autoimmunity.
Taken together, these results reinforce the importance of parent-of-origin effects and demonstrate that incorporating these effects into models of inheritance not only enables more powerful and precise identification of risk factors but also can provide a better understanding of the pathogenesis of complex diseases.
Materials and Methods
Ethics statement
All experiments in this study were approved and performed in accordance with the guidelines from the Swedish National Board for Laboratory Animals and the European Community Council Directive (86/609/EEC) under the ethical permits N332/06, N338/09 and N298/11 entitled ‘Genetic regulation, pathogenesis and therapy of EAE, an animal model for multiple sclerosis’, which were approved by the North Stockholm Animal Ethics Committee (Stockholms Norra djurförsöksetiska nämnd). Rats were tested according to a health-monitoring program at the National Veterinary Institute (Statens Veterinärmedicinska Anstalt, SVA) in Uppsala, Sweden.
Animals and experimental crosses
Inbred DA and PVG.AV1 rats were originally obtained from the Zentralinstitut für Versuchstierzucht (Hannover, Germany) from which colonies have been established at Karolinska Hospital (DA/Kini and PVG.1AV1/Kini). The Dlk1 transgenic mice were generated by and originally obtained from the Ferguson-Smith laboratory (Cambridge, UK). All animals were bred and kept in 12 h light/dark - and temperature-regulated rooms. Animals were housed in polystyrene cages containing aspen wood shavings and had free access to standard rodent chow and water. Animals were tested according to a health-monitoring program at the National Veterinary Institute.
Reciprocal backcrosses were established between EAE-susceptible DA and MHC-identical EAE-resistant PVG.1AV1 strains (Figure 1). To create the F1 generation, four breeding pairs with DA female founders were established. The reciprocal N2 generation was created from DA (N = 4) and PVG.1AV1 (N = 4) females bred to F1 males and F1 females bred to DA (N = 4) or PVG.1AV1 (N = 4) males. Four N2 litters were produced for MOG-EAE experiments. The population with the susceptible DA strain (DABC) consisted of 421 rats (213 females and 208 males) and the population with the resistant PVG strain (PVGBC) consisted of 471 rats (239 females and 232 males) (Table S2).
Advanced intercross line was established from two DA and two PVG females that were bred with PVG and DA males, respectively, to produce the F1 generation. Seven F1 couples from DA female founders and seven from PVG.AV1 female founders produced the F2 generation. The G3 generation originated from 50 breeding couples and random breeding of 50 males and 50 females, avoiding brother-sister mating, produced all subsequent generations, according to Darvasi and Soller [70]. In the G10 generation, three litters similar in size were produced for MOG-EAE experiments, comprising 428 females and 366 males.
Generation and characterization of the Dlk1 transgenic mice has previously been described in detail by da Rocha et al. [34]. In short, the Dlk1 transgenic mice were created by pronuclear injection of a bacterial artificial chromosome (BAC) transgene that encompasses the entire Dlk1 gene and endogenous flanking sequences but without other genes in the cluster. The foreign DNA is stably and randomly integrated into the genome with an estimated copy number of 4–5. Three different lines with Dlk1 BAC transgene (70A, 70B, 70C) demonstrated no difference in phenotype indicating no impact of integration site. Transgenic Dlk1 lines were then bred to C57BL/6 mice, known to be susceptible to EAE and extensively used as a background strain for different genetic models in EAE [71], for more than 10 generations. All experimental animals and littermate controls were derived from heterozygous Dlk1 transgenic breeding.
Induction and clinical evaluation of EAE
Recombinant rat and mouse MOG (amino acids 1-125 from the N terminus) was expressed in E. Coli and purified to homogeneity by chelate chromatography [72]. Animals were anesthetized with isoflurane (Abbott Laboratories) and immunized subcutaneously (s.c.) in the dorsal tail base. Each rat received a 200 μl inoculum containing MOG in phosphate buffered-saline (PBS) (Life Technologies) emulsified 1∶1 with incomplete Freunds adjuvant (IFA) (Sigma-Aldrich). With the aim of 50% disease incidence in each population, to achieve the highest power to detect EAE QTLs, different induction doses were used for the two backcrosses and for females and males within each backcross (Table S2). EAE was induced in 8–12 weeks old Dlk1 transgenic and wild type littermate C57BL/6 females with 50 μg rMOG that was emulsified in Complete Freud's Adjuvant (Sigma-Aldrich) and injected s.c. in the dorsal tail base. On day zero and day two post immunization (p.i.) each mouse was injected intraperitoneally (i.p.) with Bordetella pertussis toxin (Sigma-Aldrich). Animals were weighed and clinical signs of EAE were evaluated daily from day 7 p.i. until end of experiment.
The scale for EAE scoring was: 0, healthy; 1, tail weakness or tail paralysis; 2, hind leg paresis or hemiparesis; 3, hind leg paralysis or hemiparalysis; 4, tetraplegy and 5, death. The following clinical parameters were assessed and used in analysis: incidence of EAE (INC) i.e., scored as 1 if signs of EAE were present for more than one day; onset of EAE (ONS) i.e., day of first clinical sign; duration of EAE (DUR) i.e., number of days animals showed clinical signs; maximum EAE score (MAX) and weight loss (WL), calculated by subtracting the lowest weight during the experiment from the weight at the time of immunization and expressing the difference as a percentage of the weight at the time of immunization.
Genotyping
Genomic DNA was extracted from tail tips. Genotypes were determined by PCR amplification of microsatellite markers. Fluorophore-conjugated primers were used (Applied Biosystems, Eurofins MWG Operon) and PCR products were size fractionated on an electrophoresis capillary sequencer (ABI3730, Applied Biosystems). Genotypes were analyzed using the GeneMapper software (v. 3.7, Applied Biosystems) and all genotypes were manually confirmed by two independent observers. Dlk1 transgenic mice were genotyped using the following primers:
Dlk1_wt/Dlk1_tg_fwd_ CCA AAC TGC ACA ACG TGC TG; Dlk1_wt_rev_GAT CTT GAA CTA CCA AGG GC; Dlk1_tg_ rev_ACT TTA TGC TTC CCG CTC GT.
Experimental design to identify parent-of-origin effects
Two experimental populations were created by backcrossing F1 hybrids with either the susceptible DA strain (DABC) or the resistant PVG strain (PVGBC) (Figure 1). Within each population, two reciprocal crosses were established. The DAxF1breeding and the F1xDA breeding within DABC refer to the two reciprocal backcrosses. Likewise, the PVGxF1 breeding and the F1xPVG breeding within PVGBC refer to the two reciprocal backcrosses. The term “cross” always refers to one of these four reciprocal breedings, in which the first and the second strain refer to mother and father, respectively.
To identify parent-of-origin QTLs, QTL mapping was performed in the two reciprocal crosses (within the DABC or the PVGBC) separately. For example, the DAxF1 offspring inherited the PVG allele exclusively from fathers. Therefore, a QTL identified in the DAxF1 offspring and not in the F1xDA offspring would be dependent on the PVG allele predisposing for EAE only when paternally inherited. Moreover, DABC and PVGBC were used to validate parent-of-origin dependent QTLs found in each population respectively.
To control for genetic parent-of-origin effects, sex chromosomes and mitochondria varied only in DABC or PVGBC. For example, all DABC rats (offspring of the DAxF1 and the F1xDA breeding) had the DA mitochondria, while mitochondria varied between the two reciprocal crossed in the PVGBC, with PVG mitochondria in offspring from the PVGxF1 breeding and the DA mitochondria in offspring from the F1xPVG breeding. Similarly, while the Y chromosome varied between the two reciprocal crosses in DABC, all PVGBC (offspring of both the PVGxF1 and the F1xPVG breeding) were bred to have the same PVG Y chromosome.
Statistical and linkage analysis
The genetic map was defined using publicly available genome sequence (http://www.ensembl.org/v.55). The physical map was used to enable comparison of linkage analyses between crosses and sub-populations. All animals were genotyped with 140 evenly-spaced microsatellite markers providing 97% and 91% genome coverage with 25 cM and 20 cM spacing, respectively. Linkage analysis was performed using R/qtl software [25]. A single-QTL model analysis was performed using Haley-Knott regression on phenotypes transformed to account for experimental sets [73] (data not shown). Similar results were obtained using non-transformed phenotypes as well as using non-transformed phenotypes corrected for sex, experimental set and litter size that were used as additive and interactive covariates (data not shown). Permutation tests (N = 1000) were performed to determine the threshold levels for significant linkage and genome-wide p<0.05 thresholds were reported [74]. All analyzed sub-populations had similar size (Table S2) and displayed no difference in phenotypic variation between the compared sub-populations (p>0.4 for the majority of phenotypes), apart from the weight loss in DABC males (p<0.01). Differences between phenotypic variance in the compared sub-populations were tested with two variance - F test and Levene's test in Rcmdr. In addition, all analyzed crosses had similar and sufficient power to detect QTLs (Table S3).
Due to the polygenic nature of EAE [75] we used a multiple-QTL model mapping, i.e. forward selection to a model of 10 additive QTLs followed by backward elimination to the null model to identify a multiple-QTL model. A threshold LOD for a model of choice was set to allow detection of QTLs with modest effects, which we previously identified and confirmed in the same disease and the same strain combination. The fit to a multiple-QTL model was used to statistically validate the independent effect of each identified QTL and percentage of phenotypic variance explained by identified multiple-QTL models. Similar results were obtained in populations combining both reciprocal crosses and using cross as an interactive covariate with Haley-Knott regression (data not shown). Allelic effects of QTLs identified in the multiple-QTL model were calculated in Rcmdr using Student's t-test (Table 2, Table 3) and confirmed with the non-parametric Mann-Whitney test (data not shown) for all phenotypes except for incidence that was tested with the Fisher's exact test.
To confirm the parent-of-origin dependent QTLs in DABC or PVGBC, a cross-by-QTL interaction analyses were performed. For each detected parent-of-origin QTL the fit-multiple QTL modeling was performed that allows the statistical validation of the independent effect of each identified QTL and its interactions. It does so by subtracting the effect of each QTL or QTL interaction and comparing that model to the initial model of phenotypic variance where all QTLs have a full effect. Here, we built a full model that comprised all identified QTLs (from the forward selection - backward elimination analysis, as in Table S1) and CROSS x QTL interaction terms for the QTLs that displayed parent-of-origin effect (i.e. QTLs that could be mapped only in one of the reciprocal crosses). The full model: Phenotype ∼ pQTL1 + QTL2 + pQTL3 + … + QTLn + pQTL1*CROSS + pQTL3*CROSS + CROSS (pQTL indicates QTLs that could be identified only in one of the crosses, see table and figure legends for models used). In the next stage the effect of each QTL or QTL*CROSS interaction was subtracted from the full model and the contribution of the subtracted term to the full model was evaluated and expressed in p-values. All independent QTLs showed significant contribution and were not included in Table 4. The table contains p-value of the full model and the p-value of the contribution of the each tested parent-of-origin dependent CROSS x QTL interaction. Genotypes at the estimated QTL locations were simulated by the imputation method (N = 128 simulations on the step = 1Mb) implemented in the R/qtl statistical software [25]. Similar results were obtained using linear regression (data not shown).
To confirm the parent-of-origin dependent QTLs in the G10, fit-multiple QTL modeling tested all parent-of-origin dependent QTLs from the backcross analysis that displayed linkage in the G10 and their parent-of-origin interactions. The full model: Phenotype ∼ 1 : 25 + 3 : 161 + 4 : 144 + 5 : 157 + 7 : 50 + 10 : 23 + 10 : 82 + 14 : 5 + 1 : 25*Origin + 3 : 161*Origin + 4 : 144 *Origin + 5 : 157*Origin + 7 : 50*Origin + 10 : 23*Origin + 10 : 82*Origin + 14 : 5*Origin, where first and second number refer to chromosome and peak location in Mb of parent-of-origin dependent QTLs from the backcross analysis, respectively, and “Origin” refers to G9 parental/family origin of G10 rats. Table 5 contains the p-value of the contribution of the each tested parent-of-origin dependent Origin x QTL interaction. Genotypes at the estimated QTL locations were simulated by the imputation method (N = 128 simulations on the step = 1Mb) implemented in the R/qtl statistical software [25].
To identify the most likely location of the gene of interest in the chromosome 6 QTL, we calculated the probability of the gene being located at each position using a bootstrap approach in R/qtl [25]. The imputation method was chosen as it could be used with multivariate and non-normally distributed phenotypes, covariates, missing genotype data and genotyping errors in inbred line crosses. Simulated pedigrees were sampled with replacement from the observed DABC and PVGBC individuals to create a new data set with the same number of samples (Table 1), which was mapped using a single-QTL model in R/qtl [25]. The maximum LOD and the location of that maximum were recorded and the resampling was repeated 1000 times to obtain an estimate of the probability of the QTL effect being present at each position within the confidence interval. This procedure was repeated for each phenotype.
Sequencing
Exons of IGF2 gene were sequenced from the genomic DNA. Primers were designed using the Oligo 6.0 software (National Biosciences). PCR was performed using Platinum Taq protocol (Invitrogen), amplified DNA was purified (Qiagen Gmbh) and sent for sequencing (Eurofins MWG Operon). Sequence alignment was performed with Vector NTI software (InforMax). The identified SNP in the 5′ UTR of IGF2 [GeneBank:184956655] was confirmed by re-sequencing.
Allele-specific quantitative real-time PCR
A common reverse and two allele-specific forward primers, one that ends with C, complementary to the DA IGF2 allele and one that ends with T, complementary to the PVG IGF2 allele, were designed using Primer Express software (Applied Biosystems). The primer sequences for IGF2 are: forward primer, 5′ TCC TCT TGA GCA GGG ACA GC 3′ (DA allele); 5′ TCC TCT TGA GCA GGG ACA GT 3′ (PVG allele); reverse primer, 5′ AAA CCT GGG AAG GGA AGT GG 3′. The primer sequences for HPRT are: forward primer, 5′ CTC ATG GAC TGA TTA TGG ACA 3′; reverse primer, 5′ GCA GGT CAG CAA AGA ACT TAT 3′. Snap frozen liver tissue from new born rats was disrupted using Lysing Matrix D tubes (MP Biomedicals) on a FastPrep homogenizer (MP Biomedicals) and mRNA was extracted using RNeasy mini columns (Qiagen Gmbh), including on column DNA-digestion. Reverse transcription was performed with random hexamer primers (Gibco BRL) and Superscript Reverse Transcriptase (Invitrogen). Real-time PCR was performed on a BioRad iQ5 iCycler Detection System (BioRad) with a three-step PCR protocol (95°C for 3 min. followed by 40 cycles of 95°C for 10 sec., 67°C for 30 sec. and 72°C for 30 sec.) and with SYBR green fluorophore. PCR conditions (in specific, the annealing temperature) were optimized using DA and PVG samples to assure allele-specific amplification. At the annealing temperature of 67 degrees and using specific forward primer there was no amplification of the non-complementary allele (Ct >36). Relative quantification of mRNA levels was performed using the standard curve method, with amplification of target mRNA and HPRT mRNA. The standard curves were created using five serial 10-fold dilutions. The relative amount of mRNA in each sample was calculated as the ratio between the target mRNA and the corresponding endogenous control HPRT mRNA.
Quantitative real-time PCR
RNA was extracted from rat and mouse tissues using Qiagen RNeasy Mini Kit and cDNA created with BioRad iScript Kit. Quantitative real-time PCR of rat Dlk1, Rtl1 and Dio3 in the BC material was performed using a BioRad CFX384 Touch real-time PCR system with a two-step PCR protocol (95°C for 3 min. followed by 40 cycles of 95°C for 10 sec., 60°C for 30 sec. followed by melt curve analysis), using SYBR Green as the fluorophore (Bio-Rad). Cycle of threshold (Ct), efficiencies and melt curves were analyzed in CFX Manager software (Bio-Rad) and relative expression was calculated in relation to the mean of housekeeping genes, hypoxanthine phosphoribosyltransferase (Hprt) using 2-ΔΔCt. The following primers were used: Hprt_fwd CTC ATG GAC TGA TTA TGG ACA, Hprt_rev GCA GGT CAG CAA AGA ACT TAT; Dlk1_fwd CGG GAA ATT CTG CGA AAT AGA T, Dlk1_rev TCT CGA GGT CCA CGC AAG TC; Rtl1_fwd GCA TCG CAC TCG AGA ACT ACA G, Rtl1_rev CGT CGG CCA GGT CTG AGT AT; Dio3_fwd CAT CTG CGT ATC CGA CGA CA, Dio3_rev CTC ATG GGC CTG CTT GAA GA. We also used TaqMan quantitative PCR in mice and rat F1 reciprocals to measure Dlk1 expression and expression was normalized to Hprt. All qPCR reactions were carried out in 10 μl final volume using Standard Tagman qPCR conditions (Applied Biosystems protocol) and all samples were run in triplicates. Dlk1 expression levels were measured using TaqMan gene expression assay ID Rn00587011_m1 and Mm00494477_m1 for rat and mouse Dlk1, respectively.
Ex vivo and in vitro cell culture
Single cell suspension was prepared from spleen and lymph node tissue dissected 25 days p.i. and 10∧6 cells/well were plated in a 96-well V bottom plate (Corning) for FACS staining. For MOG recall 10∧6 cells/well were plated in a 96-well flat bottom plate (Corning) in RPMI medium (Life Technologies) supplemented with 10% FCS (Life technologies) and challenged with 20 μg of rMOG. After 48 h cells were transferred to a V bottom plate and prepared for FACS staining. For Th1 differentiation naïve CD4+ T cells were purified from whole lymph node cells using the CD4+ T cell isolation kit (Milteny Biotec). After isolation naïve CD4+ T cells were cultured with 1 μg/ml anti-CD3 (BD), 1 μg/ml anti-CD28 (BD) and 10 ng/ml of interleukin 12 (R&D systems) in RPMI medium supplemented with 10% FCS with and without 10 ng/ml of interleukin 2 for three days.
Flow cytometry
To characterize different immune cell subsets cells were stained with the following markers: FITC and A700 labeled CD3, FITC and APC labeled CD4, PE and PECy7 labeled CD8, A700 labeled CD44 Texas Red labeled CD45R and V450 labeled Ki67 and FoxP3 (from BD and eBioscience). For detection of IFNγ producing Th1 cells, naïve CD4+ T cells were incubated for 4 h with PMA and Ionomycin and then stained with IFNγ APC (BD). Surface stainings were done in PBS containing LIVE/DEAD fixable far-red dead cells exclusion dye (Life Technologies) and intracellular/cytokine stainings were done with the FoxP3 staining Kit (eBioscience). Cells were acquired in a Gallios flow cytometer and analyzed with the Kaluza software (both from Beckman Coulter).
Supporting Information
Zdroje
1. HandelAE, EbersGC, RamagopalanSV (2009) Epigenetics: molecular mechanisms and implications for disease. Trends Mol Med 16 : 7–16.
2. WaterlandRA, JirtleRL (2003) Transposable elements: targets for early nutritional effects on epigenetic gene regulation. Mol Cell Biol 23 : 5293–5300.
3. StricklandFM, HewagamaA, WuA, SawalhaAH, DelaneyC, et al. (2013) Diet influences expression of autoimmune-associated genes and disease severity by epigenetic mechanisms in a transgenic mouse model of lupus. Arthritis and rheumatism 65 : 1872–1881.
4. FragaMF, BallestarE, PazMF, RoperoS, SetienF, et al. (2005) Epigenetic differences arise during the lifetime of monozygotic twins. Proc Natl Acad Sci U S A 102 : 10604–10609.
5. KaminskyZA, TangT, WangSC, PtakC, OhGH, et al. (2009) DNA methylation profiles in monozygotic and dizygotic twins. Nat Genet 41 : 240–245.
6. JavierreBM, FernandezAF, RichterJ, Al-ShahrourF, Martin-SuberoJI, et al. (2009) Changes in the pattern of DNA methylation associate with twin discordance in systemic lupus erythematosus. Genome Res 20 : 170–179.
7. PembreyME, BygrenLO, KaatiG, EdvinssonS, NorthstoneK, et al. (2006) Sex-specific, male-line transgenerational responses in humans. Eur J Hum Genet 14 : 159–166.
8. TobiEW, LumeyLH, TalensRP, KremerD, PutterH, et al. (2009) DNA methylation differences after exposure to prenatal famine are common and timing - and sex-specific. Human molecular genetics 18 : 4046–4053.
9. MorganHD, SutherlandHG, MartinDI, WhitelawE (1999) Epigenetic inheritance at the agouti locus in the mouse. Nat Genet 23 : 314–318.
10. AnwayMD, CuppAS, UzumcuM, SkinnerMK (2005) Epigenetic transgenerational actions of endocrine disruptors and male fertility. Science 308 : 1466–1469.
11. CaroneBR, FauquierL, HabibN, SheaJM, HartCE, et al. (2010) Paternally induced transgenerational environmental reprogramming of metabolic gene expression in mammals. Cell 143 : 1084–1096.
12. EbersGC, SadovnickAD, DymentDA, YeeIM, WillerCJ, et al. (2004) Parent-of-origin effect in multiple sclerosis: observations in half-siblings. Lancet 363 : 1773–1774.
13. RamagopalanSV, HerreraBM, BellJT, DymentDA, DelucaGC, et al. (2008) Parental transmission of HLA-DRB1*15 in multiple sclerosis. Hum Genet 122 : 661–663.
14. ChaoMJ, RamagopalanSV, HerreraBM, LincolnMR, DymentDA, et al. (2009) Epigenetics in multiple sclerosis susceptibility: difference in transgenerational risk localizes to the major histocompatibility complex. Hum Mol Genet 18 : 261–266.
15. WrightKL, TingJP (2006) Epigenetic regulation of MHC-II and CIITA genes. Trends Immunol 27 : 405–412.
16. OrtonSM, HerreraBM, YeeIM, ValdarW, RamagopalanSV, et al. (2006) Sex ratio of multiple sclerosis in Canada: a longitudinal study. Lancet Neurol 5 : 932–936.
17. SadovnickAD, YeeIM, EbersGC (2000) Factors influencing sib risks for multiple sclerosis. Clin Genet 58 : 431–435.
18. WeissertR, WallstromE, StorchMK, StefferlA, LorentzenJ, et al. (1998) MHC haplotype-dependent regulation of MOG-induced EAE in rats. J Clin Invest 102 : 1265–1273.
19. StorchMK, StefferlA, BrehmU, WeissertR, WallstromE, et al. (1998) Autoimmunity to myelin oligodendrocyte glycoprotein in rats mimics the spectrum of multiple sclerosis pathology. Brain Pathol 8 : 681–694.
20. TeuscherC, NoubadeR, SpachK, McElvanyB, BunnJY, et al. (2006) Evidence that the Y chromosome influences autoimmune disease in male and female mice. Proc Natl Acad Sci U S A 103 : 8024–8029.
21. SpachKM, BlakeM, BunnJY, McElvanyB, NoubadeR, et al. (2009) Cutting edge: the Y chromosome controls the age-dependent experimental allergic encephalomyelitis sexual dimorphism in SJL/J mice. J Immunol 182 : 1789–1793.
22. BecanovicK, WallstromE, KornekB, GlaserA, BromanKW, et al. (2003) New loci regulating rat myelin oligodendrocyte glycoprotein-induced experimental autoimmune encephalomyelitis. J Immunol 170 : 1062–1069.
23. CuiY, CheverudJM, WuR (2007) A statistical model for dissecting genomic imprinting through genetic mapping. Genetica 130 : 227–239.
24. DeChiaraTM, RobertsonEJ, EfstratiadisA (1991) Parental imprinting of the mouse insulin-like growth factor II gene. Cell 64 : 849–859.
25. BromanKW, WuH, SenS, ChurchillGA (2003) R/qtl: QTL mapping in experimental crosses. Bioinformatics 19 : 889–890.
26. Schuster-GosslerK, BilinskiP, SadoT, Ferguson-SmithA, GosslerA (1998) The mouse Gtl2 gene is differentially expressed during embryonic development, encodes multiple alternatively spliced transcripts, and may act as an RNA. Developmental dynamics : an official publication of the American Association of Anatomists 212 : 214–228.
27. KobayashiS, WagatsumaH, OnoR, IchikawaH, YamazakiM, et al. (2000) Mouse Peg9/Dlk1 and human PEG9/DLK1 are paternally expressed imprinted genes closely located to the maternally expressed imprinted genes: mouse Meg3/Gtl2 and human MEG3. Genes to cells : devoted to molecular & cellular mechanisms 5 : 1029–1037.
28. TakadaS, TevendaleM, BakerJ, GeorgiadesP, CampbellE, et al. (2000) Delta-like and gtl2 are reciprocally expressed, differentially methylated linked imprinted genes on mouse chromosome 12. Current biology : CB 10 : 1135–1138.
29. LinSP, YoungsonN, TakadaS, SeitzH, ReikW, et al. (2003) Asymmetric regulation of imprinting on the maternal and paternal chromosomes at the Dlk1-Gtl2 imprinted cluster on mouse chromosome 12. Nat Genet 35 : 97–102.
30. HaganJP, O'NeillBL, StewartCL, KozlovSV, CroceCM (2009) At least ten genes define the imprinted Dlk1-Dio3 cluster on mouse chromosome 12qF1. PLoS One 4: e4352.
31. RaghunandanR, Ruiz-HidalgoM, JiaY, EttingerR, RudikoffE, et al. (2008) Dlk1 influences differentiation and function of B lymphocytes. Stem Cells Dev 17 : 495–507.
32. AbdallahBM, BoissyP, TanQ, DahlgaardJ, TraustadottirGA, et al. (2007) dlk1/FA1 regulates the function of human bone marrow mesenchymal stem cells by modulating gene expression of pro-inflammatory cytokines and immune response-related factors. J Biol Chem 282 : 7339–7351.
33. ChaconMR, MirandaM, JensenCH, Fernandez-RealJM, VilarrasaN, et al. (2008) Human serum levels of fetal antigen 1 (FA1/Dlk1) increase with obesity, are negatively associated with insulin sensitivity and modulate inflammation in vitro. Int J Obes (Lond) 32 : 1122–1129.
34. da RochaST, CharalambousM, LinSP, GutteridgeI, ItoY, et al. (2009) Gene dosage effects of the imprinted delta-like homologue 1 (dlk1/pref1) in development: implications for the evolution of imprinting. PLoS genetics 5: e1000392.
35. BaronJL, MadriJA, RuddleNH, HashimG, JanewayCAJr (1993) Surface expression of alpha 4 integrin by CD4 T cells is required for their entry into brain parenchyma. J Exp Med 177 : 57–68.
36. KroenkeMA, CarlsonTJ, AndjelkovicAV, SegalBM (2008) IL-12 - and IL-23-modulated T cells induce distinct types of EAE based on histology, CNS chemokine profile, and response to cytokine inhibition. J Exp Med 205 : 1535–1541.
37. StromnesIM, CerrettiLM, LiggittD, HarrisRA, GovermanJM (2008) Differential regulation of central nervous system autoimmunity by T(H)1 and T(H)17 cells. Nat Med 14 : 337–342.
38. EncinasJA, LeesMB, SobelRA, SymonowiczC, WeinerHL, et al. (2001) Identification of genetic loci associated with paralysis, inflammation and weight loss in mouse experimental autoimmune encephalomyelitis. Int Immunol 13 : 257–264.
39. BergsteinsdottirK, YangHT, PetterssonU, HolmdahlR (2000) Evidence for common autoimmune disease genes controlling onset, severity, and chronicity based on experimental models for multiple sclerosis and rheumatoid arthritis. J Immunol 164 : 1564–1568.
40. DahlmanI, JacobssonL, GlaserA, LorentzenJC, AnderssonM, et al. (1999) Genome-wide linkage analysis of chronic relapsing experimental autoimmune encephalomyelitis in the rat identifies a major susceptibility locus on chromosome 9. J Immunol 162 : 2581–2588.
41. DahlmanI, WallstromE, WeissertR, StorchM, KornekB, et al. (1999) Linkage analysis of myelin oligodendrocyte glycoprotein-induced experimental autoimmune encephalomyelitis in the rat identifies a locus controlling demyelination on chromosome 18. Hum Mol Genet 8 : 2183–2190.
42. RothMP, ViratelleC, DolboisL, DelverdierM, BorotN, et al. (1999) A genome-wide search identifies two susceptibility loci for experimental autoimmune encephalomyelitis on rat chromosomes 4 and 10. J Immunol 162 : 1917–1922.
43. DahlmanI, LorentzenJC, de GraafKL, StefferlA, LiningtonC, et al. (1998) Quantitative trait loci disposing for both experimental arthritis and encephalomyelitis in the DA rat; impact on severity of myelin oligodendrocyte glycoprotein-induced experimental autoimmune encephalomyelitis and antibody isotype pattern. Eur J Immunol 28 : 2188–2196.
44. HaywardBE, MoranV, StrainL, BonthronDT (1998) Bidirectional imprinting of a single gene: GNAS1 encodes maternally, paternally, and biallelically derived proteins. Proc Natl Acad Sci U S A 95 : 15475–15480.
45. BarlowDP, StogerR, HerrmannBG, SaitoK, SchweiferN (1991) The mouse insulin-like growth factor type-2 receptor is imprinted and closely linked to the Tme locus. Nature 349 : 84–87.
46. IkushimaH, MunakataY, IshiiT, IwataS, TerashimaM, et al. (2000) Internalization of CD26 by mannose 6-phosphate/insulin-like growth factor II receptor contributes to T cell activation. Proc Natl Acad Sci U S A 97 : 8439–8444.
47. LuediPP, HarteminkAJ, JirtleRL (2005) Genome-wide prediction of imprinted murine genes. Genome Res 15 : 875–884.
48. MoroyT, KhandanpourC (2011) Growth factor independence 1 (Gfi1) as a regulator of lymphocyte development and activation. Semin Immunol 23 : 368–378.
49. Ruiz-HidalgoMJ, GubinaE, TullL, BaladronV, LabordaJ (2002) dlk modulates mitogen-activated protein kinase signaling to allow or prevent differentiation. Exp Cell Res 274 : 178–188.
50. WangY, ZhaoL, SmasC, SulHS (2010) Pref-1 interacts with fibronectin to inhibit adipocyte differentiation. Mol Cell Biol 30 : 3480–3492.
51. MiyaokaY, TanakaM, ImamuraT, TakadaS, MiyajimaA (2010) A novel regulatory mechanism for Fgf18 signaling involving cysteine-rich FGF receptor (Cfr) and delta-like protein (Dlk). Development 137 : 159–167.
52. BraySJ, TakadaS, HarrisonE, ShenSC, Ferguson-SmithAC (2008) The atypical mammalian ligand Delta-like homologue 1 (Dlk1) can regulate Notch signalling in Drosophila. BMC developmental biology 8 : 11.
53. BaladronV, Ruiz-HidalgoMJ, NuedaML, Diaz-GuerraMJ, Garcia-RamirezJJ, et al. (2005) dlk acts as a negative regulator of Notch1 activation through interactions with specific EGF-like repeats. Experimental cell research 303 : 343–359.
54. NuedaML, BaladronV, Sanchez-SolanaB, BallesterosMA, LabordaJ (2007) The EGF-like protein dlk1 inhibits notch signaling and potentiates adipogenesis of mesenchymal cells. Journal of molecular biology 367 : 1281–1293.
55. JurynczykM, SelmajK (2010) Notch: a new player in MS mechanisms. Journal of neuroimmunology 218 : 3–11.
56. MinterLM, TurleyDM, DasP, ShinHM, JoshiI, et al. (2005) Inhibitors of gamma-secretase block in vivo and in vitro T helper type 1 polarization by preventing Notch upregulation of Tbx21. Nature immunology 6 : 680–688.
57. JurynczykM, JurewiczA, BieleckiB, RaineCS, SelmajK (2005) Inhibition of Notch signaling enhances tissue repair in an animal model of multiple sclerosis. Journal of neuroimmunology 170 : 3–10.
58. FerronSR, CharalambousM, RadfordE, McEwenK, WildnerH, et al. (2011) Postnatal loss of Dlk1 imprinting in stem cells and niche astrocytes regulates neurogenesis. Nature 475 : 381–385.
59. GovermanJ (2009) Autoimmune T cell responses in the central nervous system. Nature reviews Immunology 9 : 393–407.
60. AdlerSH, ChiffoleauE, XuL, DaltonNM, BurgJM, et al. (2003) Notch signaling augments T cell responsiveness by enhancing CD25 expression. Journal of immunology 171 : 2896–2903.
61. SadeH, KrishnaS, SarinA (2004) The anti-apoptotic effect of Notch-1 requires p56lck-dependent, Akt/PKB-mediated signaling in T cells. The Journal of biological chemistry 279 : 2937–2944.
62. ThomasM, CalamitoM, SrivastavaB, MaillardI, PearWS, et al. (2007) Notch activity synergizes with B-cell-receptor and CD40 signaling to enhance B-cell activation. Blood 109 : 3342–3350.
63. SantosMA, SarmentoLM, RebeloM, DoceAA, MaillardI, et al. (2007) Notch1 engagement by Delta-like-1 promotes differentiation of B lymphocytes to antibody-secreting cells. Proc Natl Acad Sci U S A 104 : 15454–15459.
64. LanderES (2011) Initial impact of the sequencing of the human genome. Nature 470 : 187–197.
65. Lango AllenH, EstradaK, LettreG, BerndtSI, WeedonMN, et al. (2010) Hundreds of variants clustered in genomic loci and biological pathways affect human height. Nature 467 : 832–838.
66. FrankeA, McGovernDP, BarrettJC, WangK, Radford-SmithGL, et al. (2010) Genome-wide meta-analysis increases to 71 the number of confirmed Crohn's disease susceptibility loci. Nat Genet 42 : 1118–1125.
67. SawcerS, HellenthalG, PirinenM, SpencerCC, PatsopoulosNA, et al. (2011) Genetic risk and a primary role for cell-mediated immune mechanisms in multiple sclerosis. Nature 476 : 214–219.
68. KongA, SteinthorsdottirV, MassonG, ThorleifssonG, SulemP, et al. (2009) Parental origin of sequence variants associated with complex diseases. Nature 462 : 868–874.
69. WallaceC, SmythDJ, Maisuria-ArmerM, WalkerNM, ToddJA, et al. (2010) The imprinted DLK1-MEG3 gene region on chromosome 14q32.2 alters susceptibility to type 1 diabetes. Nat Genet 42 : 68–71.
70. DarvasiA, SollerM (1995) Advanced intercross lines, an experimental population for fine genetic mapping. Genetics 141 : 1199–1207.
71. SimmonsSB, PiersonER, LeeSY, GovermanJM (2013) Modeling the heterogeneity of multiple sclerosis in animals. Trends Immunol 34 : 410–422.
72. AmorS, GroomeN, LiningtonC, MorrisMM, DornmairK, et al. (1994) Identification of epitopes of myelin oligodendrocyte glycoprotein for the induction of experimental allergic encephalomyelitis in SJL and Biozzi AB/H mice. J Immunol 153 : 4349–4356.
73. HaleyCS, KnottSA (1992) A simple regression method for mapping quantitative trait loci in line crosses using flanking markers. Heredity 69 : 315–324.
74. ChurchillGA, DoergeRW (1994) Empirical threshold values for quantitative trait mapping. Genetics 138 : 963–971.
75. JagodicM, OlssonT (2006) Combined-cross analysis of genome-wide linkage scans for experimental autoimmune encephalomyelitis in rat. Genomics 88 : 737–744.
Štítky
Genetika Reprodukční medicínaČlánek vyšel v časopise
PLOS Genetics
2014 Číslo 3
- Kazuistika – Perspektivy využití precizované medicíny v rámci personalizované specifické terapie onkologických pacientů
- Nobelova cena za chemii pro genetické nůžky: Objev, který změní naši budoucnost?
- Technologie na bázi RNA v klinické praxi: od přebarvených petúnií k terapii vzácných a dosud jen obtížně léčitelných chorob u lidí
- „Nepředstavovali jsme si, že náš výzkum povede přímo ke vzniku nových léků, dokonce ještě za našeho života“
- Bezplatné služby pro diagnostiku ATTRv amyloidózy pro kardiology
Nejčtenější v tomto čísle
- Worldwide Patterns of Ancestry, Divergence, and Admixture in Domesticated Cattle
- Genome-Wide DNA Methylation Analysis of Human Pancreatic Islets from Type 2 Diabetic and Non-Diabetic Donors Identifies Candidate Genes That Influence Insulin Secretion
- Genetic Dissection of Photoreceptor Subtype Specification by the Zinc Finger Proteins Elbow and No ocelli
- GC-Rich DNA Elements Enable Replication Origin Activity in the Methylotrophic Yeast
Zvyšte si kvalifikaci online z pohodlí domova
Mazová zátka a její řešení
nový kurzVšechny kurzy