
Genome-Wide DNA Methylation Analysis of Human Pancreatic Islets from Type 2 Diabetic and Non-Diabetic Donors Identifies Candidate Genes That Influence Insulin Secretion
Epigenetic modifications such as DNA methylation are implicated in the development of human disease. However, genome-wide epigenetic analyses in patients with type 2 diabetes (T2D) remain scarce. In this study we aimed to unravel the epigenetic basis of T2D by analyzing DNA methylation of 479,927 CpG sites in human pancreatic islets from T2D and non-diabetic donors. We identified 1,649 CpG sites and 853 genes with differential DNA methylation (fold change 6–59%) in T2D islets. These include reported diabetes loci, such as TCF7L2, FTO and KCNQ1. Furthermore, we found 102 genes that showed both differential DNA methylation and gene expression in T2D islets, including CDKN1A, PDE7B, SEPT9 and EXOC3L2. Finally, we provide functional proof that identified candidate genes directly affect insulin secretion and exocytosis in pancreatic β-cells as well as glucagon secretion in α-cells. Overall, this study provides a detailed map of the methylome in human pancreatic islets and demonstrates that altered DNA methylation in human islets contributes to perturbed hormone secretion and the pathogenesis of T2D.
Published in the journal:
. PLoS Genet 10(3): e32767. doi:10.1371/journal.pgen.1004160
Category:
Research Article
doi:
https://doi.org/10.1371/journal.pgen.1004160
Summary
Epigenetic modifications such as DNA methylation are implicated in the development of human disease. However, genome-wide epigenetic analyses in patients with type 2 diabetes (T2D) remain scarce. In this study we aimed to unravel the epigenetic basis of T2D by analyzing DNA methylation of 479,927 CpG sites in human pancreatic islets from T2D and non-diabetic donors. We identified 1,649 CpG sites and 853 genes with differential DNA methylation (fold change 6–59%) in T2D islets. These include reported diabetes loci, such as TCF7L2, FTO and KCNQ1. Furthermore, we found 102 genes that showed both differential DNA methylation and gene expression in T2D islets, including CDKN1A, PDE7B, SEPT9 and EXOC3L2. Finally, we provide functional proof that identified candidate genes directly affect insulin secretion and exocytosis in pancreatic β-cells as well as glucagon secretion in α-cells. Overall, this study provides a detailed map of the methylome in human pancreatic islets and demonstrates that altered DNA methylation in human islets contributes to perturbed hormone secretion and the pathogenesis of T2D.
Introduction
Type 2 diabetes (T2D) is a complex multifactorial disorder characterized by chronic hyperglycemia due to impaired insulin secretion from pancreatic β-cells, elevated glucagon secretion from pancreatic α-cells and insulin resistance in target tissues. As a result of aging populations and an increasing prevalence of obesity and physical inactivity, the number of patients with T2D has dramatically increased worldwide [1]. Family studies together with genome-wide association studies (GWAS) have shown that the genetic background also influences the risk of T2D [2], [3]. The majority of T2D single nucleotide polymorphisms (SNPs) identified by GWAS are associated with impaired insulin secretion rather than insulin action, pointing to pancreatic islet defects as key mechanisms in the pathogenesis of T2D [3]–[5]. However, the identified SNPs only explain a small proportion of the estimated heritability of T2D, suggesting that additional genetic factors remain to be identified [3]. Genetic variants can interact with environmental factors and thereby modulate the risk for T2D through gene-environment interactions [6]. The interaction between genes and environment may also happen through direct chemical modifications of the genome by so called epigenetic modifications, including DNA methylation and histone modifications [7]. These are known to influence the chromatin structure and DNA accessibility and can thereby regulate gene expression [8], [9]. Epigenetic alterations may subsequently influence phenotype transmission and the development of different diseases, including T2D [7], [10]. Our group has recently found increased DNA methylation in parallel with decreased expression of PPARGC1A, PDX-1 and INS in human pancreatic islets from patients with T2D by using a candidate gene approach [11]–[13]. Another group has analyzed DNA methylation of ∼0.1% of the CpG sites in the human genome in pancreatic islets from five T2D and 11 non-diabetic donors [14]. Animal studies further support the hypothesis that epigenetic modifications in pancreatic islets may lead to altered gene expression, impaired insulin secretion and subsequently diabetes [15]–[17]. Although these studies point towards a key role for epigenetic modifications in the growing incidence of T2D, comprehensive human epigenetic studies, covering most genes and regions in the genome in pancreatic islets from diabetic and non-diabetic donors, are still lacking. Human studies further need to link T2D associated epigenetic modifications with islet gene expression and eventually impaired insulin and/or glucagon secretion. Moreover, the human methylome has previously not been described in human pancreatic islets. In the present study, we analyzed the genome-wide DNA methylation pattern in pancreatic islets from patients with T2D and non-diabetic donors using the Infinium HumanMethylation450 BeadChip, which covers ∼480,000 CpG sites in 21,231 (99%) RefSeq genes. The degree of DNA methylation was further related to the transcriptome in the same set of islets. A number of genes that exhibited both differential DNA methylation and gene expression in human T2D islets were then selected for functional follow up studies; insulin and glucagon secretion were analyzed in clonal β - and α-cells, respectively where selected candidate genes had been either overexpressed or silenced. Also, reporter gene constructs were used to study the direct effect of DNA methylation on the transcriptional activity. Together, our study provides the first detailed map of the human methylome in pancreatic islets and it provides new target genes with altered DNA methylation and expression in human T2D islets that contribute to perturbed insulin and glucagon secretion.
Results
The methylome in human pancreatic islets
To describe the methylome in pancreatic islets and unravel the epigenetic basis of T2D, DNA methylation of a total of 485,577 sites were analyzed in human pancreatic islets from 15 T2D and 34 non-diabetic donors by using the Infinium HumanMethylation450 BeadChip. The characteristics of the islet donors included in the genome-wide analysis of DNA methylation are described in Table 1. T2D donors had higher HbA1c levels, nominally higher BMI and lower glucose-stimulated insulin secretion compared with non-diabetic donors (Table 1). There were no differences in islet purity (P = 0.97; Figure S1A) or β-cell content (P = 0.43; Figure S1B) between T2D and non-diabetic islets.

A stringent quality control procedure was then performed and 2,546 (0.5%) sites were excluded for having a mean detection P-value>0.01 and as a result 483,031 sites generated reliable DNA methylation data and were used for further analysis. These 483,031 sites included 479,927 CpG sites, 3,039 non-CpG sites and 65 SNPs related to 21,231 RefSeq genes. Additional quality control steps were performed and all samples showed high bisulfite conversion efficiency (materials and methods).
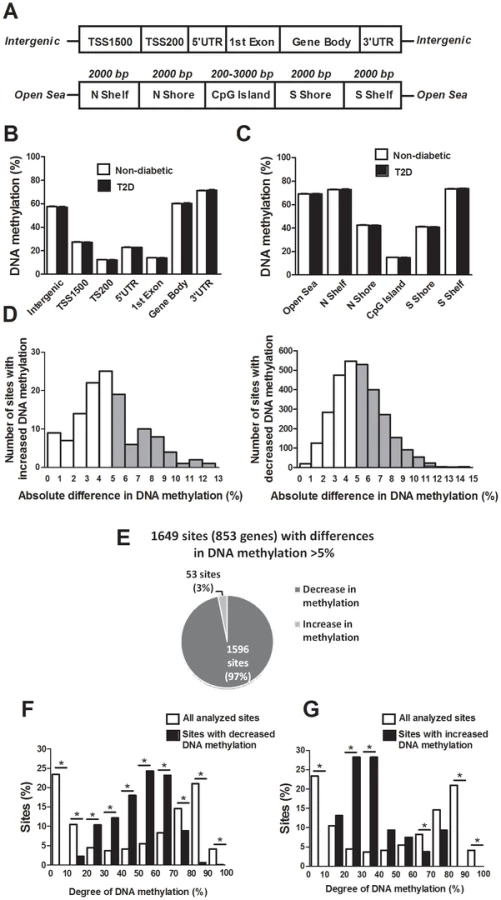
The probes included on the Infinium HumanMethylation450 BeadChip have been annotated based on their relation to the nearest gene and the probes may belong to any of the following genomic elements: TSS1500, TSS200, 5′UTR, 1st exon, gene body, 3′UTR or intergenic regions (Figure 1A). To describe the overall methylome in human pancreatic islets and to test whether there are global differences in DNA methylation in T2D islets, we calculated the average degree of DNA methylation of different genomic elements in T2D and non-diabetic islets. While genomic regions close to the transcription start site showed relatively low degrees of methylation (27.5±1.5% for TSS1500, 12.3±0.06% for TSS200, 23.0±1.2% for 5′UTR and 14.0±0.08% for 1st exon in non-diabetic islets), there was a higher degree of methylation in regions further away from the transcription start site (60.2±1.9% for gene body, 71.3±1.8% for 3′UTR and 57.6±2.0% for intergenic regions) (Figure 1B). The probes on the Infinium HumanMethylation450 BeadChip have also been annotated based on their genomic location relative to CpG islands as shown in Figure 1A, where CpG island shores cover regions 0–2 kb from CpG islands and shelves cover regions 2–4 kb from CpG islands. North and south are used to determine whether the CpG site is upstream or downstream from a CpG island and open sea are isolated CpG sites in the genome. We found that CpG islands are hypomethylated (14.9±0.07%), shelves and open sea are hypermethylated (72.9±1.8% for N shelf, 73.5±1.8% for S shelf and 69.2±1.9% for open sea), while shores show an intermediate degree of methylation (42.5±2.1% for N shore and 41.1±2.0% for S shore) in human islets (Figure 1C). The average degree of DNA methylation for any of the genomic regions did not differ in T2D versus non-diabetic islets (Figure 1B–C).
Differential DNA methylation in human islets from T2D versus non-diabetic donors
We next examined if any individual sites exhibit differential DNA methylation in pancreatic islets from T2D compared with non-diabetic donors. After correcting for multiple testing using a false discovery rate (FDR) analysis we identified 3,116 CpG sites that were differentially methylated between T2D and non-diabetic islets with FDR less than 5% (q<0.05), which means that 156 false positives are expected by chance [18]. The distribution of the absolute differences in DNA methylation between T2D and non-diabetic islets is shown in Figure 1D. To gain biological relevance, we filtered our DNA methylation results requiring absolute differences in methylation ≥5% between T2D and non-diabetic islets. We found 1,649 CpG sites, of which 1,008 are located in or near 853 unique genes and 561 are intergenic, that had absolute differences in methylation ≥5% in T2D versus non-diabetic islets and these were used for all further analyses (Figure 1D and Table S1). When the differences in DNA methylation between diabetic and non-diabetic islets of these 1,649 CpG sites are expressed as fold-change instead of absolute differences, we observe differences in methylation ranging from 6 to 59%. While 1,596 of these 1,649 CpG sites (97%) showed decreased DNA methylation, only 53 sites (3%) showed increased DNA methylation in T2D compared with non-diabetic islets (Figure 1E). The majority of CpG sites showing decreased DNA methylation in T2D versus non-diabetic islets had an intermediate degree of methylation and they were overrepresented among CpG sites with 20–70% methylation (Figure 1F). On the other hand, CpG sites showing increased DNA methylation in T2D versus non-diabetic islets had a lower degree of methylation and they were overrepresented among CpG sites with 20–40% methylation (Figure 1G). Our data suggest that CpG sites with an intermediate degree of DNA methylation are more dynamic to change in human islets.
Chromosomal and genomic distribution of differentially methylated CpG sites in T2D islets
There is an accumulation of genetic variation on certain chromosomes associated with disease [19], [20]. However, it remains unknown if there is an over - or underrepresentation of differential DNA methylation on certain chromosomes linked to diabetes. We therefore determined the chromosomal distribution of the 1,649 sites that exhibit differential DNA methylation in human T2D islets (Figure 2A). Using Chi2 tests, we found that the number of differentially methylated sites were overrepresented on chromosomes 1 and 2, and underrepresented on chromosome 19, in comparison to the chromosomal distribution of all analyzed sites on the Infinium HumanMethylation450 BeadChip. These results are not explained by the distribution of analyzed sites on the array or gene density on the chromosomes.

Previous cancer studies suggest that differential DNA methylation mainly occurs in CpG island shores rather than in CpG islands and promoter regions [21], [22]. However it remains unknown if this is also the case in T2D patients. We therefore evaluated the distribution of differentially methylated sites in T2D versus non-diabetic islets, either based on their relation to the nearest gene and functional genome distribution (Figure 2B) or based on the CpG content and neighbourhood content (Figure 2C). We found that differentially methylated CpG sites were overrepresented in intergenic regions and underrepresented in the TSS200, 1st exon and 3′UTR in comparison to the probe distribution on the Infinium HumanMethylation450 BeadChip (Figure 2B). The distribution of the probes on the Infinium HumanMethylation450 BeadChip as well as the differentially methylated CpG sites in T2D islets in relation to a CpG island is further shown in Figure 2C. We found that ∼60% of the differentially methylated CpG sites in T2D islets are located in the open sea while ∼25% are located in the CpG island shores and only ∼7% are located in CpG islands (Figure 2C). Moreover, differentially methylated CpG sites were overrepresented in the open sea and underrepresented in CpG islands in comparison to the probe distribution on the Infinium HumanMethylation450 BeadChip (Figure 2C).
The Infinium HumanMethylation450 BeadChip covers 16,232 previously known differentially methylated regions (DMRs) that were selected based on the previously described criteria [21], [23]. We found 156 CpG sites with decreased and 4 CpG sites with increased DNA methylation in known DMRs in T2D compared with non-diabetic islets (Table S2), which is more than expected (P<0.001).
Non-CpG methylation in human pancreatic islets
It has previously been established that DNA methylation in differentiated mammalian cells mainly occurs on cytosines in CG dinucleotides [24]. While the Infinium HumanMethylation450 BeadChip mainly analyzes DNA methylation in CpG sites, it also generated methylation data for 3,039 non-CpG sites in the human islets. However, only 1,189 of these non-CpG probes can be mapped with a perfect match to the correct genomic location annotated by Illumina [25] and methylation data of those probes were subsequently used for further analysis. These 1,189 sites were most predominant in the intergenic region, gene body and open sea (Figure. S2A–B). To test if non-CpG sites are methylated in human islets, we calculated the average degree of DNA methylation of the analyzed non-CpG sites. The average degree of methylation of non-CpG sites was 5.9–21.7% in human islets (Figure 2D and Table S3). Out of these non-CpG sites, only two sites were significant after correcting for multiple testing (q<0.05) and none of these sites had an absolute difference in methylation >5% in T2D versus non-diabetic islets.
Biological features of the genes that exhibit differential methylation in T2D islets
We next performed a KEGG pathway analysis to identify biological pathways with enrichment of genes that exhibit differential DNA methylation in T2D versus non-diabetic islets. A total of 853 genes, represented by CpG sites with differential DNA methylation ≥5% in T2D islets (Table S1), were analyzed using WebGestalt. Relevant enriched KEGG pathways in T2D islets include pathways in cancer, axon guidance, MAPK signaling pathway, focal adhesion, ECM-receptor interaction and regulation of actin cytoskeleton (Table 2). We further performed a separate KEGG pathway analysis only including genes that exhibit increased DNA methylation in T2D islets and we then found an enrichment of genes in the complement and coagulation cascades; C4A and C4B (observed number of genes = 2, expected number of genes = 0.13 and Padjusted = 0.0175). We also tested if any of the genes in Table 2 exhibit differential expression in human β - compared with α-cell fractions using published data by Dorrell et al [26]. However, among the genes included in Table 2, there were no significant differences in expression in β - versus α-cells.

Previous GWAS have identified SNPs associated with T2D and/or obesity [3]. These SNPs have been linked to candidate genes, representing genes closest to respective risk SNPs. However, the SNPs identified in GWAS only explain a small proportion of the estimated heritability for T2D, proposing that there are additional genetic factors left to be discovered. These may include genetic factors interacting with epigenetics [27]. We therefore tested if any of 40 T2D candidate genes and 53 obesity genes identified by GWAS were differentially methylated in the human T2D islets [3]. The Infinium HumanMethylation450 BeadChip covers 1,525 CpG sites representing 39 of the T2D candidate genes and 1,473 CpG sites representing all 53 obesity genes. However, one should keep in mind that for a number of these SNPs it still remains unknown if the closest gene is the gene involved in T2D or obesity and if the identified SNP is the functional SNP. Therefore, to cover most regions harboring a genetic variant associated with T2D or obesity, we also investigated the level of DNA methylation for all CpG sites in a region 10 kb up - and downstream of intergenic SNPs associated with T2D (n = 28) and obesity (n = 41) (www.genome.gov/gwastudies. Accessed: March 18, 2013). We identified 44 methylation sites, representing 17 T2D candidate genes and one intergenic SNP that were differentially methylated in T2D versus non-diabetic islets with a FDR less than 5% (q<0.05, Table 3). Twenty-one of these sites, representing ten genes, had absolute differences in methylation >5% in T2D versus non-diabetic islets, which correspond to a fold change ranging from 7 to 28%. Only three sites in three different obesity genes were differentially methylated in T2D islets and one of these sites had an absolute difference in methylation >5% (Table 3).

Finally, based on literature search, genes with known functions in pancreatic islets and/or β-cells [28]–[40] (Figure 2E), the exocytotic process [41]–[44] (Figure 2F) and apoptosis [45] (Figure 2G) were found among the genes that showed differential DNA methylation in T2D islets.
Differential mRNA expression and differential methylation in T2D islets
DNA methylation of certain genomic regions may silence gene transcription [8], [12]. We therefore used microarray mRNA expression data to examine if any of the 853 genes that exhibit differential DNA methylation in T2D islets also exhibit differential mRNA expression in islets from the same donors. We found that 102 of the 853 differentially methylated genes were also differentially expressed in T2D compared with non-diabetic islets (Table S4). While 77 (∼75%) of the differentially expressed genes had an inverse relationship with DNA methylation, e.g. decreased DNA methylation was associated with increased gene expression in T2D islets, 26 (∼25%) had a positive relationship with DNA methylation, e.g. decreased DNA methylation was associated with decreased expression (Figure 3A and Table S4). Figure 3B–C describes the genomic distribution of the differentially methylated CpG sites that are located in/near genes that also exhibit differential expression in T2D islets. Interestingly, there was an overrepresentation of CpG sites in the 5′UTR only when differential DNA methylation and gene expression show an inverse relationship (Figure 3B). In addition, CpG sites in the open sea and northern shore were overrepresented while sites in the CpG islands were underrepresented when DNA methylation and gene expression show an inverse relationship (Figure 3C). These data suggest that differential DNA methylation in certain genomic regions may contribute to an inverse regulation of gene expression. In addition, we found an overrepresentation of differentially methylated CpG sites in the gene body regardless of whether methylation and gene expression show a positive or inverse relationship (Figure 3B), this is known as the DNA methylation paradox which still remains unexplained [46].

Functional analysis of differentially methylated genes
We continued to functionally test if DNA methylation affects gene expression. We selected two genes with differential DNA methylation of multiple CpG sites and in which DNA methylation showed an inverse relationship with gene expression for luciferase experiments (Table S4 and Figure 3D–E). Reporter gene constructs were subsequently produced for CDKN1A and PDE7B. Promoter sequences of the selected genes were inserted into a luciferase expression plasmid that completely lacks CpG dinucleotides. The constructs could thereby be used to study the effect of DNA methylation on luciferase activity in transfection assays. Each construct was mock methylated or methylated with the methyltransferases SssI or HhaI that methylates all CpG sites or the internal cytosine residue in a GCGC sequence only, respectively. SssI methylation thereby results in highly methylated constructs and HhaI methylation gives point methylated constructs in which only a fraction of the CpG sites are methylated. The number of CpG sites that may be methylated by these enzymes in each respective construct is shown in Figure 3F. Clonal β-cells were then transfected with the mock-methylated or methylated constructs. The highest reporter gene expression was generated by the mock-methylated control constructs including the promoter regions (Figure 3F). Furthermore, methylation of the human CDKN1A and PDE7B promoter regions suppressed reporter expression significantly (P<0.05). While methylation of the promoter regions by SssI suppressed reporter gene expression to 28.0±11.8% for CDKN1A and to 22.1±2.9% for PDE7B, point methylation by HhaI suppressed reporter expression to 47.2±7.1% for CDKN1A and to 55.9±9.4 for PDE7B (Figure 3F).
Overexpression of Cdkn1a, Pde7b and Sept9 in clonal β-cells results in impaired insulin secretion
We identified 75 genes that exhibit decreased DNA methylation and increased gene expression in pancreatic islets of T2D compared with non-diabetic donors when performing the genome-wide DNA methylation analysis (Table S4). To model the situation in humans and elucidate the mechanisms whereby these genes may contribute to impaired β-cell function and the development of T2D, we overexpressed three of these genes; Cdkn1a, Pde7b and Sept9, in clonal β-cells (Figure 4A). These genes were selected based on their potential role in diabetes and islet function and because they showed both differential DNA methylation of multiple CpG sites and differential gene expression in T2D islets. Overexpression of Cdkn1a and Pde7b led to a significant decrease in glucose-stimulated insulin secretion in clonal β-cells, while Sept9 had no significant effect (Figure 4B and Figure S3A). Moreover, while the direct response to the membrane-depolarizing agent KCl was unaffected, the fold-change of insulin secretion at KCl-stimulation divided by insulin secretion at low glucose was decreased in clonal β-cells overexpressing Cdkn1a, Pde7b or Sept9 (Figure S3B–C). Cdkn1a (also known as p21) encodes a potent cyclin-dependent kinase inhibitor that regulates cell cycle progression [31] and we therefore tested if overexpression of this gene would affect cell proliferation in clonal β-cells. Indeed increased Cdkn1a levels resulted in decreased β-cell proliferation (Figure 4C). Pde7b encodes a cAMP-specific phosphodiesterase [47] and cAMP potentiates insulin secretion [48]. We next stimulated Pde7b overexpressing cells with glucose in combination with IBMX, a general phosphodiesterase inhibitor. Addition of IBMX normalized glucose-stimulated insulin secretion in Pde7b overexpressing β-cells (Figure 4D) suggesting that the cAMP hydrolyzing activity of Pde7b underlies the secretory defect.

Silencing of Exoc3l in clonal β-cells results in decreased exocytosis
EXOC3L2 is one of the genes that exhibit increased DNA methylation and decreased gene expression in pancreatic islets of T2D compared with non-diabetic donors (Figure 4E and Table S4). The protein encoded by EXOC3L2 is part of the exocyst complex [42] and may consequently affect exocytosis of insulin from pancreatic β-cells. To model the situation in human T2D islets, and to examine if decreased levels of EXOC3L2 affect β-cell exocytosis, Exoc3l was silenced in clonal β-cells using siRNA. This resulted in a 60.7% reduction of Exoc3l levels (Figure 4F). Next, exocytosis was measured as changes in membrane capacitance using the patch-clamp technique. Silencing of Exoc3l resulted in decreased β-cell exocytosis (Figure 4G–H). In particular, the two first depolarizations, representing the rapid first-phase insulin secretion, were decreased in Exoc3l deficient β-cells (Figure 4H). Moreover, the Ca2+ current was unaffected in Exoc3l deficient β-cells (Figure 4I–J), demonstrating a direct effect of Exoc3l on the exocytosis machinery rather than on the Ca2+ current. We also observed decreased voltage dependent Na+ current in Exoc3l deficient β-cells (Figure 4I, K).
Overexpression of Cdkn1a, Pde7b and Sept9 in clonal α-cells results in increased glucagon secretion
As elevated glucagon levels in the fasted state contribute to hyperglycemia in patients with T2D [49], we next tested if selected candidate genes that exhibit decreased DNA methylation and increased expression in pancreatic islets of T2D compared with non-diabetic donors contribute to increased glucagon secretion in pancreatic α-cells (αTC1-6 cells). While overexpression of Cdkn1a and Pde7b resulted in increased glucagon release at 1 mM glucose compared to control transfected α-cells, Sept9 overexpression led to a borderline significant increase in glucagon secretion (Figure S3D and Figure 4L). Additionally, when stimulated with 16.7 mM glucose, Pde7b and Sept9 overexpressing α-cells secreted more glucagon than control transfected cells (Figure 4L).
Technical validation and replication of DNA methylation data in T2D islets
As a technical replication of the Infinium HumanMethylation450 BeadChip data, one islet sample was bisulfite converted and analyzed on the Infinium chips at two different occasions. The correlation for DNA methylation of 100 000 randomly chosen CpG sites on the two chips was then calculated and the methylation data showed a strong positive correlation (R2 = 0.99, P = 2.2×10⁻¹⁶; Figure S4A).
In addition, seven of the CpG sites that exhibit differential DNA methylation in T2D islets were selected for technical validation of the Infinium HumanMethylation450 BeadChip data with pyrosequencing. The CpG sites selected for technical validation include cg21091547 (CDKN1A), cg27306443 (PDE7B), cg19654743 (SEPT9), cg04751089 (IRS1), cg20995304 (HDAC7), cg01649611 (THADA) and cg15572489 (PTPRN2) (Table 4). In agreement with the Infinium HumanMethylation450 BeadChip data, all seven CpG sites showed differential DNA methylation in T2D versus non-diabetic islets when analyzed with pyrosequencing with differences in methylation of a similar magnitude between the two groups (Table 4). Furthermore, the DNA methylation data generated with Infinium HumanMethylation450 BeadChip and pyrosequencing for these seven CpG sites correlated strongly (rho = 0.84–0.94, P≤1.2×10⁻¹³; Table 4 and Figure S4B).

Confirmation of DNA methylation data in human T2D islets
To further validate our results, we tested if any of the CpG sites that exhibit differential DNA methylation in T2D islets of a recent study by Volkmar et al [14], also exhibit differential methylation in T2D islets in our study. While our study analyzed DNA methylation of 479,927 CpG sites distributed across the entire genome and 99% of RefSeq genes, the study by Volkmar et al. only analyzed 27,578 CpG sites distributed mainly in CpG islands in a subset of RefSeq genes and it was therefore only possible to compare some of our studied CpG sites. Nevertheless, our array covers 264 of the 276 CpG sites that exhibit differential DNA methylation in the study by Volkmar et al and 71 of these sites (∼27%) were differentially methylated in our study with P<0.05, which is more than expected by chance (Chi2 = 66.7 and P<0.0001; Table S5). The data by Volkmar et al have not been corrected for multiple testing and it may therefore include false positive results, which may explain the difficulty to replicate some of their results. Yet, the DNA methylation data of the 264 CpG sites analyzed in both studies correlated significantly for both non-diabetic (rho = 0.66, P<0.0001; Figure S5A) and diabetic (rho = 0.68, P<0.0001; Figure S5B) islets.
As an additional control, we compared the results from the present study with our previous studies where we found differential DNA methylation of PPARGC1A, INS and PDX1 in human pancreatic islets of T2D versus non-diabetic donors by using a candidate gene approach [11]–[13]. For PPARGC1A we were unable to compare the methylation data between the two studies as our previous study was based on the average degree of methylation of multiple CpG sites in an analyzed genomic region [11]. We have previously found increased DNA methylation in four CpG sites of the INS gene in human pancreatic islets from T2D compared with non-diabetic donors [13]. Two of these four CpG sites (+63 and −180) were covered by probes on the Infinium HumanMethylation450 BeadChip and in agreement with the results in our previous study these two CpG sites show increased DNA methylation in T2D versus non-diabetic islets also in the present analysis (cg00613255, P = 0.008 and cg25336198, P = 0.003, Figure S5C). In the present study there were 13 additional CpG sites annotated to the INS gene with increased DNA methylation in T2D islets and P<0.05 (Figure S5C). On the other hand, none of the individual CpG sites showing differential methylation in PDX1 in T2D islets in our previous study [12] were covered by probes on the Infinium HumanMethylation450 BeadChip. However, using EpiTYPER, we could validate our previous PDX1 data [12], in the islet samples included in the present study (Figure S5D).
As a final control, we examined the degree of methylation in four known imprinted genes; SNRPN, MEST, KCNQ1 and IGF2. As expected these genes showed approximately 50% methylation in islets from non-diabetic donors (Figure S5E).
Impact of HbA1c, age and BMI on DNA methylation in human pancreatic islets
We then tested if known risk factors for T2D, including hyperglycemia, aging and obesity affect DNA methylation of the 1,649 CpG sites differentially methylated in T2D islets, already in non-diabetic subjects. The impact of HbA1c levels, age and BMI on DNA methylation of these 1,649 CpG sites was examined in pancreatic islets of 87 non-diabetic donors with HbA1c levels, age and BMI spanning between 4.3–6.4%, 26–74 years and 17.6–40.1 kg/m2 respectively (Table S6). HbA1c levels were associated with differential DNA methylation of 142 CpG sites (Table S7). Moreover, age and BMI were associated with differential DNA methylation of 28 and 16 CpG sites, respectively (Tables S8, S9). Interestingly, increased age was associated with decreased methylation of CDKN1A and increased methylation of EXOC3L2 (Tables S8), which is in agreement with the results seen in T2D islets (Figure 3d and Figure 4e). Moreover, ∼92% of the CpG sites that exhibit differential DNA methylation due to increased HbA1c, age or BMI in non-diabetic islets changed in the same direction as methylation in T2D islets. These data suggest that increased HbA1c levels, aging and/or obesity may affect DNA methylation of CpG sites which are differentially methylated in T2D islets already in islets of non-diabetic subjects.
Association between DNA methylation and expression in islets of non-diabetic donors
We also tested if there are significant associations between DNA methylation and gene expression of the 102 genes that exhibit both differential DNA methylation and gene expression in T2D versus non-diabetic islets, already in non-diabetic subjects. A linear regression model was used including batch, age, gender, BMI, HbA1c, islet purity and days of culture as covariates. In islets of the 87 non-diabetic donors, we found significant associations between DNA methylation and gene expression for 55 CpG sites in/near 43 genes (Table S10) out of the 149 CpG sites in/near 102 genes that exhibit both differential DNA methylation and gene expression in T2D versus non-diabetic islets (Table S4). The association between DNA methylation and gene expression for these 43 genes was in the same direction in both the 87 non-diabetic donors as in the T2D versus non-diabetic donors (Table S10 and Table S4). We further tested for associations between DNA methylation and gene expression in non-diabetic islets including all analyzed CpG sites on the Infinium HumanMethylation450 BeadChip in/near the 102 genes that show both differential DNA methylation and gene expression in T2D versus non-diabetic islets. We then found significant associations between DNA methylation and gene expression for 663 CpG sites in/near 57 genes out of the 102 studied genes.
Expression of enzymes that regulate DNA methylation and demethylation
To identify factors that may contribute to differential DNA methylation in human pancreatic islets, we further tested if risk factors for T2D affect islet expression of a number of enzymes which are known to regulate DNA methylation and demethylation in mammals [50]. We found that the islet expression of DNMT3b, which is involved in de novo DNA methylation, correlated negatively with age (rho = −0.25, P = 0.02). In addition, exposure to lipids (1 mM palmitate) for 48 hours in vitro decreased the expression of two methyltransferases, DNMT3a (control islets 111.3±2.3 vs. lipid treated islets 107.7±2.0, P = 0.039, n = 13) and DNMT1 (control islets 182.4±5.0 vs. lipid treated islets 154.6±6.3, P = 0.00005, n = 13), in human pancreatic islets. Lipid exposure also increased islet expression of GADD45A (control islets 489.4±23.7 vs. lipid treated islets 612.8±56.3, P = 0.010, n = 13), which encodes a protein involved in demethylation [50].
DNA methylation in FACS sorted human β - and α-cells
We next compared the DNA methylation pattern in whole human islets (n = 4) with DNA methylation in FACS sorted β - (n = 3) and α-cell (n = 2) fractions of non-diabetic donors. The donors of whole human islets are different from the donors of FACS sorted β - and α-cells. However, the whole islet donors and the donors of FACS sorted β - and α-cells were matched for age and BMI. To describe the overall methylome, we first calculated the average degree of DNA methylation in different genomic elements (Figure 1A) in human islets as well as in FACS sorted β - and α-cells. The global methylation pattern was similar in human islets and in FACS sorted β - and α-cells (Figure 5A–B). In both whole human islets and FACS sorted islet cells, the genomic regions close to the transcription start site showed relatively low degrees of methylation (TSS1500, TSS200, 5′UTR and 1st exon) and there was a higher degree of methylation in regions further away from the transcription start site (gene body, 3′UTR and intergenic regions) (Figure 5A). Also in relation to CpG islands, the global methylation pattern was similar in human islets and in FACS sorted β - and α-cells (Figure 5B). We found that CpG islands were hypomethylated, shelves and open sea were hypermethylated, while shores showed an intermediate degree of methylation in whole human islets as well as in FACS sorted islet cells (Figure 5B). We then tested if any of the 1,649 CpG sites that were differentially methylated in T2D versus non-diabetic islets (Table S1) exhibit a different degree of methylation in whole human islets compared with purified human β-cells. Without correction for multiple testing, 132 of 1,649 CpG sites showed differential DNA methylation in whole islets compared with purified human β-cells at P<0.05, (Table S11). Moreover, among the candidate genes for T2D and obesity shown in Table 3, there was elevated DNA methylation in β-cells compared with human islets for three CpG sites at P<0.05 (cg26979504 in HHEX, cg03257822 in HMGA2 and cg04920032 in FAIM2). However, no differences remained significant after correction for multiple testing.

Discussion
Our study provides a detailed map of the human methylome in pancreatic islets from T2D and non-diabetic donors. We identified 1,649 individual CpG sites and 853 unique genes that exhibit differential DNA methylation, with absolute differences in methylation larger than 5%, representing a fold-change between 6–59%, in diabetic compared with non-diabetic islets. These include genes with previous known functions in pancreatic islets, the exocytosis process and apoptosis [28]–[45]. Recent GWAS have identified SNPs near/in genes that affect the risk for T2D [3]. We found differential DNA methylation of 17 T2D candidate genes, including TCF7L2, THADA, KCNQ1, FTO and IRS1 in T2D islets. Several of these genes affect islet function and insulin secretion [4], [5]. It is possible that epigenetic modifications of T2D candidate genes in combination with genetic variation influence disease susceptibility [27]. Indeed, we have previously shown that ∼50% of SNPs associated with T2D are CpG-SNPs that introduce or delete possible DNA methylations sites [27]. Additionally, these T2D associated CpG-SNPs were associated with altered DNA methylation, gene expression, alternative splicing events and hormone secretion in human islets from non-diabetic donors [27]. Here, we demonstrate for the first time altered DNA methylation patterns of T2D candidate genes in human islets from patients with T2D. Our data propose that genetic and epigenetic mechanisms may interact to affect diabetes susceptibility and they show the importance of not just considering either genetics or epigenetics when dissecting factors that contribute to T2D. Our study also identified enrichments of differentially methylated genes in pathways in cancer, axon guidance, MAPK signaling pathway, focal adhesion and actin cytoskeleton in T2D islets. The significance of our data is supported by recent epidemiological studies that point to a close link between insulin resistance, T2D and cancer [51] as well as studies demonstrating central functions of MAPK signaling in pancreatic islets and diabetes [52]. Moreover, while focal adhesions play an important role in many signaling pathways and affect the ability of cells to interact with the extracellular matrix and respond efficiently to the dynamic microenvironment in age-related disease [53], it has been shown that genes involved in axon guidance, regulation of actin cytoskeleton and complement and coagulation cascades are differentially expressed in T2D patients [54]. Additionally, we found altered DNA methylation of members of the Plexin and Semaphorin families, which play a role in axon guidance and are suggested to control glucose homeostasis via regulating communication between pancreatic β-cells [55]. Some genes with differential DNA methylation in T2D islets e.g. EGF and VEGFA are part of several of the significant KEGG pathways. While EGF is a growth factor important for postnatal expansion of β-cell mass and for the survival of β-cells following stress induced apoptosis [56], VEGFA is responsible for dense islet vascularization and is expressed more in the endocrine than the exocrine part of the pancreas [57].
Hypermethylation of certain genomic regions may lead to suppressed transcription [8]. By combining genome-wide DNA methylation data with transcriptome profiles, we identified 102 genes that exhibit both differential DNA methylation and gene expression in diabetic islets. The majority of these genes showed decreased DNA methylation and increased gene expression in T2D islets. Our functional data further showed that increased DNA methylation of the human CDKN1A and PDE7B promoters decreased the transcriptional activity in clonal β-cells in vitro. However, based on these in vitro experiments it is still difficult to conclude whether altered DNA methylation in vivo has direct effects on gene expression. Moreover, DNA methylation may also regulate alternative splicing events [58] and/or transcription elongation efficiency via alternative promoters [59] when methylation takes place within gene bodies [27]. We found an overrepresentation of differentially methylated CpG sites in the gene body regardless of whether methylation and gene expression show a positive or inverse relationship. This is known as the DNA methylation paradox, which remains unexplained [46]. Interestingly, a recent study suggests a model by which the relationship between gene body DNA methylation and expression is bell shaped and varies depending on the transcriptional activity of the gene, meaning that high levels of gene body methylation are observed in genes with moderate expression levels while low levels of gene body methylation are observed in genes with low and high expression [60]. We also found an overrepresentation of CpG sites located within the open sea and the northern shore showing an inverse relationship between differential DNA methylation and gene expression in human T2D islets. Our data are supported by cancer studies where CpG island shore methylation was strongly related to gene expression [22].
The majority (97%) of the differentially methylated CpG sites showed decreased DNA methylation in diabetic islets. This may be explained by an increased expression and/or activity of proteins controlling demethylation. It could also be explained by a decreased activity/expression of the methyltransferase DNMT1 during cell replication or a decreased activity of DNMT3a and 3b, which are responsible for de novo methylation [50]. Interestingly, we found decreased expression of two methyltransferases and increased expression of GADD45A, which affects demethylation, in human pancreatic islets exposed to lipotoxicity, a risk factor for T2D. Another explanation for hypomethylation may be decreased levels of methyl donors [61].
T2D is a multifactorial polygenic disease and previous GWAS have identified more than 40 SNPs strongly associated with the disease. However, the effect size of these variants is modest and each SNP only explains a small proportion of the heritability for T2D [3]. Identified differences in gene expression of diabetic cases and controls have also been modest, but although alterations in each gene may only contribute with a small biological effect, together multiple changes in specific metabolic pathways are likely to increase the risk for disease [62], [63]. Moreover, in contrast to the big differences in DNA methylation that are found when comparing cancer and normal cells and which is probably due to the presence of an abnormal clone of cells, most of the absolute differences in DNA methylation that have been reported in non-cancer studies are modest in magnitude ranging from 0.13–11% [64]–[66]. In accordance with these studies, we also found that the absolute differences in methylation between the diabetic and non-diabetic islets ranged from 5–15%, which corresponds to a fold change of 6–59%. However, recent studies have shown that modest differences in DNA methylation of individual CpG sites can have big effects on gene expression and that in late onset diseases such as T2D small changes in gene expression may have a big effect on disease over long periods of time [64]. This is further supported by our in vitro experiments, where methylating only 2 or 6 CpG sites, respectively, in 1500 bp regions resulted in a profound decrease in gene activity.
To find support for the role of the identified genes in the pathogenesis of T2D, we manipulated the expression of selected genes in clonal β - and α-cells. Over-expression of Cdkn1a and Pde7b resulted in decreased glucose-stimulated insulin secretion in clonal β-cells. These experimental results are in agreement with our human data, where T2D islets show impaired glucose-stimulated insulin secretion in parallel with increased expression and decreased DNA methylation of CDKN1A and PDE7B. Together, our experimental and human data support a model where diabetes associated epigenetic modifications may lead to altered gene expression and subsequently impaired insulin secretion. CDKN1A, also known as p21, is a well characterized tumor suppressor and a negative regulator of the cell cycle [67]. Dependent on its cellular location, CDKN1A may also affect other cellular processes [31], [67]. However, there is limited information on its role and regulation in pancreatic islets. PDE7B is a cAMP-specific phosphodiesterase that regulates cellular cAMP levels [47]. Although this is the first study showing that PDE7B affects insulin secretion, other members of this family are known to control cAMP and insulin secretion in β-cells [48]. A deficient exocytosis machinery may result in perturbed insulin secretion [41]. Our study demonstrates for the first time that T2D islets exhibit decreased expression and increased DNA methylation of EXOC3L2, a member of the exocyst complex. Our in vitro experiments further show how Exoc3l deficiency results in decreased β-cell exocytosis. Even though the expression changes seen in clonal β-cells in vitro are bigger than the ones identified in human islets in vivo, it is likely that modest expression changes of multiple genes contribute to the disease phenotype in humans. Since both decreased insulin and increased glucagon secretion from pancreatic islets are known to contribute to hyperglycemia in patients with T2D [49], we investigated whether the identified candidate genes also affect glucagon secretion in clonal α-cells. Interestingly, overexpression of Cdkn1a and Pde7b resulted in elevated glucagon secretion at low glucose levels. Together, our functional data propose a model where identified candidate genes may contribute to hyperglycemia in T2D patients by both lowering insulin and increasing glucagon secretion from pancreatic islets.
A previous study analyzed DNA methylation of ∼27,000 CpG sites representing ∼0.1% of the CpG sites in the human genome in pancreatic islets from five T2D and 11 non-diabetic donors [14]. Volkmar et al used an array that mainly covers CpG islands in promoter regions and they found 276 CpG sites with differential DNA methylation with P<0.01 in T2D islets. However, since their data was not corrected for multiple testing, it may include false positives. Yet, we could replicate 71 of the differentially methylated sites identified by Volkmar et al and methylation data from the two islet studies correlated significantly [14]. In the present study, we could also validate data from our previous study where T2D was associated with differential DNA methylation of INS in human islets [13]. Our ability to confirm previous data support that T2D is associated with differential DNA methylation at specific sites. However, it should be noted that we used different bioinformatic and statistical analysis compared to Volkmar et al, e.g. we used quantile normalization and M-values and we analyzed differences in DNA methylation between T2D and non-diabetic islets using a linear regression model including batch, gender, BMI, age, islet purity and days of culture as covariates. Moreover, the array used in our study analyzes DNA methylation genome-wide of ∼480,000 CpG sites, covering most gene regions including promoters, 5′UTR, gene body and 3′UTR in ∼99% of RefSeq genes, as well as intergenic regions [68]. The array also covers CpG islands, shores and shelves as well as the open sea. Interestingly, we found that differentially methylated CpG sites were underrepresented in CpG islands and overrepresented in the open sea, which are isolated CpG sites throughout the genome. It may thereby be difficult to identify differentially methylated CpG sites in T2D islets using an array that mainly covers CpG islands such as the Infinium 27k array.
While some researchers have found a decreased β-cell number and increased α-cell number in human T2D compared with non-diabetic islets, others have not found any differences [69]–[71]. We found no differences in β-cell content in T2D versus non-diabetic islets, nor did Volkmar et al [14], suggesting that the differences seen in DNA methylation are not due to altered β-cell composition in islets from T2D patients. Although it would be of interest to analyze DNA methylation in isolated insulin-producing human β-cells, the sorting of these cells is technically difficult, which results in loss of many cells and in addition, may affect their function [72]. Indeed, there are only a few studies to date that have used isolated human β-cells with a maximum number of 16 donors [12], [13], [73]–[75]. While we and others have found epigenetic differences between human β - and α-cells from a modest number of non-diabetic donors [12], [13], [74], [75], to our knowledge there is no available data showing differential DNA methylation in human β-cells from patients with T2D compared with non-diabetic donors, nor have any studies analyzed gene expression genome-wide in human β - and α-cells from patients with T2D. Here, we analyzed for the first time DNA methylation genome-wide in purified β-and α-cell fractions from non-diabetic human islets donors. The global DNA methylation pattern was similar in purified human β-cells and whole islets. Moreover, for the 1,649 CpG sites showing differential DNA methylation in T2D versus non-diabetic human islets, we could not detect any significant differences in methylation between purified human β-cells and whole islets. Importantly, most of the other islet cell types such as glucagon-producing α-cells, somatostatin-producing δ-cells and pancreatic polypeptide producing PP-cells also have key effects on whole body glucose homeostasis [76]. Differential DNA methylation and gene expression in the majority of islet cells may thereby affect the pathogenesis of T2D and studying epigenetic modifications in whole human pancreatic islets is therefore physiologically warranted. Indeed, our functional studies show effects of candidate genes identified in whole islets in both clonal β - and α-cells. However, future studies should also address if there are epigenetic differences in sorted β - and α-cells from diabetic versus non-diabetic donors.
Interestingly, risk factors for T2D such as hyperglycemia (HbA1c), aging and BMI were associated with differential DNA methylation already in islets of non-diabetic human donors. It is hence possible that differential DNA methylation in islets predisposes to disease. Nevertheless, we cannot rule out that some of the identified epigenetic differences are secondary to disease or epiphenomenon [77]. However, excluding epiphenomenon would require a longitudinal study taking pancreatic biopsies at different time points which is not ethically possible in humans. Nevertheless, previous animal studies support that epigenetic modifications, taking place in pancreatic islets at an early age due to an unfavorable fetal environment, can predispose to diabetes in adult life [15]–[17], [78]. Importantly, Thompson et al found differential DNA methylation of ∼1,400 CpG sites together with altered gene expression in islets of seven week old rats exposed to an intrauterine growth restriction, a model that causes diabetes in elderly rats [78]. Our recent studies further support that altered DNA methylation may play a role in the pathogenesis of T2D as we found positive correlations between HbA1c levels and DNA methylation of INS and PDX-1 in human islets and elevated glucose levels had direct effects on DNA methylation of INS and PDX-1 in clonal β-cells [12], [13]. Additionally, DNA methylation of INS and PDX-1 was increased in islets from T2D patients compared with controls. Also, as epigenetic modifications are tissue specific, using a surrogate tissue like blood is unlikely to give the same result, which has been shown in previous studies [13], [14]. Moreover, our functional data support an important role of identified candidate genes on islet function and in the pathogenesis of T2D.
Recent studies demonstrate that some probes on Illumina's DNA methylation chip can cross-react to multiple locations in the genome [25]. However, none of the 1,649 probes used to detect differential methylation in our study have a perfect match elsewhere in the genome and only 14 probes have a near-perfect match.
Overall, our study identified novel epigenetic modifications in T2D patients that contribute to differential gene expression and perturbed insulin secretion, a key characteristic of T2D. Our genome-wide DNA methylation data can furthermore serve as a reference methylome for human pancreatic islets.
Materials and Methods
Ethics statement
The pancreatic islet donor or her/his relatives had given their consent to donate organs for medical research upon admission to intensive care unit. All procedures were approved by ethics committees at Uppsala and Lund Universities.
Human pancreatic islet donors
Human pancreatic islets from 15 donors with T2D and 34 donors not diagnosed with diabetes were included in the genome-wide analysis of DNA methylation and mRNA expression. Donors were considered to have T2D if they had been diagnosed with the disease prior to their death. Selection criteria for non-diabetic donors were to have an HbA1c below 6.0%. Clinical characteristics of these donors are given in Table 1. Moreover, the impact of HbA1c levels, age and BMI on DNA methylation was studied in pancreatic islets from 87 non-diabetic donors. Their characteristics are given in Table S6. Human pancreatic islets were provided by the Nordic Network for Islet Transplantation, Uppsala University, Sweden.
Sample processing of human islets
Human islets were prepared by collagenase digestion and density gradient purification. Prior to nucleic acid purification, islets were cultured for 2.7±0.15 days as previously described [63]. DNA and RNA were extracted with the All Prep DNA/RNA kit (Qiagen, Hilden, Germany) and purity and concentration were determined by using a nanodrop (NanoDrop Technologies, Wilmington, USA). The purity of the islet preparations was determined by expression of endocrine (somatostatin and glucagon) and exocrine (pancreatic lipase, amylase α2A, chymotrypsin 2) markers and dithizone staining [63]. β-cell content in human islets of donors with available embedded islets (6 T2D and 13 non-diabetic donors) was analyzed using transmission electron microscopy. Hand-picked islets where fixed in 2.5% glutaraldehyde in freshly prepared Millonig and post-fixed in 1% osmium tetroxide before being dehydrated and embedded in AGAR 100 (Oxford Instruments Nordiska, Lidingö, Sweden) and cut into ultrathin sections as described [5]. The sections were put on Cu-grids and contrasted using uranyl acetate and lead citrate. The islet containing sections were examined in a JEM 1230 electron microscope (JEOL-USA. Inc., MA). Micrographs were analyzed for β-cell content with ImageJ and in-house software programmed in Matlab using methods previously described [14], [79]. Islet cell types were distinguished by means of granular appearance: β-cell granules have a dense core surrounded by a white halo and α-cells have small dense granules. The ratio of β-cells in each islet was calculated by division of the total number of β-cells by the sum of the β-cell and α-cell numbers. Furthermore, glucose-stimulated insulin secretion from human pancreatic islets was measured as described [80].
Purification of human β - and α-cell fractions
β - and α-cells were purified from pancreatic islets of three human donors (aged 54, 55 and 74 years old, with BMI 21.5–23.1 kg/m2), different from the donors described in Table 1 and Table S1, by using a method previously described by Parnaud et al [73]. Dissociation of islet cells was achieved by incubation with constant agitation for 3 minutes at 37°C in 0.05% trypsin-EDTA (Invitrogen) supplemented with 3 mg/ml DNAse I (Roche, Mannheim, Germany) followed by vigorous pipetting. Labelling and FACS sorting of the β - and α-cell fractions was performed as previously described [73]. Sorted β - and α-cells were applied to microscope slides and co-immunostained for insulin and glucagon in order to detect the amount of α-cells in the β-cell fraction, and vice versa. Using this method, a cell purity of 89±9% (mean ± SD) was achieved [81]. After DNA isolation using Qiagen DNEasy blood and tissue kit (Qiagen) and ethanol precipitation, DNA for genome-wide methylation profiling was available for β - and α-cell fractions from 3 and 2 donors, respectively.
Genome-wide DNA methylation profiling
Genome-wide DNA methylation profiling of human pancreatic islets and purified human β - and α-cell fractions was performed at the SCIBLU genomics center at Lund University with the Infinium HumanMethylation450 BeadChip (Illumina, Inc., San Diego, CA, USA) which interrogates 482,421 CpG sites, 3091 non-CpG sites and 65 random SNPs and covers 21,231 RefSeq genes [68]. 500 ng DNA from human pancreatic islets was bisulfite converted using the EZ DNA Methylation Kit D5001 (Zymo Research, Orange, CA, USA) according to the manufacturer's instructions. Bisulfite converted DNA was amplified, fragmented and hybridized to the BeadChips following the standard Infinium protocol. T2D islet samples were randomized across the chips and all samples were analyzed on the same machine by the same technician to reduce batch effects. After single base extension and staining, the BeadChips were imaged with the Illumina iScan. Raw fluorescence intensities of the scanned images were extracted with the GenomeStudio (V2011.1) Methylation module (1.9.0) (Illumina). The fluorescence intensity ratio was used to calculate a β-value which corresponds to the methylation score for each analyzed site according to the following equation: β-value = intensity of the Methylated allele (M)/(intensity of the Unmethylated allele (U)+intensity of the Methylated allele (M)+100). DNA methylation β-values range from 0 (completely unmethylated) to 1 (completely methylated). All samples had high bisulfite conversion efficiency (intensity signal >4000) and they were included for further analysis based on GenomeStudio quality control steps where control probes for staining, hybridization, extension and specificity were examined. The intensity of both sample dependent and sample independent built in controls was checked for the red and green channels using GenomeStudio.
We next exported the DNA methylation data from GenomeStudio and used Bioconductor [82] and the lumi package [83] for further analyses. Individual probes were filtered based on their mean detection P-value and those with a P-value>0.01 were excluded from further analysis. As a result, DNA methylation data for 483,031 (99.5%) probes, including 479,927 CpG sites and 3,039 non-CpG sites were used for further analysis. Because M-values are more statistically valid [84], β-values were converted to M-values using the following equation: M = log2 β-value/(1−β-value). M-values were then used for further statistical analysis [84]. In order to correct for background fluorescence the median M-value of the built in negative controls was subtracted from M-values. Next a quantile normalization was performed as described [85]. The Universal Methylated Human DNA standard D5011 (Zymo Research), which is human DNA that has been enzymatically methylated in the CpG sites by M.SssI methyltransferase, was used as a positive control in every batch and it showed high levels of methylation (87.7±0.6%). The low intensity of Y chromosome loci in female samples was used as an additional control. Moreover, one human pancreatic islet sample was run in two different batches on two different days and used as a technical replicate. As the β-value is easier to interpret biologically, M-values were reconverted to β-values when describing the results and creating the figures.
Pathway analysis
The enrichment of KEGG pathways among genes that exhibit differential DNA methylation in T2D compared with non-diabetic islets was tested using WebGestalt (http://bioinfo.vanderbilt.edu/webgestalt, March 2012).
Microarray mRNA expression analysis
mRNA expression of the human pancreatic islets was analyzed using the GeneChip Human Gene 1.0 ST array from Affymetrix (Santa Clara, CA, USA) as previously described [63].
Luciferase assays
1500 bp of the human CDKN1A or PDE7B promoters (sequences are given in Table S12) were inserted into a CpG-free firefly luciferase reporter vector (pCpGL-basic) kindly provided by Dr Klug and Dr Rehli [86]. Amplification of CDKN1A and PDE7B DNA sequences and insertion into the pCpGL-basic vector was done by GenScript (Piscataway, NJ, USA). The constructs were either mock-methylated or methylated using two different DNA methyltransferases; SssI and HhaI (New England Biolabs, Frankfurt am Main, Germany). While SssI methylates all cytosine residues within the double stranded dinucleotide recognition sequence CG, HhaI only methylates the internal cytosine residue in GCGC sequence. INS-1 832/13 β-cells were co-transfected with 100 ng pCpGL-vector either with or without respective insert together with 2 ng of pRL renilla luciferase control reporter vector (pRL-CMV vector, Promega, Madison, USA) as a control for transfection efficiency and luciferase activity was measured as previously described [12].
Overexpression of Cdkn1a, Pde7b and Sept9 in clonal β - and α-cells
INS-1 832/13 β-cells were cultured as previously described [87] and αTC1-6 cells were cultured according to ATCC's instructions (ATCC, Manassas, VA). pcDNA3.1 expression vectors with rat cDNA for either Cdkn1a, Pde7b or Sept9, or the empty vector, were transfected into β - or α-cells with Lipofectamine LTX and Plus Reagent (Life Technologies, Paisley, UK), according to the manufacturer's instructions (sequences for Cdkn1a, Pde7b or Sept9 are given in Table S13). Overexpression was verified with real-time PCR using an ABI 7900 system (Applied Biosystems, Foster City, CA, USA) and a SYBR Green assay for Cdkn1a (fwd-primer: ATGTCCGACCTGTTCCACAC, rev-primer: CAGACGTAGTTGCCCTCCAG) or TaqMan assays (Life Technologies) for Pde7b (Rn00590117_m1) and Sept9 (Rn00582942_m1). Cyclophilin B (Rn03302274_m1 and Mm00478295_m1) was used as an endogenous control. Expression levels were calculated with the ΔΔCt method. Overexpression was also verified by Western Blot analysis and cells transfected with HA-tagged cDNAs for Cdkn1a, Pde7b and Sept9 were lysed in RIPA buffer (50 mM Tris pH 7.6, 150 mM NaCl, 0.1% SDS, 0.5% sodium deoxycholate, 1% Triton×100 and 1× protease inhibitor cocktail (P8340, Sigma-Aldrich, USA) and boiled with 6× sample buffer (60 mM Tris pH 6.8, 10% glycerol, 2% SDS, 10% β-mercaptoethanol and bromophenol blue). Samples were separated on gradient Mini-PROTEAN® TGX gels (Bio-Rad, Hercules, CA, USA) and transferred onto Hybond-LFP PVDF membranes (GE Healthcare, Piscataway, NJ, USA). Protein expression was detected with primary antibodies against HA tag (ab9110, Abcam Cambridge, UK) and β-actin (A5441, Sigma-Aldrich) and secondary DyLight 680/800 conjugated anti-mouse and anti-rabbit antibodies (35518 and 35571, Thermo Scientific, Rockford, USA) and blots were scanned in an ODYSSEY (Licor, Lincoln, NE, USA).
Insulin secretion and content
48 hours post transfection of INS-1 832/13 β-cells, insulin secretion with indicated secretagogues was determined during 1 hour static incubations as previously described [87]. Insulin content of cells was determined after acid ethanol extraction of the hormone. Insulin secretion was normalized to total insulin content.
Glucagon secretion
αTC1-6 cells were transfected as described above. 48 hours post transfection clonal α-cells were pre-incubated in HEPES balanced salt solution (HBSS, 114 mM NaCl; 4.7 mM KCl; 1.2 mM KH2PO4; 1.16 mM MgSO4; 20 mM HEPES; 2.5 mM CaCl2; 25.5 mM NaHCO3; 0.2% BSA, pH 7.2) supplemented with 5.5 mM glucose. Secretion was then stimulated in 1 hour static incubation with HBSS supplemented with 1 or 16.7 mM glucose. Secreted glucagon was measured with a glucagon ELISA (Mercodia, Uppsala, Sweden) and normalized to total protein as determined by a BCA assay (Thermo Scientific).
Proliferation assay
INS-1 832/13 β-cells were transfected as described above. 72 hours post transfection the β-cells were washed with PBS and stained with 0.1% crystal violet in 0.15 M NaCl. Cells were then washed with water and allowed to dry. Methanol was added to wells and absorbance measured at 600 nm in an Infinite M200 plate reader (Tecan, Männerdorf, Switzerland).
RNA interference
INS-1 832/13 β-cells were transfected with Lipofectamine RNAiMAX (LifeTechnologies) according to the manufacturer's instructions with siRNA targeting Exoc3l (LifeTechnologies, ID: s146127) or negative control siRNA (5′-GAGACCCUAUCCGUGAUUAUU-3′). Following 24 hours incubation, cells were transferred onto Petri dishes and cultured another 24 hours. Exoc3l knock-down was verified with real-time PCR using an ABI 7900 system and assays for Exoc3l (Rn01432027_m1) and endogenous controls (Cyclophilin B, Rn03302274_m1 and Hprt, Rn01527840_m1) (Life Technologies).
Electrophysiological measurements of exocytosis using the patch-clamp technique
Electrophysiological measurements of exocytosis were performed on INS-1 832/13 β-cells as described [88].
Analysis of DNA methylation of selected genomic regions
Pyrosequencing was used to technically validate the Infinium HumanMethylation450 BeadChip DNA methylation data. EpiTect Bisulfite Kit (Qiagen) was used for bisulfite conversion of human islet DNA. Primers were designed using the PyroMark Assay design Software 2.0 (Qiagen). Sequences are included in Table S14. Bisulfite converted DNA was amplified with the PyroMark PCR kit. Pyrosequencing was performed with PyroMark ID 96 and PyroMark Gold Q96 reagents (Qiagen) according to the manufacturer's instructions. Data were analyzed with the PyroMark Q96 2.5.7 software program.
Sequenom's MassARRAY EpiTYPER protocol (Sequenom, San Diego, CA, USA) was used to measure DNA methylation of PDX1 in its distal promoter and enhancer regions according to our previous study [12].
Statistical analysis
A principle component analysis was performed to examine batch effects and other possible sources of variation on the DNA methylation data. To identify differences in DNA methylation and mRNA expression between T2D and non-diabetic islets a linear regression model was used including batch, gender, BMI, age, islet purity and days of culture as covariates and DNA methylation or mRNA expression as quantitative variables. A false discovery rate (FDR) analysis was used to correct for multiple testing [18], [89], [90]. Chi2 tests were used to compare the expected number of probes on the Infinium HumanMethylation450 BeadChip with observed number of differentially methylated probes in T2D islets.
Supporting Information
Zdroje
1. ChenL, MaglianoDJ, ZimmetPZ (2012) The worldwide epidemiology of type 2 diabetes mellitus–present and future perspectives. Nat Rev Endocrinol 8 : 228–236.
2. KobberlingJ, TillilH (1990) Genetic and nutritional factors in the etiology and pathogenesis of diabetes mellitus. World Rev Nutr Diet 63 : 102–115.
3. McCarthyM (2010) Genomics, Type 2 Diabetes, and Obesity. The New England Journal of Medicine 363 : 2339–2350.
4. RuchatSM, ElksCE, LoosRJ, VohlMC, WeisnagelSJ, et al. (2009) Association between insulin secretion, insulin sensitivity and type 2 diabetes susceptibility variants identified in genome-wide association studies. Acta Diabetol 46 : 217–226.
5. RosengrenAH, BraunM, MahdiT, AnderssonSA, TraversME, et al. (2012) Reduced insulin exocytosis in human pancreatic beta-cells with gene variants linked to type 2 diabetes. Diabetes 61 : 1726–1733.
6. FranksPW (2011) Gene x environment interactions in type 2 diabetes. Curr Diab Rep 11 : 552–561.
7. LingC, GroopL (2009) Epigenetics: a molecular link between environmental factors and type 2 diabetes. Diabetes 58 : 2718–2725.
8. BirdA (2007) Perceptions of epigenetics. Nature 447 : 396–398.
9. WeberM, HellmannI, StadlerMB, RamosL, PaaboS, et al. (2007) Distribution, silencing potential and evolutionary impact of promoter DNA methylation in the human genome. Nat Genet 39 : 457–466.
10. NitertMD, DayehT, VolkovP, ElgzyriT, HallE, et al. (2012) Impact of an exercise intervention on DNA methylation in skeletal muscle from first-degree relatives of patients with type 2 diabetes. Diabetes 61 : 3322–3332.
11. LingC, Del GuerraS, LupiR, RonnT, GranhallC, et al. (2008) Epigenetic regulation of PPARGC1A in human type 2 diabetic islets and effect on insulin secretion. Diabetologia 51 : 615–622.
12. YangBT, DayehTA, VolkovPA, KirkpatrickCL, MalmgrenS, et al. (2012) Increased DNA methylation and decreased expression of PDX-1 in pancreatic islets from patients with type 2 diabetes. Mol Endocrinol 26 : 1203–1212.
13. YangBT, DayehTA, KirkpatrickCL, TaneeraJ, KumarR, et al. (2011) Insulin promoter DNA methylation correlates negatively with insulin gene expression and positively with HbA(1c) levels in human pancreatic islets. Diabetologia 54 : 360–367.
14. VolkmarM, DedeurwaerderS, CunhaDA, NdlovuMN, DefranceM, et al. (2012) DNA methylation profiling identifies epigenetic dysregulation in pancreatic islets from type 2 diabetic patients. EMBO J 31 : 1405–1426.
15. ParkJH, StoffersDA, NichollsRD, SimmonsRA (2008) Development of type 2 diabetes following intrauterine growth retardation in rats is associated with progressive epigenetic silencing of Pdx1. J Clin Invest 118 : 2316–2324.
16. SandoviciISNH, Dekker-NitertM, Ackers-JohnsonM, JonesRH, O'NeillLP, MarquezVE, CairnsWJ, TadayyonM, LingC, ConstânciaM, OzanneSE (2011) Dynamic epigenetic regulation by early-diet and aging of the type 2 diabetes susceptibility gene Hnf4a in pancreatic islets. Proc Natl Acad Sci U S A 108 : 5449–5454.
17. PinneySE, Jaeckle SantosLJ, HanY, StoffersDA, SimmonsRA (2011) Exendin-4 increases histone acetylase activity and reverses epigenetic modifications that silence Pdx1 in the intrauterine growth retarded rat. Diabetologia 54 : 2606–2614.
18. StoreyJD, TibshiraniR (2003) Statistical significance for genomewide studies. Proc Natl Acad Sci U S A 100 : 9440–9445.
19. PociotF, AkolkarB, ConcannonP, ErlichHA, JulierC, et al. (2010) Genetics of type 1 diabetes: what's next? Diabetes 59 : 1561–1571.
20. LindgrenCM, MahtaniMM, WidenE, McCarthyMI, DalyMJ, et al. (2002) Genomewide search for type 2 diabetes mellitus susceptibility loci in Finnish families: the Botnia study. Am J Hum Genet 70 : 509–516.
21. DoiA, ParkIH, WenB, MurakamiP, AryeeMJ, et al. (2009) Differential methylation of tissue - and cancer-specific CpG island shores distinguishes human induced pluripotent stem cells, embryonic stem cells and fibroblasts. Nat Genet 41 : 1350–1353.
22. IrizarryRA, Ladd-AcostaC, WenB, WuZ, MontanoC, et al. (2009) The human colon cancer methylome shows similar hypo - and hypermethylation at conserved tissue-specific CpG island shores. Nat Genet 41 : 178–186.
23. RakyanVK, DownTA, ThorneNP, FlicekP, KuleshaE, et al. (2008) An integrated resource for genome-wide identification and analysis of human tissue-specific differentially methylated regions (tDMRs). Genome Res 18 : 1518–1529.
24. ListerR, PelizzolaM, DowenRH, HawkinsRD, HonG, et al. (2009) Human DNA methylomes at base resolution show widespread epigenomic differences. Nature 462 : 315–322.
25. ChenYA, LemireM, ChoufaniS, ButcherDT, GrafodatskayaD, et al. (2013) Discovery of cross-reactive probes and polymorphic CpGs in the Illumina Infinium HumanMethylation450 microarray. Epigenetics 8 : 203–9.
26. DorrellC, SchugJ, LinCF, CanadayPS, FoxAJ, et al. (2011) Transcriptomes of the major human pancreatic cell types. Diabetologia 54 : 2832–2844.
27. DayehTA, OlssonAH, VolkovP, AlmgrenP, RonnT, et al. (2013) Identification of CpG-SNPs associated with type 2 diabetes and differential DNA methylation in human pancreatic islets. Diabetologia 56 : 1036–46.
28. KitaguchiT, OyaM, WadaY, TsuboiT, MiyawakiA (2013) Extracellular Calcium influx activates Adenylate Cyclase 1 and potentiates Insulin secretion in MIN6 cells. Biochem J 450 : 365–73.
29. HuaH, ZhangYQ, DabernatS, KritzikM, DietzD, et al. (2006) BMP4 regulates pancreatic progenitor cell expansion through Id2. J Biol Chem 281 : 13574–13580.
30. OsterhoffM, MohligM, SchwanstecherM, SeufertJ, OrtmannJ, et al. (2003) Ca2+/calmodulin-dependent protein kinase II delta2 regulates gene expression of insulin in INS-1 rat insulinoma cells. Cell Calcium 33 : 175–184.
31. MiyatsukaT, KosakaY, KimH, GermanMS (2011) Neurogenin3 inhibits proliferation in endocrine progenitors by inducing Cdkn1a. Proc Natl Acad Sci U S A 108 : 185–190.
32. AhrenB (2009) Islet G protein-coupled receptors as potential targets for treatment of type 2 diabetes. Nat Rev Drug Discov 8 : 369–385.
33. CoutoFM, MinnAH, Pise-MasisonCA, RadonovichM, BradyJN, et al. (2007) Exenatide blocks JAK1-STAT1 in pancreatic beta cells. Metabolism 56 : 915–918.
34. BarbosaH, BordinS, StoppigliaL, SilvaK, BorelliM, et al. (2006) Islet Neogenesis Associated Protein (INGAP) modulates gene expression in cultured neonatal rat islets. Regul Pept 136 : 78–84.
35. AmmendrupA, MaillardA, NielsenK, Aabenhus AndersenN, SerupP, et al. (2000) The c-Jun amino-terminal kinase pathway is preferentially activated by interleukin-1 and controls apoptosis in differentiating pancreatic beta-cells. Diabetes 49 : 1468–1476.
36. CaiT, HiraiH, ZhangG, ZhangM, TakahashiN, et al. (2011) Deletion of Ia-2 and/or Ia-2beta in mice decreases insulin secretion by reducing the number of dense core vesicles. Diabetologia 54 : 2347–2357.
37. SouzaF, SimpsonN, RaffoA, SaxenaC, MaffeiA, et al. (2006) Longitudinal noninvasive PET-based beta cell mass estimates in a spontaneous diabetes rat model. J Clin Invest 116 : 1506–1513.
38. BaiL, ZhangX, GhishanFK (2003) Characterization of vesicular glutamate transporter in pancreatic alpha - and beta -cells and its regulation by glucose. Am J Physiol Gastrointest Liver Physiol 284: G808–814.
39. LinHM, LeeJH, YadavH, KamarajuAK, LiuE, et al. (2009) Transforming growth factor-beta/Smad3 signaling regulates insulin gene transcription and pancreatic islet beta-cell function. J Biol Chem 284 : 12246–12257.
40. MysoreTB, ShinkelTA, CollinsJ, SalvarisEJ, FisicaroN, et al. (2005) Overexpression of glutathione peroxidase with two isoforms of superoxide dismutase protects mouse islets from oxidative injury and improves islet graft function. Diabetes 54 : 2109–2116.
41. AnderssonSA, OlssonAH, EsguerraJL, HeimannE, LadenvallC, et al. (2012) Reduced insulin secretion correlates with decreased expression of exocytotic genes in pancreatic islets from patients with type 2 diabetes. Mol Cell Endocrinol 364 : 36–45.
42. BarkeforsI, FuchsPF, HeldinJ, BergstromT, Forsberg-NilssonK, et al. (2011) Exocyst complex component 3-like 2 (EXOC3L2) associates with the exocyst complex and mediates directional migration of endothelial cells. J Biol Chem 286 : 24189–24199.
43. RorsmanP, BraunM, ZhangQ (2012) Regulation of calcium in pancreatic alpha - and beta-cells in health and disease. Cell Calcium 51 : 300–308.
44. DraegerA, MonastyrskayaK, BabiychukEB (2011) Plasma membrane repair and cellular damage control: the annexin survival kit. Biochem Pharmacol 81 : 703–712.
45. SankariSL, MasthanKM, BabuNA, BhattacharjeeT, ElumalaiM (2012) Apoptosis in cancer–an update. Asian Pac J Cancer Prev 13 : 4873–4878.
46. JonesPA (2012) Functions of DNA methylation: islands, start sites, gene bodies and beyond. Nat Rev Genet 13 : 484–492.
47. GardnerC, RobasN, CawkillD, FidockM (2000) Cloning and characterization of the human and mouse PDE7B, a novel cAMP-specific cyclic nucleotide phosphodiesterase. Biochem Biophys Res Commun 272 : 186–192.
48. FurmanB, OngWK, PyneNJ (2010) Cyclic AMP signaling in pancreatic islets. Adv Exp Med Biol 654 : 281–304.
49. DunningBE, GerichJE (2007) The role of alpha-cell dysregulation in fasting and postprandial hyperglycemia in type 2 diabetes and therapeutic implications. Endocr Rev 28 : 253–283.
50. ChenZX, RiggsAD (2011) DNA methylation and demethylation in mammals. J Biol Chem 286 : 18347–18353.
51. ArcidiaconoB, IiritanoS, NoceraA, PossidenteK, NevoloMT, et al. (2012) Insulin resistance and cancer risk: an overview of the pathogenetic mechanisms. Exp Diabetes Res 2012 : 789174.
52. NgSF, LinRC, LaybuttDR, BarresR, OwensJA, et al. (2010) Chronic high-fat diet in fathers programs beta-cell dysfunction in female rat offspring. Nature 467 : 963–966.
53. WolfsonM, BudovskyA, TacutuR, FraifeldV (2009) The signaling hubs at the crossroad of longevity and age-related disease networks. Int J Biochem Cell Biol 41 : 516–520.
54. DasUN, RaoAA (2007) Gene expression profile in obesity and type 2 diabetes mellitus. Lipids Health Dis 6 : 35.
55. ZielonkaM, XiaJ, FriedelRH, OffermannsS, WorzfeldT (2010) A systematic expression analysis implicates Plexin-B2 and its ligand Sema4C in the regulation of the vascular and endocrine system. Exp Cell Res 316 : 2477–2486.
56. WangH, GambosovaK, CooperZA, HollowayMP, KassaiA, et al. (2010) EGF regulates survivin stability through the Raf-1/ERK pathway in insulin-secreting pancreatic beta-cells. BMC Mol Biol 11 : 66.
57. ZanoneMM, FavaroE, CamussiG (2008) From endothelial to beta cells: insights into pancreatic islet microendothelium. Curr Diabetes Rev 4 : 1–9.
58. ShuklaS, KavakE, GregoryM, ImashimizuM, ShutinoskiB, et al. (2011) CTCF-promoted RNA polymerase II pausing links DNA methylation to splicing. Nature 479 : 74–79.
59. MaunakeaAK, NagarajanRP, BilenkyM, BallingerTJ, D'SouzaC, et al. (2010) Conserved role of intragenic DNA methylation in regulating alternative promoters. Nature 466 : 253–257.
60. JjingoD, ConleyAB, YiSV, LunyakVV, JordanIK (2012) On the presence and role of human gene-body DNA methylation. Oncotarget 3 : 462–474.
61. ZhouSS, ZhouYM, LiD, LunYZ (2011) Dietary methyl-consuming compounds and metabolic syndrome. Hypertens Res 34 : 1239–1245.
62. MoothaVK, LindgrenCM, ErikssonKF, SubramanianA, SihagS, et al. (2003) PGC-1alpha-responsive genes involved in oxidative phosphorylation are coordinately downregulated in human diabetes. Nat Genet 34 : 267–273.
63. OlssonAH, YangBT, HallE, TaneeraJ, SalehiA, et al. (2011) Decreased expression of genes involved in oxidative phosphorylation in human pancreatic islets from patients with type 2 diabetes. Eur J Endocrinol 165 : 589–595.
64. ToperoffG, AranD, KarkJD, RosenbergM, DubnikovT, et al. (2012) Genome-wide survey reveals predisposing diabetes type 2-related DNA methylation variations in human peripheral blood. Hum Mol Genet 21 : 371–383.
65. Ribel-MadsenR, FragaMF, JacobsenS, Bork-JensenJ, LaraE, et al. (2012) Genome-wide analysis of DNA methylation differences in muscle and fat from monozygotic twins discordant for type 2 diabetes. PLoS One 7: e51302.
66. RakyanVK, BeyanH, DownTA, HawaMI, MaslauS, et al. (2011) Identification of type 1 diabetes-associated DNA methylation variable positions that precede disease diagnosis. PLoS Genet 7: e1002300.
67. RomanovVS, PospelovVA, PospelovaTV (2012) Cyclin-dependent kinase inhibitor p21(Waf1): contemporary view on its role in senescence and oncogenesis. Biochemistry (Mosc) 77 : 575–584.
68. BibikovaM, BarnesB, TsanC, HoV, KlotzleB, et al. (2011) High density DNA methylation array with single CpG site resolution. Genomics 98 : 288–295.
69. ButlerAE, JansonJ, Bonner-WeirS, RitzelR, RizzaRA, et al. (2003) Beta-cell deficit and increased beta-cell apoptosis in humans with type 2 diabetes. Diabetes 52 : 102–110.
70. ClarkA, JonesLC, de KoningE, HansenBC, MatthewsDR (2001) Decreased insulin secretion in type 2 diabetes: a problem of cellular mass or function? Diabetes 50 Suppl 1: S169–171.
71. HenquinJC, RahierJ (2011) Pancreatic alpha cell mass in European subjects with type 2 diabetes. Diabetologia 54 : 1720–1725.
72. TaiJH, SunH, LiuW, MellingCW, HasiloC, et al. (2008) Isolating human islets of Langerhans causes loss of decay accelerating factor (CD55) on beta-cells. Cell Transplant 17 : 1349–1359.
73. ParnaudG, BoscoD, BerneyT, PattouF, Kerr-ConteJ, et al. (2008) Proliferation of sorted human and rat beta cells. Diabetologia 51 : 91–100.
74. HallE, DayehT, KirkpatrickCL, WollheimCB, Dekker NitertM, et al. (2013) DNA methylation of the glucagon-like peptide 1 receptor (GLP1R) in human pancreatic islets. BMC Med Genet 14 : 76.
75. BramswigNC, EverettLJ, SchugJ, DorrellC, LiuC, et al. (2013) Epigenomic plasticity enables human pancreatic alpha to beta cell reprogramming. J Clin Invest 123 : 1275–1284.
76. WoodsSC, LutzTA, GearyN, LanghansW (2006) Pancreatic signals controlling food intake; insulin, glucagon and amylin. Philos Trans R Soc Lond B Biol Sci 361 : 1219–1235.
77. RakyanVK, DownTA, BaldingDJ, BeckS (2011) Epigenome-wide association studies for common human diseases. Nat Rev Genet 12 : 529–541.
78. ThompsonRF, FazzariMJ, NiuH, BarzilaiN, SimmonsRA, et al. (2010) Experimental intrauterine growth restriction induces alterations in DNA methylation and gene expression in pancreatic islets of rats. J Biol Chem 285 : 15111–15118.
79. VikmanJ, Jimenez-FeltstromJ, NymanP, ThelinJ, EliassonL (2009) Insulin secretion is highly sensitive to desorption of plasma membrane cholesterol. FASEB J 23 : 58–67.
80. RosengrenAH, JokubkaR, TojjarD, GranhallC, HanssonO, et al. (2010) Overexpression of alpha2A-adrenergic receptors contributes to type 2 diabetes. Science 327 : 217–220.
81. KirkpatrickCL, MarchettiP, PurrelloF, PiroS, BuglianiM, et al. (2010) Type 2 diabetes susceptibility gene expression in normal or diabetic sorted human alpha and beta cells: correlations with age or BMI of islet donors. PLoS One 5: e11053.
82. GentlemanRC, CareyVJ, BatesDM, BolstadB, DettlingM, et al. (2004) Bioconductor: open software development for computational biology and bioinformatics. Genome Biol 5: R80.
83. DuP, KibbeWA, LinSM (2008) lumi: a pipeline for processing Illumina microarray. Bioinformatics 24 : 1547–1548.
84. DuP, ZhangX, HuangCC, JafariN, KibbeWA, et al. (2010) Comparison of Beta-value and M-value methods for quantifying methylation levels by microarray analysis. BMC Bioinformatics 11 : 587.
85. BolstadBM, IrizarryRA, AstrandM, SpeedTP (2003) A comparison of normalization methods for high density oligonucleotide array data based on variance and bias. Bioinformatics 19 : 185–193.
86. KlugM, RehliM (2006) Functional analysis of promoter CpG methylation using a CpG-free luciferase reporter vector. Epigenetics 1 : 127–130.
87. HohmeierHE, MulderH, ChenG, Henkel-RiegerR, PrentkiM, et al. (2000) Isolation of INS-1-derived cell lines with robust ATP-sensitive K+ channel-dependent and -independent glucose-stimulated insulin secretion. Diabetes 49 : 424–430.
88. De MarinisYZ, SalehiA, WardCE, ZhangQ, AbdulkaderF, et al. (2010) GLP-1 inhibits and adrenaline stimulates glucagon release by differential modulation of N - and L-type Ca2+ channel-dependent exocytosis. Cell Metab 11 : 543–553.
89. BenjaminiY, HochbergY (1995) Controlling the False Discovery Rate - a Practical and Powerful Approach to Multiple Testing. Journal of the Royal Statistical Society Series B-Methodological 57 : 289–300.
90. BenjaminiY, YekutieliD (2005) Quantitative trait Loci analysis using the false discovery rate. Genetics 171 : 783–790.
Štítky
Genetika Reprodukční medicínaČlánek vyšel v časopise
PLOS Genetics
2014 Číslo 3
- Kazuistika – Perspektivy využití precizované medicíny v rámci personalizované specifické terapie onkologických pacientů
- Nobelova cena za chemii pro genetické nůžky: Objev, který změní naši budoucnost?
- Technologie na bázi RNA v klinické praxi: od přebarvených petúnií k terapii vzácných a dosud jen obtížně léčitelných chorob u lidí
- „Nepředstavovali jsme si, že náš výzkum povede přímo ke vzniku nových léků, dokonce ještě za našeho života“
- Bezplatné služby pro diagnostiku ATTRv amyloidózy pro kardiology
Nejčtenější v tomto čísle
- Worldwide Patterns of Ancestry, Divergence, and Admixture in Domesticated Cattle
- Genome-Wide DNA Methylation Analysis of Human Pancreatic Islets from Type 2 Diabetic and Non-Diabetic Donors Identifies Candidate Genes That Influence Insulin Secretion
- Genetic Dissection of Photoreceptor Subtype Specification by the Zinc Finger Proteins Elbow and No ocelli
- GC-Rich DNA Elements Enable Replication Origin Activity in the Methylotrophic Yeast
Zvyšte si kvalifikaci online z pohodlí domova
Mazová zátka a její řešení
nový kurzVšechny kurzy