
Genetic Basis of Metabolome Variation in Yeast
Many traits, from human height to E. coli growth rate, quantitatively vary across members of a species. Among the most medically and agriculturally important traits are levels of cellular metabolites, such as cholesterol levels in humans or starch in food crops. Metabolic variation in yeast also holds practical importance with some Saccharomyces strains better suited to making ethanol for biofuel and others tailored to making flavorful wine. This metabolic heterogeneity can be used to gain insight into general principles of metabolic regulation which effect metabolite abundance in eukaryotes. To this end, we examined inter-strain differences in metabolism in over 100 closely related S. cerevisiae strains. We identified over 50 genetic loci that control the levels of specific metabolites, including not only loci that encode metabolic enzymes, but also those that encode global cellular regulators. For example, differences in the sequence of ira2, an inhibitor of Ras, lead to differences in central carbon metabolite levels, and polymorphisms in slt2, a poorly characterized MAP kinase, alter levels of sulfur-containing metabolites. These findings provide insights into the mechanisms cells use to control metabolite concentrations.
Published in the journal:
. PLoS Genet 10(3): e32767. doi:10.1371/journal.pgen.1004142
Category:
Research Article
doi:
https://doi.org/10.1371/journal.pgen.1004142
Summary
Many traits, from human height to E. coli growth rate, quantitatively vary across members of a species. Among the most medically and agriculturally important traits are levels of cellular metabolites, such as cholesterol levels in humans or starch in food crops. Metabolic variation in yeast also holds practical importance with some Saccharomyces strains better suited to making ethanol for biofuel and others tailored to making flavorful wine. This metabolic heterogeneity can be used to gain insight into general principles of metabolic regulation which effect metabolite abundance in eukaryotes. To this end, we examined inter-strain differences in metabolism in over 100 closely related S. cerevisiae strains. We identified over 50 genetic loci that control the levels of specific metabolites, including not only loci that encode metabolic enzymes, but also those that encode global cellular regulators. For example, differences in the sequence of ira2, an inhibitor of Ras, lead to differences in central carbon metabolite levels, and polymorphisms in slt2, a poorly characterized MAP kinase, alter levels of sulfur-containing metabolites. These findings provide insights into the mechanisms cells use to control metabolite concentrations.
Introduction
Inter-individual differences in metabolism are of substantial biological importance. In humans, they underlie susceptibility to type II diabetes [1], obesity [2] and Crohn's disease [3], while in yeast, they contribute to the flavor profile of wine [4] and to the efficiency of ethanol generation [5], [6]. Accordingly, there has been growing interest in identifying the genetic loci responsible for inter-individual metabolome differences.
Over the past decade, the relationship between the metabolome and the genome has been increasingly studied, most thoroughly in the plant community [7]–[10]. Initial investigations followed metabolomic alterations in response to gene knockouts [8], [11]–[14], and this analysis has proven valuable for annotating gene functions [15]. Of late, decoding metabolic variation due to natural perturbations using quantitative genetics [16] has garnered increasing interest. Quantitative trait locus (QTL) studies have been performed on enzyme activities and metabolite concentrations in plants with greatest success for secondary metabolites [17]–[25]. Association of metabolite abundance variation with unsuspected genetic determinants has demonstrated the potential of metabolite QTL (mQTL) analysis for identifying genes with previously unknown enzymatic roles [17].
Metabolomic methods have been applied to determine how levels of metabolites are associated with gene segregation across intercrosses of mice, A. thaliana and yeast [26]–[28]. This has demonstrated that there is substantial genetic variation in primary and secondary metabolites, and this variation is governed by the segregation of relatively few mQTL hot spots [27], [28] whose epistatic interaction further shapes the metabolome [27]. These mQTL hot spots generally coincide with known eQTL hot spots, highlighting the extensive pleiotropy of these regions. While these studies have been able to associate regions of the genome with metabolic alterations, the residual unexplained heritability of these studies can be extensive, raising important questions about the power and reproducibility of QTL and mQTL analysis. Furthermore, the resolution of 100–200 F2 intercrosses is limited and identifying genetic associations has typically entailed identifying a locus of interest and reporting on the proximity to pathway-related enzymes, without searching rigorously for other linked genes that might play a regulatory role.
With the goal of discovering potential novel regulators of primary metabolism, we examined 74 metabolites involved in highly conserved core metabolic pathways of central carbon metabolism and nucleotide and amino acid biosynthesis. We found 52 significant linkages and experimentally verified the genes underlying three major linkage hot spots, including two linked genes responsible for altering S-adenosyl-methionine levels, neither with known metabolic roles. Additionally, we compared our metabolite results with the expression QTL results for the same cross [29] and discovered six overlapping hot spots. The largest mQTL hot spot is shared with the largest hot spot in the transcript data, and is caused by polymorphisms in a global regulator of cell signaling, ira2. Interestingly, while the expression QTLs linked to ira2 were enriched for central metabolic enzymes, the variant of ira2 that promoted high metabolite concentrations favored low enzyme transcript levels. This dichotomy can be explained because ira2-linked transcripts are primarily involved in oxidative metabolism, while linked metabolites are mainly associated with fermentation. These findings reveal the utility of mQTL analysis for identifying metabolic regulatory mechanisms.
Results
To identify genetic loci responsible for inter-individual differences in the metabolome, we used a well-studied cross between a laboratory strain of yeast, BY4716, and a vineyard isolate, RM11-1a (hereafter referred to as BY and RM, respectively). These strains have both been sequenced, and they differ at 0.6% of base pairs [30]. Over 100 segregants from the cross have been densely genotyped and used in studies of the genetic basis of variation in protein and transcript levels [29]–[32] and a number of other phenotypes [33], [34].
Intracellular metabolites were harvested from yeast growing exponentially on aerobic, glucose-containing minimal medium by direct quenching and extraction in cold organic solvent [35]. The samples were then analyzed using two complementary targeted LC-MS/MS methods, one in positive ion mode and the other in negative ion mode [36]. Each method provides three-fold confirmation of metabolite identity based on parent ion mass, gas-phase fragmentation to a characteristic daughter ion, and LC retention time match to authenticated metabolite standard. We collected measurements from 13 independent replicates of the BY strain, 18 independent replicates of the RM strain, and two independent samples from each of 114 segregants. 105 compounds were reliably detected in at least one parent strain, and 79 of these were significantly different between the two strains at a false discovery rate (FDR) of 5% [37]. 74 of the 105 known compounds were measured in at least one-quarter of the segregants, and these 74 compounds were used for linkage analysis.
Many of these compound's levels show patterns of inheritance consistent with a complex underlying genetic basis. Based on the methods described for transcripts in Brem et. al. 2005 [32], we determined that 14 compounds showed transgressive segregation (the range in the segregants significantly exceeded that spanned by the parent strains) and 28 showed directional genetics (most segregants had levels intermediate between the parent strains). The observation of genetic complexity for most metabolite levels is concordant with what has been observed for other traits in this cross.
Linkage analysis
We tested for linkage with R/qtl [38] and used permutations to establish that a LOD score of 3.4 corresponded to an empirical FDR of 10%. Of the 74 compounds tested, 34 showed at least one significant linkage (metabolite quantitative trait locus or mQTL; Table S1). The majority of these compounds (21 of 34) had one mQTL, 9 had two mQTLs, three had three mQTLs and one had four mQTLs, for a total of 52 detected mQTLs. Almost all the compounds for which mQTLs were detected differed significantly between the parental strains at an FDR of 5% (29 of 34). For 24 compounds that differed significantly between the parental strains, we did not detect mQTLs, most likely due to complex underlying genetics, with multiple loci of small effect. All compounds found to have significant mQTLs were primarily intracellular (as levels in biological samples were much greater than in media).
The mQTLs were not uniformly distributed along the genome; rather, most fell within 8 “hot spots” with 3 or more compounds linking to each (Figures 1 and 2, Materials and Methods). To improve the power and thoroughness of this analysis (as well as a subsequent analysis of heritability and mQTL effect size), 42 ion peaks (20 mQTLs) with a defined but unknown structural identity, were included. The observation of such hot spots, previously seen for other classes of traits, implies the presence of underlying polymorphisms with broad effects on the metabolome.


Transcriptome and metabolome variation
We compared the metabolite linkage results with those for transcript abundance in the same cross [29]. Transcript linkages also cluster in hot spots, and the hot spots for metabolites and transcripts show a significant overlap in location, with six of eight metabolite hot spots also corresponding with transcript hot spots (p 0.0001, based on permutation test) (Figure 2). Two metabolite hot spots did not have a corresponding eQTL hot spot: m8 on chromosome XVI (linked to levels of ribose-phosphate, aspartate and glutamate) and hot spot m5 on chromosome VIII (linked to levels of S-adenosyl-homocysteine, S-adenosyl-methionine, and thiamine). The absence of eQTL hot spots at these locations could be explained by underlying variants with effects on metabolism but not on transcript abundance, or by false negatives in the eQTL hot spot results, which could arise from variants with effects on only a few transcripts. Hot spot m5 is especially interesting since regulation of the methionine cycle is poorly understood in eukaryotes despite being implicated in cardiovascular disease [39], [40]. It will be discussed in greater depth below.
Metabolic genes in confidence intervals
To determine whether changes in metabolites tend to be linked to genes with known roles in metabolism, we carried out functional enrichment analysis of genes located in mQTL confidence intervals. Genes were classified as “metabolic” based on inclusion in the iMM904 metabolism model [41]. The mQTL confidence intervals were found to be modestly but significantly enriched for metabolic genes. 471 out of a total of 904 metabolic genes in the yeast genome partially or completely overlapped with an mQTL 95% confidence interval. This is far greater than would be expected by chance, based upon permutation analysis (Figure S1; p 0.001). Each mQTL confidence interval was also examined specifically for the presence of metabolic genes in the same pathway as the linked metabolite (Table S2). Over half (31/52) of the confidence intervals were found to contain at least one metabolic gene from one of the pathways involving the linked metabolite.
The ura3 hot spot
Levels of five metabolites linked to a hot spot on chromosome V: orotate, orotidine, orotidine-5′-phosphate, UDP-D-glucose, and UDP-N-acetyl-glucosamine. All five are intermediates or products of pyrimidine biosynthesis (Figure 3). Ura3, a pyrimidine biosynthesis gene which carries an engineered deletion in the RM strain, is contained within the hot spot and lies within the 95% mQTL confidence intervals for all five compounds (Figure S2). Compounds upstream of ura3 in the pathway show the greatest differences in abundance (as much as 128-fold), and particularly strong linkages (Figure 3). To confirm that this mQTL hot spot was governed by segregation of the engineered ura3 deletion, ura3, this RM allele was inserted into a BY background and metabolomic differences between BY and BYura3 were assessed. Using a two-tailed t-test, two compounds were found to differ between these two conditions at a 0.05 FDR. These two compounds, orotate and orotidine-5′phosphate, are both associated with this mQTL hot spot; the deletion resulted in a 16 and 43-fold increase in their accumulation respectively. These results demonstrate that our approach can link changes in metabolite levels to a polymorphism (in this case, an engineered one) in a gene known to participate in the biosynthesis of the relevant metabolites.

Slt2 and erc1 polymorphisms impact S-adenosyl-methionine levels
The mQTL hot spot on chromosome VIII (m5) is linked to levels of three metabolites: thiamine, S-adenosyl-methionine (SAM), and S-adenosyl-homocysteine (SAH) (Table S1). The overlap among 95% confidence intervals of the mQTLs for these compounds covers a region containing all or part of 14 genes (Figure S3). None of the genes in this region have a known connection with the sulfur-assimilation pathway. We identified slt2 as a candidate for further evaluation due to the presence of a two amino acid indel polymorphism between BY and RM in a polyglutamine track; variation in the number of glutamines in this track has previously been implicated in stress response [42].
Segregants inheriting the RM allele of slt2 had significantly higher levels of SAM and SAH (Figure 4). To test the allelic effect of slt2, we created allele-replacement strains in both parental backgrounds and compared metabolite levels to those in the parent strains (Figure 5). In the BY background, the RM allele of slt2 did not raise SAH levels above the limit of detection, nor did it result in a significant change for SAM (p = 0.1598). However, in the RM background, the BY allele of slt2 resulted in a three-fold decrease for both SAM and SAH (Figure 5; p 0.001). The difference in the effects of the allele swaps in the two backgrounds implies an interaction between the allelic status of slt2 and other loci.

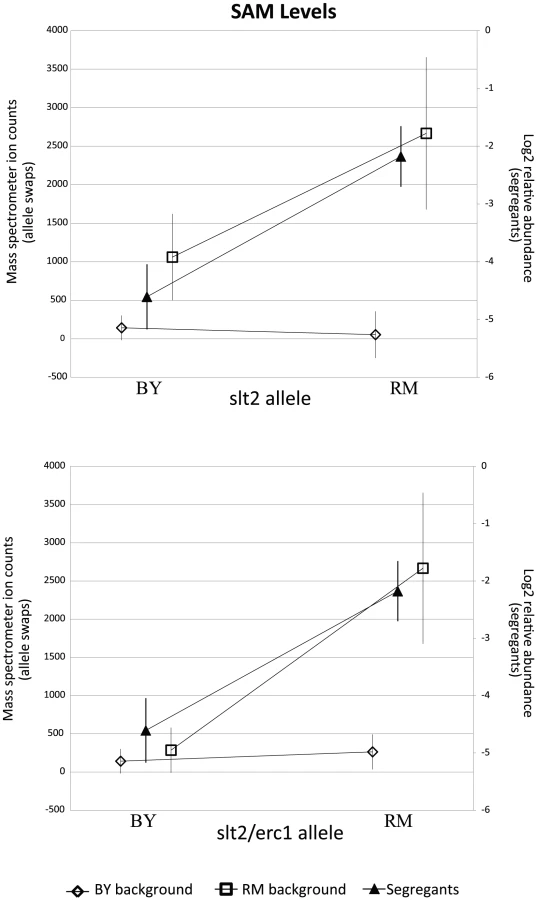
We considered the possibility that the effect of this locus is due to polymorphisms in multiple linked genes. We investigated a nearby gene, erc1, due to the presence of an indel polymorphism that causes a frameshift which alters 37 residues and extends the peptide by 43 amino acids in the RM background. Erc1 has also been shown to have an effect on SAM levels when overexpressed in saké strains of S. cerevisiae [43]–[45]. Erc1 is located 3 kb (approximately 1 cM) from slt2, and thus the alleles of the two genes segregate together as a haplotype. We used the slt2 allele replacement strains to create strains in which both genes were replaced with the alternative alleles. In the BY background, replacing both slt2 and erc1 with the RM alleles led to a significant increase in SAM (p = 0.019) compared to the original BY strain, but the level of SAM was still much lower than in RM (Figure 5). In the RM background, replacing both genes with the BY alleles led to significantly lower levels of both metabolites compared to either the original RM strain or to the slt2 replacement alone (p 0.001 for all comparisons). These results suggest that polymorphisms in both slt2 and erc1 alter the levels of SAM-cycle compounds in these strains, with other undetected loci also playing a role in the observed variation.
Ira2 polymorphisms alter central metabolites
A mQTL hot spot on chromosome XV (m6) is linked to five central carbon metabolites: glucose-6-phosphate (G6P) and its isomers (which were not distinguished by the LC-MS method used here), fructose-1,6-bisphosphate (FBP), sedoheptulose 7-phosphate (S7P), dihydroxyacetone phosphate (DHAP), and (iso)citrate. The overlap among the 95% confidence intervals of the mQTL for each compound covers a region containing all or part of 13 genes (Figure S4). We focused on ira2 as a candidate gene because it has a known function as a regulator of the Ras/PKA pathway [46], a known effector of glycolytic flux [47], and because we previously showed that polymorphisms in ira2 underlie a major eQTL hot spot (t16) at the same locus in this cross [29], [48]. Ira2 is a Ras-related GTPase [46], [49], [50], with ira2-catalyzed GTP hydrolysis leading to inactivation of Ras. The eQTL expression patterns suggested that ira2 is hypoactive in the BY strain.
Segregants that inherit the BY allele of ira2 showed higher levels of all five linked metabolites than those that inherit the RM allele (Figure 6). To test the allelic effect of ira2, we compared metabolite levels of ira2 allele-replacement strains in both backgrounds [29] to the original parent strains (for FBP, see Figure 7; for other metabolites, see Figure S5). In the RM background, the BY allele of ira2 led to significantly higher levels of three compounds (p 0.01 for sedoheptulose-7-phosphate, FBP, DHAP). In the BY background, the RM allele of ira2 led to significantly lower levels of all five metabolites (p 0.05). These results demonstrate that polymorphisms in ira2 contribute to the observed variation in these five central metabolites.


Metabolites can accumulate due to either increased production or decreased consumption. To distinguish whether the BY allele of ira2 was enhancing central carbon metabolic flux versus inhibiting metabolite consumption, we analyzed glucose uptake in the BY and RM parent strains, as well as in ira2 allele-replacement strains in both backgrounds. Glucose uptake rate did not differ significantly between the two parental strains. In the two allele-replacement strains, however, glucose uptake diverged markedly. In the RM background, the BY allele of ira2 led to 45% faster glucose uptake, whereas in the BY background, the RM allele led to a 20% decrease (Figure 7). The main fermentative product of glucose is ethanol, so the rate of ethanol excretion in ira2 allele-swap strains was measured using 1H NMR. In either background, the BY allele of ira2 led to a significant increases in ethanol excretion (p 0.05). These results demonstrate that polymorphisms in ira2 control central carbon metabolic flux, with the BY allele inducing both higher metabolite levels and fluxes. In the parental strains, the metabolic flux impact of the ira2 polymorphism is presumably offset by differences at other loci.
Because polymorphisms in ira2 result in differences in expression of 1300 genes [29], we considered whether expression differences in central carbon metabolism genes might underlie the observed metabolic changes. Of 70 known central carbon metabolism genes (i.e., those with roles in glycolysis, pentose phosphate pathway, citric acid cycle, and oxidative phosphorylation from yeastgenome.org), 32 genes' expression linked to the ira2 locus in glucose media (Table S3). This significantly exceeds the number of linkages expected for a random set of genes (p 0.01, Fischer's exact test). Remarkably, of the 32 linked genes, 28 are less highly expressed in the BY strain, which has higher levels of G6P, FBP, S7P, DHAP, and (iso)citrate. Thus, paradoxically, the BY allele of ira2 promotes higher central carbon metabolite levels while repressing central carbon metabolism gene expression.
Insight into this paradox is provided by the nature of the regulated genes: 28 of the 32 central carbon metabolism genes that link to ira2 tend to be more highly expressed in ethanol than in glucose [29]; i.e., the primary transcriptional regulatory role of ira2 seems to be in enhancing expression of genes required for respiratory growth. In contrast, with the exception of (iso)citrate, the linked metabolites are indicative of active fermentation. The accumulation of (iso)citrate in the BY strain is consistent with the lower expression of the primary isocitrate consuming enzyme (idh1) from the BY allele of ira2. Taken together with the data showing that the BY allele of ira2 promotes glucose fermentation, one obtains a coherent view: ira2 activity is lower in the BY strain. This leads to decreased expression of genes required for respiration, more need for fermentative ATP production, and higher levels of the glycolytic intermediates G6P, FBP, and DHAP.
Heritability of metabolite levels
We can only relate metabolite abundance variation to genetic heterogeneity across segregants when there is substantial genetic variation affecting metabolite levels in the first place. Previous estimates of broad-sense heritability [51] in A. thaliana have suggested moderate heritability of metabolite traits across globally-distributed strains [20], while segregants showed substantially lower heritability of metabolite traits than expression traits (an average of 25% and 65% respectively) [27], [52]. We found extensive heritable variation of metabolite abundance in this study, with an average broad-sense heritability of 62%. This indicates that there are likely larger metabolic differences segregating between BY & RM than within the Bay Sha A. thaliana cross. Greater levels of heritability across metabolites are associated with an increased number of detected mQTLs (p = 0.014); this is evident in Figure 8, which shows linkage numbers as a function of heritability. The effects of these QTLs can be seen by determining the fraction of the variance in metabolite abundance that is explained using QTL genotypes (Figure 9). Effect sizes and the total fraction of heritability explained vary greatly across metabolites, with some mQTLs explaining the vast majority of genetic variation, others collectively explaining a sizable portion through the joint additive effects of multiple loci and others still explaining little of the total variance. The large fraction of unexplained metabolite abundance heritability could be owing to two factors: insufficient power to detect multiple loci of small effect, or the non-additive interaction between loci [27], [53].


Discussion
We used high-throughput metabolite phenotyping in a cross of two divergent strains of yeast to find 52 linkages for 34 metabolites. We have detected linkages for a majority of compounds with significant differences between parental strains, as well as for a few compounds without such differences. Many metabolites show transgressive segregation, with levels in progeny strains outside the range of the parents; the parental strains likely carry alleles with opposing effects, with some segregants that inherit combinations of alleles that result in extreme metabolite levels, as has been observed for transcript levels [32]. Such opposing effects in the parent strains were also evident in control of glycolytic flux, which is similar in the parental strains, but diverges upon an ira2 allele swap.
Ira2 is a regulator of cell signaling, not metabolism per se. Nevertheless, allelic differences in ira2 have a broad impact on central carbon metabolism at the level of transcripts, metabolites and flux. The hypoactive variant of ira2 found in the BY strain is associated with decreased expression of oxidative metabolism transcripts, higher levels of citrate, glycolytic intermediates, and sedoheptulose-7-phosphate, as well as higher glycolytic flux. These observations are consistent with active ira2 inducing oxidative metabolic genes, which in turn decrease the glycolytic flux required to fulfill ATP production. This raises the intriguing possibility that, due to the efficiency of oxidative ATP production, the extent of residual oxidative phosphorylation during yeast fermentative growth is a major determinant of glycolytic flux. More direct inhibition of glycolysis by the BY variant of ira2, e.g., through inhibition of phosphofructokinase-2, is also a possibility.
Perhaps the most exciting use of yeast mQTL mapping is to discover novel regulators of metabolism. In this respect, we have found linkages between levels of SAM and SAH and two proteins, slt2 and erc1, with no previously known metabolic regulatory role. These two proteins interestingly segregate as a complex haplotype. SAM and SAH are key metabolites from the perspective of epigenetics; they are substrates and products, respectively, in DNA and histone methylation. Through epigenetics or other mechanisms, SAM and SAH may impact a broad range of diseases, e.g., of the cardiovascular system [39], [40], liver [54], or brain [55]–[57]. Slt2 is part of a MAP kinase cascade responsible for maintaining cell wall integrity, and thus contributing to fitness during osmotic stress. Erc1 was identified for conferring ethionine resistance [42]–[45], [58]–[60]. While SAM and SAH (as well as a thiamine, which also links to the same locus), are notable for containing sulfur, neither slt2 nor erc1 is regulated transcriptionally in response to sulfur availability [61], [62]. Both sulfur metabolites and slt2 have been associated with the cell cycle (in the case of slt2, via the cell cycle transcription factors swi4 and swi6) [63]–[67]. The molecular mechanism by which slt2 and erc1 polymorphisms regulate SAM and SAH levels remains, however, to be elucidated. The discovery of the underlying mechanisms, may in turn, inform the overall interplay between metabolism, epigenetics, and the cycle cell. Thus, mQTL analysis provides a powerful tool for integrative systems biology.
The BY RM cross utilized in this work has been previously used to characterize metabolite abundance variation with quantitative NMR in Zhu et al. 2012 [28]. While the designs of these studies are very similar, the use of LC-MS in our study, as well as different experimental procedures, resulted in substantial differences in the observed mQTL hot spots, allowing us to expand upon and provide an alternative explanation for the basis of some of these controlling regions. Of the 56 metabolites reported in our study, 27 were also quantified in Zhu et al., and of the 16 metabolites for which Zhu detected significant linkage, 12 were shared between the two studies.
Three hot spots are shared between these two studies: those which we have shown are due to variation in ura3, slt2/erc1, and ira2. In Zhu et al., the ura3 auxotrophy was implicated through its linkage with orotate and dihydroorotate elevation; we have confirmed these effects both statistically and through direct experimental manipulation of ura3, and also expanded them to other metabolites in the pathway. In both studies, SAM and SAH were linked to the slt2/erc1 locus, but Zhu et al. did not discuss this hot spot, and they did not identify or propose underlying genes. Zhu et al. also mapped the abundance of glycerol, lysine, tyrosine and trehalose to the region containing ira2 and pmh7. They concluded that variation in pmh7 was the causal source of these metabolic alterations, but this conclusion was based on a weak knockout phenotype, rather than on an allele replacement. Of these metabolites, we were only able to quantify lysine, which was not linked to this region in our study. It is therefore difficult to determine whether ira2 and phm7 function as a complex locus, similar to slt2/erc1, with both genes playing a role in variation of the same or different sets of metabolites, or whether ira2 is the only gene in the region that influences metabolite variation.
The remaining mQTL hot spots of Zhu et al. were associated with amino acid metabolism and were not observed in our study, perhaps because of differences in growth conditions: synthetic compete medium in Zhu et al. vs. supplemented minimal medium in this study. Such mQTL hot spot dependence on growth conditions would be analogous to gene-environment interaction eQTLs (gxeQTL) previously identified in the BY RM cross [29]. This observation suggests that mQTL analysis under a variety of growth conditions could be an important method for discovering novel metabolic regulatory mechanisms.
Materials and Methods
Culture conditions
We used strains generated from the cross between BY4716 (MAT lys2) and RM11-1a (MATa leu2 ura3); these strains have been extensively studied for a variety of quantitative phenotypes [29]–[34], [68]. Growth medium was comprised of 6.7 g/L Yeast Nitrogen Base (YNB) without amino acids, 2% (w/v) glucose as the sole carbon source, and was supplemented with leucine, lysine and uracil (final concentrations 100 mg/L, 30 mg/L, 20 mg/L respectively) to complement the strain auxotrophies. Yeast were grown in this medium using a filter culture technique that enables rapid sampling of metabolism without perturbation of the cultured cells [35]. In brief, strains were grown aerobically in liquid minimal medium to an 0.1, at which point 5 mL of the culture was transferred by filtration to the surface of an 82 mm, 0.45 m pore size nylon membrane, which was subsequently placed atop a medium-loaded agarose plate as described in Brauer et al. [35]. The filter cultures were grown aerobically to mid-log phase ( in 5 mL wash = 0.2–0.6, for 3–5 hr, approximately 2–4 doublings) before metabolism quenching and metabolome extraction. All growth was at 30C. Cultures were grown in triplicate, with two filters used for metabolite extraction and the third filter for OD measurement.
Metabolite extraction
The cell-loaded filter membrane was quenched by placing it cell-side down in 2 mL of acetonitrile/methanol/water (40∶40∶20) at C. After 15 min, residual cells were rinsed off of the filter and the 2 mL cell-extraction solvent mixture was centrifuged at 13,200 rpm for 5 minutes at 4°C to generate a clear supernatant. 90L of this clear metabolome extract was mixed with 10L of a mixture of isotope-labeled internal standards to yield an analysis-ready sample. Samples were stored at C until analysis, which was completed within 24 h of sample generation.
Metabolome quantitation and pre-analysis
Two different LC separations were coupled by electrospray ionization (ESI) to Thermo TSQ Quantum triple quadrupole mass spectrometers operating in multiple reaction monitoring (MRM) mode. Positive-mode ESI was coupled to hydrophilic interaction chromatography (HILIC) on an aminopropyl column; negative-mode ESI was coupled to reversed-phase chromatography with an amine-based ion pairing agent [69], [70].
Raw LC-MS/MS data from both runs were analyzed using the MAVEN software [71]. The results of this automated analysis were manually verified in all cases. Peak quantitation was based on the average of the top three points in the peak.
For linkage analysis, compounds detected in fewer than 25% of samples were discarded; for the remaining compounds, when signal was not detectable, raw ion counts were floored to 32, which is approximately the lower limit of detection. Duplicate samples of the same strain were averaged and then divided by the associated OD at extraction to normalize for any sample-size differences.
Each day the RM11-1a strain was also run under this method. To correct for inter-day variance in raw signal intensities, log-ratios between segregant and the same-day RM values were used for each compound.
Analysis of metabolome differences between the parental strains
For each compound's abundance data, an ANOVA of the form phenotype strain was performed in R using the aov function to compute p-values. These p-values were then false-discovery-rate corrected to assess statistical significance. Tests for mode of inheritance were conducted according to the formulae laid out in Brem & Kruglyak [32].
Media extraction
To determine which metabolites may appear abundant by virtue of the extraction procedure, we compared metabolite levels from mock extracted cells to the parental strains using a one-tailed t-test and we found six compounds at levels comparable to biological samples. Four of these metabolites were included in the media as vitamins or supplements: leucine/isoleucine, nicotinate (), pantothenate (), and 4-Pyridoxic acid (a catabolite). Two additional metabolites had elevated levels that likely resulted from systematic contamination: deoxyribose-phosphate and D-glucono--lactone-6-phosphate. No QTLs were associated with any of these compounds, so their inclusion should not impact our subsequent analysis.
Segregant linkage analysis
We used genotypes at 2,820 SNP markers that were previously genotyped in individual segregants [32], giving an average spacing between markers of 4.3 kb or 1.5 cM. With over 100 segregants, we would expect to see an average of more than one recombination event between adjacent marker pairs in this cross. Linkage analysis was performed using the qtl package in R [38]. We used the normal model and nonparametric method, assessing significance through the built-in permutation test. We computed 100 permutations of the qtl profile for every metabolite; linkage scores that were in the top 10% of this set were considered significant. This cutoff differs for each metabolite, ranging from a LOD score of 3.14 to 3.58 with an average of 3.35. We calculated confidence intervals using the bayesint function with a probabilit y of 0.95. This is generally considered more conservative than intervals calculated based on a 1.5 LOD drop; secondary peaks on the same chromosome will result in larger intervals.
Allele replacement strains
The allele replacement strains for IRA2, SLT2, and ERC1 were constructed according to methods laid out in Gray et al. [72] and Smith et al. [29]. The strains used were BY4724 (MATa LYS2 URA3), BY4724 , BY , BY , ACY753 (an RM MATa URA3), and RM , RM , RM . Allele swap strains were compared to their parental strain using paired t-tests.
Identification of metabolic genes in confidence intervals
Confidence intervals for each QTL were computed as described above. Using the intervals package in R and the position and name of metabolic genes from Mo et al. [41], we created a dataset of all metabolic genes in the S. cerevisiae genome. The intervals_overlap() command returned how many and which metabolic genes fully or partially overlaped with our confidence intervals. To compute significance for all confidence intervals, we randomly permuted the position of the intervals 10,000 times, each time recording the total number of metabolic genes contained in the intervals.
To look at pathway-specific metabolic genes for each metabolite, we compared the SGD list of genes in all pathways for that metabolite with the list of all metabolic genes in that metabolite's confidence interval (pathway information was downloaded from Yeast Biochemical Database available at Saccharomyces gene database http://www.yeastgenome.org/biocyc on 29 September 2009). For metabolites with multiple linkages, each confidence interval was examined separately.
Comparison between metabolite and transcript datasets
All transcript data was taken from Smith and Kruglyak [29], using only the data for glucose-grown cells.
For comparing linkage location, the genome was broken into 10 kb bins and the peak of each linkage (transcript and metabolite) was assigned to a bin. A bin was considered to have an excess of linkages if the number exceeded the number expected by chance by Poisson distribution. Given the number of metabolite-linkages (52) and bins (1216) we have = 0.0428, and we used a Bonferroni corrected significance (p 4.11*10-5); this resulted in significance for any bin that linked to three or more metabolites. For transcript-linkages = 4.151 and the significant hot spots are defined by have 14 or more linkages. Hot spots in immediately adjacent bins were accepted as part of the same hot spot. When comparing hot spots between the datasets, they were considered shared only if they inhabited the same linkage bin.
Heritability and study reproducibility
For each metabolite, segregants with two quantifiable biological replicates were isolated and the variance within replicates was compared to the total across all samples. This is effectively subtracting the environmental variance from the total phenotypic variance to yield the genetic variance. The ratio of genetic variance to phenotypic variance is the broad sense heritability (equation 1)


The association between the number of QTLs found for a metabolite and the metabolite's heritability was found by modeling the number of detected QTLs as an approximately poisson trait and predicting this value using poisson regression.
Supporting Information
Zdroje
1. BijlsmaS, BobeldijkI, VerheijER, RamakerR (2006) Large-scale human metabolomics studies: a strategy for data (pre-) processing and validation. Analytical Chemistry 78 : 567–574.
2. SladekR, RocheleauG, RungJ, DinaC, ShenL, et al. (2007) A genome-wide association study identifies novel risk loci for type 2 diabetes. Nature 445 : 881–885.
3. MarchesiJR, HolmesE, KhanF, KochharS, ScanlanP, et al. (2007) Rapid and noninvasive metabonomic characterization of inflammatory bowel disease. Journal of proteome research 6 : 546–551.
4. Swiegers JH, Pretorius IS (2005) Yeast Modulation of Wine Flavor. In: Advances in applied microbiology, Elsevier. pp. 131–175.
5. KeaslingJD, ChouH (2008) Metabolic engineering delivers next-generation biofuels. Nature Publishing Group 26 : 298–299.
6. WahlbomCF, Cordero OteroRR, van ZylWH, Hahn-HägerdalB, JönssonLJ (2003) Molecular analysis of a Saccharomyces cerevisiae mutant with improved ability to utilize xylose shows enhanced expression of proteins involved in transport, initial xylose metabolism, and the pentose phosphate pathway. Applied and environmental microbiology 69 : 740–746.
7. FiehnO (2002) Metabolomics–the link between genotypes and phenotypes. Plant molecular biology 48 : 155–171.
8. GoodacreR, VaidyanathanS, DunnWB, HarriganGG, KellDB (2004) Metabolomics by numbers: acquiring and understanding global metabolite data. Trends in biotechnology 22 : 245–252.
9. HallRD (2006) Plant metabolomics: from holistic hope, to hype, to hot topic. The New phytologist 169 : 453–468.
10. SchauerN, FernieAR (2006) Plant metabolomics: towards biological function and mechanism. Trends in plant science 11 : 508–516.
11. AllenJ, DaveyHM, BroadhurstD, HealdJK, RowlandJJ, et al. (2003) High-throughput classification of yeast mutants for functional genomics using metabolic footprinting. Nature Biotechnology 21 : 692–696.
12. BenfeyPN, Mitchell-OldsT (2008) From genotype to phenotype: systems biology meets natural variation. Science 320 : 495–497.
13. Villas-BôasSG, MoxleyJF, AkessonM, StephanopoulosG, NielsenJ (2005) Highthroughput metabolic state analysis: the missing link in integrated functional genomics of yeasts. The Biochemical journal 388 : 669–677.
14. SmedsgaardJ, NielsenJ (2005) Metabolite profiling of fungi and yeast: from phenotype to metabolome by MS and informatics. Journal of experimental botany 56 : 273–286.
15. ClasquinMF, MelamudE, SingerA, GoodingJR, XuX, et al. (2011) Riboneogenesis in yeast. Cell 145 : 969–980.
16. DellaPennaD, LastRL (2008) Genome-enabled approaches shed new light on plant metabolism. Science 320 : 479–481.
17. McMullenMD, ByrnePF, SnookME, WisemanBR, LeeEA, et al. (1998) Quantitative trait loci and metabolic pathways. Proceedings of the National Academy of Sciences of the United States of America 95 : 1996–2000.
18. BostB, DillmannC, de VienneD (1999) Fluxes and metabolic pools as model traits for quantitative genetics. I. The L-shaped distribution of gene effects. Genetics 153 : 2001–2012.
19. Mitchell-OldsT, PedersenD (1998) The molecular basis of quantitative genetic variation in central and secondary metabolism in Arabidopsis. Genetics 149 : 739–747.
20. KeurentjesJJB, FuJ, de VosCHR, LommenA, HallRD, et al. (2006) The genetics of plant metabolism. Nature Genetics 38 : 842–849.
21. LisecJ, MeyerRC, SteinfathM, RedestigH, BecherM, et al. (2008) Identification of metabolic and biomass QTL in Arabidopsis thaliana in a parallel analysis of RIL and IL populations. The Plant journal: for cell and molecular biology 53 : 960–972.
22. BentsinkL, Alonso-BlancoC, VreugdenhilD, TesnierK, GrootSP, et al. (2000) Genetic analysis of seed-soluble oligosaccharides in relation to seed storability of Arabidopsis. Plant physiology 124 : 1595–1604.
23. HobbsDH, FlinthamJE, HillsMJ (2004) Genetic control of storage oil synthesis in seeds of Arabidopsis. Plant physiology 136 : 3341–3349.
24. KliebensteinDJ, GershenzonJ, Mitchell-OldsT (2001) Comparative quantitative trait loci mapping of aliphatic, indolic and benzylic glucosinolate production in Arabidopsis thaliana leaves and seeds. Genetics 159 : 359–370.
25. WentzellAM, RoweHC, HansenBG, TicconiC, HalkierBA, et al. (2007) Linking metabolic QTLs with network and cis-eQTLs controlling biosynthetic pathways. PLoS Genetics 3 : 1687–1701.
26. DumasME, WilderSP, BihoreauMT, BartonRH, FearnsideJF, et al. (2007) Direct quantitative trait locus mapping of mammalian metabolic phenotypes in diabetic and normoglycemic rat models. Nature Genetics 39 : 666–672.
27. RoweHC, HansenBG, HalkierBA (2008) Biochemical networks and epistasis shape the Arabidopsis thaliana metabolome. Plant Cell 20 : 1199–1216.
28. ZhuJ, SovaP, XuQ, DombekKM, XuEY, et al. (2012) Stitching together Multiple Data Dimensions Reveals Interacting Metabolomic and Transcriptomic Networks That Modulate Cell Regulation. PLoS Biology 10: e1001301.
29. SmithEN, KruglyakL (2008) Gene–Environment Interaction in Yeast Gene Expression. PLoS Biology 6 : 810–824.
30. FossEJ, RadulovicD, ShafferSA, RuderferDM, BedalovA, et al. (2007) Genetic basis of proteome variation in yeast. Nature Genetics 39 : 1369–1375.
31. BremRB, StoreyJD, WhittleJ, KruglyakL (2005) Genetic interactions between polymorphisms that affect gene expression in yeast. Nature 436 : 701–703.
32. BremRB, KruglyakL (2005) The landscape of genetic complexity across 5,700 gene expression traits in yeast. Proceedings of the National Academy of Sciences of the United States of America 102 : 1572–1577.
33. PerlsteinEO, RuderferDM, RobertsDC, SchreiberSL, KruglyakL (2007) Genetic basis of individual differences in the response to small-molecule drugs in yeast. Nature Genetics 39 : 496–502.
34. PerlsteinEO, RuderferDM, RamachandranG, HaggartySJ, KruglyakL, et al. (2006) Revealing complex traits with small molecules and naturally recombinant yeast strains. Chemistry & biology 13 : 319–327.
35. BrauerMJ, YuanJ, BennettBD, LuW, KimballE, et al. (2006) Conservation of the metabolomic response to starvation across two divergent microbes. Proceedings of the National Academy of Sciences of the United States of America 103 : 19302–19307.
36. LuW, BennettBD, RabinowitzJD (2008) Analytical strategies for LC-MS-based targeted metabolomics. Journal of chromatography B, Analytical technologies in the biomedical and life sciences 871 : 236–242.
37. StoreyJD, TibshiraniR (2003) Statistical significance for genomewide studies. Proceedings of the National Academy of Sciences of the United States of America 100 : 9440–9445.
38. BromanKW, WuH, SenŚ, ChurchillGA (2003) R/qtl: QTL mapping in experimental crosses. Bioinformatics 19 : 889–890.
39. KampferAJ, BalogEM (2010) S-adenosyl-L-methionine regulation of the cardiac ryanodine receptor involves multiple mechanisms. Biochemistry 49 : 7600–7614.
40. FetrowCW, AvilaJR (2001) Efficacy of the dietary supplement S-adenosyl-Lmethionine. The Annals of pharmacotherapy 35 : 1414–1425.
41. MoML, PalssonBØ, HerrgardMJ (2009) Connecting extracellular metabolomic measurements to intracellular flux states in yeast. BMC Systems Biology 3 : 37.
42. de LlanosR, Herńandez-HaroC, BarrioE, QuerolA, Ferńandez-EspinarMT, et al. (2010) Differences in activation of MAP kinases and variability in the polyglutamine tract of Slt2 in clinical and non-clinical isolates of Saccharomyces cerevisiae. Yeast (Chichester, England) 27 : 549–561.
43. ChoiES, ParkBS, LeeSW, OhMK (2009) Increased production of S-adenosyl-Lmethionine using recombinant Saccharomyces cerevisiae sake K6. Korean Journal of Chemical Engineering 26 : 156–159.
44. LeeSW, ParkBS, ChoiES, OhMK (2010) Overexpression of ethionine resistance gene for maximized production of S-adenosylmethionine in Saccharomyces cerevisiae sake kyokai No. 6. Korean Journal of Chemical Engineering 27 : 587–589.
45. ShiomiN, FukudaH, FukudaY, MurataK (1991) Nucleotide sequence and characterization of a Gene conferring resistance to ethionine in yeast Saccharomyces cerevisiae. Journal of Fermentation and Bioengineering 71 : 211–215.
46. TanakaK, LinBK, WoodDR, TamanoiF (1991) IRA2, an upstream negative regulator of RAS in yeast, is a RAS GTPase-activating protein. Proceedings of the National Academy of Sciences of the United States of America 88 : 468–472.
47. KimJw, DangCV (2006) Cancer's molecular sweet tooth and the Warburg effect. Cancer research 66 : 8927–8930.
48. StoreyJD, AkeyJM, KruglyakL (2005) Multiple locus linkage analysis of genomewide expression in yeast. PLoS Biology 3: e267.
49. ParriniMC, JacquetE, BernardiA, JacquetM, ParmeggianiA (1995) Properties and regulation of the catalytic domain of Ira2p, a Saccharomyces cerevisiae GTPase-activating protein of Ras2p. Biochemistry 34 : 13776–13783.
50. BroachJR (1991) RAS genes in Saccharomyces cerevisiae: signal transduction in search of a pathway. Trends in genetics: TIG 7 : 28–33.
51. Lynch M, Walsh B (1998) Genetics and analysis of quantitative traits. Sinauer Associates, 1 edition.
52. WestMAL, KimK, KliebensteinDJ, van LeeuwenH, MichelmoreRW, et al. (2006) Global eQTL Mapping Reveals the Complex Genetic Architecture of Transcript-Level Variation in Arabidopsis. Genetics 175 : 1441–1450.
53. BloomJS, EhrenreichIM, LooWT, LiteTLV, KruglyakL (2013) Finding the sources of missing heritability in a yeast cross. Nature 494 : 234–237.
54. MatoJM, CorralesFJ, LuSC (2002) AvilaMA (2002) S-Adenosylmethionine: a control switch that regulates liver function. FASEB journal: official publication of the Federation of American Societies for Experimental Biology 16 : 15–26.
55. MischoulonD, FavaM (2002) Role of S-adenosyl-L-methionine in the treatment of depression: a review of the evidence. The American journal of clinical nutrition 76 : 1158S–61S.
56. RèmeCA, DramardV, KernL, HofmansJ, HalsbergheC, et al. (2008) Effect of Sadenosylmethionine tablets on the reduction of age-related mental decline in dogs: a double-blinded, placebo-controlled trial. Veterinary therapeutics: research in applied veterinary medicine 9 : 69–82.
57. FusoA, SeminaraL, CavallaroRA, D'AnselmiF (2005) Sadenosylmethionine/homocysteine cycle alterations modify DNA methylation status with consequent deregulation of PS1 and BACE and beta-amyloid production. Molecular and Cellular Neuroscience 28 : 154–204.
58. Martin-YkenH, DagkessamanskaiaA, BasmajiF, LagorceA, FrancoisJ (2003) The interaction of Slt2 MAP kinase with Knr4 is necessary for signalling through the cell wall integrity pathway in Saccharomyces cerevisiae. Molecular microbiology 49 : 23–35.
59. ChenY, FeldmanDE, DengC, BrownJA, De GiacomoAF, et al. (2005) Identification of mitogen-activated protein kinase signaling pathways that confer resistance to endoplasmic reticulum stress in Saccharomyces cerevisiae. Molecular cancer research: MCR 3 : 669–677.
60. LesageG, BusseyH (2006) Cell wall assembly in Saccharomyces cerevisiae. Microbiology and molecular biology reviews: MMBR 70 : 317–343.
61. BoerVM, de WindeJH, PronkJT, PiperMDW (2003) The Genome-wide Transcriptional Responses of Saccharomyces cerevisiae Grown on Glucose in Aerobic Chemostat Cultures Limited for Carbon, Nitrogen, Phosphorus, or Sulfur. The Journal of biological chemistry 278 : 3265–3274.
62. CavalieriD, TownsendJP, HartlDL (2000) Manifold anomalies in gene expression in a vineyard isolate of Saccharomyces cerevisiae revealed by DNA microarray analysis. Proceedings of the National Academy of Sciences of the United States of America 97 : 12369–12374.
63. MaddenK, SheuYJ, BaetzK, AndrewsB, SnyderM (1997) SBF Cell Cycle Regulator as a Target of the Yeast PKC-MAP Kinase Pathway. Science 275 : 1781–1784.
64. BlankHM, GajjarS, BelyaninA, PolymenisM (2009) Sulfur metabolism actively promotes initiation of cell division in yeast. PloS one 4: e8018.
65. TuBP, KudlickiA, RowickaM, McKnightSL (2005) Logic of the Yeast Metabolic Cycle: Temporal Compartmentalization of Cellular Processes. Science 310 : 1152–1158.
66. TuBP, McKnightSL (2006) Metabolic cycles as an underlying basis of biological oscillations. Nature reviews Molecular cell biology 7 : 696–701.
67. TuBP, MohlerRE, LiuJC, DombekKM, YoungET, et al. (2007) Cyclic changes in metabolic state during the life of a yeast cell. Proceedings of the National Academy of Sciences of the United States of America 104 : 16886–16891.
68. KruglyakL, LanderES (1995) A nonparametric approach for mapping quantitative trait loci. Genetics 139 : 1421–1428.
69. BajadSU, LuW, KimballEH, YuanJ, PetersonC, et al. (2006) Separation and quantitation of water soluble cellular metabolites by hydrophilic interaction chromatographytandem mass spectrometry. Journal of chromatography A 1125 : 76–88.
70. LuoB, GroenkeK, TakorsR, WandreyC, OldigesM (2007) Simultaneous determination of multiple intracellular metabolites in glycolysis, pentose phosphate pathway and tricarboxylic acid cycle by liquid chromatography-mass spectrometry. Journal of chromatography A 1147 : 153–164.
71. MelamudE, VastagL, RabinowitzJD (2010) Metabolomic Analysis and Visualization Engine for LC-MS Data. Analytical Chemistry 82 : 9818–9826.
72. GrayM, PiccirilloS, HonigbergSM (2005) Two-step method for constructing unmarked insertions, deletions and allele substitutions in the yeast genome. FEMS microbiology letters 248 : 31–36.
73. Davison AC, Hinkley DV (1997) Bootstrap Methods and their Application. Cambridge University Press.
Štítky
Genetika Reprodukční medicínaČlánek vyšel v časopise
PLOS Genetics
2014 Číslo 3
- Kazuistika – Perspektivy využití precizované medicíny v rámci personalizované specifické terapie onkologických pacientů
- Nobelova cena za chemii pro genetické nůžky: Objev, který změní naši budoucnost?
- Technologie na bázi RNA v klinické praxi: od přebarvených petúnií k terapii vzácných a dosud jen obtížně léčitelných chorob u lidí
- „Nepředstavovali jsme si, že náš výzkum povede přímo ke vzniku nových léků, dokonce ještě za našeho života“
- Bezplatné služby pro diagnostiku ATTRv amyloidózy pro kardiology
Nejčtenější v tomto čísle
- Worldwide Patterns of Ancestry, Divergence, and Admixture in Domesticated Cattle
- Genome-Wide DNA Methylation Analysis of Human Pancreatic Islets from Type 2 Diabetic and Non-Diabetic Donors Identifies Candidate Genes That Influence Insulin Secretion
- Genetic Dissection of Photoreceptor Subtype Specification by the Zinc Finger Proteins Elbow and No ocelli
- GC-Rich DNA Elements Enable Replication Origin Activity in the Methylotrophic Yeast
Zvyšte si kvalifikaci online z pohodlí domova
Mazová zátka a její řešení
nový kurzVšechny kurzy