
The Tissue-Specific RNA Binding Protein T-STAR Controls Regional Splicing Patterns of Pre-mRNAs in the Brain
The RNA binding protein T-STAR was created following a gene triplication 520–610 million years ago, which also produced its two parologs Sam68 and SLM-1. Here we have created a T-STAR null mouse to identify the endogenous functions of this RNA binding protein. Mice null for T-STAR developed normally and were fertile, surprisingly, given the high expression of T-STAR in the testis and the brain, and the known infertility and pleiotropic defects of Sam68 null mice. Using a transcriptome-wide search for splicing targets in the adult brain, we identified T-STAR protein as a potent splicing repressor of the alternatively spliced segment 4 (AS4) exons from each of the Neurexin1-3 genes, and exon 23 of the Stxbp5l gene. T-STAR protein was most highly concentrated in forebrain-derived structures like the hippocampus, which also showed maximal Neurexin1-3 AS4 splicing repression. In the absence of endogenous T-STAR protein, Nrxn1-3 AS4 splicing repression dramatically decreased, despite physiological co-expression of Sam68. In transfected cells Neurexin3 AS4 alternative splicing was regulated by either T-STAR or Sam68 proteins. In contrast, Neurexin2 AS4 splicing was only regulated by T-STAR, through a UWAA-rich response element immediately downstream of the regulated exon conserved since the radiation of bony vertebrates. The AS4 exons in the Nrxn1 and Nrxn3 genes were also associated with distinct patterns of conserved UWAA repeats. Consistent with an ancient mechanism of splicing control, human T-STAR protein was able to repress splicing inclusion of the zebrafish Nrxn3 AS4 exon. Although Neurexin1-3 and Stxbp5l encode critical synaptic proteins, T-STAR null mice had no detectable spatial memory deficits, despite an almost complete absence of AS4 splicing repression in the hippocampus. Our work identifies T-STAR as an ancient and potent tissue-specific splicing regulator that uses a concentration-dependent mechanism to co-ordinately regulate regional splicing patterns of the Neurexin1-3 AS4 exons in the mouse brain.
Published in the journal:
. PLoS Genet 9(4): e32767. doi:10.1371/journal.pgen.1003474
Category:
Research Article
doi:
https://doi.org/10.1371/journal.pgen.1003474
Summary
The RNA binding protein T-STAR was created following a gene triplication 520–610 million years ago, which also produced its two parologs Sam68 and SLM-1. Here we have created a T-STAR null mouse to identify the endogenous functions of this RNA binding protein. Mice null for T-STAR developed normally and were fertile, surprisingly, given the high expression of T-STAR in the testis and the brain, and the known infertility and pleiotropic defects of Sam68 null mice. Using a transcriptome-wide search for splicing targets in the adult brain, we identified T-STAR protein as a potent splicing repressor of the alternatively spliced segment 4 (AS4) exons from each of the Neurexin1-3 genes, and exon 23 of the Stxbp5l gene. T-STAR protein was most highly concentrated in forebrain-derived structures like the hippocampus, which also showed maximal Neurexin1-3 AS4 splicing repression. In the absence of endogenous T-STAR protein, Nrxn1-3 AS4 splicing repression dramatically decreased, despite physiological co-expression of Sam68. In transfected cells Neurexin3 AS4 alternative splicing was regulated by either T-STAR or Sam68 proteins. In contrast, Neurexin2 AS4 splicing was only regulated by T-STAR, through a UWAA-rich response element immediately downstream of the regulated exon conserved since the radiation of bony vertebrates. The AS4 exons in the Nrxn1 and Nrxn3 genes were also associated with distinct patterns of conserved UWAA repeats. Consistent with an ancient mechanism of splicing control, human T-STAR protein was able to repress splicing inclusion of the zebrafish Nrxn3 AS4 exon. Although Neurexin1-3 and Stxbp5l encode critical synaptic proteins, T-STAR null mice had no detectable spatial memory deficits, despite an almost complete absence of AS4 splicing repression in the hippocampus. Our work identifies T-STAR as an ancient and potent tissue-specific splicing regulator that uses a concentration-dependent mechanism to co-ordinately regulate regional splicing patterns of the Neurexin1-3 AS4 exons in the mouse brain.
Introduction
RNA binding proteins expand the functional complexity of the transcriptome by specifying which exons are spliced into mRNAs at key developmental steps, and make a significant contribution to animal development and complexity [1]–[7]. Splicing takes place in the spliceosome, which consists of 5 snRNAs and up to 200 proteins including a core of essential components and many facultative proteins peripheral to the core [8]. Among the latter are a group of alternative splicing factors whose presence is limiting for regulation of specific subsets of alternative exons. Intriguingly, most alternative splicing factors occur as families of paralogs including Sam68, T-STAR and SLM-1; TRA2α and Tra2β; PTBP1, 2 and 3; MBNL1, 2 and 3; RBFOX1, 2 and 3; TIAL and TIA-1; and hnRNPG and hnRNPG-T amongst others [9]. In some cases splicing regulator paralogs have been shown to have important and functionally distinct roles within animals [10]–[15]. However the existence of multiple forms of these splicing factors poses a conundrum as to whether their existence simply enables each family to have complex spatiotemporal expression patterns, or whether the individual members of each family might have distinct RNA targets.
Here we address the function of T-STAR protein, one of the three homologous KHDRBS splicing regulator proteins. Three KHDRBS genes encode T-STAR, Sam68 and SLM-1 proteins (encoded by the KHDRBS3, KHDRBS1 and KHDRBS2 genes respectively), and evolved around the same time by a triplication of a common ancestral gene between the divergence of hyperoartia and jawed fish around 520 to 610 million years ago (Figure S1). Each of these KHDRBS proteins contain a STAR domain (comprising a ‘KH’-type RNA binding domain flanked by a pair of conserved sequences called QUA1 and QUA2 domains) which is involved in both RNA processing and protein interactions, and a number of other protein domains implicated in cellular signalling pathways (notably SH3 binding and WWW motifs, as well as conserved tyrosines which contribute to candidate SH2 binding domains) [16]–[19]. Each of the mammalian KHDRBS proteins have different but overlapping anatomic expression patterns [20]–[23]. T-STAR protein (also known as SLM-2) is primarily expressed in the testis and the brain [22]. Sam68 protein is expressed ubiquitously, while rat SLM-1 is expressed in the brain with more limited expression in the testis [20]. Sam68 protein becomes functionally sequestered by a triplet repeat sequence in the neurological disease Fragile X Tremor Associated Ataxia Syndrome (FXTAS), and T-STAR is sometimes amplified in medulloblastoma [24], [25].
The only member of the KHDRBS protein family to have been investigated genetically in vertebrates is Sam68. Experiments done with Sam68 knockout mice have shown that Sam68 has important functions in development and physiology [26]–[32]. Sam68 protein is essential for male germ cell development, even though it is co-expressed with T-STAR in the testis. Sam68 null mice are infertile as a result of defects in translational control of stored mRNAs during spermatogenesis [29]–[31]. Sam68 null mice also have behavioural deficits and poor motor control [28]. Sam68 regulates splicing control of several exons during neuronal differentiation in vitro [33], and regulates signal-dependent splicing of Neurexin1 (abbreviated Nrxn1) mRNA isoforms in the cerebellum in vivo [27]. The neurexins are amongst the most diverse protein types in the body although they are encoded by just three genes (Nrxn1-3). This molecular diversity is generated by variable inclusion of five alternatively spliced regions into the Nrxn1-3 mRNAs and by use of two alternative promoters, to produce thousands of different mRNA and protein products [34]–[36]. Splicing inclusion of alternatively spliced segment 4 (abbreviated AS4) has been proposed to regulate neurexin protein-protein interactions, guide the formation of synapses [27], [37], [38], and to comprise an important part of a code which establishes how neurons connect with their ligands and how synapses assemble [39]–[41].
T-STAR and Sam68 have very similar activities in transfected cells, e.g. both regulate splicing control of a cassette exon in the rat CD44 gene [21], [22]. A key question is why two apparently very similar proteins like T-STAR and Sam68 have both been maintained in evolution? Here we have addressed the physiological functions of T-STAR protein by creating a null Khdrbs3 allele and analysing the resulting mice. Surprisingly given its high expression level in the testis, we find that T-STAR is not essential for germ cell development. Instead we find that T-STAR is in fact the critical protein which establishes the exquisite regional splicing patterns of the Neurexin AS4 exon in the brain.
Results
The Khdrbs3 gene is not essential for mouse development or male fertility
High levels of Khdrbs3 mRNA were detected in the mouse testis by Northern blotting (Figure 1A). We therefore hypothesized that T-STAR protein would have an essential role in male germ cell development. To test this prediction we used standard techniques to create a null allele of the Khdrbs3 gene (Figure 1B–1D). Briefly, we created a conditional allele in which exon 2 of the mouse Khdrbs3 gene was flanked by LoxP sites, and then deleted this exon by expression of Cre-recombinase under control of the ubiquitous PGK promoter (Figure 1B–1D. All experimental details are provided in the Methods section).

To confirm that our strategy had been successful in generating a null allele of Khdrbs3, protein and RNA expression levels were analysed in the different genotype mice. Multiplex RT-PCR analysis using primers specific to Khdrbs3 exons 1 and 3 detected high levels of the Khdrbs3 mRNA relative to Hprt in wild type testis and lower levels in the brain (Figure 1E, lanes 4–6). Targeted deletion of exon 2, which is 119 nucleotides long, introduces a frameshift into the Khdrbs3 mRNA resulting in early truncation of the open reading frame. A short RT-PCR product (corresponding to exon 2 deletion) was exclusively detected in RNA isolated from Khdrbs3−/− mice (Figure 1E, lanes 1–3). The frameshift caused by exon 2 deletion likely induces mRNA instability through nonsense mediated decay (NMD), since much lower levels of this exon 2 skipped version of Khdrbs3 mRNA were detected in Khdrbs3−/− mouse testis compared with mRNA levels in the wild type genotype. Only Sam68 and not T-STAR protein was detected in the Khdrbs3−/− mice by Western analysis (Figure 1F) and immunohistochemistry (Figure 2A), although both T-STAR and Sam68 were detected in the testes of wild type mice. Hence we conclude exon 2 deletion from the Khdrbs3 gene creates a true T-STAR knockout allele.

Male germ cell development proceeded normally in the absence of T-STAR protein. Seminiferous tubule morphology from the T-STAR knockout testis was indistinguishable from wild type (Figure 2A). Male T-STAR knockout mice were also fertile. Within our sample population, T-STAR knockout males sired slightly smaller litters compared with heterozygous males (unpaired t test, P = 0.0052; Mann Whitney test, P = 0.0067) (Figure 2B). However, average adult testis/body weight ratios were not significantly different in each of the three genotypes (wild type, knockout and heterozygote) indicating no significant issues with adult testis development (Figure 2C). Also there was no significant reduction in epididymal sperm number (Figure 2D), nor increase in abnormal sperm morphology in the Khdrbs3−/− mice (data not shown). Sperm from wild type and Khdrbs3−/− mice were also equally able to undergo the acrosome reaction (data not shown) indicating no problems with fertilisation.
Normal Mendelian ratios of each genotype were obtained after heterozygous crosses (Figure 2E). Hence there was no embryonic lethality or wave of perinatal mortality in mice without the Khdrbs3 gene, unlike those reported for the Sam68 null mice [31]. Mice containing the T-STAR knockout alleles were bred onto C57/Bl6 and 129 backgrounds. On both genetic backgrounds Khdrbs3−/− knockout mice were apparently healthy, so we concentrated our subsequent analysis on the C57/Bl6 background.
T-STAR protein regulates splicing inclusion of the Neurexin1-3 AS4 exons in the mouse brain
The above data unexpectedly showed that T-STAR protein is not required for male germ cell development. We therefore set out to identify defects in the brain which is the other major site of T-STAR protein expression [22]. We purified RNA from wild type and Khdrbs3−/− mouse brain and carried out a transcriptome-wide search for alternative splicing differences using a medium throughput PCR platform [42]. The resulting data was subjected to quality control (see Methods) and plotted to show the levels of percentage splicing inclusion in wild type brain against the corresponding value in the knockout brain (Figure S2 and Dataset S1). We then independently analysed splice isoform ratios in multiple replicates of wild type, heterozygote and knockout mice. From these we confirmed four strong and robust splicing differences reproducible between individual mice (n = 3 of each genotype).
The four identified T-STAR regulated mRNA splice isoforms in the adult brain were the Neurexin1-3 variants which differ as to whether they include exon 20 (hereafter referred to as alternatively spliced segment 4, or AS4) and Stxbp5l exon 23 (Figure 3A–3B). In each case higher levels of exon skipping were observed in the wild type brain compared to the Khdrbs3+/− heterozygote, and almost complete AS4 exon inclusion in the Khdrbs3−/− (T-STAR knockout) mouse brain. Differences in splicing exclusion levels of the wild type and T-STAR knockout mouse brains were statistically significant (Figure 3B, n = 3 mice). These data show T-STAR operates as a splicing repressor of these exons. In contrast, no significant splicing changes between wild type and T-STAR knockout mice were seen in splice isoforms made from the known Sam68 target exon Sgce1 [29], [33] (Figure 3B).

T-STAR protein expression establishes regional splicing regulation of Nrxn1-3 exon AS4 in the mouse brain
Splicing of Nrxn1-3 AS4 exons are regionally controlled in the adult mouse brain (Figure 4A–4B), with high levels of skipping in forebrain-derived structures like the cortex and hippocampus, and much lower levels of skipping in hindbrain structures like the cerebellum [27]. RT-PCR analysis of different brain regions showed these regional splicing patterns were totally abolished in the brains of T-STAR null mice (Figure 4A shows results from an individual wild type and a knock out mouse, and Figure 4C–4E show quantitative data from 3 brains of each genotype). As a result of T-STAR deletion, splicing repression levels of Nrxn1-3 AS4 were similar across each adult brain region from the knockout mice. For example, in the thalamus levels of percentage splicing exclusion for Nrxn1-3 AS4 dropped from ∼50% in the wild type mouse to ∼0–5% in the Khdrbs3−/− mouse.

Although maximal AS4 splicing repression took place in forebrain-derived regions in wild type mice, there was also reduced but detectable Nrxn1 and Nrxn2 AS4 repression in the olfactory bulb, midbrain and cerebellum, and intermediate levels of AS4 repression in the pons, medulla and spinal cord. In each of these brain regions we also observed significantly reduced Nrxn1 and Nrxn2 AS4 splicing exclusion in the knockout (Khdrbs3−/−) genetic background compared to wild type (Figure 4C–4D). We conclude that T-STAR protein affects Nrxn1-3 AS4 splicing patterns across the whole adult brain, but has a very substantial effect in forebrain-derived structures which normally show maximal splicing repression of this exon.
The above experiments were carried out in the adult brain, but we also observed strong expression of T-STAR in the embryonic brain (embryonic day 13.5, Figure 5A). Embryonic T-STAR protein expression was particularly strong in the cortical plate, but less in the proliferating layers of the embryonic cortex. Strong embryonic T-STAR expression was also detected in the embryonic hippocampus, and in the epidermal layer of the choroid plexus. At this same stage of embryonic brain development the Neurexin AS4 exons also showed splicing exclusion, which was blocked in the T-STAR null mouse (Figure 5B).

Regional protein concentrations and AS4 splicing patterns suggest T-STAR operates as a concentration-dependent splicing switch
To establish how T-STAR might function as a regional Nrxn AS4 splicing regulator, we next monitored regional T-STAR and Sam68 protein expression in the adult mouse brain using Western blots (Figure 6A). T-STAR protein migrated as a major isoform of ∼55 kDa, with a minor protein isoform migrating with a slightly larger molecular weight. This minor T-STAR protein isoform was particularly enriched in the cortex, and has not been further investigated here. Both T-STAR protein isoforms disappeared in the T-STAR null background, whilst levels of Sam68 protein were unaffected.

We plotted the observed levels of splicing repression for Nrxn1-3 AS4 exons in each brain region against the ratio of major T-STAR protein isoform expression relative to Sam68. Linear regression analysis indicated a positive and statistically significant correlation in each case (Figure 6B–6D). Higher ratios of T-STAR:Sam68 protein expression were found in forebrain-derived structures, which also had maximal Nrxn1-3 exon AS4 skipping (the cortex, hippocampus, basal ganglia, thalamus and hypothalamus). Lowest ratios of T-STAR:Sam68 protein expression were detected in the olfactory bulb and the cerebellum which also showed lowest levels of Nrxn1-3 AS4 alternative splicing regulation. These data are consistent with an AS4 splicing switch mechanism driven by regional concentrations of T-STAR protein in the adult brain.
Nrxn1-3 AS4 splicing regulation depends on endogenous expression of T-STAR protein even when there is physiological co-expression of Sam68
We next addressed the question of whether T-STAR protein might function in the same or different cell types to Sam68. Strong nuclear expression of both T-STAR and Sam68 proteins were both detected in the CA1–CA3 regions of the hippocampus, with additional expression of Sam68 in the Dentate Gyrus (Figure 7A and Figure S3).
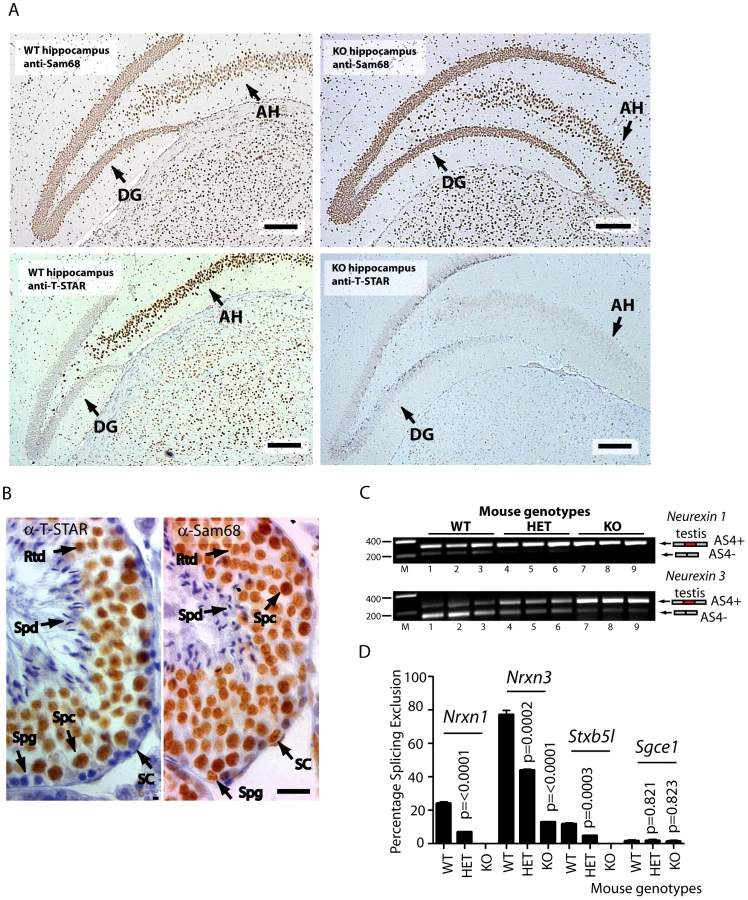
These experiments suggested overlapping patterns of expression of T-STAR and Sam68 in the hippocampus, but were unable to differentiate specific cell types. However immunohistochemical analysis of the testis clearly indicated that T-STAR and Sam68 proteins were co-expressed in exactly the same cell types and nuclei (in spermatocytes and round spermatids, with additional expression of Sam68 alone in spermatogonia and Sertoli cells Figure 7B). We could also detect Nrxn1 and Nrxn3 gene expression and AS4 exon skipping in the testis as well as in the brain (Nrxn2 expression was only detected at very low levels in the testis, so we did not analyse it further here) (Figure 7C).
Although Sam68 was expressed in the same cell types as T-STAR in the testis, Nrxn1 and Nrxn3 AS4 splicing repression still critically depended on T-STAR protein expression (Figure 7C and 7D). Nrxn1 AS4 splicing switched from a mean of 24% splicing exclusion in wild type testis to 0% splicing exclusion in the absence of T-STAR protein. In wild type testis the major Nrxn3 mRNA isoform detected was the AS4-skipped form (with a mean value of 77% splicing exclusion). This splice isoform ratio was totally reversed in the Khdrbs3−/− background, where the major Nrxn3 splice isoform now included AS4 (with a mean value of 13% AS4 splicing exclusion).
Nrxn2 AS4 is a specific molecular target for T-STAR regulation
Nrxn1 AS4 is known to be a direct molecular target of Sam68 protein [27]. However, T-STAR-mediated regulation of Nrxn2 was a surprise, since Sam68 protein had no reported effect at all on Nrxn2 AS4 splicing regulation in mouse neurons [27]. We next tested if Nrxn2 AS4 is indeed a direct and specific molecular target of T-STAR.
Minigene constructs were made containing mouse Nrxn2 AS4 along with flanking intronic sequences. The resulting minigenes were co-transfected into HEK293 cells alongside constructs expressing either STAR-GFP fusion proteins or GFP alone. Parallel western blots showed that similar levels of the different proteins were expressed in transfected cells (Figure 8A–8B). Consistent with specific regulation by T-STAR, splicing exclusion of Nrxn2 AS4 was only observed after co-transfection of an expression construct encoding T-STAR-GFP protein (Figure 8C, lane 2) and not by Sam68-GFP or GFP alone (compare lane 2 of Figure 8C with lanes 5 and 1).

We carried out similar minigene experiments to examine splicing regulation of the Nrxn3 gene. Co-expression of either T-STAR-GFP or Sam68-GFP caused strong splicing repression of Nrxn3 AS4 (leading to a mean of 70–80% splicing exclusion; Figure 8D, compare lanes 1, 2 and 5). Hence Nrxn3 AS4 exon is regulated by both Sam68 and T-STAR. To examine whether or not the effect on splicing exclusion was due to direct RNA binding we tested the effect of the V229F amino acid substitution of Sam68 which has been reported to prevent RNA-protein interactions [43], and the corresponding V129F mutation in T-STAR (Figure 8A). Both these point mutations did disrupt splicing regulation by Sam68 and T-STAR (Figure 8C and 8D, lanes 4 and 7), as did deletion of the entire KH domain of either T-STAR or Sam68 (Figure 8C and 8D, lanes 3 and 6).
An intronic A-U rich element downstream of the regulated Nrxn2 exon mediates splicing changes response to cellular concentrations of T-STAR
We next set out to identify the RNA sequences which mediate splicing repression of T-STAR protein on Nrxn2 AS4. SELEX experiments have identified bipartite U(U/A)AA (abbreviated UWAA) motifs as T-STAR RNA target sites [44]. In the overall length of the Nrxn1 and Nrxn3 genes UWAA motifs occur at a lower frequency than would be expected by chance, but there was an excess in the Nrxn2 gene, particularly of the double repeat UWAAUWAA in the region of the Nrxn2 AS4 exon (Table S1). Detailed analysis of the AU-rich region downstream of Nrxn2 AS4 revealed six candidate UWAA T-STAR target motifs within a 51 nucleotide AU-rich region which starts 13 nucleotides downstream of Nrxn2 exon AS4 (Figure 9A) [9].

We altered five of the UWAA motifs downstream of Nrxn2 AS4 using mutagenesis (the most upstream of the UWAA sequences was close to the 5′ splice site so we did not alter this), and then examined the effect on splicing regulation by T-STAR. Importantly, the alternative exon in the Nrxn2 minigene was still efficiently spliced into mRNAs after mutagenesis, indicating the Nrxn2 exon itself was still efficiently recognised by the spliceosome (Figure 9B–9C, Lane 1). Hence no essential splicing signals had been compromised by the mutations engineered into the minigene construct. However, mutation of the UWAA repeats completely prevented splicing repression by T-STAR of Nrxn2 AS4 (Figure 9B–9C). We also observed reduced levels of splicing exclusion for the mutated Nrxn2 AS4 minigene compared to the wild type after co-transfection with GFP (significantly different mean levels of percentage splicing exclusion were observed between lanes 1 and 3, p = 0.0079), consistent with this UWAA repeat acting as an intronic splicing silencer responsive to endogenous T-STAR protein in the HEK293 cells.
We carried out EMSAs (Electrophoretic Mobility Shift Assays) using equal concentrations of purified T-STAR-GST and Sam68-GST proteins (Figure 9D) to confirm direct RNA-protein interactions with the Nrxn2 response element. Addition of either T-STAR or Sam68 completely prevented the Nrxn2 RNA probe from moving from the well, suggesting the formation of large molecular complexes on this probe. T-STAR protein bound to and shifted the Nrxn2 probe (Figure 9E, lanes 4–6) with a complete shift observed with 100 ng of added T-STAR protein (lane 0 in Figure 9E shows how the probe migrates in the absence of T-STAR or Sam68 protein). Sam68 protein also shifted the Nrxn2 RNA probe, but with a different response pattern of maximal binding at 200 ng added protein (Figure 9E, lanes 1–3). These different patterns of binding response might contribute to the specific regulation of Nrxn2 AS4 by T-STAR protein in vivo. No binding was observed to a control RNA probe (Figure 9F).
The presence and organisation of UWAA motifs in the 200 bp downstream of the AS4 exon in Neurexin2 genes were highly conserved between bony vertebrates (Figure 10), suggesting that the T-STAR response element is ancient. Although different from Nrxn2, the positions of UWAA motifs downstream of the Neurexin1 AS4 exon were also highly conserved between individual Nrxn1 genes in bony vertebrates. There was less conservation of UWAA distribution downstream of the Neurexin3 AS4 exon.

Alternative splicing of Nrxn1-3 AS4 has previously been found in zebrafish showing it is ancient in origin [45]. Since the T-STAR gene itself originated 520–610 million years ago (Figure S1) and the Neurexin genes diverged about the same time (data not shown) we carried out experiments to test if T-STAR might also control Neurexin AS4 splicing in zebrafish. We tested this hypothesis using the zebrafish Nrxn3 (abbreviated zNrxn3) AS4 exon, since the mouse Nrxn3 AS4 exon was under the tightest regional control in the mouse brain, and also very strongly repressed by the presence of either T-STAR or Sam68 proteins when encoded by a minigene. Consistent with a conserved mechanism of splicing regulation, a minigene-encoded zNrxn3 AS4 exon was strongly repressed by co-transfection of human T-STAR protein (Figure 11A and 11B, lane 2). No splicing repression was induced by either the V129F T-STAR mutant, or by the T-STAR ΔKH domain mutant. Splicing inclusion of the zNrxn3 AS4 was also repressed by human SLM-1 protein, but not by Sam68 (Figure 11A and 11B, lanes 5 and 6). Zebrafish Sam68 lacks the N-terminal extension of human Sam68 protein [16], but even deletion of these 96 amino acids from human Sam68 protein did not enable human Sam68 protein to regulate zNrxn3 AS4. Figure 11A and 11B, lane 7)

T-STAR null mice have normal spatial memory in the absence of AS4 exon repression in the hippocampus
Since the hippocampus is involved in spatial learning and memory [46] we hypothesized that T-STAR null mice with reduced levels of the AS4 exon negative Neurexin isoforms might show differences in either spatial learning or memory. To test this we used a Barnes maze test to measure how well T-STAR null mice remember the spatial location of an escape route (hole) using visual cues. The T-STAR knockout mice and the wild type mice both learned the spatial acquisition task equally well over a period of four days (Figure 12A) and had similar short and long term memories measured at 5 and 12 days respectively (Figure 12B). Therefore in these mice no difference in learning was observed, despite significantly less splicing repression of Neurexin AS4 exons in the hippocampus.

Discussion
A distinct T-STAR gene has been maintained in bony vertebrates for at least 550 million years, ever since the gene triplication which also produced the genes encoding Sam68 and SLM-1. Here we have identified for the first time (to the best of our knowledge) the molecular function of endogenous T-STAR protein, which is to control regional splicing repression of the AS4 exon in the Nrxn1-3 mRNAs. T-STAR also controls splicing regulation of the Syntaxin-binding protein 5-like (Stxbp5l, alternatively known as Tomosyn2). Together our data support a model in which T-STAR expression provides a concentration-dependent switch to establish Nrxn1-3 AS4 splicing patterns in different regions of the mouse brain (Figure 13). High concentrations of T-STAR in forebrain-derived structures like the hippocampus block splicing inclusion of Nrxn1-3 AS4. Lower concentrations of T-STAR protein in areas of the brain like the cerebellum result in the Nrxn1-3 AS4 exons being mainly included. Three lines of evidence support this mechanism. Endogenous Neurexin AS4 splicing patterns responded to T-STAR protein concentration differences found between wild type, heterozygous and homozygous knockout mouse brains. Second, local endogenous levels of T-STAR protein expression in the brain showed good correlation with the regional patterns of Neurexin AS4 splice isoforms. Thirdly, removal of T-STAR protein in the null mouse totally blocked regional Neurexin AS4 alternative splicing patterns, even though Sam68 was still there.

The T-STAR parolog Sam68 also regulates alternative splicing of the Nrxn1 AS4 exon, but in this case splicing repression involves neuronal signalling pathways [27]. T-STAR protein lacks the key serine residue (S20) which is phosphorylated by these neuronal signalling pathways (Figure 8A). Deletion of Sam68 predominantly affected regional Nrxn1 AS4 splicing repression in the cerebellum and brain stem, with very slight effects on Nrxn1 AS4 splicing repression in the cortex [27]. In contrast, T-STAR has strong splicing effects on AS4 inclusion in all forebrain-derived regions of the adult brain which are also the sites of maximum AS4 splicing repression, and where Sam68 does not seem to be so active. Our data also show that T-STAR controls Nrxn1 and Nrxn3 AS4 splicing in the testis, which does not contain neuronal tissues and directly co-expresses Sam68 in exactly the same cells as T-STAR. Despite this splicing defect, T-STAR null mice did not have any major defects in germ cell development. This is again in direct contrast with Sam68 null mice, which suffer germ cell arrest and infertility.
We have also identified Nrxn2 exon AS4 as the first known splicing target for T-STAR protein which is not also regulated by Sam68. The T-STAR response element in Nrxn2 AS4 mapped to six repeated UWAA motifs which would be predicted to bind to T-STAR protein by SELEX [44]. T-STAR protein operates as a splicing repressor of Nrxn2 AS4. Although downstream binding sites for splicing regulators frequently cause exon activation rather than repression, the AU-rich sequence responsible for T-STAR mediated splicing repression is very close (12 nucleotides) to the 5′ splice site of Nrxn2 AS4. Binding of T-STAR protein to this region of the pre-mRNA might mechanistically repress splicing through exclusion of U1 snRNP [47]–[49]. The presence of multiple UWAA binding sites downstream of Nrxn2 AS4 may ensure that at least a single site is occupied at a given cellular concentration of T-STAR, or help assemble larger protein-RNA complexes [50].
Each of the Neurexin proteins is somewhat similar, which may provide a physiological rationale for their coordinate regulation by a single master protein like T-STAR. However, different distributions of UWAA motifs downstream of individual AS4 exons in different Neurexin gene paralogs suggest subtly different splicing control mechanisms operate. These patterns of UWAA motifs were conserved between Neurexin gene paralogs in different species. Different patterns of Neurexin AS4 splicing exclusion were also observed between Neurexin paralogs in the mouse brain, with Nrxn3 AS4 having a much tighter pattern of regulation than the equivalent exon in Nrxn1 or Nrxn2.
The AS4 exons of the Neurexin genes are ancient, and conserved even in zebrafish [45], indicating an important function for this splice isoform. Moreover, in transfected cells human T-STAR protein was also able to repress splicing of zebrafish Nrxn3 AS4, suggesting splicing control by T-STAR is both ancient and conserved and may have been one of the earliest functions for T-STAR protein after it evolved. Neurexin proteins play important roles in synapse function and guiding wiring of the nervous system, and have been implicated with roles in Alzheimer's disease, autism and epilepsy [51]. The AS4 exon has been suggested to play a critical role in moulding the synapse [39]–[41]. Nonetheless, even though T-STAR null mice almost totally fail to repress splicing of the Neurexin AS4 exon in the embryo as well as the adult they still develop apparently normal brains and have normal spatial memory measured by the Barnes maze test. Taken as a whole these results suggest the functional effect of the AS4 exon might be somewhat subtle, yet must be important in the wild to explain the conservation of this alternative splice event in bony vertebrates.
Perhaps the most surprising implication of the results described in this study is the exquisite and unexpected specificity of the effects of T-STAR on alternative splicing regulation. While we sampled 782 alternative splicing events known to be differentially regulated in the mouse brain, we only identified 4 strongly regulated splicing targets. At the very least our data suggest an enrichment of T-STAR targets involved in synapse formation, and is consistent with the idea that T-STAR, like some other RNA binding proteins, will functionally regulate coherent groups of targets [52]. Very recent data indicate that the neurexin and tomosyn proteins are involved in the mechanism of synaptic retrograde transport inhibition in C. elegans [53], consistent with functional coherence in their shared splicing regulation by T-STAR.
Materials and Methods
Ortholog identification
Blastp and tblastn searches for neurexin and KHDBRS orthologous sequences in nr, reference genomic sequences, reference mRNA and EST databases were performed using the NCBI Blast suite (http://blast.ncbi.nlm.nih.gov/). Accession numbers for NRXN and STAR protein sequences used are listed in Dataset S2. Human, chick and fish genes are respectively ENSG00000179915, ENSGALG00000009107, ENSDARG00000061647 (NRXN1); ENSG00000110076, ENSDARG00000061454 (NRXN2); ENSG00000021645, ENSGALG00000010518, ENSDARG00000062693 (NRXN3).
Phylogenetic inference
Trees were inferred by using MrBayes [54] and PhyML [55]. Neurexin or KHDBRS sequences were aligned with MAFFT [56]. Due to sequence variability in the COOH ends, we only used the GSG domain [57] for further analysis. For clarity, we restricted the sampling to specific taxons (Mammals [human, rat], Birds [chick], Amphibians [frog], Bony fishes [zebrafish], Jawless fishes [lamprey], Urochordates [sea squirt, appendicularians], Cephalochordates [lancelet], Echinoderms [sea urchin], Hemichordates [acorn worm], Mollusks [sea hare], Ecdyzozoans [nematode, drosophila, mosquitos, honey bee], Cnidarians [hydra, sea anemone], Placozoans [trichoplax], Choanoflagellates [monosiga]). Alignments were analyzed with ProtTest (v. 10.2) to identify the best substitution models [58]. We used MrBayes 3.1.2 with the wag matrix rate and a gamma distribution describing among-site rate variation with eight categories (+G8). MCMCMC chains were run for 1 million generations with a sample frequency of 1,000 and a 10% burn-in value. For ML analyses, we also used the wag+G8 in PhyMLM while searching for the ML tree by performing both NNI and SPR topological moves on a bioNJ starting tree. The statistical robustness of inferred nodes was assessed by 100 bootstrap pseudoreplicates of the same ML search. Whatever the method, trees inferred showed same node support. We used the SF1 family as an external outgroup, since it is the only GSG protein family found in unicellular eukaryotes (e.g. M. brevicollis). Analyses were conducted using the Geneious Pro package (v5.6, available from http://www.geneious.com) [59]. The significance of deviations in UWAA motifs within Neurexin genes were measured using the R'MES program as described [60].
Detection of gene and protein expression in mouse tissues
PCR reactions (Dataset S1) were designed to detect alternative mRNA isoforms in the mouse transcriptome, including all the simple alternative splicing events in the mouse RefSeq database NCBI genome build 37 (UCSC mm9) using gene annotation from UCSC known gene track as of 2009/09/01. Initial medium throughput analysis was carried out on a single whole brain RNA sample from wild type and knockout mouse brain, using a robotic platform as previously described [42] to assay 1191 ASEs between wild type and knockout whole brain mRNA with size differences between the two expected isoforms between 30 and 411 bases. The ASEs included 808 alternative events exons, 129 alternative 3′ splice sites, 155 alternative 5′ splice sites and 99 more complex alternative splicing events. Subsequent quality control removed 141 assays that gave no PCR products, 142 assays that gave impure PCR reactions with less than 75% of products at the required mobilities, and 115 assays that gave weak products which had less than 20 nM total concentration. Out of the 792 events that gave informative splicing ratios only 20 alternative splicing events changed more than 16% between wild type and knockout adult mouse brains, and just 7 exons showed a greater than 25% difference in splicing inclusion between the wild type and knockout mouse brain. Of these 7 exons we confirmed just 4 (in the Nrxn1-3 genes and Stxbp5l) in the brains of multiple replicate mice.
The levels of Nrxn1-3 AS4 isoforms were detected in total RNA isolated from different mouse tissues using RT-PCR and standard conditions [61] using previously described primers [27]. Quantifications were carried out by Capillary Gel electrophoresis as previously described [61], [62].
Northern analysis was carried out using standard techniques. T-STAR mRNA was detected using a PCR probe amplified from the T-STAR cDNA using the primers TstarN F 5′GCCACTTTGTTGAAGCATCC3′ and T-STARNR 5′ AAATTCTATGGAAACCTTTAAG 3′, and the was blot re-probed using 18S RNA as a loading control [63].
For protein detection by immunohistochemistry, testes and brains were fixed in 4% paraformaldhyde and embedded in paraffin wax. Sections were prepared and immunohistochemistry carried out as previously described [64]. Primary antibodies were specific for Sam68 (Santa Cruz anti-Sam68 sc-333) and affinity purified α-T-STAR [22], [65]. Protein detection by Western blotting was as previously described [22], using antisera specific to either Sam68 (Santa Cruz sc-333) or T-STAR [22], [65] protein. To detect protein levels across the mouse brain, blots were first probed for Sam68, and then these same blots sequentially stripped and re-probed for T-STAR. The western blot shown in Figure 1 was probed with the α-Khdrbs3 antibody (Proteintech 13563-1-AP) which recognises both T-STAR and Sam68.
Statistical analysis
Bar charts were plotted and statistical analyses performed using Graphpad Prism (Graphpad software).
Construction of targeting vector for the Khdrbs3 gene
We constructed a targeting construct ELD1-HR in which exon 2 of the mouse Khdrbs3 gene was flanked by LoxP sites using standard molecular biology techniques. Three overlapping fragments from the Khdrbs3 locus were initially amplified by long range PCR from 129Sv/Pas isogenic DNA. The primers 5′-GCCTCAAAGGTGGTTATGTCCTCTGG-3′ and 5′-AAATCACTGAGCCCTTGGGTGACC-3′ were used to create ELD1-Lad (long arm distal fragment). The primers 5′ -TTGTCTCGCTCTCTAGGTTCTCTCCTGG-3′ and 5′ - GGTTTCTCAAGCATCCACAAGCATACG -3′ were used to create ELD1-Lap (long arm proximal fragment). The primers 5′-AGCTGGGACAGAAGGTGCTGATTCC-3′ and 5′ - TGCACCACAATAAGATAGCCCAGCC-3′ were used to create ELD1-Sam (short arm fragment). These products were then independently cloned into the pCR4-TOPO vector (Invitrogen) and sequenced. ELD1-Lad contains intronic sequence 5′ of exon 2. ELD1-Lap contains sequences both upstream and downstream of exon 2 and also includes exon 2. ELD1-Sam has part of exon 2 and some intronic sequence between exon 2 and 3.
To make a positive control for the ES cell electroporation (construct ELD1C+) the G139 vector containing one LoxP site and neomycin flanked by Frt sites was modified so that the BsaBI-Bsu361 fragment from ELD1-Sam could be cloned into it. An adapted cloning vector was made to clone the long arm of the targeting construct. A linker was synthesized containing AscI, NotI, SacII, BsmI, HindIII, AfeI, MluI, PciI, AvrII, XhoI, BstEii, NruI and PacI sites, and inserted into the G126 vector to create the construct ELD1-GA1. A BsmI –HindIII fragment from ELDL1-Lad was then cloned into the BsmI-HindIII site of ELD1-GA1. The HindIII-BsaB1 from ELDL1-Lap was then inserted to create the construct ELD1-LA. A LoxP site was cloned into the HindIII site using two annealed oligonucleotides to create the construct ELD1-LA-Lox.
An XhoI-BstII fragment from ELD1C+ was cloned into ELD1-GA1 to create the clone ELD1-SA Neo. Next the SacII-MluI fragment of ELD1-LA was cloned into ELD1SAneo. This construct (ELD1-LSAneo) contained the long and short arms. The last step was to insert the Diptheria toxin selection cassette from the G112 vector into the AscI-NotI site of ELD1-LSA to create the final ELD1-HR targeting vector.
Generation of knockout mice
The ELD1-HR targeting vector was electroporated into 129Sv/Pas cells by Genoway,France, and clones were screened using the primers GX1406 5′-CTACTTCCATTTGTCACGTCCTGCACG-3′ and ELD1J2 5′-ACAGCCACCCCACACTCAGAAACG-3′. We obtained a targeting frequency of 34%. Positive clones were injected into blastocysts (by Genoway,France) to create chimeras and bred to yield agouti pups heterozygous for the targeted locus by PCR and Southern blot analysis. After germline transmission of the conditional allele was achieved, we confirmed the genotype of these mice by Southern blot. The original mice containing the Neomycin gene were crossed to FlpE mice to remove the Neo gene resulting in the Khdrbs3LoxP allele depicted in Figure 1C. Mice containing the Khdrbs3LoxP allele were crossed to mice expressing PGK-cre, resulting in the deletion of Khdrbs3 exon 2 (Figure 1D). Genetic structures of the targeted and wild type alleles were confirmed by Southern blot analysis using the SA-E-V probe generated by PCR amplification with the primers SA-E-V1F 5′ - TGTCAACCAGAGGACAGTAGAGGACTCACC-3′ SA-E-V2R 5′ - GCCCTCATGTTGGAAGGAACCACC-3′ (Figure 1B–D), and SacI/AvrII digested mouse genomic DNA. Levels of Khdrbs3 gene expression were monitored at the RNA level using RT-PCR using primers:
Tstar exon1F 5′-GCGAGCATGGAGGAGAAGTA-3′;
Tstar exon3R 5′ - CTTTGCCAAGGATGGACATT-3′;
HrptF 5′-CCTGCTGGATTACATTAAAGCACTG-3′; and
HprtR 5′-GTCAAGGGCATATCCAACAACAAAC-3′
Analysis of mouse germ cell development in vivo
Litter sizes, testis/body weight ratios, sperm counts and Mendelian ratios were measured on a mixed C57Bl6/129 background and a Bl/6 background. In order to determine sperm counts, the cauda epididymis were dissected in Universal IVF media (Origio, Surrey) and the sperm were counted in a haemocytometer.
Analysis of exon splicing using minigenes
The Nrxn2 and Nrxn3 minigenes were constructed by PCR amplification of mouse genomic DNA, followed by cloning into the exon trap vector pXJ41 as previously described [61], [66]. The primers used for PCR amplification were:
Mouse Neurexin2F 5′-AAAAAAAACAATTGgtgaggagatggctgggact-3′;
Mouse Neurexin2R 5′-AAAAAAAACAATTGaaaaacccctgaggtgaactct-3′;
Mouse Neurexin 3F 5′-AAAAAAAACAATTGaaaaaggacgaggaggagttt-3′;
Mouse Neurexin 3R 5′-AAAAAAAACAATTGtcttagactttttgagttgacttgatg-3′.
Zebrafish Neurexin 3F 5′-AAAAAAAACAATTGtggagaaaaactgaagaaaatgaa-3′.
Zebrafish Neurexin 3R 5′-AAAAAAAACAATTGctaactttaagatcaacacaaagatca-3′.
The T-STAR response element in Nrxn2 was mutated by overlap PCR, using the following mutagenic oligonucleotide primers:
MutantNrxn2F 5′-AatCCatCCatCCatCCacCCacCCacCCacttCCaaaacacgatctCCaaggtgcagagctctctc-3′.
MutantNrxn2R 5′-GGagatcgtgttttGGaagtGGgtGGgtGGgtGGatGGatGGatGGatTctggttaattacctttgtc-3′.
Levels of alternative splicing were detected using RT-PCR and capillary gel electrophoresis as previously described [61], [66].
The V129F mutant of T-STAR, V229F mutant of Sam68, (KH version of T-STAR, and (KH version of Sam68 were cloned by overlap PCR mutagenesis as previously described [67] using the following primers:
T-STARmutagenesisF: 5′-gttctcattgaaTtTtttgccccacctgcagaagctt-3′
T-STARmutagenesisR: 5′-aagcttctgcaggtggggcaaaAaAttcaatgagaac-3′.
T-STAR(KHF: 5′-ttcaactttgtggggaaa gagttgaggaaaagtggagaa-3′
T-STAR(KHR: 5′-ttctccacttttcctcaactctttccccacaaagttgaa-3′
Sam68 mutagenesisR: 5′-tcaatgaagaaatgcagatcc-3′
Sam68 mutagenesis F: 5′-ggatctgcatttcttcattga-3′
Sam68ΔKHF: 5′-tgtcaagcagtatcccaaggagctgcgcaaaggtgg-3′
Sam68ΔKHR: 5′-ccacctttgcgcagctccttgggatactgcttgaca-3′
Final PCR products after overlap PCR were each cloned into pGFP3 to generate the expression constructs [22].
Electrophoretic mobility shift assays (EMSAs)
EMSAs were performed as previously described [61], [62] using purified full length Sam68-GST and T-STAR-GST fusion proteins, and in vitro transcribed RNA probes made from regions of the Neurexin2 gene cloned into pBluescript. The sequences of the inserts of the pBluescript clones were:
Nrxn2
GGCTGCTCGACAAAGGTAATTAACCAGAATTAATTAATTAATTAACTAAC
TAACTAACTTTAAAAACACGATCTTAAAGGTGCAGAGCTCTCTCC
Control probe
AGGCCCCCTAGAAGTAGTGCAGGCTGGTGGCTGACCGGACCAAGGGAGGA
AGGGAAGGTGGTGCTCTCTTAGGAATCCATAGAGGTCTCTGCCTGCTGGT
TTGATGAGGAAGA
Barnes maze test
The Barnes maze behavioural experiment was performed as described (http://www.nature.com/protocolexchange/protocols/349). Eight Bl/6 wild type and eleven T-STAR knockout male mice (10 weeks old) which had been backcrossed >10 generations onto a Bl/6 background were used for the analysis. The maze consisted of 20 holes, with one target hole which has a box into which the mouse can escape from the light shone on the maze. Mice were trained using visual cues to find the target hole over a period of 4 days with 4 trials each day. We measured the primary latency (or time to find the hole in seconds). On the fifth day, the box was removed and the time to find the target measured to determine short term memory. The mice were allowed to rest for 7 days and then they were tested again to monitor their long term memory on the twelfth day. All animal experiments were performed with approval from Newcastle University ethical review committee and under UK home office licence according to the requirements of the Animals (Scientific Procedures) Act 1986 of the UK Government.
Supporting Information
Zdroje
1. BlackDL (2003) Mechanisms of alternative pre-messenger RNA splicing. Annu Rev Biochem 72 : 291–336.
2. KalsotraA, CooperTA (2011) Functional consequences of developmentally regulated alternative splicing. Nat Rev Genet 12 : 715–729.
3. NilsenTW, GraveleyBR (2010) Expansion of the eukaryotic proteome by alternative splicing. Nature 463 : 457–463.
4. SmithCW, ValcarcelJ (2000) Alternative pre-mRNA splicing: the logic of combinatorial control. Trends Biochem Sci 25 : 381–388.
5. BlencoweBJ (2006) Alternative splicing: new insights from global analyses. Cell 126 : 37–47.
6. AnkoML, NeugebauerKM (2012) RNA-protein interactions in vivo: global gets specific. Trends Biochem Sci 37 255–62.
7. KonigJ, ZarnackK, LuscombeNM, UleJ (2011) Protein-RNA interactions: new genomic technologies and perspectives. Nat Rev Genet 13 : 77–83.
8. WillCL, LuhrmannR (2011) Spliceosome structure and function. Cold Spring Harb Perspect Biol 3: pii: a003707.
9. FujitaPA, RheadB, ZweigAS, HinrichsAS, KarolchikD, et al. (2011) The UCSC Genome Browser database: update 2011. Nucleic Acids Res 39: D876–882.
10. GehmanLT, MeeraP, StoilovP, ShiueL, O'BrienJE, et al. (2012) The splicing regulator Rbfox2 is required for both cerebellar development and mature motor function. Genes Dev 26 : 445–460.
11. GehmanLT, StoilovP, MaguireJ, DamianovA, LinCH, et al. (2011) The splicing regulator Rbfox1 (A2BP1) controls neuronal excitation in the mammalian brain. Nat Genet 43 : 706–711.
12. YanoM, Hayakawa-YanoY, MeleA, DarnellRB (2010) Nova2 regulates neuronal migration through an RNA switch in disabled-1 signaling. Neuron 66 : 848–858.
13. RuggiuM, HerbstR, KimN, JevsekM, FakJJ, et al. (2009) Rescuing Z+ agrin splicing in Nova null mice restores synapse formation and unmasks a physiologic defect in motor neuron firing. Proc Natl Acad Sci U S A 106 : 3513–3518.
14. KanadiaRN, JohnstoneKA, MankodiA, LunguC, ThorntonCA, et al. (2003) A muscleblind knockout model for myotonic dystrophy. Science 302 : 1978–1980.
15. MendeY, JakubikM, RiesslandM, SchoenenF, RossbachK, et al. (2010) Deficiency of the splicing factor Sfrs10 results in early embryonic lethality in mice and has no impact on full-length SMN/Smn splicing. Hum Mol Genet 19 : 2154–2167.
16. EhrmannI, ElliottDJ (2010) Expression and functions of the star proteins Sam68 and T-STAR in mammalian spermatogenesis. Adv Exp Med Biol 693 : 67–81.
17. LukongKE, RichardS (2003) Sam68, the KH domain-containing superSTAR. Biochim Biophys Acta 1653 : 73–86.
18. SetteC (2010) Post-translational regulation of star proteins and effects on their biological functions. Adv Exp Med Biol 693 : 54–66.
19. SetteC, MessinaV, ParonettoMP (2010) Sam68: a new STAR in the male fertility firmament. J Androl 31 : 66–74.
20. StossO, NovoyatlevaT, GenchevaM, OlbrichM, BenderskaN, et al. (2004) p59(fyn)-mediated phosphorylation regulates the activity of the tissue-specific splicing factor rSLM-1. Mol Cell Neurosci 27 : 8–21.
21. StossO, OlbrichM, HartmannAM, KonigH, MemmottJ, et al. (2001) The STAR/GSG family protein rSLM-2 regulates the selection of alternative splice sites. J Biol Chem 276 : 8665–8673.
22. VenablesJP, DalglieshC, ParonettoMP, SkittL, ThorntonJK, et al. (2004) SIAH1 targets the alternative splicing factor T-STAR for degradation by the proteasome. Hum Mol Genet 13 : 1525–1534.
23. ParonettoMP, BianchiE, GeremiaR, SetteC (2008) Dynamic expression of the RNA-binding protein Sam68 during mouse pre-implantation development. Gene Expr Patterns 8 : 311–322.
24. SellierC, RauF, LiuY, TassoneF, HukemaRK, et al. (2010) Sam68 sequestration and partial loss of function are associated with splicing alterations in FXTAS patients. EMBO J 29 : 1248–1261.
25. LuY, RyanSL, ElliottDJ, BignellGR, FutrealPA, et al. (2009) Amplification and overexpression of Hsa-miR-30b, Hsa-miR-30d and KHDRBS3 at 8q24.22-q24.23 in medulloblastoma. PLoS ONE 4: e6159 doi:10.1371/journal.pone.0006159.
26. HuotME, VogelG, ZabarauskasA, NgoCT, Coulombe-HuntingtonJ, et al. (2012) The Sam68 STAR RNA-Binding Protein Regulates mTOR Alternative Splicing during Adipogenesis. Mol Cell 46 : 187–199.
27. IijimaT, WuK, WitteH, Hanno-IijimaY, GlatterT, et al. (2011) SAM68 regulates neuronal activity-dependent alternative splicing of neurexin-1. Cell 147 : 1601–1614.
28. LukongKE, RichardS (2008) Motor coordination defects in mice deficient for the Sam68 RNA-binding protein. Behav Brain Res 189 : 357–363.
29. ParonettoMP, MessinaV, BarchiM, GeremiaR, RichardS, et al. (2011) Sam68 marks the transcriptionally active stages of spermatogenesis and modulates alternative splicing in male germ cells. Nucleic Acids Res 39 : 4961–4974.
30. ParonettoMP, MessinaV, BianchiE, BarchiM, VogelG, et al. (2009) Sam68 regulates translation of target mRNAs in male germ cells, necessary for mouse spermatogenesis. J Cell Biol 185 : 235–249.
31. RichardS, TorabiN, FrancoGV, TremblayGA, ChenT, et al. (2005) Ablation of the Sam68 RNA binding protein protects mice from age-related bone loss. PLoS Genet 1: e74 doi:10.1371/journal.pgen.0010074.
32. RichardS, VogelG, HuotME, GuoT, MullerWJ, et al. (2008) Sam68 haploinsufficiency delays onset of mammary tumorigenesis and metastasis. Oncogene 27 : 548–556.
33. ChawlaG, LinCH, HanA, ShiueL, AresMJr, et al. (2009) Sam68 regulates a set of alternatively spliced exons during neurogenesis. Mol Cell Biol 29 : 201–213.
34. CraigAM, KangY (2007) Neurexin-neuroligin signaling in synapse development. Curr Opin Neurobiol 17 : 43–52.
35. LoyaCM, Van VactorD, FulgaTA (2010) Understanding neuronal connectivity through the post-transcriptional toolkit. Genes Dev 24 : 625–635.
36. MisslerM, SudhofTC (1998) Neurexins: three genes and 1001 products. Trends Genet 14 : 20–26.
37. SiddiquiTJ, PancarogluR, KangY, RooyakkersA, CraigAM (2010) LRRTMs and neuroligins bind neurexins with a differential code to cooperate in glutamate synapse development. J Neurosci 30 : 7495–7506.
38. DalvaMB, McClellandAC, KayserMS (2007) Cell adhesion molecules: signalling functions at the synapse. Nat Rev Neurosci 8 : 206–220.
39. BoucardAA, ChubykinAA, ComolettiD, TaylorP, SudhofTC (2005) A splice code for trans-synaptic cell adhesion mediated by binding of neuroligin 1 to alpha - and beta-neurexins. Neuron 48 : 229–236.
40. ComolettiD, FlynnRE, BoucardAA, DemelerB, SchirfV, et al. (2006) Gene selection, alternative splicing, and post-translational processing regulate neuroligin selectivity for beta-neurexins. Biochemistry 45 : 12816–12827.
41. ChihB, GollanL, ScheiffeleP (2006) Alternative splicing controls selective trans-synaptic interactions of the neuroligin-neurexin complex. Neuron 51 : 171–178.
42. VenablesJP, KlinckR, KohC, Gervais-BirdJ, BramardA, et al. (2009) Cancer-associated regulation of alternative splicing. Nat Struct Mol Biol 16 : 670–676.
43. ParonettoMP, AchselT, MassielloA, ChalfantCE, SetteC (2007) The RNA-binding protein Sam68 modulates the alternative splicing of Bcl-x. J Cell Biol 176 : 929–939.
44. GalarneauA, RichardS (2009) The STAR RNA binding proteins GLD-1, QKI, SAM68 and SLM-2 bind bipartite RNA motifs. BMC Mol Biol 10 : 47.
45. RissoneA, MonopoliM, BeltrameM, BussolinoF, CotelliF, et al. (2007) Comparative genome analysis of the neurexin gene family in Danio rerio: insights into their functions and evolution. Mol Biol Evol 24 : 236–252.
46. PaylorR, ZhaoY, LibbeyM, WestphalH, CrawleyJN (2001) Learning impairments and motor dysfunctions in adult Lhx5-deficient mice displaying hippocampal disorganization. Physiol Behav 73 : 781–792.
47. WittenJT, UleJ (2011) Understanding splicing regulation through RNA splicing maps. Trends Genet 27 : 89–97.
48. XueY, ZhouY, WuT, ZhuT, JiX, et al. (2009) Genome-wide analysis of PTB-RNA interactions reveals a strategy used by the general splicing repressor to modulate exon inclusion or skipping. Mol Cell 36 : 996–1006.
49. LlorianM, SchwartzS, ClarkTA, HollanderD, TanLY, et al. (2010) Position-dependent alternative splicing activity revealed by global profiling of alternative splicing events regulated by PTB. Nat Struct Mol Biol 17 : 1114–1123.
50. ElliottDJ, BestA, DalglieshC, EhrmannI, GrellscheidS (2012) How does Tra2beta protein regulate tissue-specific RNA splicing? Biochem Soc Trans 40 : 784–788.
51. SudhofTC (2008) Neuroligins and neurexins link synaptic function to cognitive disease. Nature 455 : 903–911.
52. CalarcoJA, ZhenM, BlencoweBJ (2011) Networking in a global world: establishing functional connections between neural splicing regulators and their target transcripts. RNA 17 : 775–791.
53. HuZ, HomS, KudzeT, TongXJ, ChoiS, et al. (2012) Neurexin and Neuroligin Mediate Retrograde Synaptic Inhibition in C. elegans. Science 337 : 980–4.
54. HuelsenbeckJP, RonquistF (2001) MRBAYES: Bayesian inference of phylogenetic trees. Bioinformatics 17 : 754–755.
55. GuindonS, DufayardJF, LefortV, AnisimovaM, HordijkW, et al. (2010) New algorithms and methods to estimate maximum-likelihood phylogenies: assessing the performance of PhyML 3.0. Syst Biol 59 : 307–321.
56. KatohK, MisawaK, KumaK, MiyataT (2002) MAFFT: a novel method for rapid multiple sequence alignment based on fast Fourier transform. Nucleic Acids Res 30 : 3059–3066.
57. ChenT, BoisvertFM, Bazett-JonesDP, RichardS (1999) A role for the GSG domain in localizing Sam68 to novel nuclear structures in cancer cell lines. Mol Biol Cell 10 : 3015–3033.
58. AbascalF, ZardoyaR, PosadaD (2005) ProtTest: selection of best-fit models of protein evolution. Bioinformatics 21 : 2104–2105.
59. KearseM, MoirR, WilsonA, Stones-HavasS, CheungM, et al. (2012) Geneious Basic: An integrated and extendable desktop software platform for the organization and analysis of sequence data. Bioinformatics 28 : 1647–1649.
60. Schbath S. and Hoebeke M. (2011). R'MES: a tool to find motifs with a significantly unexpected frequency. In: biological sequences. In: Elnitski L, Piontkivska O, and Welch L, editors. Advances in genomic sequence analysis and pattern discovery. Science, Engineering, and Biology Informatics, vol. 7. World Scientific pp. 25–64.
61. GrellscheidS, DalglieshC, StorbeckM, BestA, LiuY, et al. (2011) Identification of evolutionarily conserved exons as regulated targets for the splicing activator tra2beta in development. PLoS Genet 7: e1002390 doi:10.1371/journal.pgen.1002390.
62. GrellscheidSN, DalglieshC, RozanskaA, GrellscheidD, BourgeoisCF, et al. (2011) Molecular design of a splicing switch responsive to the RNA binding protein Tra2beta. Nucleic Acids Res 39 : 8092–8104.
63. DeindlE (2001) 18S ribosomal RNA detection on Northern blot employing a specific oligonucleotide. Biotechniques 31 : 1250, 1252.
64. ElliottDJ, MillarMR, OgheneK, RossA, KiesewetterF, et al. (1997) Expression of RBM in the nuclei of human germ cells is dependent on a critical region of the Y chromosome long arm. Proc Natl Acad Sci U S A 94 : 3848–3853.
65. VenablesJP, VernetC, ChewSL, ElliottDJ, CowmeadowRB, et al. (1999) T-STAR/ETOILE: a novel relative of SAM68 that interacts with an RNA-binding protein implicated in spermatogenesis. Hum Mol Genet 8 : 959–969.
66. BourgeoisCF, PopielarzM, HildweinG, SteveninJ (1999) Identification of a bidirectional splicing enhancer: differential involvement of SR proteins in 5′ or 3′ splice site activation. Mol Cell Biol 19 : 7347–7356.
67. VenablesJP, BourgeoisCF, DalglieshC, KisterL, SteveninJ, et al. (2005) Up-regulation of the ubiquitous alternative splicing factor Tra2beta causes inclusion of a germ cell-specific exon. Hum Mol Genet 14 : 2289–2303.
Štítky
Genetika Reprodukční medicínaČlánek vyšel v časopise
PLOS Genetics
2013 Číslo 4
- Kazuistika – Perspektivy využití precizované medicíny v rámci personalizované specifické terapie onkologických pacientů
- Nobelova cena za chemii pro genetické nůžky: Objev, který změní naši budoucnost?
- Technologie na bázi RNA v klinické praxi: od přebarvených petúnií k terapii vzácných a dosud jen obtížně léčitelných chorob u lidí
- „Nepředstavovali jsme si, že náš výzkum povede přímo ke vzniku nových léků, dokonce ještě za našeho života“
- Bezplatné služby pro diagnostiku ATTRv amyloidózy pro kardiology
Nejčtenější v tomto čísle
- The G4 Genome
- Neutral Genomic Microevolution of a Recently Emerged Pathogen, Serovar Agona
- The Histone Demethylase Jarid1b Ensures Faithful Mouse Development by Protecting Developmental Genes from Aberrant H3K4me3
- The Tissue-Specific RNA Binding Protein T-STAR Controls Regional Splicing Patterns of Pre-mRNAs in the Brain
Zvyšte si kvalifikaci online z pohodlí domova
Mazová zátka a její řešení
nový kurzVšechny kurzy