
Functional 358Ala Allele Impairs Classical IL-6 Receptor Signaling and Influences Risk of Diverse Inflammatory Diseases
Inflammation, which is directly regulated by interleukin-6 (IL-6) signaling, is implicated in the etiology of several chronic diseases. Although a common, non-synonymous variant in the IL-6 receptor gene (IL6R Asp358Ala; rs2228145 A>C) is associated with the risk of several common diseases, with the 358Ala allele conferring protection from coronary heart disease (CHD), rheumatoid arthritis (RA), atrial fibrillation (AF), abdominal aortic aneurysm (AAA), and increased susceptibility to asthma, the variant's effect on IL-6 signaling is not known. Here we provide evidence for the association of this non-synonymous variant with the risk of type 1 diabetes (T1D) in two independent populations and confirm that rs2228145 is the major determinant of the concentration of circulating soluble IL-6R (sIL-6R) levels (34.6% increase in sIL-6R per copy of the minor allele 358Ala; rs2228145 [C]). To further investigate the molecular mechanism of this variant, we analyzed expression of IL-6R in peripheral blood mononuclear cells (PBMCs) in 128 volunteers from the Cambridge BioResource. We demonstrate that, although 358Ala increases transcription of the soluble IL6R isoform (P = 8.3×10⁻²²) and not the membrane-bound isoform, 358Ala reduces surface expression of IL-6R on CD4+ T cells and monocytes (up to 28% reduction per allele; P≤5.6×10⁻²²). Importantly, reduced expression of membrane-bound IL-6R resulted in impaired IL-6 responsiveness, as measured by decreased phosphorylation of the transcription factors STAT3 and STAT1 following stimulation with IL-6 (P≤5.2×10⁻⁷). Our findings elucidate the regulation of IL-6 signaling by IL-6R, which is causally relevant to several complex diseases, identify mechanisms for new approaches to target the IL-6/IL-6R axis, and anticipate differences in treatment response to IL-6 therapies based on this common IL6R variant.
Published in the journal:
. PLoS Genet 9(4): e32767. doi:10.1371/journal.pgen.1003444
Category:
Research Article
doi:
https://doi.org/10.1371/journal.pgen.1003444
Summary
Inflammation, which is directly regulated by interleukin-6 (IL-6) signaling, is implicated in the etiology of several chronic diseases. Although a common, non-synonymous variant in the IL-6 receptor gene (IL6R Asp358Ala; rs2228145 A>C) is associated with the risk of several common diseases, with the 358Ala allele conferring protection from coronary heart disease (CHD), rheumatoid arthritis (RA), atrial fibrillation (AF), abdominal aortic aneurysm (AAA), and increased susceptibility to asthma, the variant's effect on IL-6 signaling is not known. Here we provide evidence for the association of this non-synonymous variant with the risk of type 1 diabetes (T1D) in two independent populations and confirm that rs2228145 is the major determinant of the concentration of circulating soluble IL-6R (sIL-6R) levels (34.6% increase in sIL-6R per copy of the minor allele 358Ala; rs2228145 [C]). To further investigate the molecular mechanism of this variant, we analyzed expression of IL-6R in peripheral blood mononuclear cells (PBMCs) in 128 volunteers from the Cambridge BioResource. We demonstrate that, although 358Ala increases transcription of the soluble IL6R isoform (P = 8.3×10⁻²²) and not the membrane-bound isoform, 358Ala reduces surface expression of IL-6R on CD4+ T cells and monocytes (up to 28% reduction per allele; P≤5.6×10⁻²²). Importantly, reduced expression of membrane-bound IL-6R resulted in impaired IL-6 responsiveness, as measured by decreased phosphorylation of the transcription factors STAT3 and STAT1 following stimulation with IL-6 (P≤5.2×10⁻⁷). Our findings elucidate the regulation of IL-6 signaling by IL-6R, which is causally relevant to several complex diseases, identify mechanisms for new approaches to target the IL-6/IL-6R axis, and anticipate differences in treatment response to IL-6 therapies based on this common IL6R variant.
Introduction
Originally identified as a B-cell differentiation factor, interleukin-6 (IL-6) is now recognized as one of the most pleiotropic cytokines in humans. IL-6 can activate a wide-range of cell types and is recognized as a critical regulator of acute inflammatory reactions [1]. In addition, IL-6 plays a key role in controlling the activation and differentiation of T-cell responses, promoting a pro-inflammatory environment, which has been associated with the pathogenesis of several autoimmune and inflammatory diseases in humans [2].
Binding of IL-6 to the membrane-bound IL-6 receptor (IL-6R) induces homodimerization with its co-receptor gp130, resulting in the phosphorylation of the transcription factors STAT3 and STAT1 (classical signaling) [3]. Alternatively, a circulating soluble form of IL-6R (sIL-6R), if bound to IL-6, is able to stimulate cells expressing gp130 (“trans-signaling”), even in the absence of membrane-bound IL-6R [4]. The role of genetic variation in IL6R in the etiology of human disease has been highlighted by genetic studies reporting the association of variants in the gene with the risk of several diseases with an inflammatory component, including coronary heart disease (CHD) [5]–[7], rheumatoid arthritis (RA) [8], atrial fibrillation (AF) [9], abdominal aortic aneurysm (AAA) [10] and asthma [11]. A common (MAF 30–40% in European and Asian HapMap populations) non-synonymous variant Asp358Ala in IL6R (rs2228145 A>C, previously rs8192284) has been suggested to be the causal variant at this locus, because of its strong correlation with circulating concentrations of sIL-6R [12]. However, the effect of this variant on classical IL-6R signaling remains unclear. Here we demonstrate that the 358Ala allele regulates IL-6R surface expression at the protein level in specific immune cell subsets, resulting in altered IL-6 signaling. These findings clearly demonstrate the effect of Asp358Ala in the regulation of classical IL-6 signaling and provide further insight into the functional mechanism underpinning the association of this genetic variant with human diseases.
Results
Given the association of rs2228145 with a variety of human inflammatory diseases, we assessed its association with type 1 diabetes (T1D). We found evidence for a protective effect of 358Ala in 8,371 T1D patients and 10,092 unrelated healthy controls (P = 0.0092, OR [95% CI] = 0.94 [0.91–0.99]; Figure S1). We replicated these findings in an independent collection of 3,771 T1D families (P = 0.0035, OR [95% CI] = 0.92 [0.87–0.97]; Figure S1). These data implicate the IL6R locus in the etiology of T1D, with a consistent protective effect as reported for CHD, RA, AF and AAA (Figure S1).
The minor allele of rs2228145 (358Ala) has been shown to be strongly associated with increased concentrations of circulating sIL-6R [5], [12] and has, therefore, been assumed to be the causal allele in the IL6R locus. To confirm that rs2228145 is the major determinant of circulating sIL-6R levels in IL6R, and to identify potential additional genetic determinants of sIL-6R levels at this locus, we correlated circulating sIL-6R concentrations measured in 3,605 individuals with 45 SNPs genotyped at the IL6R locus using the Illumina ImmunoChip [13] (Figure 1A and Table S1). Twenty four SNPs were associated with sIL-6R at P<5×10⁻⁸, including rs2228145, which had the strongest evidence of association (chi2(2df) = 2296, P<10−300). These differences equated to an increase of approximately 35% in the concentrations of sIL-6R for each copy of the 358Ala allele (Figure 1B and Table S2). Using a forward stepwise regression analysis, two additional intronic SNPs, rs4329505 (r2 = 0.113; D′ = 1 with rs2228145 in CEU) and rs1386821 (r2 = 0.001; D′ = 0.064 with rs2228145 in CEU) were both found to be independently associated with circulating sIL-6R (P = 7.4×10⁻²⁹ and P = 5.1×10⁻¹¹). However, their effects were substantially smaller (R2 = 1.1% and 0.4%, respectively) compared to R2 = 29.3% for rs2228145 (Figure 1B and Table S2).

Previous studies support two independent processes for the generation of circulating sIL-6R: i) transcriptional regulation of a differentially spliced isoform (ds-IL6R; Figure 1A) [14] and ii) increased proteolytic cleavage of the membrane-bound receptor [15], [16]. While it has been speculated that 358Ala affects circulating sIL-6R through both of these processes, there is no comprehensive evidence on the mechanism of the variant, especially with regards to surface IL-6R expression and signaling.
To investigate the effect of rs2228145 on the transcriptional regulation of IL6R in human primary cells, we designed a qPCR assay to measure the relative expression levels of both the full length IL6R isoform (fl-IL6R), encoding the membrane-bound receptor, and the ds-IL6R isoform, which lacks exon 9 containing the IL-6R trans-membrane domain, and hence encodes sIL-6R. Importantly, in PBMCs from 88 healthy CBR donors (Table S3), the expression of fl-IL6R was not significantly different according to rs2228145 genotype (P = 0.8, Figure 2A). Consistent with a previous report on multiple myeloma plasma cells [17], there was a significant increase of ds-IL6R expression in carriers of the 358Ala allele (P = 8.3×10⁻²², Figure 2B). The ratio of ds-IL6R transcript to the fl-IL6R isoform was small (approximately 0.03 in Asp/Asp homozygotes), as determined by normalizing the expression of the ds-IL6R to the fl-IL6R isoform (data not shown). These data indicate that the skipping of exon 9 is a rare event, which explains why the expression of the fl-IL6R is not affected by genotype at rs2228145. Neither of the other two SNPs in IL6R that showed an independent association with circulating sIL-6R were associated with ds-IL6R expression, after accounting for rs2228145 (Table S4). However, considering the relatively small effect sizes for the association of these two SNPs with circulating sIL-6R, our study is likely to be underpowered to detect mRNA expression effects secondary to rs2228145.

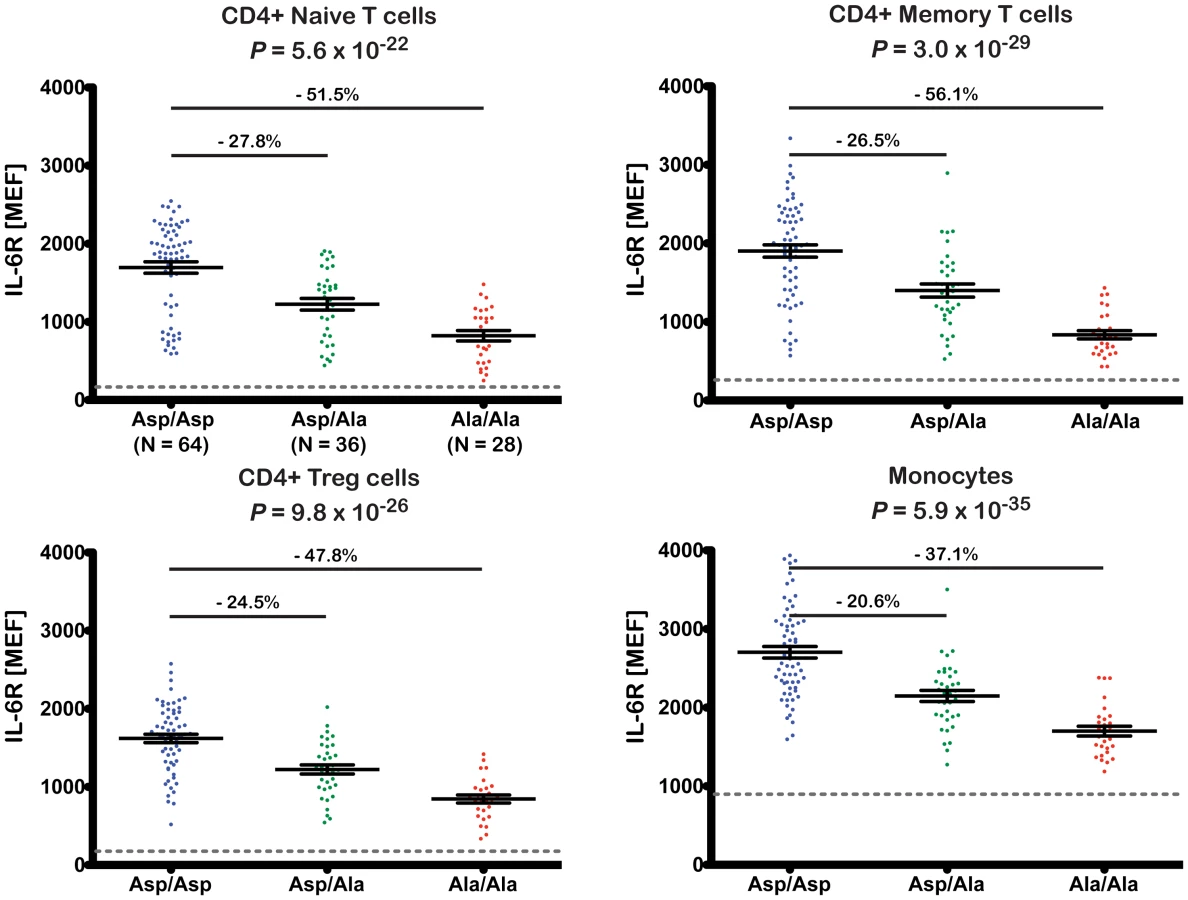
The strong effect of rs2228145 in the regulation of circulating sIL-6R has led to the hypothesis that this is the functional mechanism underlying the disease association of this variant. However, very little is known about the potential role of this genetic variant in the regulation of surface expression of IL-6R at the protein level, particularly in immune cell subsets expressing high levels of IL-6R, and whether this could affect classical IL-6R signaling. As 358Ala did not affect the expression of membrane-bound IL-6R at the mRNA level, we next assessed the effect of this variant on the expression of surface IL-6R in individual cells. We used polychromatic flow cytometry to measure the surface expression of IL-6R in PBMCs from 128 Cambridge BioResource donors (Table S5) on the four immune cell subsets of PBMCs which we found to express IL-6R (Figure S2): CD4+ naïve and memory T cells, regulatory T cells (Tregs) and monocytes.
The 358Ala allele was strongly associated with reduced surface levels of IL-6R on all four immune cell subsets (P≤5.6×10⁻²²; Figure 3). The effect sizes across the different cell types equated to a per-allele reduction of approximately 20.6–27.8% (Figure 3). To exclude the possibility that the observed results arose from a technical artifact caused by an altered epitope induced by or in linkage disequilibrium (LD) with rs2228145, we confirmed IL-6R measurements using a different anti-IL-6R antibody clone (Figures S3 and S4 and Methods). As expected, we found no evidence of genotype-specific differences on the surface expression of the gp130 co-receptor (Figure S5).
Given the reduction of membrane-bound IL-6R expression in 358Ala carriers, we hypothesized that 358Ala would impair classical IL-6 signaling. We quantified the proportion of cells phosphorylating STAT3 and STAT1 in response to IL-6 stimulation in a subset of 14 Asp/Asp and 14 Ala/Ala homozygous donors (Table S6). While there was no significant difference between genotype groups in the absence of IL-6, carriers of 358Ala showed a significantly lower frequency of pSTAT activation upon IL-6 stimulation in the three assessed cell types: CD4+ naïve T cells (PgXd(pSTAT3) = 8.6×10−40, PgXd(pSTAT1) = 5.9×10⁻¹⁰), CD4+ memory T cells (PgXd(pSTAT3) = 5.1×10⁻¹⁵, PgXd(pSTAT1) = 5.2×10⁻⁷) and monocytes (PgXd(pSTAT3) = 3.4×10⁻¹⁵) (Figure 4; for modeled mean differences see Figure S6). The intracellular immunostaining method did not allow Treg discrimination (see Methods). Monocytes were somewhat less sensitive to IL-6 stimulation than the other two cell types, and did not show any noticeable dose response effect with pSTAT1 or genotype-dependent differences (P = 0.06). Qualitatively similar results were observed when assessing the MEF values of pSTAT3 and pSTAT1 induced in the three cell populations (Figure S7). In addition, we found a strong correlation between the surface levels of IL-6R and pSTAT3 activation at the dose found to have the strongest genotype-dependent differences in pSTAT3 activation in response to IL-6 stimulation (R2>0.7 in CD4+ naïve and memory T cells and R2 = 0.6 in monocytes; Figure S8). Further supporting the specificity of surface levels of IL-6R on the observed pSTAT signaling differences, we found no genotype-specific effect on the activation of pSTAT3 or pSTAT1 in response to IL-27, which shares the gp130 co-receptor or on the activation of pSTAT3 in response to IL-10, which signals through a different receptor (data not shown). These data are in agreement with a recent report showing that IL-6R-mediated pSTAT3 or pSTAT1 signaling differences in patients with relapsing-remitting multiple sclerosis were not recapitulated following stimulation with IL-10 or IL-27 [18]. Thereby, our study corroborates and improves on recent indirect evidence, showing that the expression of IL-6 target genes after stimulation with IL-6 is associated with a proxy variant in high LD with rs2228145 [10].

Interestingly, IL-6 is known to induce the differentiation of the STAT3-dependent Th17 lineage from naïve T cells [19]–[21] and inhibit FOXP3 expression [22], [23]. In our study we did not find any evidence for an effect of rs2228145 on the homeostatic frequencies of the four cell types studied (CD4+ naïve and memory T cells, Tregs and monocytes; Table S7). However, an effect on differentiation of naïve T cells under specific Th17 polarizing and Treg inducing conditions cannot be excluded. The contrasting role of Th17 cells and Tregs in the regulation of inflammation is becoming increasingly apparent [24], and provides a hypothesis for the protective role of 358Ala in the pathogenesis of human inflammatory diseases.
Discussion
The accumulating evidence linking the Asp358Ala non-synonymous variant with risk of multiple human diseases underscores the relevance of IL-6 signaling in the etiology of inflammatory diseases. In this study, we provide evidence for the association of the minor 358Ala allele of this variant with protection from T1D. While the association was not at a GWAS level of significance (for which 22,000 cases and controls would be required to have 80% power; Table S8) the association was replicated in two independent sample sets with consistent effect estimates as reported for RA, CHD, AF, and AAA. Furthermore, we have confirmed that the 358Ala allele is associated with an increase (of approximately 35%) in the concentrations of circulating sIL-6R and demonstrated that while rs2228145 is the major genetic determinant for this trait in the IL6R locus, there are two additional variants with small independent effects.
Most importantly, we provided comprehensive evidence for the molecular mechanism of the 358Ala variant. The lack of an association between 358Ala and expression of the mRNA encoding the membrane-bound form of IL-6R, combined with the allele's strong association with reduced surface IL-6R expression at the protein level, suggests that 358Ala exerts an effect on proteolytic cleavage of the membrane-bound receptor independent of its effect on alternative splicing. Increased shedding of surface IL-6R in carriers of the 358Ala allele could be interpreted as a mechanism to dampen chronic classical IL-6 signaling and prevent exacerbated IL-6-driven inflammation, which is concordant with our results.
Our findings that 358Ala regulates surface expression of IL-6R were in contrast to a previous study using lymphoblastoid cell lines [12], which did not find differences in surface IL-6R expression according to rs2228145. There are, however, several potential reasons for this discrepancy. Firstly, while we determined IL-6R surface expression in specific cell subtypes expressing high levels of IL-6R, the previous study was performed on EBV-transformed B-cell lymphoblastoid lines, with very low or no expression of IL-6R, which are therefore unlikely to show any genotype dependent differences. Secondly, whilst our study used primary cells, which were frozen directly after collection, the previous study employed immortalized cell lines. Cell culturing and immortalization processes are likely to have influenced expression of the IL-6R and potentially also enzymes required for proteolytic cleavage of IL-6R. This was supported by our observation that culturing PBMCs, even for a very short period reduces surface expression of IL-6R (data not shown).
Thus, we have provided the first clear evidence that the common non-synonymous variant rs2228145 regulates the balance of surface and sIL-6R, and also affects the responsiveness of immune cells to IL-6 stimulation. This mechanism underpins the effect of 358Ala on the IL-6/IL-6R pathway and has implications for our understanding of the role of IL-6 signaling in the etiology of human disease and therapeutic targeting of this signaling pathway.
Inflammation has been implicated in the etiology of RA, AF, AAA, T1D and CHD, including reports of higher circulating levels of IL-6 preceding the onset of some of these conditions [25], [26]. 358Ala is associated with higher circulating IL-6 levels [5], [6], [12], [27], but yet protective in these diseases. This apparent paradox may be explained in two ways. Firstly, given our finding of decreased IL-6R surface expression and signaling with carriage of 358Ala, it is likely that the increase in circulating IL-6 is an indirect effect resulting from reduced IL-6 clearance through membrane-bound IL-6R in the liver [28]. This interpretation is concordant with the observation of lower circulating levels of C-reactive protein [5], [6], [29] and fibrinogen [5], [6], [30], [31], liver-derived markers of systemic inflammation, in carriers of 358Ala. Secondly, in the circulation, sIL-6R and sgp130 are in molar excess over IL-6 and any secreted IL-6 will therefore bind to sIL-6R, which will subsequently bind to sgp130, rendering IL-6 inactive [32]. The 358Ala associated increase in sIL-6R will therefore lead to an increased IL-6 buffering capacity of the circulation, thus explaining the increase in (inactive) IL-6 levels, as observed for 358Ala. Therefore, it is likely that the observed reductions in IL-6 classic signaling in carriers of 358Ala in this study may be even more pronounced under physiological conditions, where IL-6 can be inactivated by the sIL-6R/gp130 buffer system. Interestingly, it has been shown that monocytes isolated from long-term T1D patients spontaneously produce increased concentrations of IL-6, which has been linked to the differentiation of pathogenic Th17 cells [33]. Under these conditions, reduced classical IL-6 signaling could protect from chronic inflammation and differentiation of Th17 cells, consistent our finding of reduced risk of T1D in carriers of the 358Ala allele.
In contrast to the strong effect of 358Ala on classical IL-6 signaling, the effect of this variant on trans-signaling is less clear, since the nature of the samples available for this study did not enable us to investigate trans-signaling. Although we confirmed that 358Ala increases the levels of the trans-signaling mediator sIL-6R in the circulation, a material effect on systemic trans-signaling activity is unlikely, since the vast majority of the IL-6/sIL-6R complexes will be bound to the natural inhibitor sgp130 [3], [32] and, therefore, be inactive. This is consistent with the protective effect of 358Ala in RA, which mirrors the clinical effect of tocilizumab, an anti-IL-6R agent that blocks both classic and trans-signaling [34]. However, the effects of 358Ala on sIL-6R generation may be relevant in the local context of specific tissues. In the lung, for example, experimental evidence in mice suggests distinct roles for classic and trans-IL-6 signaling in the progression of airway inflammation and asthma [35]. While classic signaling appears responsible for regulatory T-cell suppression, trans-signaling seems to promote T helper 2 cell polarization in the lung. IL-6R has been shown to be expressed in the epithelium, smooth muscle and vascular endothelium of human airways, and in macrophages and granulocytes of bronchoalveolar lavage fluid (BALF) [36]. Soluble IL-6R levels in BALF are elevated in asthmatic patients compared to controls, and are elevated further upon allergen challenge [35], indicating an important role of sIL-6R in the context of the lung and associated tissues. Consistent with these findings, 358Ala is also associated with an increased severity of asthma [36]. Future studies examining the effects of this variant on the lung and associated tissues are therefore warranted.
More generally, as our findings support a causal role for classical IL-6 signaling in CHD, they intensify interest in recently-launched phase III trials of anti-inflammatory agents in the secondary prevention of CHD [37]–[40]. Furthermore, our findings, in conjunction with genetic associations with RA and CHD, and now T1D at the same locus, suggest IL-6 signaling pathways as a potential mechanistic link between these conditions, with immediate clinical relevance given the increased risk of CHD in RA [41], [42] and T1D patients [43], [44].
Our findings have established that a common variant in IL6R, previously known to be associated with several common complex diseases, has specific and important effects on IL-6 signaling. As the IL-6 pathway is a major therapeutic target for several human diseases [45], [46], our findings should inform the clinical development of IL-6 inhibitors and encourage exploration of pharmacogenetic or stratified medicine approaches that exploit common functional genetic variation in IL6R to optimize targeting and dosing of such agents in people with different genetic profiles.
Methods
Subjects
All T1D patients were under 17 years of age at diagnosis and recruited from across Great Britain and have been described previously [47]. Controls were obtained from the British 1958 Birth Cohort and the Wellcome Trust Case-Control Consortium UK Blood service Common Control (UKBS) sample collection [48], [49] both of which were recruited from across Great Britain and geographically matched to cases in tests for association with T1D.
All 3,771 T1D families were of white European decent. 403 multiplex (affected sibling pair) families were from the Diabetes UK Warren I collection; 43 simplex families from Yorkshire, Great Britain; 211 multiplex/simplex families from Northern Ireland; 275 multiplex families were from the Human Biological Data Interchange; 956 multiplex/simplex families from Finland; 215 simplex families from Romania; the remaining 1,668 multiplex families were made available through the Type 1 Diabetes Genetics Consortium.
In addition to 1,761 T1D cases and 1,030 British Birth cohort controls, 2,221 plasma samples were randomly selected from blood donors who joined the Cambridge BioResource during their local blood donation sessions at NHS Blood and Transplant, for measurement of circulating sIL-6R levels (1,034 recruited in 2007, BR4000 and 1,187 recruited in 2009, BR8000). All subjects were of white European ancestry.
Ethics statement
All samples and information were collected with written and signed informed consent. The study was approved by the local Peterborough and Fenland research ethics committee for the project entitled: ‘An investigation into genes and mechanisms based on genotype-phenotype correlations in type 1 diabetes and related diseases using peripheral blood mononuclear cells from volunteers that are part of the Cambridge BioResource’ (05/Q0106/20).
Genotyping
Samples for sIL-6R analysis were genotyped using the Illumina ImmunoChip platform [13]. Individuals for the T1D association analysis (8,371 T1D patients and 10,092 healthy controls), T1D family collections and all Cambridge BioResource volunteers selected for cell-based experiments were genotyped at rs2228145 using TaqMan (Applied Biosystems).
Soluble IL-6R Europium-Streptavidin ELISA
Circulating sIL-6R concentrations were measured using a highly sensitive non-isotopic time-resolved fluorescence ELISA assay based on the dissociation-enhanced lanthanide fluorescent immunoassay technology (DELFIA; PerkinElmer). Test plasma samples diluted 1∶20 in PBS+10% FBS were measured in duplicate on 384-well MaxiSorp microtiter plates (Nunc), coated with 1 µg/ml monoclonal anti-human IL-6R antibody (clone 17506; RD Systems). Detection was performed using a biotinylated mouse anti-CD126 monoclonal antibody (clone M182, BD Biosciences) diluted to a final concentration of 100 ng/ml in PBS+10% FBS and a Europium-Streptavidin detection solution (PerkinElmer), diluted in PBS+0.05% tween, 1% BSA, 7 µg/ml DTPA to a final concentration of 0.05 µg/ml. Quantification of test samples was obtained by fitting the readings to a human recombinant IL-6Rα (RD systems) serial dilution standard curve plated in quadruplicate on each plate.
Relative IL6R mRNA expression by RT–qPCR
mRNA expression was measured in 88 healthy CBR donors. cDNA was generated from total RNA isolated from peripheral blood mononuclear cells (PBMCs) as described previously [50]. Relative expression of the fl-IL6R and ds-IL6R isoforms was determined by real-time quantitative PCR (TaqMan, Applied Biosystems). We designed two specific forward primers to hybridize to unique exon boundaries of IL6R (fl-IL6R: exons 9/10; ds-IL6R: exons 8/10) and a common reverse primer and probe to amplify the two IL6R isoforms. Primers and probe sequences are summarized in Table S9. Full-length IL6R and ds-IL6R expression was normalized to the β2 microglobulin housekeeping gene. In addition, ds-IL6R was normalized to fl-IL6R to allow approximation of the ds-IL6R/fl-IL6R ratio. All probes were labeled with FAM and a non-fluorescent quencher (BHQ1; Sigma). PCR efficiency and the amplification factor for each reaction were calculated using a 1∶2 serial dilution curve of 8 random cDNA samples. The PCR efficiency was 100.2%, 94.2% and 97.3% and the resulting amplification factor was 2.0024, 1.9423 and 1.9735 for the B2M, fl-IL6R and ds-IL6R reactions, respectively [51]. Relative gene expression levels were calculated using the formula af∧ΔCT, with af representing the amplification factor of the respective PCR reaction and ΔCT the difference in cycle threshold between the target and control transcripts.
Surface immunostainings
128 samples for flow cytometry experiments were selected according to rs2228145 genotype from a CBR subset with available cryopreserved PBMCs (Table S5). To reduce the effects of day-to-day variation, where possible, rare homozygotes (Ala/Ala) were matched to one or more common homozygotes and up to three heterozygotes, from the same 10-year age band and sex. Batches of up to ten samples were assembled from the matched groups, maximizing diversity of the age, sex and T1D distribution within each batch. Since there were no differences in IL-6R surface expression between T1D patients and controls, we included T1D cases in the primary analyses to increase power. Primary analyses were adjusted for T1D status, because limited availability of Asp/Asp and especially Ala/Ala T1D cases resulted in oversampling of T1D cases in the heterozygote group (Table S5). All assays were performed blinded to sample genotype and disease status.
PBMCs were isolated and cryopreserved (10×106 cells/aliquot) as described previously [52]. Cryopreserved PBMCs were thawed in a 37°C water bath and resuspended in X-Vivo (Lonza)+10% heat-inactivated, filtered human AB serum (Sigma) in a drop-wise fashion and then washed in X-Vivo+1% AB serum. 5×10⁵ cells were stained for 1 h at 4°C (using the surface immunostaining Panel 1 detailed in Table S10), washed with BD CellWash (BD Biosciences) and then fixed with freshly prepared BD CellFix (BD Biosciences). To exclude the possibility that an altered IL-6R epitope induced by the Asp358Ala polymorphism could affect the binding affinity of the anti-IL6R antibody used in this study (clone UV4), we designed a second surface immunostaining panel (Panel 2; Table S10). There was a near-perfect correlation between the two anti-IL-6R clones used in this study in the three immune cell subsets that were directly comparable (Spearman rho >0.93; Figure S3). We found that measurements of IL-6R expression were reproducible between two independent measurements (Spearman rho >0.71; Figure S9).
We also performed surface staining of random PBMC donors using global lineage discrimination markers, including α-CD19, α-CD8 and α-CD56 to assess surface IL-6R and gp130 expression levels on the main immune cell subsets in addition to CD4 T cells and monocytes, which we have focused on this study.
Intracellular pSTAT3 and pSTAT1 immunostainings
IL-6 signaling experiments employed a subset of the matched groups for the surface immunostainings, consisting of one Asp/Asp homozygote and one Ala/Ala homozygote pair from each matched group, for those where additional cryopreserved PBMC aliquots were available. All assays were performed blinded to sample genotype and disease status.
To assess IL-6 responsiveness, cryopreserved PBMCs were thawed as described above and aliquots of 5×10⁵ cells resuspended in 100 µl X-Vivo+1% AB serum, plated in a U-bottom 96-well cell culture plate (Cellstar) and rested for 10 min at 37°C before stimulation. Following stimulation with 0, 0.1, 1 or 10 ng/ml of IL-6 for 10 min (37°C, 5% CO2), cells were immediately fixed with BD phosphoflow lyse/fix buffer (BD Biosciences) to maintain their phosphorylation state and incubated for 10 min (37°C, 5% CO2). After washing with PBS+0.2% BSA, cells were permeabilized with 100%, ice cold, methanol and incubated at 4°C for 30 min. Cells were then washed with PBS+0.2%, and blocked for 15 min with PBS+1% BSA. Staining was performed as described above using the intracellular immunostaining Panel 1 (Table S10) and cells resuspended in PBS+0.2% BSA. The anti-CD127 and anti-CD25 antibodies required for Treg discrimination were not compatible with the methanol fixation and, therefore, not included in the intracellular immunostaining panel.
Flow cytometry
Immunostained samples were analyzed using a BD Fortessa (BD Biosciences) flow cytometer with FACSDiva software (BD Biosciences). Flow cytometry data were exported in the format 3.0 and analyzed using FlowJo (Tree Star, Inc.). Gating strategy was performed as depicted in Figure S2. Doublet exclusion was performed for both CD4+ T cell and monocyte populations. Cyto-Cal calibration beads (Thermo Scientific) were used to assess instrument stability and to convert individual mean fluorescence intensity (MFI) values into normalized molecules of equivalent fluorochrome (MEF) values as described previously [53]. Distribution of the unstained (FMO; fluorescence minus one), isotype control and stained test samples using the anti-IL-6R UV4 clone (surface immunostaining Panel 1) or anti-gp130 antibodies (surface immunostaining Panel 2) are depicted in Figure S10.
Statistical analyses
Statistical analyses were performed using Stata (www.stata.com), regional association plots were produced by LocusZoom [54].
T1D association analysis
All SNPs were in Hardy-Weinberg equilibrium in controls (P>0.01). Association with T1D was analyzed in a logistic regression model with disease status as outcome variable, and counts of the SNP minor allele as independent variable (i.e. assuming a multiplicative allelic effects model on the odds ratio scale). Cases and controls were stratified according to 12 broad geographical regions to allow for variation in allele frequency and disease incidence across the United Kingdom. Families were analyzed by generating cases and matched pseudo-controls and analyzing them with conditional logistic regression [55]. A multiplicative allelic effects model on the odds ratio scale was assumed.
Association analysis of circulating sIL-6R
To ensure normality, circulating sIL-6R was log10 transformed for all analyses. Each collection was tested for batch effects of the sIL-6R assay and potential covariates (Table S1). Linear regression was used with log10(sIL-6R) as outcome and covariates as independent variables. No between-collection variability in log10(sIL-6R) remained once within-collection batch effects were accounted for. Association of log10(sIL6R) with SNPs in the IL6R region was tested in a regression model with log10(sIL6R) as dependent variable and SNP, assuming an additive allelic effects model, as independent variable. All necessary batch effects were included. Significance was assessed with a likelihood ratio test and P<5×10⁻⁸, a typical genome-wide significance threshold, was considered significant. Validity of the additive effects model was verified by comparison with a model that assumed no specific mode of inheritance using a likelihood ratio test and this model was used in preference to the additive effects model, where suggestive evidence of deviation from additivity was obtained. Additional independent SNP effects were tested in a forward stepwise regression with use of a likelihood ratio test and P<1×10⁻⁴ was considered significant.
Analysis of mRNA and surface IL-6R expression with rs2228145
Using Levene's robust test for the equality of variances between groups applied to the residuals, the mRNA expression data was found to have unequal variances by genotype group i.e. they were heteroscedastic (P<0.05). Therefore, inferences based on ordinary linear regression could be biased. Consequently, analysis of the mRNA expression data was performed using a multilevel mixed-effects linear regression model with expression (relative to B2M or fl-IL6R) as the dependent variable and rs2228145 genotype as the independent variable, but estimating the residual errors for each individual genotype group separately. This allows for different variability of mRNA expression for each genotype group. Storage plate was included as a covariate.
Similarly, surface IL-6R expression, could not be analyzed using ordinary linear regression as individuals were sampled according to genotype group (non-random sampling) and found to have unequal variances across genotype groups using Levene's test, P<0.05. Therefore a multilevel mixed-effects linear regression model was adopted, with surface IL-6R expression (MEF) as dependent variable and rs2228145 genotype as the independent variable, again estimating the residual errors for each individual genotype group separately. Age (coded in 10-year bands), sex, T1D status, and measurement batch were included as covariates.
P-values for genotype effects (for both mRNA and surface expression) correspond to those of an additive allelic effects model of inheritance. The model residuals were normally distributed, and the additivity assumption held (tested by comparing the allelic effects test with a model that assumed no specific mode of inheritance).
Analysis of IL-6 stimulation with Asp358Ala
The data from the cytokine (IL-6) stimulation experiments is measured on the cellular level (i.e. number of pSTAT positive cells), but the experimental sampling units were the individuals and consequently, each individual has repeated measures (at different concentrations of IL-6). Observations are likely to be correlated within individuals (hierarchical), and these within-subject correlations needed to be accounted for in the analysis. Therefore, the number of pSTAT positive cells in response to cytokine stimulation was modeled using a multilevel mixed-effects logistic regression model. We were interested in the proportion of cells responding to cytokine stimulation measured by pSTAT phosphorylation. Therefore, proportion of pSTAT positive cells to the proportion of pSTAT negative cells in the parent population was used as the dependent variable in the regression model. Genotype and cytokine dose (modeled as fixed effect) were included as dependent variables in the logistic regression model. Cytokine dose was also included as a random effect to account for the within subject correlation. This allowed us to test genotype dependent differences in the control group and to model the IL-6 dose-response effect of cytokine stimulation, respectively. To test for genotype dependent differences in response to cytokine stimulation interaction terms for genotype and cytokine dose were added to the regression model as independent (fixed effects) variables and their effect on the primary IL-6 stimulation experiments (Figure 4) assessed using a Wald test. The test reflects differences between genotype groups in pSTAT activation compared to control across doses. The variances and covariances were distinctly estimated across cytokine doses.
P<0.004 was considered significant (α = 0.05 Bonferroni corrected for 12 tests, two mRNA transcripts, four cell types for surface staining, three (cell types)×two (STAT proteins)).
Assay characteristics and variation
For the sIL-6R assay, the average CV between duplicate samples was relatively consistent for each batch, and averaged 8.58% in the entire study (samples with CV>15% were excluded from the analyses). Technical repeatability was examined by measuring the same 16 samples within each of the 6 batches. The average CV for the 16 repeats performed in each batch was 8.1% (range 6.86% to 20.81%), which suggests these results were as consistent as duplicate samples within the same plate (hence no obvious batch effects). An average R2 of 0.9995 (with a range of 0.9975 to 1) was determined for the standard curves across all batches. The minimum and maximum detectable concentrations within the linear range were given as 4.69 ng/ml and 300 ng/ml respectively. All measured plasma samples were within these values, with a minimum of 8.3 ng/ml and a maximum of 133.4 ng/ml.
For qPCR measurements, test samples were measured in duplicate, with an average intra-assay CV% of 0.97%, 0.67% and 0.78% between replicates for the B2M, fl-IL6R and ds-IL6R reactions, respectively (data not shown). The flow cytometer was found to be very stable during the entire experimental procedure for both the PE and APC quantification channels (average CV% for the five fluorescent bead populations = 1.77% and 4.63%, respectively).
Anti-IL-6R competition assays
For the anti-IL-6R competition assays, aliquots of 5×10⁵ PBMCs from a donor with high levels of surface IL-6R expression were resuspended in 100 µl X-Vivo+1% AB serum and plated in a U-bottom 96-well cell culture plate (Cellstar). Cells were incubated with 0, 0.01, 0.1 or 1 µg of unconjugated anti-IL-6R UV4 antibody, unspecific mouse IgG1κ control, or with 1 µg of the unconjugated 17506 anti-IL-6R clone used in the ELISA assays for 1 h at 4°C. Cells were then washed with PBS+0.2% BSA (Sigma) and stained using either the surface immunostaining Panel 1 or Panel 2 as described above. The unconjugated UV4 monoclonal antibody (mAb) was unable to block binding of labeled BL-126. Conversely, the anti-IL-6R clone (17506), used to measure sIL-6R, only inhibited BL-126 staining (Figure S3), showing that both clones bind to the same or adjacent epitopes. Since Ala358 was associated with increased concentrations of sIL-6R measured by ELISA using the 17506 mAb, these data demonstrate that, not only the UV4 and BL-126 clones are recognizing different epitopes, but also that the genotype-specific differences in IL-6R expression could be not be due to structural differences affecting antibody affinity caused by Asp358Ala.
Supporting Information
Zdroje
1. Van SnickJ (1990) Interleukin-6: An Overview. Annual Review of Immunology 8 : 253–278.
2. NeurathMF, FinottoS (2011) IL-6 signaling in autoimmunity, chronic inflammation and inflammation-associated cancer. Cytokine & Growth Factor Reviews 22 : 83–89.
3. KallenK-J (2002) The role of transsignalling via the agonistic soluble IL-6 receptor in human diseases. Biochimica et Biophysica Acta (BBA) - Molecular Cell Research 1592 : 323–343.
4. ChalarisA, GarbersC, RabeB, Rose-JohnS, SchellerJ (2011) The soluble Interleukin 6 receptor: Generation and role in inflammation and cancer. European Journal of Cell Biology 90 : 484–494.
5. IL6R Genetics Consortium Emerging Risk Factors Collaboration (2012) Interleukin-6 receptor pathways in coronary heart disease: a collaborative meta-analysis of 82 studies. The Lancet 379 : 1205–1213.
6. The Interleukin-6 Receptor Mendelian Randomisation Analysis (IL6R MR) Consortium (2012) The interleukin-6 receptor as a target for prevention of coronary heart disease: a mendelian randomisation analysis. The Lancet 379 : 1214–1224.
7. DeloukasP, KanoniS, WillenborgC, FarrallM, AssimesTL, et al. (2013) Large-scale association analysis identifies new risk loci for coronary artery disease. Nature Genetics 45 : 25–33.
8. EyreS, BowesJ, DiogoD, LeeA, BartonA, et al. (2012) High-density genetic mapping identifies new susceptibility loci for rheumatoid arthritis. Nat Genet 44 : 1336–1340.
9. SchnabelRB, KerrKF, LubitzSA, AlkylbekovaEL, MarcusGM, et al. (2011) Large-Scale Candidate Gene Analysis in Whites and African Americans Identifies IL6R Polymorphism in Relation to Atrial Fibrillation/Clinical Perspective. Circulation: Cardiovascular Genetics 4 : 557–564.
10. HarrisonSC, SmithAJP, JonesGT, SwerdlowDI, RampuriR, et al. (2012) Interleukin-6 receptor pathways in abdominal aortic aneurysm. European Heart Journal
11. FerreiraMAR, MathesonMC, DuffyDL, MarksGB, HuiJ, et al. (2011) Identification of IL6R and chromosome 11q13.5 as risk loci for asthma. The Lancet 378 : 1006–1014.
12. ReichD, PattersonN, RameshV, De JagerPL, McDonaldGJ, et al. (2007) Admixture Mapping of an Allele Affecting Interleukin 6 Soluble Receptor and Interleukin 6 Levels. The American Journal of Human Genetics 80 : 716–726.
13. CortesA, BrownMA (2011) Promise and pitfalls of the Immunochip. Arthritis Research & Therapy 13 : 101.
14. LustJA, DonovanKA, KlineMP, GreippPR, KyleRA, et al. (1992) Isolation of an mRNA encoding a soluble form of the human interleukin-6 receptor. Cytokine 4 : 96–100.
15. MullbergJ, OberthurW, LottspeichF, MehlE, DittrichE, et al. (1994) The soluble human IL-6 receptor. Mutational characterization of the proteolytic cleavage site. The Journal of Immunology 152 : 4958–4968.
16. BrisoEM, DienzO, RinconM (2008) Cutting Edge: Soluble IL-6R Is Produced by IL-6R Ectodomain Shedding in Activated CD4 T Cells. The Journal of Immunology 180 : 7102–7106.
17. StephensOW, ZhangQ, QuP, ZhouY, ChavanS, et al. (2012) An intermediate-risk multiple myeloma subgroup is defined by sIL-6r: levels synergistically increase with incidence of SNP rs2228145 and 1q21 amplification. Blood 119 : 503–512.
18. SchneiderA, LongSA, CerosalettiK, NiCT, SamuelsP, et al. (2013) In Active Relapsing-Remitting Multiple Sclerosis, Effector T Cell Resistance to Adaptive Tregs Involves IL-6-Mediated Signaling. Science Translational Medicine 5 : 170ra115.
19. BettelliE, KornT, KuchrooVK (2007) Th17: the third member of the effector T cell trilogy. Current Opinion in Immunology 19 : 652–657.
20. KornT, BettelliE, OukkaM, KuchrooVK (2009) IL-17 and Th17 Cells. Annual Review of Immunology 27 : 485–517.
21. GoodmanWA, YoungAB, McCormickTS, CooperKD, LevineAD (2011) Stat3 Phosphorylation Mediates Resistance of Primary Human T Cells to Regulatory T Cell Suppression. The Journal of Immunology 186 : 3336–3345.
22. YaoZ, KannoY, KerenyiM, StephensG, DurantL, et al. (2007) Nonredundant roles for Stat5a/b in directly regulating Foxp3. Blood 109 : 4368–4375.
23. LaurenceA, AmarnathS, MariottiJ, Kim YongC, FoleyJ, et al. (2012) STAT3 Transcription Factor Promotes Instability of nTreg Cells and Limits Generation of iTreg Cells during Acute Murine Graft-versus-Host Disease. Immunity 37 : 209–222.
24. LittmanDR, RudenskyAY (2010) Th17 and Regulatory T Cells in Mediating and Restraining Inflammation. Cell 140 : 845–858.
25. DaneshJ, KaptogeS, MannAG, SarwarN, WoodA, et al. (2008) Long-Term Interleukin-6 Levels and Subsequent Risk of Coronary Heart Disease: Two New Prospective Studies and a Systematic Review. PLoS Med 5: e78 doi:10.1371/journal.pmed.0050078.
26. SchnabelRB, LarsonMG, YamamotoJF, KathiresanS, RongJ, et al. (2009) Relation of Multiple Inflammatory Biomarkers to Incident Atrial Fibrillation. The American journal of cardiology 104 : 92–96.
27. NaitzaS, PorcuE, SteriM, TaubDD, MulasA, et al. (2012) A Genome-Wide Association Scan on the Levels of Markers of Inflammation in Sardinians Reveals Associations That Underpin Its Complex Regulation. PLoS Genet 8: e1002480 doi:10.1371/journal.pgen.1002480.
28. HeinrichPC, BehrmannI, Müller-NewenG, SchaperF, GraeveL (1998) Interleukin-6-type cytokine signalling through the gp130/Jak/STAT pathway. Biochemical Journal 334 : 297–314.
29. RidkerPM, PareG, ParkerA, ZeeRYL, DanikJS, et al. (2008) Loci Related to Metabolic-Syndrome Pathways Including LEPR,HNF1A, IL6R, and GCKR Associate with Plasma C-Reactive Protein: The Women's Genome Health Study. The American Journal of Human Genetics 82 : 1185–1192.
30. DanikJS, ParéG, ChasmanDI, ZeeRYL, KwiatkowskiDJ, et al. (2009) Novel Loci, Including Those Related to Crohn Disease, Psoriasis, and Inflammation, Identified in a Genome-Wide Association Study of Fibrinogen in 17 686 Women/CLINICAL PERSPECTIVE. Circulation: Cardiovascular Genetics 2 : 134–141.
31. WasselCL, LangeLA, KeatingBJ, TaylorKC, JohnsonAD, et al. (2011) Association of genomic loci from a cardiovascular gene SNP array with fibrinogen levels in European Americans and African-Americans from six cohort studies: the Candidate Gene Association Resource (CARe). Blood 117 : 268–275.
32. GarbersC, JännerN, ChalarisA, MossML, FlossDM, et al. (2011) Species Specificity of ADAM10 and ADAM17 Proteins in Interleukin-6 (IL-6) Trans-signaling and Novel Role of ADAM10 in Inducible IL-6 Receptor Shedding. Journal of Biological Chemistry 286 : 14804–14811.
33. BradshawEM, RaddassiK, ElyamanW, OrbanT, GottliebPA, et al. (2009) Monocytes from Patients with Type 1 Diabetes Spontaneously Secrete Proinflammatory Cytokines Inducing Th17 Cells. The Journal of Immunology 183 : 4432–4439.
34. Navarro-MillánI, SinghJA, CurtisJR (2012) Systematic Review of Tocilizumab for Rheumatoid Arthritis: A New Biologic Agent Targeting the Interleukin-6 Receptor. Clinical Therapeutics 34 : 788–802.e783.
35. DoganciA, EigenbrodT, KrugN, De SanctisGT, HausdingM, et al. (2005) The IL-6R α chain controls lung CD4+CD25+ Treg development and function during allergic airway inflammation in vivo. The Journal of Clinical Investigation 115 : 313–325.
36. HawkinsGA, RobinsonMB, HastieAT, LiX, LiH, et al. (2012) The IL6R variation Asp358Ala is a potential modifier of lung function in subjects with asthma. Journal of Allergy and Clinical Immunology
37. RidkerPM (2009) Testing the inflammatory hypothesis of atherothrombosis: scientific rationale for the cardiovascular inflammation reduction trial (CIRT). Journal of Thrombosis and Haemostasis 7 : 332–339.
38. RidkerPM, ThurenT, ZalewskiA, LibbyP (2011) Interleukin-1β inhibition and the prevention of recurrent cardiovascular events: Rationale and Design of the Canakinumab Anti-inflammatory Thrombosis Outcomes Study (CANTOS). American Heart Journal 162 : 597–605.
39. O'DonoghueML, BraunwaldE, WhiteHD, SerruysP, StegPG, et al. (2011) Study design and rationale for the Stabilization of pLaques usIng Darapladib—Thrombolysis in Myocardial Infarction (SOLID-TIMI 52) trial in patients after an acute coronary syndrome. American Heart Journal 162 : 613–619.e611.
40. NichollsSJ, CavenderMA, KasteleinJJP, SchwartzG, WatersDD, et al. (2012) Inhibition of secretory phospholipase A 2 in patients with acute coronary syndromes: Rationale and design of the vascular inflammation suppression to treat acute coronary syndrome for 16 weeks (VISTA-16) trial. Cardiovascular Drugs and Therapy 26 : 71–75.
41. SymmonsDPM, GabrielSE (2011) Epidemiology of CVD in rheumatic disease, with a focus on RA and SLE. Nat Rev Rheumatol 7 : 399–408.
42. KahlenbergJM, KaplanMJ (2012) Mechanisms of Premature Atherosclerosis in Rheumatoid Arthritis and Lupus. Annual Review of Medicine
43. OrchardTJ, CostacouT, KretowskiA, NestoRW (2006) Type 1 Diabetes and Coronary Artery Disease. Diabetes Care 29 : 2528–2538.
44. EckelRH, EisenbarthGS (2012) Autoimmune Diabetes Inflames the Heart. Science Translational Medicine 4 : 138fs118.
45. TanakaT, NarazakiM, KishimotoT (2011) Anti-interleukin-6 receptor antibody, tocilizumab, for the treatment of autoimmune diseases. FEBS Letters 585 : 3699–3709.
46. JonesSA, SchellerJ, Rose-JohnS (2011) Therapeutic strategies for the clinical blockade of IL-6/gp130 signaling. The Journal of Clinical Investigation 121 : 3375–3383.
47. HowsonJMM, StevensH, SmythDJ, WalkerNM, ChandlerKA, et al. (2011) Evidence That HLA Class I and II Associations With Type 1 Diabetes, Autoantibodies to GAD and Autoantibodies to IA-2, Are Distinct. Diabetes 60 : 2635–2644.
48. Genome-wide association study of 14,000 cases of seven common diseases and 3,000 shared controls. Nature 447 : 661–678.
49. Association scan of 14,500 nonsynonymous SNPs in four diseases identifies autoimmunity variants. Nature Genetics 39 : 1329–1337.
50. SwaffordAD-E, HowsonJMM, DavisonLJ, WallaceC, SmythDJ, et al. (2011) An Allele of IKZF1 (Ikaros) Conferring Susceptibility to Childhood Acute Lymphoblastic Leukemia Protects Against Type 1 Diabetes. Diabetes 60 : 1041–1044.
51. PfafflMW (2001) A new mathematical model for relative quantification in real-time RT-PCR. Nucleic Acids Res 29: e45.
52. TreeTIM, RoepBO, PeakmanM (2004) Enhancing the Sensitivity of Assays to Detect T Cell Reactivity: The Effect of Cell Separation and Cryopreservation Media. Annals of the New York Academy of Sciences 1037 : 26–32.
53. DendrouCA, PlagnolV, FungE, YangJHM, DownesK, et al. (2009) Cell-specific protein phenotypes for the autoimmune locus IL2RA using a genotype-selectable human bioresource. Nature Genetics 41 : 1011–1015.
54. PruimRJ, WelchRP, SannaS, TeslovichTM, ChinesPS, et al. (2010) LocusZoom: regional visualization of genome-wide association scan results. Bioinformatics 26 : 2336–2337.
55. CordellHJ, BarrattBJ, ClaytonDG (2004) Case/pseudocontrol analysis in genetic association studies: A unified framework for detection of genotype and haplotype associations, gene-gene and gene-environment interactions, and parent-of-origin effects. Genetic Epidemiology 26 : 167–185.
Štítky
Genetika Reprodukční medicínaČlánek vyšel v časopise
PLOS Genetics
2013 Číslo 4
- Kazuistika – Perspektivy využití precizované medicíny v rámci personalizované specifické terapie onkologických pacientů
- Nobelova cena za chemii pro genetické nůžky: Objev, který změní naši budoucnost?
- Technologie na bázi RNA v klinické praxi: od přebarvených petúnií k terapii vzácných a dosud jen obtížně léčitelných chorob u lidí
- „Nepředstavovali jsme si, že náš výzkum povede přímo ke vzniku nových léků, dokonce ještě za našeho života“
- Bezplatné služby pro diagnostiku ATTRv amyloidózy pro kardiology
Nejčtenější v tomto čísle
- The G4 Genome
- Neutral Genomic Microevolution of a Recently Emerged Pathogen, Serovar Agona
- The Histone Demethylase Jarid1b Ensures Faithful Mouse Development by Protecting Developmental Genes from Aberrant H3K4me3
- The Tissue-Specific RNA Binding Protein T-STAR Controls Regional Splicing Patterns of Pre-mRNAs in the Brain
Zvyšte si kvalifikaci online z pohodlí domova
Mazová zátka a její řešení
nový kurzVšechny kurzy