
Genome-Wide Analysis Reveals Selection for Important Traits in Domestic Horse Breeds
Intense selective pressures applied over short evolutionary time have resulted in homogeneity within, but substantial variation among, horse breeds. Utilizing this population structure, 744 individuals from 33 breeds, and a 54,000 SNP genotyping array, breed-specific targets of selection were identified using an FST-based statistic calculated in 500-kb windows across the genome. A 5.5-Mb region of ECA18, in which the myostatin (MSTN) gene was centered, contained the highest signature of selection in both the Paint and Quarter Horse. Gene sequencing and histological analysis of gluteal muscle biopsies showed a promoter variant and intronic SNP of MSTN were each significantly associated with higher Type 2B and lower Type 1 muscle fiber proportions in the Quarter Horse, demonstrating a functional consequence of selection at this locus. Signatures of selection on ECA23 in all gaited breeds in the sample led to the identification of a shared, 186-kb haplotype including two doublesex related mab transcription factor genes (DMRT2 and 3). The recent identification of a DMRT3 mutation within this haplotype, which appears necessary for the ability to perform alternative gaits, provides further evidence for selection at this locus. Finally, putative loci for the determination of size were identified in the draft breeds and the Miniature horse on ECA11, as well as when signatures of selection surrounding candidate genes at other loci were examined. This work provides further evidence of the importance of MSTN in racing breeds, provides strong evidence for selection upon gait and size, and illustrates the potential for population-based techniques to find genomic regions driving important phenotypes in the modern horse.
Published in the journal:
. PLoS Genet 9(1): e32767. doi:10.1371/journal.pgen.1003211
Category:
Research Article
doi:
https://doi.org/10.1371/journal.pgen.1003211
Summary
Intense selective pressures applied over short evolutionary time have resulted in homogeneity within, but substantial variation among, horse breeds. Utilizing this population structure, 744 individuals from 33 breeds, and a 54,000 SNP genotyping array, breed-specific targets of selection were identified using an FST-based statistic calculated in 500-kb windows across the genome. A 5.5-Mb region of ECA18, in which the myostatin (MSTN) gene was centered, contained the highest signature of selection in both the Paint and Quarter Horse. Gene sequencing and histological analysis of gluteal muscle biopsies showed a promoter variant and intronic SNP of MSTN were each significantly associated with higher Type 2B and lower Type 1 muscle fiber proportions in the Quarter Horse, demonstrating a functional consequence of selection at this locus. Signatures of selection on ECA23 in all gaited breeds in the sample led to the identification of a shared, 186-kb haplotype including two doublesex related mab transcription factor genes (DMRT2 and 3). The recent identification of a DMRT3 mutation within this haplotype, which appears necessary for the ability to perform alternative gaits, provides further evidence for selection at this locus. Finally, putative loci for the determination of size were identified in the draft breeds and the Miniature horse on ECA11, as well as when signatures of selection surrounding candidate genes at other loci were examined. This work provides further evidence of the importance of MSTN in racing breeds, provides strong evidence for selection upon gait and size, and illustrates the potential for population-based techniques to find genomic regions driving important phenotypes in the modern horse.
Introduction
Since domestication of the horse approximately 5,000 years ago [1]–[3], selective breeding has been directed mainly toward the use of the horse in agriculture, transportation, and warfare. Within the past 400 years, the founding of formal breed registries and continued breed specialization has focused more upon preserving and improving traits related to aesthetics and performance. As a result, most horse breeds today are closed populations with high phenotypic and genetic uniformity of individuals within the breed, but with a great deal of variation among breeds. High-throughput, whole-genome SNP arrays can now be used to exploit this population structure to identify the effects of selection upon the equine genome. Once genomic regions targeted by selection are detected, the variants and processes that have contributed to desired phenotypes within breeds and across performance groups can be more readily identified.
Population-based approaches to identify signals of selection using loss of heterozygosity and/or other diversity indices have been successful in several domestic species. In dogs, these studies have led to the identification of genomic regions implicated in the selection of characteristics such as coat color and texture, body size, skin wrinkling, and disease [4], [5], as well as the identification of signals of selection across genes with both known and unknown function [6]–[9]. Similar studies in cattle have identified regions of interest that encompass genes with known or potential importance for muscling, feed efficiency, milk production, and reproduction [10]–[13], and genomic targets of selection for reproductive traits, coat pigmentation, and lack of horns (polled) have been identified in the sheep [14]. While a considerable number of traits are under selection in the many breeds and performance groups of the horse, the only prior population-based study of selection in the horse utilized microsatellite loci to identify loci of importance to the Thoroughbred with respect to three other breeds [15].
This report, using an autosomal single nucleotide polymorphism (SNP) array and a sample set of 33 different breeds, represents the first large-scale study of how selective pressures have shaped the equine genome. Within each breed, genotypes in 500 kb windows were evaluated to identify those more divergent from the other breeds in the study than expected, therefore signifying potential genomic targets of selection. Of the regions of putative selection identified, priority was given to regions with the highest di value within a breed, regions with consecutive windows of significance covering at least 1 Mb, regions shared by breeds with similar phenotype, or regions showing significance near genes with known or suggested functional effect. Regions chosen for follow-up studies were further investigated by phasing genotypes to discover any extended haplotypes present at high frequency in the breed(s) of interest. Haplotypes were then scanned to identify candidate genes for follow-up study. This report focuses upon regions of selection that are hypothesized to be involved in coat color, performance, gait (pattern of locomotion) and size. Our results support the use of this technique in the horse to identify novel variants of functional importance and to further elucidate how selection has shaped the equine genome.
Results
Overview
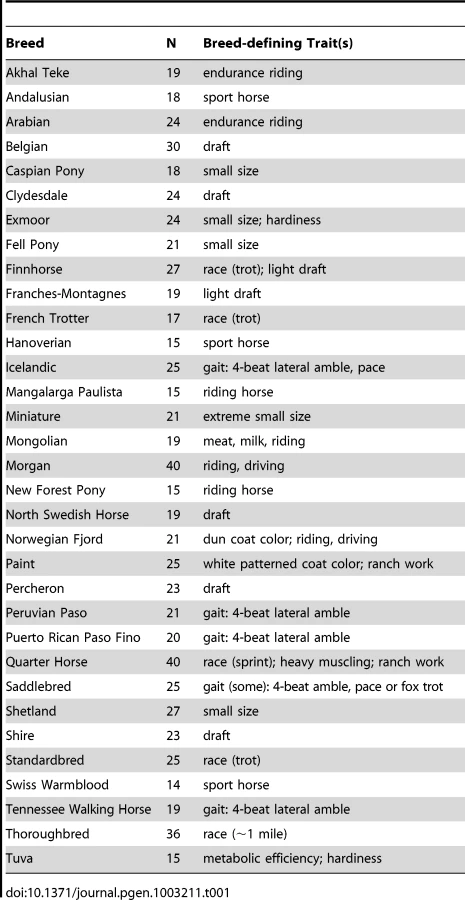
A total of 744 horses representing 33 breeds (average 22.5 horses/breed) genotyped with the Equine SNP50 Beadchip (Illumina) were included in the analysis. Information regarding the breeds, sample sizes and breed-specific phenotypes is found in Table 1. Horses were selected to represent a random sample of the breed whenever possible and were chosen to be unrelated to one another at, or more recent to, the grandsire/dam level. In the case where pedigree information was not available, horses were removed from the analysis so no pair had a genome sharing value of greater than 0.3 (see methods). All horses included in the study genotyped at a rate greater than 0.98.
The FST-based statistic, di [4], was calculated for autosomal SNPs in 500 kb windows, with a minimum of 4 SNPs per window, and defining the populations by breed. The di statistic is a summation at each window of pairwise FST values for each breed combination, corrected by the value expected from genome-wide calculations; therefore, a large value of di indicates greater divergence at that 500 kb window than that observed across the genome as a whole. In total, 23,401 SNPs were evaluated within 3,229 windows (68.7% of the autosomes), averaging 7.25 SNPs per window (range 4–20). SNPs from the full data set not included in the analysis of di were largely removed due to failure to meet the minimal SNP density requirement. The 33 windows within each breed, which fell into the upper 99th percentile of the empirical distribution, were considered putative signatures of selection; these regions in each breed are listed in Table S1. The maximum di value per breed ranged from 33.8 in the New Forest Pony to 104.4 in the Peruvian Paso. Of the 3,229 windows analyzed, 695 (2.7%) were significant (within the upper 99th percentile) in at least one breed. The di plots from all breeds in the study are provided in Figure S1.
Utility of the Statistic—Identification of Common Haplotypes Containing Known Coat Color Loci
Prior work has suggested that coat color was a target of selection early in horse domestication [2] and several breeds continue to be selected for a uniform coat color or color patterns. Two examples of selection for coat color include the light chestnut coat desired in Belgian draft horses bred in the United States, and the dun coloration characteristic of the Norwegian Fjord.
Chestnut coat color is the result of a recessive mutation of the melanocortin 1 receptor (MC1R) [16]. This MC1R variant represents a gene with known effect that has been shown to be contained within an extended haplotype [17]. Genotypes for the MC1R locus were available for most horses in 14 of the breeds as reported previously [17]. In this sample, two breeds, the Morgan and Belgian, were fixed for the missense mutation that results in the base coat color of chestnut.
Due to SNP density, di was not calculated across the MC1R locus itself. However, the window with the highest di value in the Morgan was a region on ECA3 with two consecutive significant windows (ECA3 : 37,825,015; di = 67.22) near the MC1R locus (ECA3 : 36,259,276–36,260,354) (Figure S1). Phasing of the genotypes uncovered a 1.57 Mb, 12 SNP haplotype spanning MC1R in all Morgan chromosomes (N = 80); this haplotype extended 2.55 Mb in 95% of the chromosomes (Figure 1). Although the Belgian population had the identical 1.57 Mb haplotype across the MC1R locus, it did not have a high-frequency haplotype extending into the regions in which di was calculated. As the result of the different haplotype lengths in each breed, the di statistic identified the signature of selection around MC1R in the Morgan, but not in the Belgian (Figure 1 and Figure S1).

The frequency of the mutant MC1R allele in the 12 other breeds for which the MC1R genotype was known ranged from 0.19 in the Andalusian to 0.88 in the American Saddlebred (hereafter “Saddlebred”) (data not shown). In addition to the Morgan, significant di values adjacent to the MC1R locus were found in the Finnhorse and Saddlebred, which each had a high frequency (0.85) of the same extended haplotype (2.19 and 2.64 Mb, respectively) across MC1R as that found in the Morgan (data not shown). Significant di windows upstream and adjacent to the MC1R region were also found in the Andalusian, Exmoor Pony, Fell Pony, Icelandic, North Swedish Horse, and Shire (Figure S1); however, these populations did not have a high frequency of the MC1R haplotype consistent with chestnut coat color.
Another instance of detection of a coat color locus was found on ECA8 in the Norwegian Fjord, a breed selected for the dun coat color dilution. A significant window on ECA8, centered at 17.5 Mb, is in the same region as the genetically mapped locus associated with the dun dilution [18].
ECA18—Muscle Characteristics and Racing Aptitude
Racing performance is a trait of high economic importance to the equine industry. Variation in racing aptitudes range from that of the American Quarter Horse (hereafter “Quarter Horse”), which was originally bred to sprint ¼ mile (400 m), to the opposite extreme of the Arabian and Akhal Teke breeds that compete in endurance races up to and over 100 miles (160.9 km). Intermediate to the Quarter Horse and endurance horses, the Thoroughbred races distances ranging from 5/8 to 2 miles (1–3.2 km), and the Standardbred competes at a distance of approximately one mile (1600 m) under harness at a trot or pace rather than a gallop.
A large region of putative selection was found on ECA18 in the American Paint Horse (hereafter “Paint”) and Quarter Horse populations, which included the highest di values observed in each breed (Figure 2). Not only was the highest di value for each breed found in this region, but 9 and 10 of the 11 consecutive windows (from 60.59 to 68.84 Mb), were significant in the Quarter Horse and Paint, respectively.

Haplotype analysis
Phasing of the genotypes across ECA18 showed a common, 780.7 kb haplotype composed of 21 SNPs, found in 91.3 and 100% of the Quarter Horse and Paint chromosomes, respectively. The same 780.7 kb haplotype, contained within a larger, 2 Mb haplotype, was also present in 52.8% of the Thoroughbred chromosomes (Figure 3). This 780.7 kb haplotype was present at a frequency of 0.04 across all other samples in the study.

Candidate gene sequencing
The myostatin gene (MSTN; ECA18 : 66,490,208–66,495,180) was centered among 12 predicted or annotated genes in the 780.7 kb haplotype observed in the Paint and Quarter Horse (Table S2). Sanger DNA sequencing of MSTN was performed on 14 horses (8 Quarter Horse, 6 Thoroughbred) representing individuals with and without the 780.7 kb haplotype. A total of 19 variants were identified relative to the reference genome including a SINE insertion in the promoter region, which was also found in the Thoroughbred [19], as well as a SNP in intron 1 (g.66493737C/T) suggested to be predictive of optimal racing distance in Thoroughbreds [19], [20]. All SNPs identified in these 14 horses through sequence analysis of MSTN are presented in Table S3.
Association of MSTN variants with the common haplotype
To evaluate the frequency of the SINE insertion and association with the extended haplotype in an alternative sample, the SINE insertion was genotyped in 132 horses from which full-genome SNP data was available (121 Quarter Horses and 11 Paints). The 780.7 kb SNP haplotype was observed in 90.9% (240/264) of the chromosomes assayed and the SINE insertion was present in 95.8% (230) of the 240 instances in which the extended haplotype was observed. The intron 1 SNP was genotyped in 61 horses in which full-genome SNP data was available. Similar to the SINE, the intron 1 “C” allele was found in 96.9% of cases (94/97) in which the extended haplotype was present.
In this sample of Paint and Quarter Horses, the presence of the SINE was predictive of the “C” allele of the intron 1 SNP in 89.8% of the instances where data from both variants was available. Further, both the SINE and SNP were significantly associated with the extended haplotype shared among the Quarter Horse, Paint, and Thoroughbred (p<0.001 for each variant). The promoter SNP (g.66495715T/C) discussed in [21] and suggested to be associated with body composition (light vs. heavy breeds), was found in 8.7% of 23 Quarter Horses assayed and was not significantly associated with the extended haplotype, the SINE insertion, or intron 1 SNP (data not shown); no other MSTN variants were significantly associated with the haplotype in question.
Frequency of MSTN variants
In addition to the 132 horses above, 257 other individuals from whom full-genome SNP data was not available were genotyped for the SINE insertion. Of the 389 horses genotyped in total (357 Quarter Horse, 32 Paint), 309 (79.4%) were homozygous for the insert, 51 (13.1%) heterozygous, and 29 (7.5%) homozygous for the allele without the insert. In this sample, which largely represents horses collected for other laboratory studies and is not necessarily a random representation of each breed, the SINE was present at a frequency of 0.86. In a similar sample of 112 horses genotyped for the intron 1 SNP, 61 horses (54.5%) were homozygous for the “C” allele, 40 (35.7%) heterozygous, and 11 (9.8%) homozygous for the “T” allele; the frequency of the “C” allele of the intron 1 SNP in this sample was 0.88.
Gluteal muscle fiber typing
Because MSTN is a negative regulator of muscle development and a loss of function is known to influence muscle mass [22]–[26], we hypothesized that the SINE insertion may function to influence muscle fiber composition due to its position in the promoter region of the gene. To test this hypothesis, muscle fiber type proportions and diameters were quantified from gluteal muscle biopsies obtained from a standardized site [27] (see methods) of 79 Quarter Horses representing each genotype with respect to the SINE insertion (18 homozygous without the insert (NN), 31 heterozygous for the SINE insertion (NS), and 30 homozygous for the SINE insertion (SS)). Genotyping of the linked intron 1 SNP found that 34 of these horses were homozygous for the “C” allele, 33 heterozygous, and 9 homozygous for the wild-type, “T,” allele (3 were missing data).
The MSTN SINE insertion and intron 1 SNP were tested for significant association with fiber type proportions and diameter using multivariate analysis of variance (MANOVA). Age and gender have been shown to influence muscle fiber characteristics [28]–[31] and were therefore included as covariates in the analyses. An additive mode of inheritance was assumed.
MANOVA showed a significant association of the SINE with muscle fiber type proportions (p = 0.039) (Figure 4). The directionality and magnitude of the response was evaluated by multiple linear regression, which demonstrated that the presence of the SINE resulted in a higher proportion of Type 2B fibers (p = 0.012) and lower proportion of Type 1 fibers (p = 0.045). Each copy of the SINE increased Type 2B fiber proportions by 3.79% (95% CI = 0.98 to 6.71), and decreased Type 1 fiber proportions by 2.10% (95% CI = 0.05–4.16) (Figure 5).


MANOVA was performed in a similar manner on the intron 1 SNP data and also showed a significant association of the SNP (p = 0.008) with fiber type proportions (Figure 4). The “C” allele led to a higher proportion of Type 2B fibers (p = 0.005) and a lower proportion of Type 1 fibers (p = 0.004). In the case of Type 2B fibers, each copy of the “C” allele resulted in a 4.79% increase in Type 2B fiber proportion (95% CI = 1.50–8.09) and decrease of 3.44% (95% CI = 1.13–5.75) in the proportion of Type 1 fibers (Figure 5).
Least-square means calculated from the SINE and intron 1 SNP genotypes (considering sample size and the covariates of age and sex), and corresponding significant differences between the genotypes are found in Table 2. There was no significant evidence of non-additivity of either variant.

Neither the SINE nor intron 1 SNP was significantly associated with muscle fiber diameter in any statistical analysis conducted.
ECA23—Gaited Breeds
A characteristic under strong selection within particular breeds and often a breed-defining trait is the ability to perform alternate gaits, which are characterized by variations in the pattern and timing of footfall. The standard gaits of the domestic horse and wild equids include the (flat) walk, trot, canter, and gallop (Table 3). However, instead of the two-beat contralateral gait of the trot, some horses perform the pace, a two-beat ipsilateral gait. Other natural variations in movement include four-beat ambling gaits characteristic of the Tennessee Walking Horse, Peruvian Paso, Paso Fino, and others, with unique variations in rhythm between breeds (Table 3 and Table 4).


The window centered at 23.2 Mb on ECA23 represented the maximum di value for four breeds: the Icelandic, Peruvian Paso, Standardbred, and Tennessee Walking Horse (Figure 6). In the Icelandic, the region of significance encompassed two consecutive, 500 kb windows, while in the Peruvian Paso, significance stretched across six consecutive windows. The Puerto Rican Paso Fino also had two adjacent, significant windows in this region although neither signified the largest di value within the breed. This region of ECA23 was chosen for follow-up study due to the high level of significance in these breeds and the fact that all of the above breeds share the phenotype of possessing alternative gaits.

Haplotype analysis
Phasing of the ECA23 SNP genotypes identified haplotypes within these four breeds that ranged from 428.7 to 761.5 kb in length, and were present at high frequency (0.91 to 1.0). A haplotype just less than 186 kb was identical in the Icelandic, Peruvian Paso, Puerto Rican Paso Fino, Tennessee Walking Horse, Standardbred (non-gaited trotters), Finnhorse, and French Trotter (Figure 7). Phasing genotypes in additional Standardbred horses (N = 50), including some bred to race at the pace (gaited), found the 18 SNP, 446 kb haplotype within the breed as a whole to be fixed (data not shown).

Two genes annotated in Ecab2.0, doublesex and mab-3 related transcription factors 2 and 3 (DMRT2, DMRT3), are found in the ECA23 haplotype shared across gaited breeds. This “gait” haplotype was also found at low frequency in the Mangalarga Paulista (3.0%), Morgan (8.0%), and Saddlebred (30%).
Other Potential Performance Loci
The most significant di value in the Thoroughbred was the first of three consecutive windows of significance on ECA17 (Figure 2). Phasing revealed a 2.49 Mb, 55 SNP haplotype in the Thoroughbred that was present in 85% of the chromosomes sampled (Figure 8). The 2.49 Mb haplotype is present but less frequent in the Hanoverian (43%), Swiss Warmblood (36%), Quarter Horse (34%), and Paint (24%). Considering all non-Thoroughbreds in the study, the haplotype is found at a frequency of 12.1% and is absent in 15 of the 33 breeds studied. This region (20.69–23.18 Mb) includes 23 annotated or predicted genes in EquCab2.0, and also includes 2 retrotransposed elements, 3 pseudogenes, and 2 known miRNA (Table S2). The Puerto Rican Paso Fino had a significant di peak in this same region of ECA17, but had an unrelated 270 kb haplotype found in 31 of 40 chromosomes (Figure 8). No annotated genes are within the shorter haplotype found in the Puerto Rican Paso Fino. The second greatest di value in the Thoroughbred was also highly significant in the Quarter Horse; this region on ECA14 contained a 982 kb haplotype shared across the Thoroughbred, Quarter Horse, Paint, and Swiss Warmblood, and includes ten annotated genes. This haplotype is found at a frequency of 0.33 across all 33 breeds and 0.25 when considering all but those named above (data not shown).

In other breeds, unique signals were observed on ECA2 in the French Trotter and ECA7 in the Standardbred. These putative signatures of selection span 10.4 and 12.9 Mb, respectively, and contain large, extended haplotypes across the regions of significance. A similar signature is observed in the Standardbred as well as the Tennessee Walking Horse on ECA8 where the minimum value of di is elevated above the baseline across a large region of the chromosome (Figure 6).
Size
Size is a phenotype easily observed and therefore selectively bred. As a result of selection, diversity in size occurs in terms of both height and mass. The extremes of size are found in the Miniature horse, which is often as small as 29 in (0.74 m) at the withers (base of the neck) and weigh less than 250 lbs (113 kg), and in the draft breeds that have a wither height of 72 in (1.83 m) or more and can weigh over 2000 lbs (907 kg).
ECA11
A region of putative selection on ECA11 was shared by all draft breeds as well as the Miniature horse and therefore hypothesized to be influential in the determination of size (Figure 9). Phasing of this region showed high conservation of haplotypes across the Belgian, Clydesdale, Franches-Montagnes, North Swedish Horse, Percheron, and Shire, ranging in frequency from 0.74 (North Swedish Horse, Franches-Montagnes) to 0.92 (Clydesdale). These 6 draft breeds share a 10 SNP, 477.3 kb haplotype centered at 23.47 Mb (Figure 10). This haplotype is found at a frequency of 0.18 in all other breeds, including 12 of 30 chromosomes in the Hanoverian, which also had a significant di value at the same window (Figure S1).

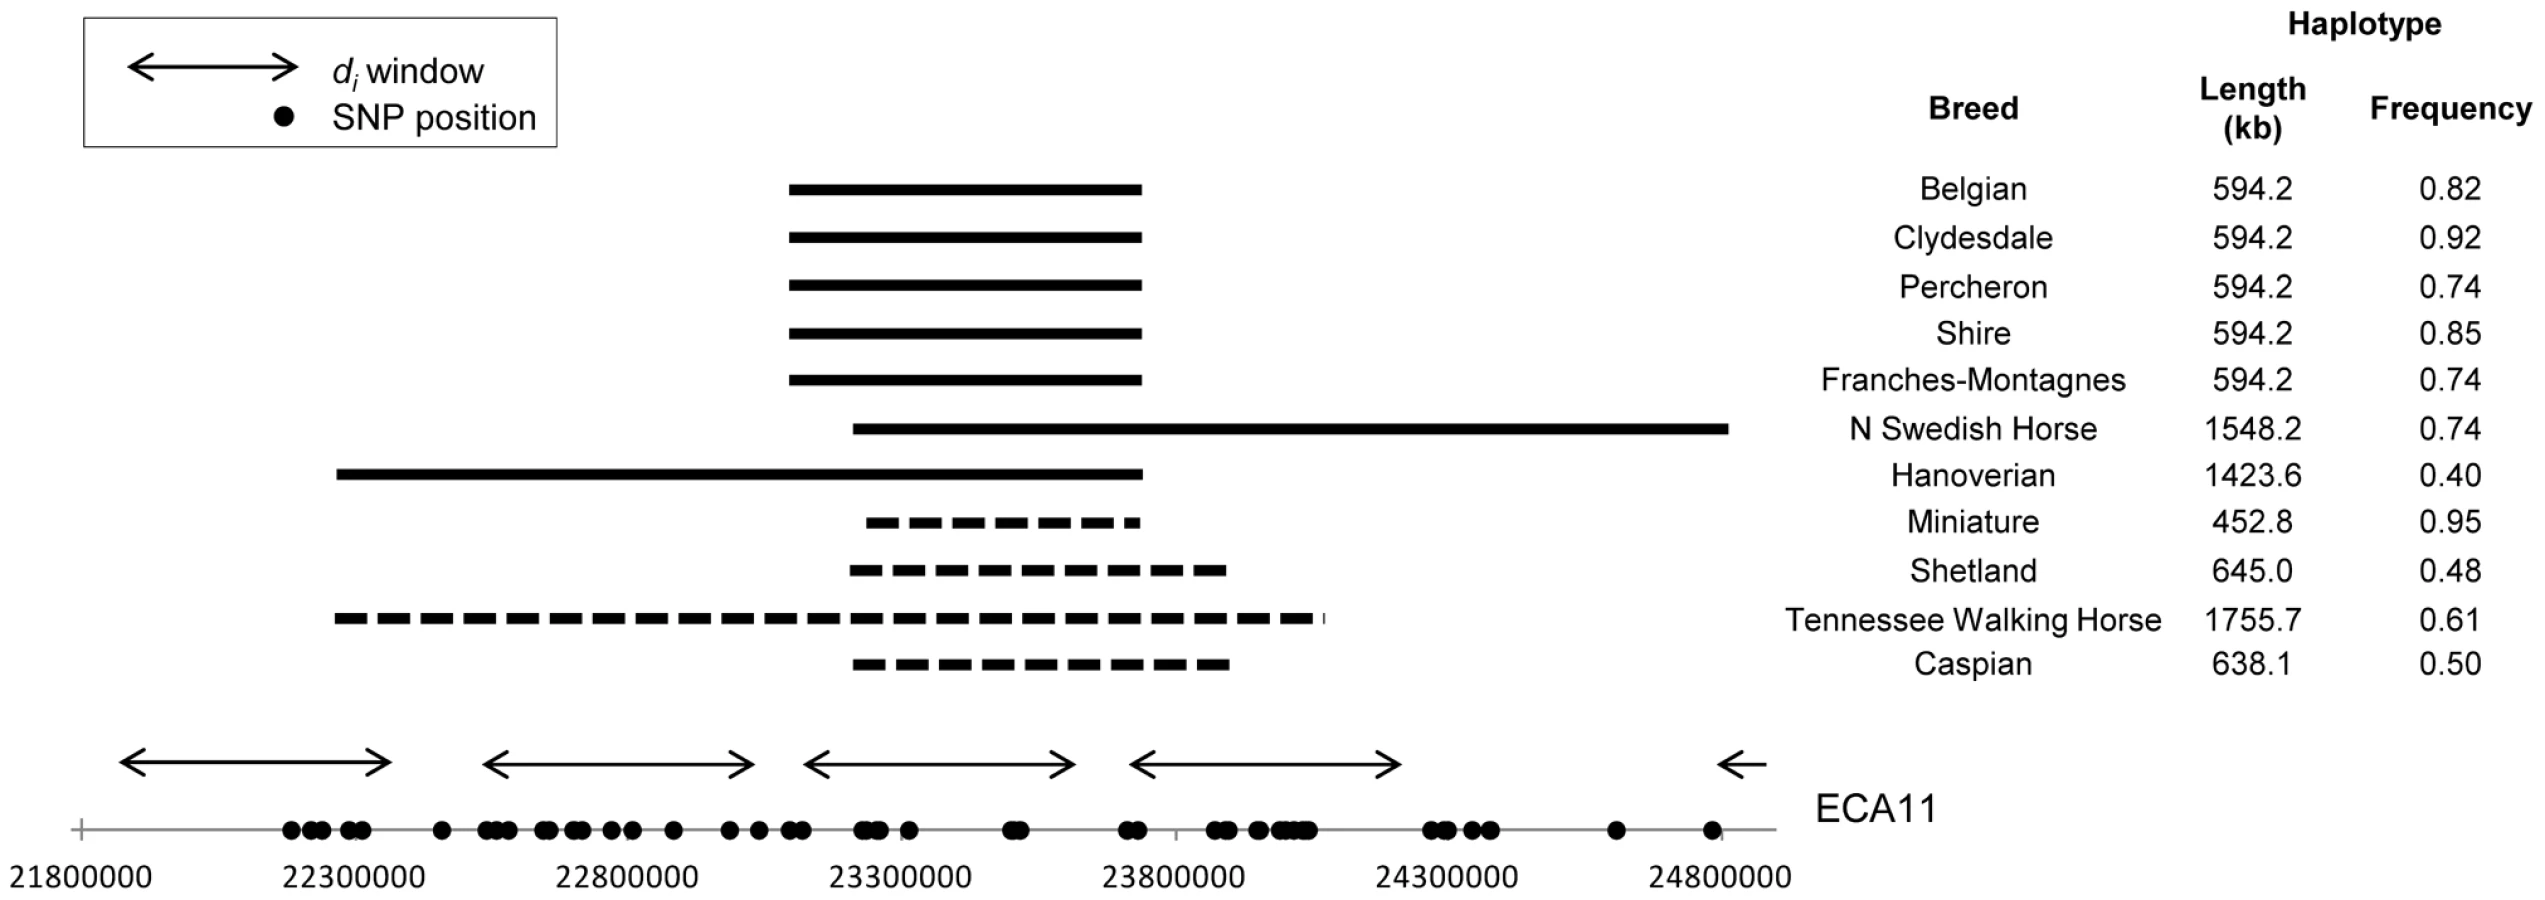
The Miniature horse had an 8 SNP, 457.8 kb haplotype over this same region of ECA11, centered at 23.48 Mb, and conserved across 95% of the chromosomes studied. This “Miniature” haplotype is also found in moderate frequency in the Shetland pony (0.48), and the Caspian (0.50), and was common in the Tennessee Walking Horse (0.71), where it was within a longer haplotype (Figure 10). The “Miniature” haplotype overlaps 7 SNPs (452.8 kb) of the “draft” haplotype. Thirteen annotated/predicted genes and two novel snoRNA are within this overlapping region (Table S2).
Candidate genes for size
Apart from ECA11, di values calculated across or adjacent to three candidate genes for size (see Methods), IGF1, NCAPG, and HMGA2, showed evidence of selection within this study. The Franches-Montagnes was the only breed with a significant di value at the insulin-like growth factor 1 (IFG1) locus on ECA28. While a 362 kb haplotype was found in more than half of that population, it was also observed in moderate frequencies in breeds of all sizes.
The candidate gene, non-SMC condensing I complex, subunit G (NCAPG), on ECA3 did not fall within a di window in our data set due to low SNP density on the SNP array at that region. Yet, the window adjacent to this locus was significant in the Belgian and, upon phasing, an extended haplotype of 616.6 kb crossing NCAPG was found in all Belgian chromosomes; in 90% of the chromosomes the haplotype extended 1.15 Mb (Figure 11). The 616.6 kb haplotype was also fixed in the Clydesdale and common in the Percheron (0.98) and Shire (0.80). Excluding these four breeds, the ECA3 haplotype was found at a frequency of 0.096 in all other horses and had moderate frequency in the Swiss Warmblood (0.68), and Finnhorse (0.56). An extended haplotype was found surrounding a majority of the chromosomes in each of these breeds (Figure 11).

The high-mobility group AT-hook 2 gene (HMGA2) on ECA6 was not covered by a di window. However, the closest window to this locus was significant in the Clydesdale and phasing found a 2.54 Mb haplotype in 91.7% of the Clydesdale chromosomes, which originated in the di region and ended just beyond the gene. This haplotype was not frequent in other draft breeds with the exception of the Shire (52%), and is virtually absent in all other horses studied (2.0% occurrence).
Discussion
The success of population-based statistics for detecting signatures of selection is largely dependent upon the history of the species in question and the genomic resources available. In the horse, intense, divergent selection among breeds, but shared selective pressures within breeds, as well as a whole-genome SNP genotyping platform, have led to initial successes in finding loci and polymorphisms that appear to be driving breed - and performance group-defining phenotypes. Many putative regions of selection were identified in the 33 breeds included in this study. Those pursued were chosen based upon categorization into one or more of the four criteria for prioritization of regions for investigation: those with the highest di value within a breed, regions with at least 1 Mb of consecutive windows of significance, significant regions shared by breeds with similar phenotype, or regions showing significance across or near genes with known or suggested functional effect. This initial genome-scan led to evidence of selection for loci involved in aesthetic and performance characteristics. However, many regions left uninvestigated may also harbor important information regarding polymorphisms involved in the determination of traits of significance in these breeds.
Linkage disequilibrium generally breaks down within 400 kb in the horse genome [17]. Therefore, 500 kb windows were chosen for the calculation of the di statistic to allow for the capture of linkage blocks as well as for the inclusion of the minimum number of SNPs (4) deemed necessary to eliminate stochastic variation and calculate a robust statistic. While formal tests for extended haplotype homozygosity (EHH) [32] were not performed, haplotype phasing of the entire SNP dataset across regions of interest was utilized to narrow and prioritize loci for follow-up work.
Utility of the Statistic
The genetic determination of coat color in horses is largely understood [16], [18], [33]–[39] and allows for a test of the di statistic. For example, a di value above the threshold on ECA8 in the Norwegian Fjord is in the region to which dun coat color has been linked [18], supporting known phenotypic selection for dun coloration in this breed. However, the ability of the di statistic to identify divergence around the known mutation for chestnut coat color in MC1R serves as a more appropriate and convincing demonstration of the utility of the statistic to find extended haplotypes that differ among populations. At the same time, the chestnut coat color locus, which is assumed to be contained within an extended haplotype described by [17], also highlights limitations of the statistic. The most obvious of these limitations is that due to low polymorphic SNP density and parameter settings for the calculation of di, the di value is not calculated for windows covering the entire genome, and in this instance was not calculated across the MC1R locus itself. While incomplete genome coverage can result in true signatures of selection going undetected, it can be overcome in situations where the signature of selection includes long haplotypes detectable by neighboring di windows. This appears to be the case for MC1R in the Morgan population, which was fixed for an extended haplotype containing the mutant allele, allowing for detection via di windows neighboring the locus. However, this was not the case in the Belgians, which were also fixed for the MC1R mutation but did not have a haplotype extending as far as that observed in the Morgan. If this were not a known mutation, this locus could have gone undetected in the Belgian. The statistic did, however, detect the MC1R region in the Saddlebred, which had a high proportion (0.88) of the mutant allele, and in the Finnhorse for which MC1R genotype data was not available but which has experienced historic selection for chestnut coat color [40]. These appear to be examples of true positive signatures of selection across this locus.
The significance of di in the region of MC1R in the Shire and Exmoor breeds, which are not commonly chestnut in color, highlights another limitation of this approach: it is blinded to phenotype. While one can propose phenotype(s) that may be driving the signature of selection based upon known mutations, candidate genes found in the region, and/or by shared phenotypes among breeds sharing the same regions of significance, validation of selection and the identification of causative polymorphisms is dependent upon often labor intensive follow-up studies. In addition, false positive windows are expected as a result of genetic drift and/or founder effect, which are common phenomena in the development of domestic breeds. Shire horses are commonly bay, black, or grey, while Exmoor ponies are almost exclusively brown or dark bay; considering these two breeds, it can be hypothesized that the significant di value at the MC1R locus in these breeds, and underlying haplotype, reflect selection against the chestnut coat color, or for alternative coat colors [40], [41]. However, without additional work, it cannot be determined if the di signals in the Shire or Exmoor are false positive signals of selection, the result of genetic drift, or if the region may include other variant(s) contained within alternative haplotypes that are also under selection.
At the same window near MC1R, the Icelandic and Fell Pony populations had di statistics that were slightly greater than the threshold values. The frequency of the MC1R haplotype found in the Morgan and Belgian was moderate in each of these breeds. Significant di values for the Icelandic and Fell Pony could indicate that the locus is under moderate selection in these breeds or could represent false positive signals of selection resulting from the additive nature of the statistic. A similar phenomenon occurred on ECA23, the region of significance for gaited breeds. Because the statistic is additive, the extreme divergence in a few breeds in the study (e.g. Peruvian Paso, Tennessee Walking Horse), yielded an elevated di values across all populations. As a result, breeds such as the Paint, Quarter Horse, Morgan, and Mongolian, still have a di value falling into the 99th percentile of the empirical distribution but with no extended, high frequency haplotype or other evidence of selection at the locus, likely representing a false positive signal of selection.
MSTN
The signature of selection and underlying homozygosity in ECA18 seen in the Paint and Quarter Horse samples was profound given the relatively recent derivation of these breeds from a diverse founding stock, short blocks of linkage disequilibrium [17], and continued admixture with the Thoroughbred. The Paint and Quarter Horse do however share similar ancestry, experience continued admixture, and as a result have low genetic differentiation (JLP, unpublished data); those traits, along with shared selective pressures results in similar signals of di in the case of ECA18 as well as across other loci.
The high frequency and size of the extended haplotype on ECA18 suggests extreme selective pressure for the phenotype that is driving this putative signature of selection. Although the haplotype was long, it was centered upon the MSTN gene. MSTN was chosen for sequencing because of its function as a negative regulator of muscle development [22]–[26], [42] and involvement in muscle fiber type determination [43]–[45], coupled with the fact that the Quarter Horse is historically known for its ability to sprint ¼ mile and continues to be selected for heavy muscling. Also, recent work has suggested that an intronic variant in MSTN is predictive of the best race distance for the Thoroughbred [19], [20], [46]; specifically, these studies [19], [20] suggest that horses homozygous for the “C” allele (position g.66493737C>T) are better suited for short distance racing, heterozygotes are more capable middle-distance racers, and homozygotes for the “T” allele have greater stamina for long-distance races. In addition to predicting optimal racing distance, MSTN has been implicated as important to racing success [47], [48] and also as having a role in body composition [49].
Fiber typing results in the Quarter Horse indicate significantly higher Type 2B and lower Type 1 gluteal muscle fiber proportions in the presence of the 5′ SINE insertion or “C” allele at the intron 1 SNP in the MSTN gene; this is the first histological evidence that one or both of these polymorphisms may play a functional role in muscle fiber composition in the horse. Type 1 and Type 2B muscle fibers differ in that Type 2B fibers are the fastest contracting and largest fibers in cross-sectional area, whereas Type 1 fibers are slower contracting, smaller fibers. Selection in the Quarter Horse for sprinting ability is hypothesized to favor an increase in Type 2B muscle fibers, allowing for faster and more powerful skeletal muscle contraction. Evidence of selection in the Quarter Horse for the SINE insertion and/or “C” allele of the intron 1 SNP, which are in high linkage disequilibrium in both the Quarter Horse and the Thoroughbred [19], is consistent with prior implications of the intronic “C” allele as an indicator that a Thoroughbred race horse is best suited for short distance races while the “T” allele denotes horses better suited for longer distance racing [19], [20], [47]. Although not quantified in this study, it is also possible that an increase in fiber number, in addition to the observed change in fiber proportions, may occur as a result of one or both MSTN mutations as observed in MSTN null mice [50].
The mechanism by which either MSTN mutation may be acting to alter muscle fiber proportions in horses is not yet understood. It has been hypothesized that the intron 1 SNP may disrupt a putative transcription factor binding site [19] and a study of a cohort of untrained, young Thoroughbreds showed increased MSTN skeletal muscle mRNA expression from horses homozygous for the “C” allele [51] although in that work the authors do not analyze their results in relation to the SINE insertion. A hypothesized method for a functional effect of the SINE insertion stems from its position in the promoter of the gene, effectively shifting the position of many promoter elements 227 bp upstream of the transcription start site. A displacement of the wild-type position of promoter elements, including E box, FoxO and SMAD binding sites, which have been found to be critical for regulation of MSTN promoter activity [52]–[55], is hypothesized to down-regulate the expression of the gene. However, further work is needed to elucidate exactly how the timing and expression of MSTN may change with respect to either polymorphism, and how the SINE and/or the intron 1 SNP are functionally contributing to the observed differences in muscle fiber type proportions. Finally, although the MSTN variants shown to be associated with muscle fiber type proportions are found most commonly within the extended haplotype putatively under selection, the haplotype derived from the SNP array is not 100% predictive of any of the MSTN variants we assayed; therefore, it is possible that the haplotype is tagging a different variant of selective importance that is also in linkage disequilibrium with the variants studied, or that the ascertainment of the SNPs resulting in common variants being present on the SNP chip does not allow for the detection of subtle variations in haplotype in this region.
ECA23—Gait
In this study, we define a gaited horse as one exhibiting a different footfall pattern than displayed in the (flat) walk, trot, canter, or gallop, or a variation in the rhythm of the gait. Alternative forms of movement ranging from a 2-beat lateral gait (pace), to 4-beat diagonal and lateral ambling gaits are natural in many breeds and are often breed-defining characteristics. Alternative gaits have been selected due to increased ride comfort and for their associated visual characteristics. Horses from gaited breeds are judged upon their ability to perform the breed-specific gait and may be penalized for performing gaits not desired by the registry.
The signature of selection on ECA23 was found among all breeds in our sample that have been selected for alternative gaits as a breed-defining characteristic. The identification of one locus under a strong signal of selection shared across gaited breeds was initially surprising given the diversity of gaits found among breeds and the alternative hypothesis that each type of gait has a distinct evolutionary history. However, the significant across-breed signal of selection and conserved haplotype on ECA23 common among gaited breeds is compelling evidence that a major locus is involved in the determination of gait. Only two annotated genes are contained within the portion of this ECA23 haplotype shared across gaited breeds. Both genes are in the doublesex and mab-3 related transcription factor family (DMRT2 and DMRT3). While the primary role of these genes has historically been thought to be in sex differentiation [56], [57], recent work has suggested that their role is more far-reaching [58], [59]. Concurrent with this study, a variant in DMRT3 has been significantly associated with the ability to pace in Icelandic horses, and also appears to be necessary for horses in other breeds to perform alternate gaits [59]. The independent identification of this locus, which is contained within the haplotype shared across all gaited breeds (data not shown), supports the data suggesting that this region was targeted by selection for gait and endorses the use of this technique to identify loci under selection in the horse.
The presence of the same ECA23 haplotype in the gaited breeds within the Mangalarga Paulista, Saddlebred, and Morgan is not surprising. Certain individuals within these breeds have the ability to gait, although alternate gait is not a breed-defining characteristic. Conversely the “gait” haplotype is not found exclusively in populations that are gaited; this was also true for the DMRT3 mutation that is presumably driving this signature of selection [59]. For example, the French Trotters and Standardbreds included in the calculation of di do not display alternative gaits beyond the walk, trot, canter, and gallop, but are bred to race at a trot. In this study population, the “gait” haplotype also segregates (54% presence) in the Finnhorse, which is divergently selected for light draft, riding, or trotting types [40]. There is evidence that trotting performance is heritable [60] and haplotypic evidence, as well as that reported in [59], indicates that an effect of this locus on trotting aptitude cannot be ruled out.
Finally, the gaited populations in which this haplotype is found (Icelandic, Tennessee Walking Horse, Peruvian Paso, Puerto Rican Paso Fino) have various types of alternative gaits. Unless there are several variants captured within this haplotype, it appears that this locus does not itself explain the entirety of the variation in gait present in domestic horses. We therefore hypothesize that gait is a polygenic trait, and while a major locus on ECA23 may be permissive for gaitedness, variations among breeds are determined by modifying loci.
Other Loci in Breeds Selected for Athletic Performance
The popularity and economic value of Thoroughbred racehorses have led to extreme interest in identifying genomic variants that can be utilized to predict and/or improve performance. Several previous studies have focused upon identifying genomic regions and examining candidate genes that may be associated with performance traits in this breed [15], [61], [62]. In this study, the most significant di windows led to the identification of a large, 2.49 Mb conserved haplotype on ECA17 present in a large majority of the Thoroughbred chromosomes. All other breeds in which this haplotype is common are closely related to the Thoroughbred (JLP, unpublished data). This region of ECA17 was previously implicated as having selective importance in the Thoroughbred [15], and the syntenic region of the canine genome was noted as a region of selection in several dog breeds [9]. With long blocks of LD in the Thoroughbred breed, and many annotated and predicted genes, this region represents an area that is of further interest for evaluation via resequencing. Finally, the significant window on ECA14 in the Thoroughbred shared with the Quarter Horse and Swiss Warmblood contains an extended haplotype found in moderate frequency (0.32) across all breeds and also many annotated genes. This is another of many regions not investigated further in this study that are promising targets for future exploration.
Size
Size, including both height and mass, is a highly-studied phenotype. Loci involved in the determination of size have been identified in the dog [4], [6], [9], [63]–[65], cattle [66]–[68] and humans [69]–[71], among other species. In horses, a majority of variation in skeletal measurements in can be explained by one principal component [72] and four loci have been identified that account for a large proportion of variance in size across breeds [73]. In addition, two significant quantitative trait loci for size have been identified in the Franches-Montagnes [74].
Although all are known for their size and strength, each draft horse population has its own, unique history. While the British Isles native Clydesdale and Shire, and mainland European Belgian and Percheron, are all considered heavy draft horses, several breeds with smaller stature but still bred for substance and strength (light draft) are included in the dataset. Therefore, a conserved haplotype across all heavy and light draft breeds, regardless of their origin, is strong evidence that the locus on ECA11 may be involved in the determination of size, as defined by height and/or mass. Support for this assertion is also found in an alternate conserved haplotype present across the same SNPs in the Miniature horse and Shetland pony and by the recent work of [73] who propose LIM and SH3 protein 1 (LASP1), on ECA11 as a candidate gene for size. In addition to utility in the horse, the identification of functional polymorphism(s) in this region may lend insight into size variation in other species.
Several genes are frequently proposed as important to the determination of height or mass in mammals; we examined the regions surrounding many of these genes for significant di values, finding evidence of putative selection in three instances: IGF1, NCAPG, and HGMA2. In studies of dog, mice, and humans, insulin-like growth factor 1 (IGF1) has been implicated to be as a major locus in size determination [6], [64], [65], [75]–[78]. In our genome scan the light draft breed, Franches-Montagnes, was the only sample with a significant di value in the region encompassing IGF1 (ECA28). A common haplotype in the Franches-Montagnes was identified in 68.4% of the chromosomes of that population. This haplotype, however, was found in approximately 17% of the entire sample and in moderate frequencies in breeds that vary in size such as the Miniature, Shetland, and North Swedish Horse (data not shown). While this could indicate selection for a variant, the sharing of this haplotype with horses of all sizes suggests that either this locus is not the primary determinant of size in the horse, it is a false positive, it is under selection at moderate intensities across breeds, or that there may be one or more polymorphisms within the region found in a variety of haplotypic backgrounds.
The gene NCAPG, or region containing this gene (often including LCORL), has repeatedly been associated with body size in humans and cattle [66]–[71], [77], [79]. In horses, the region of ECA3 including NCAPG and LCORL was reported to be one of four loci that explain a significant proportion of variance to size in an across-breed study [73]. Additionally, this locus was recently associated with wither height in the Franches-Montagnes, where it was found to explain over 11 percent of variance in degressed estimated breeding value for the trait [74]. In our study the Franches-Montanges did not have a notable di value at this window, which is expected, as the segregation of this trait within the breed is what allowed for its detection under a QTL analysis framework.
As in the case of MC1R, the genic region of NCAPG itself is not covered by a di window due to low SNP density in the region; however the most proximal window was significant in the Belgian, which had a fixed haplotype shared with the Clydesdale. The high conservation of this haplotype across these breeds, as well as its occurrence in two sport horse breeds (Swiss Warmblood and Hanoverian), the Finnhorse, and French Trotter, but rarity in light horse and pony breeds, is additional evidence that this region may be a target of selection and playing a role in size determination of horses.
Finally, candidate gene HGMA2 has been associated with size in the horse [73] and dog [4], [9], with height in humans [69], [71], [80], [81], and also has been shown to be critical for cardiac development [82]. Equine HMGA2 is found at the telomeric end of ECA6, without sufficient SNP coverage for calculation of di. However, the Clydesdale showed a significant di value for the window nearest this gene, and along with the closely related Shire (JLP, unpublished data), was the only population with a high frequency, conserved haplotype proximal to (but not crossing) the gene. While this haplotype also includes four other genes and one novel transcript, the evidence in this and other studies suggest that this region may contain a variant with significant contribution to size that has been targeted during the derivation of the Clydesdale breed.
Conclusion
The di test statistic is designed to detect signatures of selection that are at or near fixation within a population, but success in detecting such loci is dependent upon and limited by the classification of populations. While classifying our samples by breed is a straight forward method, depending upon the question at hand it may be more appropriate to group breeds by performance type, shared phenotypic characters, or geographic region of origin. Although signatures of selection can be detected across breeds (i.e. ECA11 in the draft horses), traits with selective pressures shared across many breeds may go undetected. Finally, not all signatures of selection detected contain obvious haplotypes or candidate genes, and some regions contain no annotated genes at all. The regions on ECA8 in the Tennessee Walking Horse and Standardbred, ECA7 in the Standardbred, and ECA2 in the French Trotter are all examples of significant regions with extremely long, extended haplotypes containing many annotated genes but no obvious candidate for a known phenotype (data not shown); in these cases, the elevation of the baseline of di values may indicate the presence of large structural variants, which would decrease recombination and result in the divergence observed. In addition, some regions of interest, including the haplotype identified on ECA17 in the Puerto Rican Paso Fino, do not include any annotated genes. These regions should not go unattended, especially in light of recent work showing significant function of non-protein coding regions on regulation of gene expression [83]–[85]. Similarly, in cases where a compelling candidate gene may be present, this does not exclude flanking non-coding regions from containing the true variation under selection.
In summary, the population structure and diverse selective pressures among breeds make the modern horse an ideal model in which to identify genomic regions and variants causative of important phenotypes. While there are some caveats to this process, including that it is blinded by phenotype and the available genomic resource does not allow for complete genome coverage, it has already yielded evidence for variants of phenotypic importance. Continued pursuit of regions of significance not investigated herein shows immense promise to uncover novel functional mutations and discoveries of importance not only to the horse but the scientific community as a whole.
Materials and Methods
Ethics Statement
DNA extraction and genotyping was conducted using either pulled hair or blood samples from each horse. The tissues were collected under the appropriate animal care and use protocols for each participating institution. Gluteal muscle biopsies were taken in agreement with University of Minnesota IACUC protocol 1104A98793.
Samples and Genotyping
744 horses representing 33 breeds were collected through the Equine Genetic Diversity Consortium either as hair root samples or previously collected genotypes. For hair roots, DNA was isolated using a modification of the Puregene (Qiagen) protocol for DNA purification from tissue. Modifications include the addition of 750 µl of isopropanol rather than 300, increasing the precipitation spin time to15 m and doing so at 4°C, and washing the pellet twice. Approximately 1 µg of DNA was used for SNP genotyping using the Illumina SNP50 Beadchip according to the manufacturer's protocol. All genotype calls were extracted from the raw intensity data using GenomeStudio (Illumina) with the minimum gencall (GC) score threshold of 0.15.
Horses were chosen to be unrelated at, or more recent to, the grandparent level based upon pedigree information. In the case where pedigree information was not available, genome-sharing (pi hat) values were calculated for the autosomes in PLINK [86] (–genome) after pruning for minor allele frequency of 0.01 and genotyping rate of 0.05. One of each pair of individuals within each breed having pi hat values ≥0.25 was removed from the analysis.
di Statistic
Breed-specific population differentiation within 500 kb windows across the 31 autosomes was calculated using the statistic introduced by [4], di, in Perl. Only windows with a minimum of 4 SNPs were considered. For each breed, windows of significance were determined as those with di values falling into the 99th percentile of the empirical distribution.
Candidate Genes for Size
In addition to the significant di regions in the draft and Miniature Horse, regions housing known candidate genes for size were investigated for significant di values in draft and pony sized horses. Candidate genes were previously identified in studies of humans, dogs, and/or cattle; these genes included: ZBTB38, GDF5/UQCC, HHIP, TRIP11/ATXN3, LIN28B, SH3GL3/ADAMTSL3, CDK6 [87], PTCH1, PAPPA, CABLES1 [79], STC2 [6], HMGA2 [4],[6],[9],[64],[87], GPR126 [71], [79], [87], CHCHD7/RDHE2/PLAG1 [79], [87], IGF1, SMAD2 [6], [64], NCAPG/LOCRL [71], [73], [79], GDF5, EFEMP1, DLEU7, SCMH1, IHH, DYM [71], PRKG2, JAZF1 [70].
Phasing
The entire SNP dataset was pruned for minor allele frequency of 0.001 and genotyping rate of greater than 95%. The data from all such SNPs within genomic regions of interested identified by the di statistic, including those eliminated from di calculations, were phased using fastPHASE 1.2 [88]. Parameters were set to consider 25 to 45 clusters (-Kl25 –Ku45 –Ki5) and include breeds denoted as subpopulations. Conserved haplotypes were then identified within/among the breeds showing significant di values and the frequency of the identified haplotypes calculated within and across all breeds. The haplotypes were then examined for candidate genes that may contribute to desired phenotypes of the breed(s) of interest using the annotated equine reference sequence.
Follow-Up
Myostatin sequencing and variant genotyping
Primers for sequencing the entire MSTN gene, also known as GDF8, were taken from [44]. In addition, primers to cover two gaps in the gene sequence (one each in the first and second introns) not included using the primers in [20], were designed from the draft genome assembly sequence using Primer3 [89] (Table S4). The entire gene was sequenced in 8 Quarter Horses and 6 Thoroughbreds, chosen to represent the conserved haplotype as well as alternative haplotype(s). PCR protocols were as follows: 6–7 ng of DNA was amplified with 1× buffer (plus MgCl2 (Qiagen)), 450 µM dNTPs (Qiagen), and 0.2 µM of each primer, 1 unit of HotStart Taq polymerase (Qiagen) and enough water to yield 16 µl reactions. For MSTN 1–3, 6–8, 11, and 12, the thermalcycler profile consisted of 20 m at 94°C, followed by 35 cycles of 94°C for 30 s, 57°C for 30 s, and 72°C for 30 s, completed by a final extension time of 10 m. Primer pairs 14a and 16 were amplified using the same conditions but with an annealing temperature of 60°C. For the remaining primer pairs (MSTN4, 5, 9, 10, 13, and 14) a touchdown protocol was used in which the samples were held at 94°C for 20 m followed by 12 cycles of 94°C for 30 s, 68°C for 30 s, decreasing by 0.5°C/cycle, and 72°C for 30 s. These cycles were followed by an additional 23 cycles at an annealing temperature of 62°C and a final extension of 10 m. PCR products were checked for amplification on a 2% agarose gel stained by ethidium bromide and visualized by ultraviolet light. PCR product was cleaned for Sanger sequencing using the ExoSAP-IT protocol (USB Corporation). DNA sequencing in both directions was carried out at the University of Minnesota's Biomedical Genomic Center.
DNA from 389 horses (Quarter Horses and Paints) available from the Equine Neuromuscular Diagnostic Laboratory was genotyped for the presence/absence of the SINE insertion using primer pair MSTN_13 [20]. Gluteal muscle biopsies from 79 healthy Quarter Horses (genotyped as part of the 389 horses above) were randomly chosen for muscle fiber type analyses and also for the intron 1 SNP (g.66493737C>T) [20]. A subset of the samples was genotyped for the promoter SNP (g.66495715T/C) [21] using primer pair MSTN14a (Table S4). Of the 389 horses above, SNP array data was available from 132 as part of this study, or for another study in the laboratory. 63 horses with SNP array data were also genotyped for the intron 1 SNP. Genotypes from these horses were then used to evaluate the association between the extended haplotype and the SINE, the haplotype and intron 1 SNP, and SINE and SNP.
Muscle fiber type analysis
10 µm thick sections were cut from frozen gluteal muscle tissue, preincubated at pH 4.6, and stained for myosin adenosine triphosphatase (ATPase). Muscle fiber type compositions were determined by counting the number of Type 1, 2A, and 2B fibers for a minimum of 250 fibers per biopsy and calculating a percentage composition. Maximum skeletal muscle fiber diameters were determined in 25 fibers of each type using the I solution Lite software program (IMT Technology).
A MANOVA was performed to determine significance of genotype or allele effects of the MSTN SINE and/or intron 1 SNP and age on muscle fiber proportions assuming an additive mode of inheritance and including sex and age at biopsy as covariates. Directionality of the effect of the SINE and intron 1 SNP was then investigated using multiple linear regression in R (http://www.r-project.org). The effect size of the SINE and intron 1 SNP was determined along with 95% confidence intervals calculated around the mean. Additionally, a genotypic model was fit and least-squared means were calculated and pairwise differences in fiber type proportion associated with genotype were tested using Fisher's least significant difference (LSD).
Fiber diameters were evaluated for association with SINE and intron 1 SNP genotype using multiple linear regression with age and sex as covariates as noted above.
Availability of Data
All SNP genotype data is available upon request (www.animalgenome.org/repository/pub/UMN2012.1130/) for the purpose of reconstructing the analyses. The only exception is the data collected from the Tennessee Walking Horse, which, under agreement from the granting agency (to the University of Minnesota from the Foundation for the Advancement of the Tennessee Walking Show Horse (FAST) and the Tennessee Walking Horse Foundation (TWHF)), is only available under a Material Transfer Agreement (MTA) between interested individuals and the University of Minnesota.
Supporting Information
Zdroje
1. LippoldS, MatzkeNJ, ReissmannM, HofreiterM (2011) Whole mitochondrial genome sequencing of domestic horses reveals incorporation of extensive wild horse diversity during domestication. BMC Evol Biol 11 : 328.
2. LudwigA, PruvostM, ReissmannM, BeneckeN, BrockmannGA, et al. (2009) Coat color variation at the beginning of horse domestication. Science 324 : 485.
3. OutramAK, StearNA, BendreyR, OlsenS, KasparovA, et al. (2009) The earliest horse harnessing and milking. Science 323 : 1332–1335.
4. AkeyJM, RuheAL, AkeyDT, WongAK, ConnellyCF, et al. (2010) Tracking footprints of artificial selection in the dog genome. PNAS 107 : 1160–1165.
5. OlssonM, MeadowsJR, TruveK, Rosengren PielbergG, PuppoF, et al. (2011) A novel unstable duplication upstream of HAS2 predisposes to a breed-defining skin phenotype and a periodic fever syndrome in Chinese Shar-Pei dogs. PLoS Genet 7: e1001332 doi:10.1371/journal.pgen.1001332.
6. BoykoAR, QuignonP, LiL, SchoenebeckJJ, DegenhardtJD, et al. (2010) A simple genetic architecture underlies morphological variation in dogs. PLoS Biol 8: e1000451 doi:10.1371/journal.pbio.1000451.
7. PollingerJP, BustamanteCD, Fledel-AlonA, SchmutzS, GrayMM, et al. (2005) Selective sweep mapping of genes with large phenotypic effects. Genome Res 15 : 1809–1819.
8. QuilezJ, ShortAD, MartinezV, KennedyLJ, OllierW, et al. (2011) A selective sweep of >8 Mb on chromosome 26 in the Boxer genome. BMC Genomics 12.
9. VaysseA, RatnakumarA, DerrienT, AxelssonE, Rosengren PielbergG, et al. (2011) Identification of Genomic Regions Associated with Phenotypic Variation between Dog Breeds using Selection Mapping. PLoS Genet 7: e1002316 doi:10.1371/journal.pgen.1002316.
10. BarendseW, HarrisonBE, BunchRJ, ThomasMB, TurnerLB (2009) Genome wide signatures of positive selection: the comparison of independent samples and the identification of regions associated to traits. BMC Genomics 10 : 178.
11. ConsortiumTBH, GibbsRA, TaylorJF, Van TassellCP, BarendseW, et al. (2009) Genome-wide survey of SNP variation uncovers the genetic structure of cattle breeds. Science 324 : 528–532.
12. QanbariS, GianolaD, HayesB, SchenkelF, MillerS, et al. (2011) Application of site and haplotype-frequency based approaches for detecting selection signatures in cattle. BMC Genomics 12 : 318.
13. QanbariS, PimentelEC, TetensJ, ThallerG, LichtnerP, et al. (2010) A genome-wide scan for signatures of recent selection in Holstein cattle. Anim Genet 41 : 377–389.
14. KijasJW, LenstraJA, HayesB, BoitardS, Porto NetoLR, et al. (2012) Genome-wide analysis of the world's sheep breeds reveals high levels of historic mixture and strong recent selection. PLoS Biol 10: e1001258 doi:10.1371/journal.pbio.1001258.
15. GuJ, OrrN, ParkSD, KatzLM, SulimovaG, et al. (2009) A genome scan for positive selection in thoroughbred horses. PLoS ONE 4: e5767 doi:10.1371/journal.pone.0005767.
16. MarklundL, MollerMJ, SandbergK, AnderssonL (1996) A missense mutation in the gene for melanocyte-stimulating hormone receptor (MC1R) is associated with the chestnut coat color in horses. Mamm Genome 7 : 895–899.
17. McCueME, BannaschDL, PetersenJL, GurrJ, BaileyE, et al. (2012) A high density SNP array for the domestic horse and extant perissodactyla: utility for association mapping, genetic diversity, and phylogeny studies. PLoS Genet 8: e1002451 doi:10.1371/journal.pgen.1002451.
18. Bricker SJ, Penedo MCT, Millon LV, Murray JD. Linkage of the dun coat color locus to microsatellites on horse chomoromse 8; 2003; San Diego, CA.
19. HillEW, McGivneyBA, GuJJ, WhistonR, MacHughDE (2010) A genome-wide SNP-association study confirms a sequence variant (g.66493737C>T) in the equine myostatin (MSTN) gene as the most powerful predictor of optimum racing distance for Thoroughbred racehorses. BMC Genomics 11.
20. HillEW, GuJ, EiversSS, FonsecaRG, McGivneyBA, et al. (2010) A sequence polymorphism in MSTN predicts sprinting ability and racing stamina in thoroughbred horses. PLoS ONE 5: e8645 doi:10.1371/journal.pone.0008645.
21. Dall'OlioS, FontanesiL, Nanni CostaL, TassinariM, MinieriL, et al. (2010) Analysis of horse myostatin gene and identification of single nucleotide polymorphisms in breeds of different morphological types. J Biomed Biotechnol ID542945.
22. ClopA, MarcqF, TakedaH, PirottinD, TordoirX, et al. (2006) A mutation creating a potential illegitimate microRNA target site in the myostatin gene affects muscularity in sheep. Nat Genet 38 : 813–818.
23. GrobetL, MartinLJ, PonceletD, PirottinD, BrouwersB, et al. (1997) A deletion in the bovine myostatin gene causes the double-muscled phenotype in cattle. Nat Genet 17 : 71–74.
24. McPherronAC, LeeSJ (1997) Double muscling in cattle due to mutations in the myostatin gene. PNAS 94 : 12457–12461.
25. MosherDS, QuignonP, BustamanteCD, SutterNB, MellershCS, et al. (2007) A mutation in the myostatin gene increases muscle mass and enhances racing performance in heterozygote dogs. PLoS Genet 3: e79 doi:10.1371/journal.pgen.0030079.
26. SchuelkeM, WagnerKR, StolzLE, HubnerC, RiebelT, et al. (2004) Myostatin mutation associated with gross muscle hypertrophy in a child. N Engl J Med 350 : 2682–2688.
27. LindholmA, PiehlK (1974) Fibre composition, enzyme activity and concentrations of metabolites and electrolytes in muscles of standardbred horses. Acta Veterinaria Scandinavica 15 : 287–309.
28. GalisteoAM, AgueraE, MonterdeJG, MiroF (1992) Gluteus-Medius Muscle-Fiber Type Composition in Young Andalusian and Arabian Horses. J Equine Vet Sci 12 : 254–258.
29. LehnhardRA, McKeeverKH, KearnsCF, BeekleyMD (2004) Myosin heavy chain profiles and body composition are different in old versus young Standardbred mares. Vet J 167 : 59–66.
30. RoneusM (1993) Muscle characteristics in standardbreds of different ages and sexes. Equine Vet J 25 : 143–146.
31. RoneusM, LindholmA, AsheimA (1991) Muscle characteristics in Thoroughbreds of different ages and sexes. Equine Vet J 23 : 207–210.
32. SabetiPC, ReichDE, HigginsJM, LevineHZ, RichterDJ, et al. (2002) Detecting recent positive selection in the human genome from haplotype structure. Nature 419 : 832–837.
33. BrunbergE, AnderssonL, CothranG, SandbergK, MikkoS, et al. (2006) A missense mutation in PMEL17 is associated with the Silver coat color in the horse. BMC Genet 7 : 46.
34. CookD, BrooksS, BelloneR, BaileyE (2008) Missense mutation in exon 2 of SLC36A1 responsible for champagne dilution in horses. PLoS Genet 4: e1000195 doi:10.1371/journal.pgen.1000195.
35. MariatD, TaouritS, GuerinG (2003) A mutation in the MATP gene causes the cream coat colour in the horse. Genet Sel Evol 35 : 119–133.
36. ReissmannM, BierwolfJ, BrockmannGA (2007) Two SNPs in the SILV gene are associated with silver coat colour in ponies. Anim Genet 38 : 1–6.
37. RiederS, TaouritS, MariatD, LangloisB, GuerinG (2001) Mutations in the agouti (ASIP), the extension (MC1R), and the brown (TYRP1) loci and their association to coat color phenotypes in horses (Equus caballus). Mamm Genome 12 : 450–455.
38. Rosengren PielbergG, GolovkoA, SundstromE, CurikI, LennartssonJ, et al. (2008) A cis-acting regulatory mutation causes premature hair graying and susceptibility to melanoma in the horse. Nat Genet 40 : 1004–1009.
39. TerryRB, ArcherS, BrooksS, BernocoD, BaileyE (2004) Assignment of the appaloosa coat colour gene (LP) to equine chromosome 1. Anim Genet 35 : 134–137.
40. Hendricks BL (2007) International Encyclopedia of Horse Breeds. Norman: University of Oklahoma Pres. 486 p.
41. Weatherley L (1978) Great Horses of Britain. Hindhead: Spur Publications. viii, 269 p.
42. LeeSJ (2004) Regulation of muscle mass by myostatin. Annu Rev Cell Dev Biol 20 : 61–86.
43. GirgenrathS, SongK, WhittemoreLA (2005) Loss of myostatin expression alters fiber-type distribution and expression of myosin heavy chain isoforms in slow - and fast-type skeletal muscle. Muscle Nerve 31 : 34–40.
44. HennebryA, BerryC, SiriettV, O'CallaghanP, ChauL, et al. (2009) Myostatin regulates fiber-type composition of skeletal muscle by regulating MEF2 and MyoD gene expression. Am J Physiol Cell Physiol 296: C525–534.
45. WegnerJ, AlbrechtE, FiedlerI, TeuscherF, PapsteinHJ, et al. (2000) Growth - and breed-related changes of muscle fiber characteristics in cattle. J Anim Sci 78 : 1485–1496.
46. BinnsMM, BoehlerDA, LambertDH (2010) Identification of the myostatin locus (MSTN) as having a major effect on optimum racing distance in the Thoroughbred horse in the USA. Anim Genet 41 Suppl 2 : 154–158.
47. HillEW, FonsecaRG, McGivneyBA, GuJ, MacHughDE, et al. (2012) MSTN genotype (g.66493737C/T) association with speed indices in Thoroughbred racehorses. J Appl Phys 112 : 86–90.
48. TozakiT, HillEW, HirotaK, KakoiH, GawaharaH, et al. (2012) A cohort study of racing performance in Japanese Thoroughbred racehorses using genome information on ECA18. Anim Genet 43 : 42–52.
49. TozakiT, SatoF, HillEW, MiyakeT, EndoY, et al. (2011) Sequence Variants at the myostatin Gene Locus Influence the Body Composition of Thoroughbred Horses. J Vet Med Sci 73 : 1617–1624.
50. ElashryMI, OttoA, MatsakasA, El-MorsySE, PatelK (2009) Morphology and myofiber composition of skeletal musculature of the forelimb in young and aged wild type and myostatin null mice. Rejuv Res 12 : 269–281.
51. McGivneyBA, BrowneJA, FonsecaRG, KatzLM, MacHughDE, et al. (2012) MSTN genotypes in Thoroughbred horses influence skeletal muscle gene expression and racetrack performance. Anim Genet 43 : 810–812.
52. AllenDL, UntermanTG (2007) Regulation of myostatin expression and myoblast differentiation by FoxO and SMAD transcription factors. Am J Physiol Cell Physiol 292: C188–199.
53. GuimaraesSEF, StahlCH, LonerganSM, GeigerB, RothschildMF (2007) Myostatin promoter analysis and expression pattern in pigs. Livestock Sci 112 : 143–150.
54. SalernoMS, ThomasM, ForbesD, WatsonT, KambadurR, et al. (2004) Molecular analysis of fiber type-specific expression of murine myostatin promoter. Am J Physiol Cell Physiol 287: C1031–1040.
55. SpillerMP, KambadurR, JeanplongF, ThomasM, MartynJK, et al. (2002) The myostatin gene is a downstream target gene of basic helix-loop-helix transcription factor MyoD. Mol Cell Biol 22 : 7066–7082.
56. RaymondCS, ShamuCE, ShenMM, SeifertKJ, HirschB, et al. (1998) Evidence for evolutionary conservation of sex-determining genes. Nature 391 : 691–695.
57. YiW, ZarkowerD (1999) Similarity of DNA binding and transcriptional regulation by Caenorhabditis elegans MAB-3 and Drosophila melanogaster DSX suggests conservation of sex determining mechanisms. Development 126 : 873–881.
58. HongCS, ParkBY, Saint-JeannetJP (2007) The function of Dmrt genes in vertebrate development: it is not just about sex. Dev Biol 310 : 1–9.
59. AnderssonLS, LarhammarM, MemicF, WootzH, SchwochowD, et al. (2012) Mutations in DMRT3 alter locomotion in horses and spinal circuit function in mice. Nature 488 : 642–646.
60. ThiruvenkadanAK, KandasamyN, PanneerselvamS (2009) Inheritance of racing performance of trotter horses: An overview. Livestock Sci 124 : 163–181.
61. GuJ, MacHughDE, McGivneyBA, ParkSD, KatzLM, et al. (2010) Association of sequence variants in CKM (creatine kinase, muscle) and COX4I2 (cytochrome c oxidase, subunit 4, isoform 2) genes with racing performance in Thoroughbred horses. Equine Vet J 42 Suppl 38 : 569–575.
62. HillEW, GuJ, McGivneyBA, MacHughDE (2010) Targets of selection in the Thoroughbred genome contain exercise-relevant gene SNPs associated with elite racecourse performance. Anim Genet 41 Suppl 2 : 56–63.
63. ChaseK, JonesP, MartinA, OstranderEA, LarkKG (2009) Genetic mapping of fixed phenotypes: disease frequency as a breed characteristic. J Hered 100 Suppl 1: S37–41.
64. JonesP, ChaseK, MartinA, DavernP, OstranderEA, et al. (2008) Single-nucleotide-polymorphism-based association mapping of dog stereotypes. Genetics 179 : 1033–1044.
65. SutterNB, BustamanteCD, ChaseK, GrayMM, ZhaoK, et al. (2007) A single IGF1 allele is a major determinant of small size in dogs. Science 316 : 112–115.
66. EberleinA, TakasugaA, SetoguchiK, PfuhlR, FlisikowskiK, et al. (2009) Dissection of genetic factors modulating fetal growth in cattle indicates a substantial role of the non-SMC condensin I complex, subunit G (NCAPG) gene. Genetics 183 : 951–964.
67. SetoguchiK, FurutaM, HiranoT, NagaoT, WatanabeT, et al. (2009) Cross-breed comparisons identified a critical 591-kb region for bovine carcass weight QTL (CW-2) on chromosome 6 and the Ile-442-Met substitution in NCAPG as a positional candidate. BMC Genet 10 : 43.
68. SetoguchiK, WatanabeT, WeikardR, AlbrechtE, KuhnC, et al. (2011) The SNP c.1326T>G in the non-SMC condensin I complex, subunit G (NCAPG) gene encoding a p.Ile442Met variant is associated with an increase in body frame size at puberty in cattle. Anim Genet 42 : 650–655.
69. GudbjartssonDF, WaltersGB, ThorleifssonG, StefanssonH, HalldorssonBV, et al. (2008) Many sequence variants affecting diversity of adult human height. Nat Genet 40 : 609–615.
70. SoranzoN, RivadeneiraF, Chinappen-HorsleyU, MalkinaI, RichardsJB, et al. (2009) Meta-analysis of genome-wide scans for human adult stature identifies novel loci and associations with measures of skeletal frame size. PLoS Genet 5: e1000445 doi:10.1371/journal.pgen.1000445.
71. WeedonMN, LangoH, LindgrenCM, WallaceC, EvansDM, et al. (2008) Genome-wide association analysis identifies 20 loci that influence adult height. Nat Genet 40 : 575–583.
72. BrooksSA, Makvandi-NejadS, ChuE, AllenJJ, StreeterC, et al. (2010) Morphological variation in the horse: defining complex traits of body size and shape. Anim Genet 41 Suppl 2 : 159–165.
73. Makvandi-NejadS, HoffmanGE, AllenJJ, ChuE, GuE, et al. (2012) Four Loci explain 83% of size variation in the horse. PLoS ONE 7: e39929 doi:10.1371/journal.pone.0039929.
74. Signer-HaslerH, FluryC, HaaseB, BurgerD, SimianerH, et al. (2012) A genome-wide association study reveals loci influencing height and other conformation traits in horses. PLoS ONE 7: e37282 doi:10.1371/journal.pone.0037282.
75. BakerJ, LiuJP, RobertsonEJ, EfstratiadisA (1993) Role of insulin-like growth factors in embryonic and postnatal growth. Cell 75 : 73–82.
76. LiuJP, BakerJ, PerkinsAS, RobertsonEJ, EfstratiadisA (1993) Mice carrying null mutations of the genes encoding insulin-like growth factor I (Igf-1) and type 1 IGF receptor (Igf1r). Cell 75 : 59–72.
77. OkadaY, KamataniY, TakahashiA, MatsudaK, HosonoN, et al. (2010) A genome-wide association study in 19 633 Japanese subjects identified LHX3-QSOX2 and IGF1 as adult height loci. Hum Mol Genet 19 : 2303–2312.
78. WoodsKA, Camacho-HubnerC, BarterD, ClarkAJ, SavageMO (1997) Insulin-like growth factor I gene deletion causing intrauterine growth retardation and severe short stature. Acta Paediatr Suppl 423 : 39–45.
79. PryceJE, HayesBJ, BolormaaS, GoddardME (2011) Polymorphic regions affecting human height also control stature in cattle. Genetics 187 : 981–984.
80. VisscherPM (2008) Sizing up human height variation. Nat Genet 40 : 489–490.
81. WeedonMN, LettreG, FreathyRM, LindgrenCM, VoightBF, et al. (2007) A common variant of HMGA2 is associated with adult and childhood height in the general population. Nat Genet 39 : 1245–1250.
82. MonzenK, ItoY, NaitoAT, KasaiH, HiroiY, et al. (2008) A crucial role of a high mobility group protein HMGA2 in cardiogenesis. Nat Cell Biol 10 : 567–574.
83. MauranoMT, HumberR, RynesE, ThurmanRE, HaugenE, et al. (2012) Systematic localization of common disease-associated variation in regulatory DNA. Science 337 : 1190–1195.
84. BernsteinBE, BirneyE, DunhamI, GreenED, GunterC, et al. (2012) An integrated encyclopedia of DNA elements in the human genome. Nature 489 : 57–74.
85. VernotB, StergachisAB, MauranoMT, VierstrJ, NephS, et al. (2012) Personal and population genomics of human regulatory variation. Genome Res 22 : 1689–1697.
86. PurcellS, NealeB, Tood-BrownK, ThomasL, FerreiraMAR, et al. (2007) PLINK: a toolset for whole-genome association and population-based linkage analysis. Amer J Hum Genet 81 : 559–575.
87. LettreG, JacksonAU, GiegerC, SchumacherFR, BerndtSI, et al. (2008) Identification of ten loci associated with height highlights new biological pahtways in human growth. Nat Genet 40 : 584–591.
88. ScheetP, StephensM (2006) A fast and flexible statistical model for large-scale population genotype data: applications to inferring missing genotypes and haplotypic phase. Am J Hum Genet 78 : 629–644.
89. Rozen S, Skaletsky H (2000) Primer3 on the WWW for general users and for biologist programmers. In: Krawetz S, Misener S, editors. Bioinformatics Methods and Protocols: Methods in Molecular Biology. Humana Press, Totowa, NJ, pp 365–386.
Štítky
Genetika Reprodukční medicínaČlánek vyšel v časopise
PLOS Genetics
2013 Číslo 1
- Kazuistika – Perspektivy využití precizované medicíny v rámci personalizované specifické terapie onkologických pacientů
- Nobelova cena za chemii pro genetické nůžky: Objev, který změní naši budoucnost?
- Technologie na bázi RNA v klinické praxi: od přebarvených petúnií k terapii vzácných a dosud jen obtížně léčitelných chorob u lidí
- „Nepředstavovali jsme si, že náš výzkum povede přímo ke vzniku nových léků, dokonce ještě za našeho života“
- Bezplatné služby pro diagnostiku ATTRv amyloidózy pro kardiology
Nejčtenější v tomto čísle
- Function and Regulation of , a Gene Implicated in Autism and Human Evolution
- An Insertion in 5′ Flanking Region of Causes Blue Eggshell in the Chicken
- Comprehensive Methylome Characterization of and at Single-Base Resolution
- Susceptibility Loci Associated with Specific and Shared Subtypes of Lymphoid Malignancies
Zvyšte si kvalifikaci online z pohodlí domova
Mazová zátka a její řešení
nový kurzVšechny kurzy