
Transcriptional Dynamics Elicited by a Short Pulse of Notch Activation Involves Feed-Forward Regulation by Genes
Dynamic activity of signaling pathways, such as Notch, is vital to achieve correct development and homeostasis. However, most studies assess output many hours or days after initiation of signaling, once the outcome has been consolidated. Here we analyze genome-wide changes in transcript levels, binding of the Notch pathway transcription factor, CSL [Suppressor of Hairless, Su(H), in Drosophila], and RNA Polymerase II (Pol II) immediately following a short pulse of Notch stimulation. A total of 154 genes showed significant differential expression (DE) over time, and their expression profiles stratified into 14 clusters based on the timing, magnitude, and direction of DE. E(spl) genes were the most rapidly upregulated, with Su(H), Pol II, and transcript levels increasing within 5–10 minutes. Other genes had a more delayed response, the timing of which was largely unaffected by more prolonged Notch activation. Neither Su(H) binding nor poised Pol II could fully explain the differences between profiles. Instead, our data indicate that regulatory interactions, driven by the early-responding E(spl)bHLH genes, are required. Proposed cross-regulatory relationships were validated in vivo and in cell culture, supporting the view that feed-forward repression by E(spl)bHLH/Hes shapes the response of late-responding genes. Based on these data, we propose a model in which Hes genes are responsible for co-ordinating the Notch response of a wide spectrum of other targets, explaining the critical functions these key regulators play in many developmental and disease contexts.
Published in the journal:
. PLoS Genet 9(1): e32767. doi:10.1371/journal.pgen.1003162
Category:
Research Article
doi:
https://doi.org/10.1371/journal.pgen.1003162
Summary
Dynamic activity of signaling pathways, such as Notch, is vital to achieve correct development and homeostasis. However, most studies assess output many hours or days after initiation of signaling, once the outcome has been consolidated. Here we analyze genome-wide changes in transcript levels, binding of the Notch pathway transcription factor, CSL [Suppressor of Hairless, Su(H), in Drosophila], and RNA Polymerase II (Pol II) immediately following a short pulse of Notch stimulation. A total of 154 genes showed significant differential expression (DE) over time, and their expression profiles stratified into 14 clusters based on the timing, magnitude, and direction of DE. E(spl) genes were the most rapidly upregulated, with Su(H), Pol II, and transcript levels increasing within 5–10 minutes. Other genes had a more delayed response, the timing of which was largely unaffected by more prolonged Notch activation. Neither Su(H) binding nor poised Pol II could fully explain the differences between profiles. Instead, our data indicate that regulatory interactions, driven by the early-responding E(spl)bHLH genes, are required. Proposed cross-regulatory relationships were validated in vivo and in cell culture, supporting the view that feed-forward repression by E(spl)bHLH/Hes shapes the response of late-responding genes. Based on these data, we propose a model in which Hes genes are responsible for co-ordinating the Notch response of a wide spectrum of other targets, explaining the critical functions these key regulators play in many developmental and disease contexts.
Introduction
Cell fates during development are controlled, in part, by the activity of signaling pathways including Notch. Frequently, the response to signaling pathways is analyzed many hours or days after signaling is initiated, despite the fact that early events can occur within seconds of the stimulus and transcriptional changes can arise within minutes [1]–[4]. Gaining insights into the immediate changes that take place in response to signaling activity is therefore of major importance in understanding the regulatory mechanisms that ultimately translate into fate decisions. For example, crosstalk between growth factor signaling and centrosome assembly was revealed by analyzing ubiquitinylation within 30 minutes of stimulation [1].
A crucial step in signaling pathway function is transmission of the signal to the nucleus. For many pathways there are multiple intermediate steps in this relay. However the activation of Notch has a direct route to the nucleus as it elicits a proteolytic cleavage that releases the Notch intracellular domain (Nicd). This directly enters the nucleus to generate a rapid transcriptional response [5]–[9]. Real time imaging indicates translocation occurring within minutes of activation [2], [3]. Once in the nucleus, Nicd associates with transcription factors of the CSL family (Su(H) in Drosophila) [8], [9]. Thus, effects on gene expression are a primary consequence of activating the pathway, making it important to analyse the transcriptional changes that are elicited as well as the ultimate changes in cell fate.
The Notch pathway functions in many different developmental decisions, in some cases preventing differentiation and in others promoting it [10]–[12]. Inappropriate activity of Notch also contributes to many diseases including cancers, where it promotes or prevents tumorigenesis depending on the context [11], [13]–[16]. Despite these differences, genes of the Hairy and Enhancer of split family (Hes genes) are strongly upregulated in the majority of Notch signaling contexts that have been analysed [17]–[20]. These genes encode bHLH repressors that are direct targets of the Notch pathway and their expression can account for much of the functional output of the pathway. For example, during neurogenesis their inhibition of proneural proteins is critical [21], [22] and in T-cell acute lymphoblastic leukaemia their repression of PTEN contributes to the cancer [23], [24]. Thus, mutations eliminating Hes gene function frequently phenocopy the loss of Notch [18], [25]–[28]. However, more recently it has become evident that there are complex programmes of gene expression changes elicited by Notch activation. Such results have emerged principally from analysis of genome-wide changes in transcription that are detected in cell culture using simple strategies to manipulate Notch activity [29]–[32]. The hundreds or thousands of genes whose expression has been found to change following Notch signaling are hard to reconcile with the previous evidence demonstrating the importance of the Hes genes. Furthermore, the targets frequently include positive and negative regulators of the same pathways, making the logic of the response hard to interpret [29], [33].
The discovery of these large and diverse cohorts of Notch targets raises the possibility that different targets are activated with different kinetics and/or at different levels of signaling. If this were the case it could have profound effects on the outcome [34]. It would also raise the question of how, mechanistically, such differential responses could be generated. One possibility is that target genes contain different numbers or arrangements of CSL binding sites [35]–[40]. Another is that some genes may be primed for activation by the prior recruitment of Polymerase II (Pol II) [41]–[44]. Elucidating the temporal and kinetic relationships between target gene activation, and the underlying molecular mechanisms, is therefore important for understanding the effects downstream of Notch and of signaling outputs in general. We have undertaken a comprehensive analysis of the transcriptional changes elicited within minutes of Notch activation using a short pulse of EDTA treatment. We performed a fine-scaled timecourse of the genome-wide changes in expression over 150 min after Notch activation, in parallel with an assessment of Su(H) and RNA polymerase II binding to give new insights into the Notch response. We find several different profiles of transcriptional response amongst Notch targets, which cannot be fully explained by differences in Pol II or Su(H) binding or in the arrangement of Su(H) binding sites. Our analysis demonstrates that the temporal differences arise, at least in part, from feed-forward cross-regulation between genes with different response profiles. The E(spl)bHLH genes appear to have a critical role in this regulation, helping to explain their pivotal contribution to the Notch response.
Results
Profiling the response to Notch activation
To investigate whether target genes are activated with different kinetics, we used expression microarrays to profile the temporal changes in transcript levels following a pulse of Notch activation (Figure 1A). Exposing Drosophila DmD8 cells to a calcium chelator (EDTA) renders the Notch receptor susceptible to an activating cleavage by gamma-secretase and a concomitant release of the Notch Intracellular Domain (Nicd) that mediates Su(H)-dependant gene activation [45]. This strategy allows precise temporal control over pathway stimulation and provides a reliable method for Notch activation [2], [29], [46], [47] although it may also elicit some non-specific effects. We found that a five min pulse of EDTA was sufficient to generate the active Nicd fragment which could be co-immunoprecipitated with Su(H) (Figure 1B–1C) and had largely decayed within 30 min. RNA samples collected at timed intervals following the pulse of Notch activation were used to generate labelled cDNA for hybridization to long-oligonucleotide microarrays [48]. Control non-activated samples were collected in parallel and pooled to generate a common reference, improving normalization between arrays and between the four biological replicates. Analysis of these data revealed 154 genes that showed differences in expression levels across the timecourse (Table S1). We subsequently refer to these as differentially expressed (DE) genes, which corresponded to a slightly larger number of DE transcripts (301) because more than one transcript isoform may show DE at some loci.

To correlate the induced expression changes with underlying regulatory mechanisms, the genomic binding of the active form of Pol II (Ser 2 or Ser 5 phosphorylated) and of the transcription factor Su(H) was monitored over a similar time period by chromatin immunoprecipitation (ChIP) followed by hybridisation to whole genome tiling arrays (Figure 1A). Regions of Su(H) or Pol II binding were identified by applying a peak calling algorithm that incorporated information from the magnitude of the enrichment and the number of consecutive enriched probes (see Text S1). From the Pol II binding data all transcribed regions were subdivided into four classes: Unbound (UB), no Pol II bound; Poised (P), Pol II binding at 5′ end but not within the body of the gene; active poised (AP), a peak of Pol II enrichment at the 5′ end and binding throughout the transcribed region; active uniform (AU), Pol II binding across the transcribed region (Figure 1D). Taking as an example Pol II binding prior to Notch activation, this classification of gene states at 0 min was largely consistent with the relative magnitude of the absolute levels of mRNA expression measured by our microarray analysis at the start of the time course (Figure 1E, Table S1).
Different temporal profiles in response to Notch activation
To determine whether the 154 DE genes could be sub-divided based on their response profiles we used an unbiased clustering analysis. This employed Bayesian clustering, with the Dirichlet-process prior, to look for and group related patterns in the data, while estimating the number of clusters directly from the data [49]. Through this analysis, we found that the RNA profiles of responsive genes could be stratified into 14 clusters, reflecting differences in response amplitude, in temporal profile and in expression “noise” (due to stochasticity in the transcription process and noise in data collection). Broadly speaking the 14 clusters were of 3 types: early upregulation (2 clusters), late upregulation (6 clusters) and down regulation (6 clusters) (Figure 2 and Figure S1). Comparing these data with our previously reported study [29], we found that all but one cluster (cluster 14) contained genes whose expression was affected by blocking Nicd release with a gamma-secretase inhibitor. The 98 genes allocated to the upregulated clusters were enriched (p<0.05) in functions related to response to stimulus (GO:0050896), organ development (GO:0048513) and Notch signaling (GO:0007219). Genes in the downregulated clusters were also enriched for regulation of signaling (GO:0023051; GO:0050896), notably for negative regulation (GO:0023057). For further analysis we elected to focus primarily on the six clusters that were most clearly related to the pulse of Notch activation as they showed relatively strong (>25%) up or down regulation in the first half of the time course (Figure 2).

Genes in clusters 1 and 2 had profiles indicating a rapid response to the Notch activation conditions, with maximal levels detected between 20–30 min, and were composed almost entirely of E(spl) genes. Of those, all but HLHmγ and HLHmδ were segregated together in cluster 1: the latter two were allocated to cluster 2 due to their smaller changes in expression levels. Cluster 2 also contained the gene Wrinkled/hid (W/hid; a regulator of apoptosis), which interestingly showed a similar response profile despite the fact that it contains three relatively large introns and is significantly larger (17 kb) than the intron-less E(spl) genes (<2 kb) (Figure 2). Previous studies have demonstrated that W/hid is a direct Notch target [29] and that Notch regulates apoptosis (reviewed in [50]). However, we did not detect any increase in activated Caspase3 in treated cells, possibly due to the transient nature of the Notch pulse (Figure S2A, S2B).
Genes in cluster 3 and cluster 4, like the remaining upregulated clusters, exhibited a more delayed response with maximal expression detected at least 60 min after induction (Figure 2; Figure S1). Cluster 3 contained genes involved in development (e.g. GO:0007444) and genes that had previously been identified as direct Notch targets [29], including pebbled (peb), hibris (hbs) and derailed (drl)(Figure 2). The latter makes it plausible that upregulation of at least some cluster 3 genes involves a direct input from Notch, suggesting there could be a mechanism delaying their response to the Notch pulse. Cluster 4 also contained a previously identified Notch target (unc-5) as well as several stress and immune response genes (e.g. heat shock protein 26) that could be induced under adverse conditions such as starvation (Table S1) [51], [52]. However, none were induced in previous control experiments where EDTA treatment was applied to cells that lacked Notch (data not shown). One other weakly upregulated cluster, cluster 9 also contained several developmentally related genes, including the Notch target Egfr [29].
Finally, clusters 5 and 6, like several other clusters, were repressed during the time course following activation (Figure 2; Figure S1). In previous experiments the downregulation of targets, such as hairy, was prevented by pre-treating cells with gamma-secretase inhibitor [29]. However, since Nicd is associated with transcriptional activation, the observed repression is more likely to be an indirect effect of Notch. Cluster 5 contained genes involved in regulating transcription and intracellular signaling cascades, including repressors such as hairy and puckered. Some of these genes exhibited an initial transient increase in expression before their RNA levels declined (Figure 2). Cluster 6 was enriched for genes involved in metabolism, a functional signature that was also found to be downregulated by Notch in other contexts [30]. Other clusters were stratified depending on the timing and magnitude of reduced expression, and included negative regulators of signaling (SOCS36E and mah-jong; cluster 12) and Notch pathway regulators (Serrate and fringe; cluster 11) (Figure S1).
Transient and rapid recruitment of Su(H) and Pol II to E(spl) genes
Since the response profiles from the well-characterized targets encoded within the E(spl) complex stratified into two different clusters, we first investigated whether Pol II and/or Su(H) binding dynamics over this genomic region could explain the differences in target gene expression (Figure 3A, 3B). For example, it has been suggested that prior recruitment of Pol II (poised Pol II) is important for rapid transcriptional responses [41]–[44]. However, this is not supported by our results. Although there is a rapid and dynamic recruitment of Pol II within 10 minutes of Notch activation, not all the rapidly responding cluster 1 genes have pre-bound Pol II. Overall, three features emerge from our data: (i) Pol II is only pre-bound at three of the eight early responding loci, and therefore does not provide a clear prediction of Notch responsive genes or rapidity of the response; (ii) recruitment of Su(H) is dynamic, showing both spatial and temporal differences in occupancy over time; (iii) Pol II intensity and Su(H) binding at T = 10 min is a good indicator of overall DE of clusters 1 & 2.

Six of the twelve genes in the E(spl) complex were classified into cluster 1 (HLHm3, HLHmβ, HLHm7, m6, mα, m2) with strong upregulation following the 5 min pulse of Notch activation, two showed weaker upregulation (HLHmγ, HLHmδ), segregating in cluster 2. Despite their rapid and robust upregulation, only three of the cluster 1 E(spl) genes had detectable Pol II present prior to activation (0 min, Figure 3A). HLHm3 and HLHmβ genes exhibited strong Pol II binding close to the transcription start-site, with little or no Pol II detected across the body of the gene, suggestive of paused or poised Pol II at these loci. A low level of Pol II binding was also detected at the start of HLHm7. Neither E(spl) gene in cluster 2 had Pol II prebound. By 10 min after Notch activation, there was a rapid and robust recruitment of Pol II across all of the eight upregulated E(spl) genes (Figure 3A), irrespective of whether they were cluster 1 or 2, although there were much lower levels of Pol II detected at cluster 2 genes. Thus Pol II was rapidly recruited, not only to the three genes with Pol II poised at 0 min, but also to five other genes in the complex that had no pre-bound Pol II. For example, m6 (cluster 1) had no Pol II present at 0 min, yet manifested a robust Pol II recruitment within 10 min; HLHmγ (cluster 2) also had Pol II recruited by 10 minutes although the levels were considerably lower than at other loci correlating with the lower levels of expression (Figure 3A, 3B).
Su(H) was detected at a subset (6/8) of the regulated E(spl) genes prior to Notch activation (Figure 3A) that corresponded to cluster 1 genes. Thus at 0 mins Su(H) binding was evident at the enhancers associated with the two poised genes, HLHm3 and HLHmβ (which have previously been shown to have Su(H) bound prior to activation [47]), as well as at the enhancers associated with HLHmα, HLHm2, HLHm6 and HLHm7, even though no Pol II was present at those genes, indicating that Su(H) binding is not sufficient for Pol II recruitment. Furthermore, we detected little or no Su(H) binding prior to activation at the enhancers for the cluster 2 upregulated genes, HLHmγ and HLHmδ (Figure 3A).
Strikingly the Su(H) profiles also increased after Notch activation. The enrichment increased at all the sites, reaching maximal levels at 20–30 min and declining thereafter (Figure 3A). These observations are similar to those reported previously [29], [31], [47] and suggest that Su(H) binding becomes stabilized after N activation [38], [47]. In contrast, no Su(H) binding was detected at the characterized site 5′ of HLHmγ, despite the fact that Pol II was recruited to the gene and that the region was shown to provide Su(H) dependent regulation to reporter genes [39], [53]. We also note that neither Su(H) nor Pol II were recruited to the m4 - HLHm5 gene region at any time, in agreement with their lack of activity in DmD8 cells, although both genes are Notch responsive in other contexts [36], [54].
Relationship of Pol II class and Su(H) binding to response profiles
Extending the analysis to the other temporal clusters, we considered their relationship to Pol II class at 0 min and to Su(H) binding (Figure 4A, Tables S1 and S2) to determine whether the clusters exhibited different patterns of recruitment. Together the analysis suggests that Pol II class and Su(H) binding influence the response profile, although there is no strict relationship between either parameter and the response cluster.

As discussed above, the strongest responding groups (1 and 2) consist primarily of genes from the E(spl) complex where the majority of genes recruit Pol II de novo (i.e. they change from unbound, UB, to active, AP/AU, after activation) and hence were enriched for the UB class at 0 min. We note that the other member of cluster 2, W/hid, was P class at 0 mins (Figure 4A, 4B) and, like the cluster 1 genes, was associated with Su(H) binding at 0 mins. Confirming the role of Su(H) in W/hid regulation, we found that mutation of the Su(H) motifs underlying the peak region abolished Notch responsiveness in transient transfection assays (Figure S2C). The other cluster 2 genes, HLHmγ and HLHmδ, were also associated with 0 min peaks of Su(H) binding within 10 kb, although there was only a single site of Su(H) binding that was located in the region 5′ of HLHmδ and that showed increased binding after activation (Figure 3A, Figure 4A and 4B).
Genes in clusters 3 and 4, which showed moderate or weak changes in expression, were distributed between the UB, P, and AP Pol II classes at 0 mins (Figure 4A), and most showed increased Pol II recruitment by 20–30 mins (e.g. Figure 4C). Thus, although 40–50% of loci had some poised polymerase, a substantial fraction of the upregulated genes in these clusters, like the cluster 1 genes, were not bound by polymerase prior to activation (UB at 0 min). Of the two clusters, only cluster 3 was strongly enriched for genes located in proximity to Su(H) peaks (Figure 4A; Tables S1, S2). At those loci the Su(H) binding profiles, as determined by peak area, largely mirrored the expression profiles. The levels of Su(H) binding in cluster 3 genes thus equated with the upregulation of mRNA, although they were considerably reduced in magnitude compared with the sites associated with cluster 1 genes (Figure 5A, 5B).

Finally, clusters with repressed profiles were enriched in AU and AP class at 0 min compared to the other clusters, and many had a detectable decrease in Pol II recruitment by 20 min after activation (e.g. hairy, Figure 4D). Since the observed repression is likely to be an indirect effect of Notch, we did not expect to find any association with Su(H) binding at these genes. Surprisingly however, a small number of genes were associated with Su(H) peaks (Table S1). These also showed a brief increase in expression, which correlated with an increase in Pol II recruitment (e.g. edl, argos, Figure S3), before the mRNA and Pol II levels declined, suggesting that they could receive a transient input from Nicd.
Together the analysis suggests that the different response clusters have a bias towards different Pol II classes and Su(H) binding profiles. Thus, although calculations indicate that, overall, P class (poised polymerase) transcripts had an increased likelihood of DE whereas the likelihood for active uniform (AU) class was significantly reduced (Figure 5C; see Text S1), the distribution of Pol II classes differed according to the response profile. Likewise, upregulated DE genes were more likely than other genes to have Su(H) binding within 10 kb at some point during the timecourse (Figure 5C) and to attain a higher level of peak expression than other DE genes over the timecourse, however the timing and magnitude of recruitment, based on peak area, differed (Figure 5A).
Relationship of Su(H) motifs and occupancy to DE
One possible explanation for the differences in Su(H) recruitment is that the target enhancers differ in the number, arrangement or affinity of Su(H) binding sites. However, we found no differences in the number or apparent affinity of Su(H) motifs underlying the Su(H) binding peaks associated with genes in different clusters, with each peak containing one or more high affinity sites, based on matches to previously identified Su(H) binding motifs (Table S3) [29]. In contrast, we found that all of the peaks associated with E(spl) genes in clusters 1 and 2 contained at least one paired Su(H) site (SPS). However, no SPS motif was present in the W/hid associated peak although this gene responded with a similar profile to the E(spl) genes in the same cluster (Figure 2). The only other peak containing an SPS motif was associated with corn, which was not significantly upregulated after the Notch pulse.
Furthermore, although Su(H) binding increased the likelihood of differential expression (Figure 5C) only 26% of the positions where Su(H) was bound at 0 min were within 10 kb of a gene that exhibited DE over the timecourse (Table S2). This conclusion was not altered when the analysis was extended to the nearest 2 neighbouring genes on all strands, irrespective of distance. For selected examples of genes with Su(H) binding that were not DE we can be confident that the P or AP class neighbouring genes were potentially Notch regulated as they have been identified as targets in other experiments (e.g. Notch, corn). However, it is possible that some other sites, where we cannot reliably associate them with neighbouring DE genes, may be acting over a much longer range to confer a Notch response. Nevertheless, despite the fact that Su(H) occupancy predisposed genes to DE (Figure 5C), many sites of Su(H) binding did not elicit a detectable response to the short pulse of Notch activation from any neighbouring genes.
Feed-forward interactions shape the response
The response profiles could be shaped by many factors including differences in mRNA stability as well as in transcriptional initiation. Since we observed that the Su(H) binding and Pol II recruitment were related to the response, it is likely that at least some of the effects were due to differences in the timing of transcription (e.g. for cluster 3 genes). One model to account for delayed upregulation is a feed-forward model in which early expressed genes contribute to the regulation of the later ones. For example, an early responding gene might encode a transcription factor needed to upregulate the late responding targets. The fact that the early acting genes consisted of W/hid, which has no known transcription factor activity and members of the E(spl) complex, which encode powerful bHLH repressors, makes this simple scenario unlikely. Furthermore, genes from several late clusters (e.g. hbs, dpn, Egfr) were still upregulated in cycloheximide treated cells, demonstrating that their upregulation was not dependent on de novo synthesis of a trans-acting factor (Figure S4).
Prompted to consider alternative regulatory interactions, we realized that the profiles might fit an alternative feed-forward model, where the early acting genes downregulate a repressor so enabling expression of the late upregulated genes. Clusters 5 and 6, which included several negative regulators, were downregulated shortly after cluster 1 bHLH repressors had reached their peak, making them plausible targets of the early E(spl)bHLH gene products (Figure 2). Since the multiple bHLH repressors in cluster 1 are known to function redundantly [55], [56], it would require knock down of multiple genes simultaneously to test functional relationships in cultured cells by RNAi. We therefore first asked whether the repression of two cluster 5 genes (hairy and edl) required de novo protein synthesis by treating the cells with cycloheximide (CHX). (Figure 6A). Under these conditions, HLHmβ mRNA showed similar levels of induction to untreated controls although, interestingly, the expression levels no longer declined after 30 minutes. This suggests that the decrease in HLHmβ expression is a consequence of de novo protein synthesis and fits with the observations that the bHLH repressors can feed back on their own expression (contributing to the cyclic expression of HES genes that has been observed in a variety of precursor cell types e.g. [57]–[59]). The effects of cycloheximide on hairy mRNA were also striking, hairy was no longer repressed following Notch activation, levels increased within 15 minutes and remained high throughout the time course. Likewise, the profile of edl expression also changed to one of continued upregulation in the presence of cycloheximide. Thus hairy and edl repression were dependent on de novo protein synthesis, consistent with the hypothesis that this is due to inhibition mediated by the early induced E(spl)bHLH proteins.

We next turned to an in vivo assay, taking advantage of flies carrying an inducible HLHmβ construct, and monitored the consequences of elevated HLHmβ expression on the cluster 5 gene hairy (Figure 6B–6F). Normally, hairy is expressed in the muscle progenitors (in vivo correlates of the DmD8 cells; bracket, Figure 6D, 6E) at levels that are similar to neighbouring epithelial cell domain (asterisk, Figure 6D, 6E). Expression of HLHmβ in muscle progenitors inhibited hairy expression; Hairy levels were clearly reduced compared to the neighbouring domain (Figure 6E, 6F). Conversely, expression of HLHmβ-VP16, in which the terminal HLHmβ WRPW repressor recruiting motif was replaced with a viral VP16 activation domain, either in the muscle progenitors or in a stripe in the wing imaginal disc, was sufficient to promote ectopic Hairy expression (Figure 6B, 6C, 6F). Furthermore, HLHmβ also reduced expression of an edl reporter (edl-GFP) although the effects of HLHmβ-VP16 were not significant in this assay (Figure 6G). Together these results support the proposed regulatory relationship between E(spl)bHLH and the cluster 5 gene hairy and suggest the model may extend to other cluster 5 genes such as edl.
The fact that hairy and several other cluster 5 genes themselves encode potential repressors raised the possibility that one or more of these repressors could contribute to the delayed expression of the late responding genes. Downregulation of such a repressor could be the critical step that permits the expression of the late responding clusters. We therefore tested whether RNAi knock down of hairy, edl or btn was sufficient to cause upregulation of selected late expressed genes (Figure 6H). The knock down of hairy led to a significant increase in three of the four cluster 3 genes tested (hbs, pnut, dpn) with hbs expression showing the greatest fold-change. It is possible that drl and some other genes failed to be upregulated after hairy knock-down, because they additionally required Notch-mediated activation, a possibility that is supported by Su(H) binding within the intron of drl at the 20 min time-point. However, it was not technically feasible to combine RNAi treatment with the Notch activation protocol. No expression changes were detected after knockdown of edl or btn (Figure 6H) suggesting that hairy is a more likely candidate for mediating cross-regulation of late upregulated targets in cluster 3 (Figure 6I, 6J). In support of this hypothesis, 77% of genes from cluster 3 (10/13) have one or more matches to Hairy consensus binding motifs within 5 kb of the transcription unit in comparison with 47% of cluster 4 genes (7/15)) although this difference is no longer evident when the analysis is extended to a 10 kb region around the genes (85% of cluster 3 genes and 80% of cluster 4 genes) (Table S3).
Sensitivity to the dose of active Notch
Another contributory factor to the different gene responses could be their sensitivity to Notch signal duration and/or intensity. Differences in response threshold might also explain the observation that the majority (74%) of Su(H) binding regions were not associated with neighbouring genes that were differentially expressed. To examine this question in more detail we first compared the response of the 154 DE genes to a 5 min pulse of Notch activation with our previously described results obtained after 30 min of Notch activation (Figure 7A) [29]. This demonstrated that, although the shorter pulse in general elicited a weaker response, most genes had quite similar responses under the two conditions (correlation coefficient 0.84). This was further evident when the ratios of responses were plotted as the majority of targets showed less than 2-fold difference between the short and long Notch induction (Figure 7B). However, 13 genes exhibited >2 fold difference in response. These were predominantly genes in clusters 1–3, i.e. with the strongest response following the 5 min stimulation, but not all the genes in those clusters were similarly affected (5/7 genes from cluster 1, 2/3 from cluster 2 and 4/13 genes from cluster 3). Of the repressed genes, only one (edl) showed >2 fold difference in response although many, such as hairy, were repressed under both conditions. From this analysis it appears that in general the different signaling regimes produce a similar response and that although some genes have greater sensitivity to signal duration/levels this is not sufficient to explain the different response profiles. Although there was no functional enrichment amongst the genes with greater dose sensitivity, we note that two are regulators of Ras signaling, possibly reflecting the importance of fine-tuned cross-talk between Notch and Ras pathways.
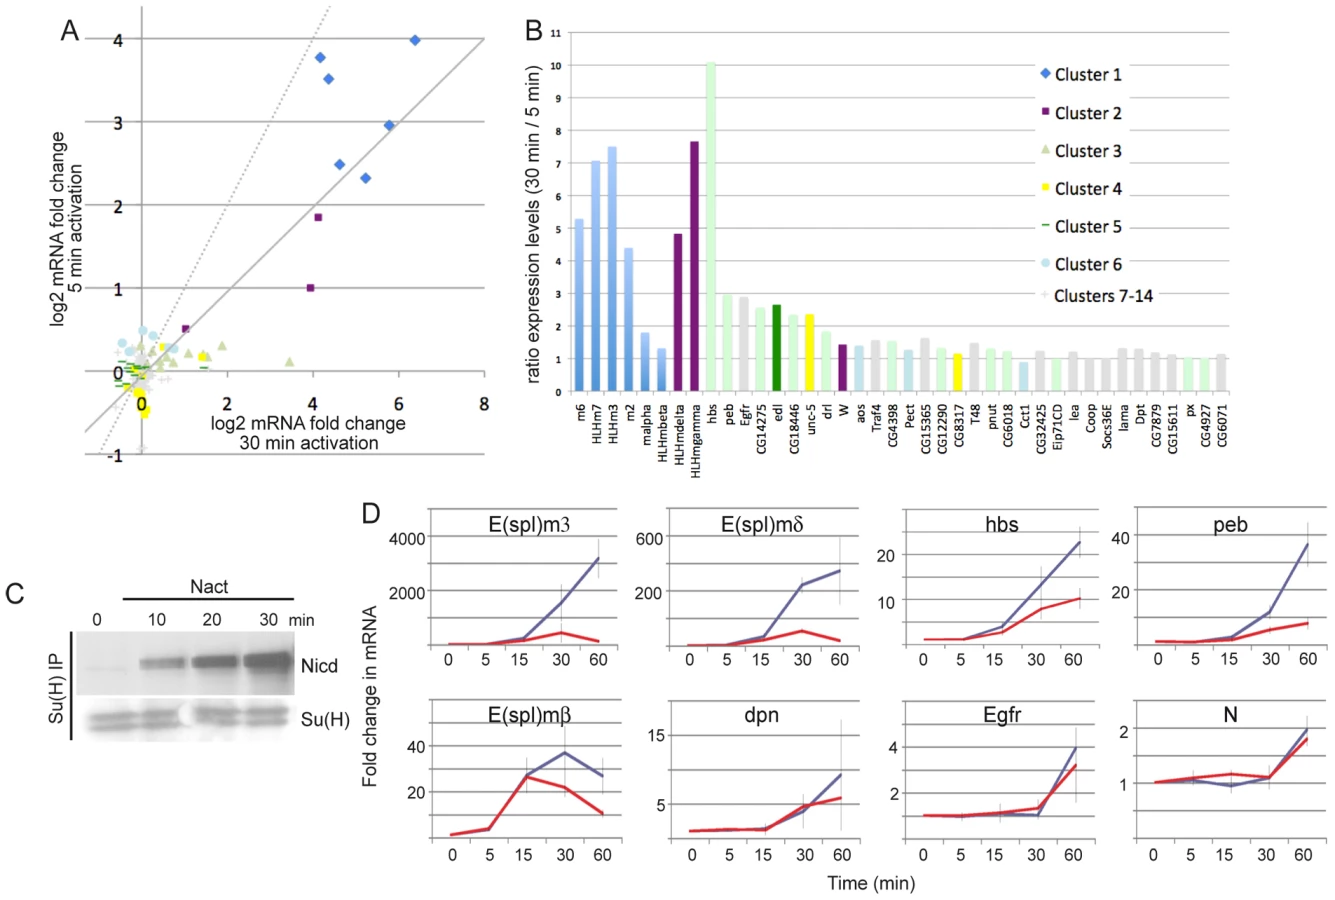
To investigate the effects of signal strength on the timing of response profiles we directly compared expression of several genes in response to a 5 min pulse or continuous stimulation (Figure 7C, 7D). Prolonged stimulation resulted in longer duration and higher levels of Nicd (Figure 7C). Some genes showed stronger induction in continuous activation conditions (e.g. HLHm3, HLHmδ, hbs, peb) suggesting that their transcription is sensitive to the levels of Nicd. Others showed little difference in expression levels (HLHmβ, dpn, Egfr) suggesting that Nicd is permissive rather than instructive at these loci. Notably, however, the temporal profiles were similar under the two conditions, even for those genes that were more strongly induced (Figure 7D). Thus the increase in signaling from the more extended treatment was not accompanied by an earlier onset of upregulation.
Seven genes that were associated with Su(H) binding and that had Pol II enriched at their 5′ regions were not detected as significantly DE after 5 min of stimulation, although they were after 30 minutes. One example is Notch, which exhibited robust Su(H) binding and was classified as AP at 0 min. However, when we compared the expression profiles of Notch mRNA with the 5 min pulse and continuous stimulation, there was little difference in the response (Figure 7D). Notably, the fold-change in expression was small (2-fold) in both cases. This may explain the failure to detect significant upregulation in the array experiments after 5 min activation if there was more variability in the response with the short stimulus. For example, genes that are already transcribed and undergo small changes in expression levels or genes that have variable/stochastic responses (e.g. more cell to cell variability) may not fulfil the test for significance between replicates. Other loci associated with Su(H) binding may therefore have similar characteristics to Notch, requiring prolonged stimulation before they achieve consistent expression. Nevertheless, these results suggest that Su(H) and Pol II binding are not sufficient to generate a reproducible response to the short stimulation.
Discussion
Performing a fine-scaled temporal analysis of the transcriptional response to Notch has revealed that the expression profiles of responding genes stratify into several classes. These differed in the timing, levels and direction of the expression changes. For example, the upregulated genes subdivided into clusters with rapid responses (within 10–15 min) and more delayed responses (>30 min). The different profiles could be explained, at least in part, through regulatory interactions between the different targets. Notably, we found evidence for feed-forward repression by the early responding E(spl)bHLH genes and we propose that this generates a temporal window for the delayed upregulation of later responding genes, by decreasing the expression of the repressor hairy. A pivotal role in the regulation of late responding targets could reconcile the observed critical functions of E(spl)bHLH/Hes genes in the Notch response [18], [25]–[28] with the large numbers of direct targets that have been identified in recent genome-wide studies [29]–[32]. This illustrates how the temporal analysis of signaling outputs can be informative for unravelling the underlying regulatory networks.
In the cells analyzed, E(spl) complex genes were almost unique in the rapidity and magnitude of their response to the 5 min pulse of Notch activity. We note however that not all of the rapidly responding genes had Pol II present at the promoter prior to Notch activation, suggesting that Nicd must be able to efficiently recruit Pol II de novo. Only one other gene, the pro-apoptotic factor W/hid, stratified into the early responding clusters. W/hid differs from E(spl) genes in possessing introns and requiring splicing, which has previously been suggested as an important factor in regulating the timing of transcriptional responses [60]. W/hid also lacks the paired SPS Su(H) binding motif that is a feature of the Hes gene targets and that could contribute to their efficiency of activation by promoting Nicd/Su(H) dimerization [35]–[40]. Nevertheless the W/hid profile of upregulation was very similar to that of two E(spl) genes, indicating that neither lack of introns, nor the presence of an SPS motif, nor location within the E(spl) complex were pre-requisites for rapid upregulation.
Other upregulated targets exhibited a more delayed response. This raises the question of what mechanisms were responsible for the delay. One contributory factor to response profiles could be mRNA stability, clusters with more stable mRNAs would be predicted to have a lag in their response compared to clusters with less stable mRNAs [61]–[63]. Although this may have an influence, it cannot fully explain the observations that Pol II recruitment was delayed at several of the late responding genes (e.g. hbs and CG4398) compared to the rapidly responding classes and in general there was a shift in the onset as well as the peak of the profiles. Neither of these features would be expected if profile differences were due to mRNA stability alone and suggest that a delay in transcriptional activation is a contributory factor. We propose that one reason for the delay in transcriptional activity of late responding genes is that Notch activation has to first combat the presence of repressor(s) at those loci. In this model, early responding E(spl)bHLH genes inhibit the expression of Hairy, and possibly other existing repressor(s), thereby releasing the late responding genes from repression and enabling their response to Notch (Figure 6). Our results from testing the cross-regulatory relationships support this model for at least some targets. It will be interesting to determine whether such a model is more generally relevant and extends to other signalling pathways.
As the proposed mechanism involves alleviation of repression, the later responding targets need not, a priori, be direct targets of Notch activity. Thus, these loci may not receive direct input from Notch but are “released” by the drop in Hairy (or other repressor) levels for upregulation by other transcription factors. We consider this a likely model for the delayed upregulation of cluster 4 genes which are largely without Su(H) binding. However, the associated Su(H) binding and previous analyses indicate that some cluster 3 late responding genes (e.g. hbs, peb/hnt) could also require a direct input from Notch in addition to the release from repression. The profile of Su(H) binding at cluster 3 targets was consistent with this possibility, as there was less Su(H) present and often the binding was delayed until 20 or 30 min after activation, despite the fact that most contained multiple matches to high affinity Su(H) motifs. We note also that 3 additional cluster 3 genes exhibited Su(H) binding after stronger Notch inductions [29] and that not all targets could be upregulated by hairy knockdown alone. For these reasons we consider it plausible that cluster 3 genes require input from Notch directly for their upregulation and that the decay of Nicd after 30 minutes could be one explanation for their low level of upregulation.
The model that feed-forward repression is involved in shaping the response to Notch has several implications. First, it could explain why mutations in E(spl)/Hes can phenocopy Notch knockdown [18], [25]–[28], despite the fact that recent studies have identified a large spectrum of other direct Notch targets [24], [29], [31]–[33], because the model implies that E(spl) genes are the primary responders with a pivotal role in permitting the expression of other targets. Second, it could account for situations where Notch activity appears to enable subsequent changes in cell fates through repression of a Hairy family gene [64], [65]. Third, this model suggests that there is an underlying buffer, in the form of Hairy (and possibly other repressors), which could prevent many targets from responding to very low levels of Notch. Although Hairy is a well-characterized transcriptional repressor during segmentation, the concept that it can function as a gate-keeper for Notch response is novel. Here we propose that hairy repression by the early targets of Notch activity could feed forward to enable the expression of other Notch responsive genes. Other signals/factors might also be able to exert an impact on Notch activity via their effects on hairy regulation.
Several targets were unaffected by hairy knock down suggesting there could be other repressors that perform a similar function to Hairy, or that there are other mechanisms involved in attenuating the response of late upregulated targets. The existence of other repressors could also explain why only a relatively small proportion of Su(H) bound regions (26%) were associated with differentially expressed genes and would be consistent with previously proposed models in which Su(H) binding alone is insufficient for target gene regulation [53]. Thus, the combination of Su(H) binding and poised polymerase was not necessarily sufficient to guarantee a response to Notch activity from neighbouring genes, despite the fact that Su(H) binding increased after Notch activation (e.g. at Notch itself) as it did at genes that exhibited DE. Non-responding targets may be prevented from Nicd induced upregulation by repressors that are not downregulated by E(spl)bHLH, or by the lack of a co-operating activator. If the latter, it would imply that these genes have a requirement for additional activators even after the recruitment of Su(H). An alternative explanation is that higher levels of Nicd are required. Dose dependent differences in the Notch response have been seen in mammary epithelial cells [66] and in umbilical cord stem cells [67]. However, a comparison with longer periods of activation demonstrated that, although some genes differed in their sensitivity to the “dose” of Notch activity, the majority of loci exhibited similar upregulation under both regimes. Signal duration was therefore not sufficient to explain why some genes responded poorly, although it is possible that even longer signal durations are required to induce a response. Cell-type differences in gene sensitivity may thus be shaped by the presence of specific repressors. Analysis of the gene responses to different activation regimes in a range of cell-types will be needed to distinguish these possibilities.
Materials and Methods
Cell culture and Notch activation regimes
DmD8 cells were cultured in Schneider's medium (Invitrogen) supplemented with 10% FBS (Sigma), 5 µg/ml insulin (Sigma) and 5% penicillin/streptomycin (Sigma) according to standard protocols. Notch signaling was initiated by replacing cell media with 2 mM EDTA in PBS. For the majority of experiments cells were stimulated for 5 minutes before washing out EDTA using normal culture media. For continuous activation experiments, cells were incubated in EDTA for the times indicated. For control samples, media was replaced with fresh media to mimic the addition and removal of EDTA in corresponding experimental samples.
Quantification of mRNA was performed using standard qPCR techniques. RNA was purified as described in Text S1 and reverse transcribed using MMLV-Reverse transcriptase (Promega) primed with random hexamer oligonucleotides (Promega) to produce cDNA. Relative cDNA concentrations were quantified using QuantiTec SYBR Green PCR mix (Qiagen) according to manufacturers instructions. PCR reactions were performed using a LightCycler 480 (Roche) quantitative PCR machine. Primers are described in Table S4.
To monitor Nicd in transcription complexes, its association with Su(H) was determined by co-immunoprecipitation, performed using standard techniques. Briefly, 2 µg Su(H) antibody (Santa Cruz Biotechnology, sc-15813) was incubated with protein G agarose beads at 4°C for 4 hours. Beads were then incubated overnight at 4°C with lysate from Dmd8 cells treated with EDTA for the times indicated. Samples were washed twice before resuspending in SDS loading buffer. Western blots were performed using standard techniques and were visualised using ECL reagents (GE Healthcare). Antibodies used were goat α-Su(H) (1/200) (Santa Cruz Biotechnology) and mouse α-Nicd (1/100) (Developmental Studies Hybridoma Bank).
RNA profiling using expression microarrays
For each sample (18 time points, 4 replicate experiments), RNA was purified from cells and the poly-A tailed mRNA was reverse transcribed using oligo(dT)23 primers in the presence of Cy3 - or Cy5-dCTP to generate probes for hybridization to long oligonucleotides microarrays (Flychip FL003; GEO platform accession GPL8244) as described in Text S1. Intensity values for each probe were extracted from scanned arrays using Dapple [68]. The R package limma [69] was then used to normalize the arrays. Significant differential expression over the time course was then detected using EDGE software [70]. See Table S5 for resulting expression data and Text S1 for further details of normalization, quality control and statistical analysis. Results have been deposited in Gene Expression Omnibus (GEO Series record GSE35557 http://www.ncbi.nlm.nih.gov/geo/). The method used to perform the gene clustering is available as an R-package: http://cran.r-project.org/web/packages/DIRECT/index.html
Chromatin immunoprecipitation and hybridization to genomic tiling arrays
ChIP: Further details are provided in Text S1. In brief, for each sample (7 time points, 3 replicates) cross-linked chromatin was fragmented by sonication to an average length of approximately 500 bp and precleared by addition of rabbit IgG and protein G agarose beads (Santa Cruz Biotechnology) before incubation at 4°C overnight with protein G agarose beads that had been pre-incubated with 2 µg Su(H) antibody (Santa Cruz Biotechnology) or 2 µg Pol II antibody (abcam). After washing, chromatin was eluted from the agarose beads with elution buffer (100 mM NaHCO3, 1% SDS) for 10 minutes with vigorous shaking before reversing the cross-links by incubation at 65°C for 5 hours in NaCl (0.27 M final concentration). Remaining proteins were removed by incubating with proteinase-K at 55°C overnight. DNA was then purified by phenol/chloroform extraction and ethanol precipitation. For array analysis, DNA fragments and total input samples were amplified by ligation mediated PCR and labelled for hybridisation to NimbleGen D. melanogaster 2.1 M Whole-Genome Tiling Arrays in the NimbelGen hybridisation station at 42°C (mix mode B) for 18 hours. Post-hybridisation washes were performed according to the NimbleGen Wash Buffer Kit instructions. Intensity values for each probe were extracted using the NimbleScan software. For each antibody, results were obtained for 3 replicates at 7 time points (21 arrays). Details of normalization and data analysis are in Text S1. Results are included in GEO series GSE35557.
In vivo assays
Fly stocks: In vivo analyses were performed using the following fly lines: 1151-Gal4 [71], ptc-Gal4 [72], UAS-HLHmβ [25] and UAS-HLHmβ-VP16 [73]. All crosses were performed at 25°C using standard conditions.
Immunostaining: Immunofluorescence was performed as described previously [74], and expression of proteins/reporters in imaginal discs from third instar larvae was analyzed as described previously [29]. Antibodies used were mouse α-Hairy (1/100; A gift from S. Pinchin and D. Ish-Horowicz), α-GFP (1/1000; Molecular Probes), α-cleaved Caspase-3 (1/1000; Cell Signaling Technology) and fluorophore conjugated secondary antibodies (Jackson ImmunoResearch). To quantify expression levels, average pixel intensities from the manipulated territory were measured using ImageJ and normalized relative to background levels in the same discs, >5 discs were quantified per genotype.
Prediction of Su(H) and Hairy binding sites
Alignment matrices for Su(H) [29] and Hairy [75] were built based on a compilation of previously published binding sites. The motif scanner nmscan from the NestedMICA package [76] was used for genome-wide motif matching. SPS arrangements were determined as combinations of two sites in opposite direction spaced by 10 to 22 nucleotides.
Supporting Information
Zdroje
1. AkimovV, RigboltKT, NielsenMM, BlagoevB (2011) Characterization of ubiquitination dependent dynamics in growth factor receptor signaling by quantitative proteomics. Molecular BioSystems 7 : 3223–3233.
2. IlaganMX, LimS, FulbrightM, Piwnica-WormsD, KopanR (2011) Real-time imaging of notch activation with a luciferase complementation-based reporter. Science Signaling 4: rs7.
3. KawahashiK, HayashiS (2010) Dynamic intracellular distribution of Notch during activation and asymmetric cell division revealed by functional fluorescent fusion proteins. Genes to Cells : Devoted to Molecular & Cellular Mechanisms 15 : 749–759.
4. KroukG, MirowskiP, LeCunY, ShashaDE, CoruzziGM (2010) Predictive network modeling of the high-resolution dynamic plant transcriptome in response to nitrate. Genome Biology 11: R123.
5. AnderssonER, SandbergR, LendahlU (2011) Notch signaling: simplicity in design, versatility in function. Development 138 : 3593–3612.
6. BraySJ (2006) Notch signalling: a simple pathway becomes complex. Nature Reviews Molecular Cell Biology 7 : 678–689.
7. JarriaultS, BrouC, LogeatF, SchroeterEH, KopanR, et al. (1995) Signalling downstream of activated mammalian Notch. Nature 377 : 355–358.
8. KopanR, IlaganMX (2009) The canonical Notch signaling pathway: unfolding the activation mechanism. Cell 137 : 216–233.
9. KovallRA, BlacklowSC (2010) Mechanistic insights into Notch receptor signaling from structural and biochemical studies. Current Topics in Developmental Biology 92 : 31–71.
10. LaiEC (2004) Notch signaling: control of cell communication and cell fate. Development 131 : 965–973.
11. RadtkeF, RajK (2003) The role of Notch in tumorigenesis: oncogene or tumour suppressor? Nature Reviews Cancer 3 : 756–767.
12. WattFM, EstrachS, AmblerCA (2008) Epidermal Notch signalling: differentiation, cancer and adhesion. Current Opinion in Cell Biology 20 : 171–179.
13. LobryC, OhP, AifantisI (2011) Oncogenic and tumor suppressor functions of Notch in cancer: it's NOTCH what you think. The Journal of Experimental Medicine 208 : 1931–1935.
14. WengAP, FerrandoAA, LeeW, MorrisJPt, SilvermanLB, et al. (2004) Activating mutations of NOTCH1 in human T cell acute lymphoblastic leukemia. Science 306 : 269–271.
15. ViatourP, EhmerU, SaddicLA, DorrellC, AndersenJB, et al. (2011) Notch signaling inhibits hepatocellular carcinoma following inactivation of the RB pathway. The Journal of Experimental Medicine 208 : 1963–1976.
16. KochU, RadtkeF (2007) Notch and cancer: a double-edged sword. Cellular and Molecular Life Sciences : CMLS 64 : 2746–2762.
17. DavisRL, TurnerDL (2001) Vertebrate hairy and Enhancer of split related proteins: transcriptional repressors regulating cellular differentiation and embryonic patterning. Oncogene 20 : 8342–8357.
18. KageyamaR, OhtsukaT (1999) The Notch-Hes pathway in mammalian neural development. Cell Research 9 : 179–188.
19. IsoT, KedesL, HamamoriY (2003) HES and HERP families: multiple effectors of the Notch signaling pathway. Journal of Cellular Physiology 194 : 237–255.
20. BraySJ (1997) Expression and function of Enhancer of split bHLH proteins during Drosophila neurogenesis. Perspectives on Developmental Neurobiology 4 : 313–323.
21. NakaoK, Campos-OrtegaJA (1996) Persistent expression of genes of the enhancer of split complex suppresses neural development in Drosophila. Neuron 16 : 275–286.
22. KageyamaR, SasaiY, AkazawaC, IshibashiM, TakebayashiK, et al. (1995) Regulation of mammalian neural development by helix-loop-helix transcription factors. Critical Reviews in Neurobiology 9 : 177–188.
23. PalomeroT, SulisML, CortinaM, RealPJ, BarnesK, et al. (2007) Mutational loss of PTEN induces resistance to NOTCH1 inhibition in T-cell leukemia. Nature Medicine 13 : 1203–1210.
24. PalomeroT, DominguezM, FerrandoAA (2008) The role of the PTEN/AKT Pathway in NOTCH1-induced leukemia. Cell Cycle 7 : 965–970.
25. de CelisJF, de CelisJ, LigoxygakisP, PreissA, DelidakisC, et al. (1996) Functional relationships between Notch, Su(H) and the bHLH genes of the E(spl) complex: the E(spl) genes mediate only a subset of Notch activities during imaginal development. Development 122 : 2719–2728.
26. LieberT, KiddS, AlcamoE, CorbinV, YoungMW (1993) Antineurogenic phenotypes induced by truncated Notch proteins indicate a role in signal transduction and may point to a novel function for Notch in nuclei. Genes & Development 7 : 1949–1965.
27. D'AltriT, GonzalezJ, AifantisI, EspinosaL, BigasA (2011) Hes1 expression and CYLD repression are essential events downstream of Notch1 in T-cell leukemia. Cell Cycle 10 : 1031–1036.
28. WendorffAA, KochU, WunderlichFT, WirthS, DubeyC, et al. (2010) Hes1 is a critical but context-dependent mediator of canonical Notch signaling in lymphocyte development and transformation. Immunity 33 : 671–684.
29. KrejciA, BernardF, HousdenBE, CollinsS, BraySJ (2009) Direct response to Notch activation: signaling crosstalk and incoherent logic. Science Signaling 2: ra1.
30. PalomeroT, LimWK, OdomDT, SulisML, RealPJ, et al. (2006) NOTCH1 directly regulates c-MYC and activates a feed-forward-loop transcriptional network promoting leukemic cell growth. Proceedings of the National Academy of Sciences of the United States of America 103 : 18261–18266.
31. WangH, ZouJ, ZhaoB, JohannsenE, AshworthT, et al. (2011) Genome-wide analysis reveals conserved and divergent features of Notch1/RBPJ binding in human and murine T-lymphoblastic leukemia cells. Proceedings of the National Academy of Sciences of the United States of America 108 : 14908–14913.
32. WengAP, MillhollandJM, Yashiro-OhtaniY, ArcangeliML, LauA, et al. (2006) c-Myc is an important direct target of Notch1 in T-cell acute lymphoblastic leukemia/lymphoma. Genes & Development 20 : 2096–2109.
33. HurlbutGD, KankelMW, Artavanis-TsakonasS (2009) Nodal points and complexity of Notch-Ras signal integration. Proceedings of the National Academy of Sciences of the United States of America 106 : 2218–2223.
34. AlonU (2007) Network motifs: theory and experimental approaches. Nature Reviews Genetics 8 : 450–461.
35. ArnettKL, HassM, McArthurDG, IlaganMX, AsterJC, et al. (2010) Structural and mechanistic insights into cooperative assembly of dimeric Notch transcription complexes. Nature Structural & Molecular Biology 17 : 1312–1317.
36. BaileyAM, PosakonyJW (1995) Suppressor of hairless directly activates transcription of enhancer of split complex genes in response to Notch receptor activity. Genes & Development 9 : 2609–2622.
37. CaveJW, LohF, SurprisJW, XiaL, CaudyMA (2005) A DNA transcription code for cell-specific gene activation by notch signaling. Current Biology : CB 15 : 94–104.
38. NamY, SlizP, PearWS, AsterJC, BlacklowSC (2007) Cooperative assembly of higher-order Notch complexes functions as a switch to induce transcription. Proceedings of the National Academy of Sciences of the United States of America 104 : 2103–2108.
39. NellesenDT, LaiEC, PosakonyJW (1999) Discrete enhancer elements mediate selective responsiveness of enhancer of split complex genes to common transcriptional activators. Developmental Biology 213 : 33–53.
40. OngCT, ChengHT, ChangLW, OhtsukaT, KageyamaR, et al. (2006) Target selectivity of vertebrate notch proteins. Collaboration between discrete domains and CSL-binding site architecture determines activation probability. The Journal of Biological Chemistry 281 : 5106–5119.
41. CoreLJ, WaterfallJJ, LisJT (2008) Nascent RNA sequencing reveals widespread pausing and divergent initiation at human promoters. Science 322 : 1845–1848.
42. HendrixDA, HongJW, ZeitlingerJ, RokhsarDS, LevineMS (2008) Promoter elements associated with RNA Pol II stalling in the Drosophila embryo. Proceedings of the National Academy of Sciences of the United States of America 105 : 7762–7767.
43. LevineM (2011) Paused RNA polymerase II as a developmental checkpoint. Cell 145 : 502–511.
44. MuseGW, GilchristDA, NechaevS, ShahR, ParkerJS, et al. (2007) RNA polymerase is poised for activation across the genome. Nature Genetics 39 : 1507–1511.
45. RandMD, GrimmLM, Artavanis-TsakonasS, PatriubV, BlacklowSC, et al. (2000) Calcium depletion dissociates and activates heterodimeric Notch receptors. Molecular and Cellular Biology 20 : 1825–1835.
46. Gupta-RossiN, Le BailO, GonenH, BrouC, LogeatF, et al. (2001) Functional interaction between SEL-10, an F-box protein, and the nuclear form of activated Notch1 receptor. The Journal of Biological Chemistry 276 : 34371–34378.
47. KrejciA, BrayS (2007) Notch activation stimulates transient and selective binding of Su(H)/CSL to target enhancers. Genes & Development 21 : 1322–1327.
48. SykacekP, KreilDP, MeadowsLA, AuburnRP, FischerB, et al. (2011) The impact of quantitative optimization of hybridization conditions on gene expression analysis. BMC Bioinformatics 12 : 73.
49. Fu AQ, Russell S, Bray SJ, Tavaré S Bayesian clustering with the Dirichlet-process prior. Under review.
50. DangTP (2012) Notch, apoptosis and cancer. Advances in Experimental Medicine and Biology 727 : 199–209.
51. LandisGN, AbduevaD, SkvortsovD, YangJ, RabinBE, et al. (2004) Similar gene expression patterns characterize aging and oxidative stress in Drosophila melanogaster. Proceedings of the National Academy of Sciences of the United States of America 101 : 7663–7668.
52. SorensenJG, NielsenMM, KruhofferM, JustesenJ, LoeschckeV (2005) Full genome gene expression analysis of the heat stress response in Drosophila melanogaster. Cell Stress & Chaperones 10 : 312–328.
53. CooperMT, TylerDM, FurriolsM, ChalkiadakiA, DelidakisC, et al. (2000) Spatially restricted factors cooperate with Notch in the regulation of Enhancer of split genes. Developmental Biology 221 : 390–403.
54. LecourtoisM, SchweisguthF (1995) The neurogenic suppressor of hairless DNA-binding protein mediates the transcriptional activation of the enhancer of split complex genes triggered by Notch signaling. Genes & Development 9 : 2598–2608.
55. DelidakisC, PreissA, HartleyDA, Artavanis-TsakonasS (1991) Two genetically and molecularly distinct functions involved in early neurogenesis reside within the Enhancer of split locus of Drosophila melanogaster. Genetics 129 : 803–823.
56. SchronsH, KnustE, Campos-OrtegaJA (1992) The Enhancer of split complex and adjacent genes in the 96F region of Drosophila melanogaster are required for segregation of neural and epidermal progenitor cells. Genetics 132 : 481–503.
57. KageyamaR, MasamizuY, NiwaY (2007) Oscillator mechanism of Notch pathway in the segmentation clock. Developmental Dynamics : an official publication of the American Association of Anatomists 236 : 1403–1409.
58. PourquieO (2003) The segmentation clock: converting embryonic time into spatial pattern. Science 301 : 328–330.
59. HirataH, YoshiuraS, OhtsukaT, BesshoY, HaradaT, et al. (2002) Oscillatory expression of the bHLH factor Hes1 regulated by a negative feedback loop. Science 298 : 840–843.
60. LewisJ (2003) Autoinhibition with transcriptional delay: a simple mechanism for the zebrafish somitogenesis oscillator. Current Biology : CB 13 : 1398–1408.
61. YangE, van NimwegenE, ZavolanM, RajewskyN, SchroederM, et al. (2003) Decay rates of human mRNAs: correlation with functional characteristics and sequence attributes. Genome Res 13 : 1863–1872.
62. ElkonR, ZlotorynskiE, ZellerKI, AgamiR (2010) Major role for mRNA stability in shaping the kinetics of gene induction. BMC Genomics 11 : 259.
63. ChinCF, ShihAC, FanKC (2007) Influence of mRNA decay rates on the computational prediction of transcription rate profiles from gene expression profiles. J Biosci 32 : 1251–1262.
64. BaonzaA, FreemanM (2001) Notch signalling and the initiation of neural development in the Drosophila eye. Development 128 : 3889–3898.
65. HansS, ScheerN, RiedlI, v WeizsackerE, BladerP, et al. (2004) her3, a zebrafish member of the hairy-E(spl) family, is repressed by Notch signalling. Development 131 : 2957–2969.
66. MazzoneM, SelforsLM, AlbeckJ, OverholtzerM, SaleS, et al. (2010) Dose-dependent induction of distinct phenotypic responses to Notch pathway activation in mammary epithelial cells. Proceedings of the National Academy of Sciences of the United States of America 107 : 5012–5017.
67. DelaneyC, Varnum-FinneyB, AoyamaK, Brashem-SteinC, BernsteinID (2005) Dose-dependent effects of the Notch ligand Delta1 on ex vivo differentiation and in vivo marrow repopulating ability of cord blood cells. Blood 106 : 2693–2699.
68. Buhler J, Ideker T, Haynor D (2000) Dapple: improved techniques for finding spots on DNA microarrays. UWCSE Tech Report UWTR 2000-08-05, Department of Computer Science and Engineering, University of Washington, Seattle, WA, August.
69. SmythGK, SpeedT (2003) Normalization of cDNA microarray data. Methods 31 : 265–273.
70. StoreyJD, XiaoW, LeekJT, TompkinsRG, DavisRW (2005) Significance analysis of time course microarray experiments. Proceedings of the National Academy of Sciences of the United States of America 102 : 12837–12842.
71. AnantS, RoyS, VijayRaghavanK (1998) Twist and Notch negatively regulate adult muscle differentiation in Drosophila. Development 125 : 1361–1369.
72. SpeicherSA, ThomasU, HinzU, KnustE (1994) The Serrate locus of Drosophila and its role in morphogenesis of the wing imaginal discs: control of cell proliferation. Development 120 : 535–544.
73. JenningsBH, TylerDM, BraySJ (1999) Target specificities of Drosophila enhancer of split basic helix-loop-helix proteins. Molecular and Cellular Biology 19 : 4600–4610.
74. CooperMT, BraySJ (1999) Frizzled regulation of Notch signalling polarizes cell fate in the Drosophila eye. Nature 397 : 526–530.
75. BryneJC, ValenE, TangMH, MarstrandT, WintherO, et al. (2008) JASPAR, the open access database of transcription factor-binding profiles: new content and tools in the 2008 update. Nucleic Acids Research 36: D102–106.
76. DownTA, HubbardTJ (2005) NestedMICA: sensitive inference of over-represented motifs in nucleic acid sequence. Nucleic Acids Research 33 : 1445–1453.
Štítky
Genetika Reprodukční medicínaČlánek vyšel v časopise
PLOS Genetics
2013 Číslo 1
- Kazuistika – Perspektivy využití precizované medicíny v rámci personalizované specifické terapie onkologických pacientů
- Nobelova cena za chemii pro genetické nůžky: Objev, který změní naši budoucnost?
- Technologie na bázi RNA v klinické praxi: od přebarvených petúnií k terapii vzácných a dosud jen obtížně léčitelných chorob u lidí
- „Nepředstavovali jsme si, že náš výzkum povede přímo ke vzniku nových léků, dokonce ještě za našeho života“
- Bezplatné služby pro diagnostiku ATTRv amyloidózy pro kardiology
Nejčtenější v tomto čísle
- Function and Regulation of , a Gene Implicated in Autism and Human Evolution
- An Insertion in 5′ Flanking Region of Causes Blue Eggshell in the Chicken
- Comprehensive Methylome Characterization of and at Single-Base Resolution
- Susceptibility Loci Associated with Specific and Shared Subtypes of Lymphoid Malignancies
Zvyšte si kvalifikaci online z pohodlí domova
Mazová zátka a její řešení
nový kurzVšechny kurzy