
Mediation Analysis Demonstrates That -eQTLs Are Often Explained by -Mediation: A Genome-Wide Analysis among 1,800 South Asians
Expression quantitative trait locus (eQTL) studies have demonstrated that human genes can be regulated by genetic variation residing close to the gene (cis-eQTLs) or in a distant region or on a different chromosome (trans-eQTLs). While cis-eQTL variants are likely to affect transcription factor binding or chromatin structure, our understanding of the mechanisms underlying trans-eQTLs is incomplete. We hypothesize that a substantial fraction of trans-eQTLs influence expression of distant genes through mediation by expression levels of a cis-transcript. In this paper, we use genome-wide SNPs and expression data for 1,799 South Asians to identify cis - and trans-eQTLs and to test our hypothesis using Sobel tests of mediation. Among 189 observed trans-eQTL associations, we provide evidence of cis-mediation for 39, 6 of which show mediation in an independent European cohort. We used simulated data to demonstrate that complete mediation will be observed as partial mediation in the presence of mediator measurement error or imperfect LD between measured and causal variants. We also demonstrate how unobserved confounding variables and incorrect mediator selection can bias mediation estimates. In conclusion, we have identified cis-mediators for many trans-eQTLs and described a mediation analysis approach that can be used to validate, characterize, and enhance discovery of trans-eQTLs.
Published in the journal:
. PLoS Genet 10(12): e32767. doi:10.1371/journal.pgen.1004818
Category:
Research Article
doi:
https://doi.org/10.1371/journal.pgen.1004818
Summary
Expression quantitative trait locus (eQTL) studies have demonstrated that human genes can be regulated by genetic variation residing close to the gene (cis-eQTLs) or in a distant region or on a different chromosome (trans-eQTLs). While cis-eQTL variants are likely to affect transcription factor binding or chromatin structure, our understanding of the mechanisms underlying trans-eQTLs is incomplete. We hypothesize that a substantial fraction of trans-eQTLs influence expression of distant genes through mediation by expression levels of a cis-transcript. In this paper, we use genome-wide SNPs and expression data for 1,799 South Asians to identify cis - and trans-eQTLs and to test our hypothesis using Sobel tests of mediation. Among 189 observed trans-eQTL associations, we provide evidence of cis-mediation for 39, 6 of which show mediation in an independent European cohort. We used simulated data to demonstrate that complete mediation will be observed as partial mediation in the presence of mediator measurement error or imperfect LD between measured and causal variants. We also demonstrate how unobserved confounding variables and incorrect mediator selection can bias mediation estimates. In conclusion, we have identified cis-mediators for many trans-eQTLs and described a mediation analysis approach that can be used to validate, characterize, and enhance discovery of trans-eQTLs.
Introduction
The development of technologies that enable high-throughput, genome-wide measurement of single nucleotide polymorphisms (SNPs) and mRNA transcripts have enabled researchers to comprehensively examine the effects of human genetic variation on gene expression. Genome-wide studies of expression quantitative trait loci (eQTLs) have been conducted using a wide-array of RNA sources, including lymphoblastoid cells lines [1]–[4], whole blood [5], monocytes [6], [7], B-cells [7], liver cells [8], [9], and breast cancer tumor cells [10]. These studies consistently demonstrate that a large fraction of human genes (perhaps all genes) are regulated by variants near the transcribed sequence, typically referred to as cis-eQTLs (or cis-eSNPs).
Less is known regarding the effects of genetic variation on expression of distant genes and genes residing on other chromosomes (i.e., trans-eQTLs). Identifying trans-eQTLs should provide insight into the mechanisms of gene regulation, including mechanisms relevant to disease-associated variants and human disease biology. Trans-eQTLs are more difficult to identify than cis-eQTLs because trans effects are generally weaker than cis effects and because a huge number of tests must be conducted to comprehensively search the genome for trans-eQTLs, resulting in the use of stringent significance thresholds. Thus, large studies are needed for trans-eQTL identification. Several such studies (>1,000 participants) have focused on identifying trans - eQTLs, and these have typically used white blood cells as an RNA source [5], [6], [11]. In early trans-eQTL studies, the proportion of trans-eQTLs replicated across studies was quite low, much lower than cis-eQTLs [9], but a recent study demonstrates that most trans-eQTLs replicate when very large sample sizes are used. [11]
While the biological mechanisms underlying trans-eQTLs are largely unknown, it is likely that many trans-eQTLs are also cis-eQTLs, and it is the cis-transcript that affects the expression of a trans-gene; however, no prior trans-eQTL studies have systematically assessed evidence for cis-mediation among identified trans-eQTLs. While replication in independent samples is the gold standard method for validating trans-eQTLs, we propose that documenting cis-mediation can provide additional evidence that an observed trans-association is a true trans-eQTL and a potential biological explanation/mechanism for the observed trans-eQTL.
In this work, we describe cis - and trans-eQTL associations using data on genome-wide SNPs and genome-wide RNA transcripts (extracted from mononuclear cells) for 1,799 Bangladeshi adults. For SNPs observed to be trans-eQTLs, we use a mediation analysis approach to assess evidence that the observed trans-eQTL associations are mediated by measured transcripts that are in cis with the SNP showing a trans-association. We observe evidence of mediation for a substantial fraction of the trans-eQTLs observed in our data and replicate several of our mediation signals in an independent sample, suggesting that many observed trans-eQTLs are due to mediation by expression levels of cis-transcripts in the vicinity of the trans-eQTL. These observations can be used to enhance our understanding of regulatory mechanisms and our ability to identify trans-eQTLs.
Results
Genome-wide eQTL analysis
We conducted genome-wide cis-eQTL analysis using data on 1,016,489 genotyped and imputed SNPs and 22,973 expression probes (corresponding to 16,006 genes) measured for 1,799 Bangladeshi individuals, using DNA extracted from whole blood and RNA extracted from peripheral blood mononuclear cells (PBMCs). For both SNP and probe data, stringent quality control (QC) measures were implemented to eliminate false positive associations (see methods). Results of genome-wide eQTL analyses are summarized in Table 1. At a genome-wide false-discovery rate (FDR) of 0.05 (P<2.2×10⁻³), we observed that 15,570 out of 22,973 expression probes (68%) and 11,827 out of 16,006 unique genes (74%) show evidence of a cis-eQTL in this population.

In the genome-wide trans-eQTL analysis using an FDR of 0.05 (P<8.4×10⁻⁹), we observed 427 significant expression probes, corresponding to 414 unique genes (Table 1). Among these probes, there were 434 unique eQTL associations (i.e., unique probe and unique trans-eQTL region), corresponding to 419 unique trans-eQTL associations at the gene-level (Table S1 and Figure S1). There were 26 examples of a single variant (or variants in strong LD) showing association with multiple unique trans genes and 11 examples of a gene affect by multiple trans-eSNPs located in different regions of the genome. We observe many trans-eQTLs reported in prior studies, including the monocyte-specific master regulator at the LYZ locus on chromosome 12 identified by Fairfax (rs10784774) [7], the multiple trans-effects of variation type 1 diabetes region 12q13.2 described by Fehrmann and Fairfax [5], [7], and the lupus SNP rs7917014 (tagged by rs4917014 in our data) association with CLEC4C, CLEC10A, IFIT1, and other genes highlighted by Westra [11].
Enrichment analysis for eQTLs
Consistent with findings from previous studies [5], [11], [12], SNPs known to be associated with human traits (1,930 unlinked SNPs with P<5×10⁻⁸ in the NHGRI GWAS catalog) were more likely to show association with local gene expression (P = 2.8×10−42) (Table 1 and Figure S2). Similarly, we observed that trait-associated SNPs are more likely to be trans-eQTLs (enrichment P = 1.6×10⁻¹²), with 67 trait-associated SNPs (∼3.5%) showing strong evidence of trans-association (Table 1 and Figure S3).
In addition, we show that trans-eSNPs are more likely to be cis-eSNPs than randomly-selected SNPs (enrichment P<0.001, consistent with Westra et al.[11], Figure S4), with ∼45% of lead trans-eSNPs identified as cis-eSNPs, suggesting that the effect of many trans-eQTL effects may be mediated by measured transcripts regulated in cis by the causal trans-eSNP. At trans-eQTL P-value thresholds of 10−15, 8.4×10⁻⁹, 10−7, the percentages of trans-eQTLs (lead SNPs) that were also associated with cis-transcripts were 62% (45 out of 73), 44% (189/434), and 31% (781/2,536), respectively (Table 2). Genes that lie <30kb from lead trans-eSNPs are more likely to be associated with SNPs in cis (76.2% of probes) as compared to all transcripts (67.8% of probes) (P = 1.6×10⁻⁴).

Evidence for cis-mediation among a subset of trans-eQTLs
Among the 434 unique probe-level trans-eQTL associations, there were 189 for which the strongest associated SNP (i.e., “lead trans-eSNP”) was also associated with at least one local cis-transcript (based on genome-wide significance in the cis-eQTL analysis), representing a potential mediator of the trans-eQTL association (Fig. 1A). For these 189 trans-eQTL associations we performed mediation analysis (see methods) and obtained Sobel P-values for mediation as well as an estimate of the proportion of the trans-eQTL effect that is mediated by a cis-transcript (i.e., the proportion reduction in the magnitude of the beta coefficient after adjusting for the potential mediator: (β - βadj)/β). These are plotted in Fig. 2A, which shows an excess of “mediation proportion” estimates that are greater than zero. At a Sobel P threshold of 10−5 (based on visual inspection of Fig. 2A) 39 trans-eQTL associations (21%) were significantly reduced in magnitude after adjusting for a cis-transcript, suggesting that the measured transcript is the primary mediator of the trans-eQTL effect (Table S2). Extending our analysis to the 592 trans-eQTL associations that did not pass the FDR threshold, but had a P<10−7 and a potential cis-mediator, we observed evidence of mediation for seven additional trans-eQTLs with Sobel P <10−16 and one trans-eQTL that changed direction after adjustment for the cis-transcript (Fig. 2B and Table S2), suggesting that mediation analysis can be used to enhance trans-eQTL discovery.


Evidence for cis-mediation was stronger when LD between the lead trans-SNP and the lead cis-eSNP was high (Table 2 and Fig. 2), as expected under the mediation hypothesis, which implies the observed cis - and trans-eQTL associations are due to the same causal variant (Fig. 1B). Evidence for cis-mediation was also stronger for trans-eQTLs with smaller P-values (Table 2), suggesting that mediation is a characteristic of true positives and that power for detecting mediation is higher for stronger trans-eQTLs. Similarly, at less stringent thresholds, a smaller percentage of trans-eQTL variants show association with a cis-transcript (Table 2), suggesting that observed trans-eSNPs that are not associated with a nearby transcript are, on average, less likely to be true trans-eQTLs.
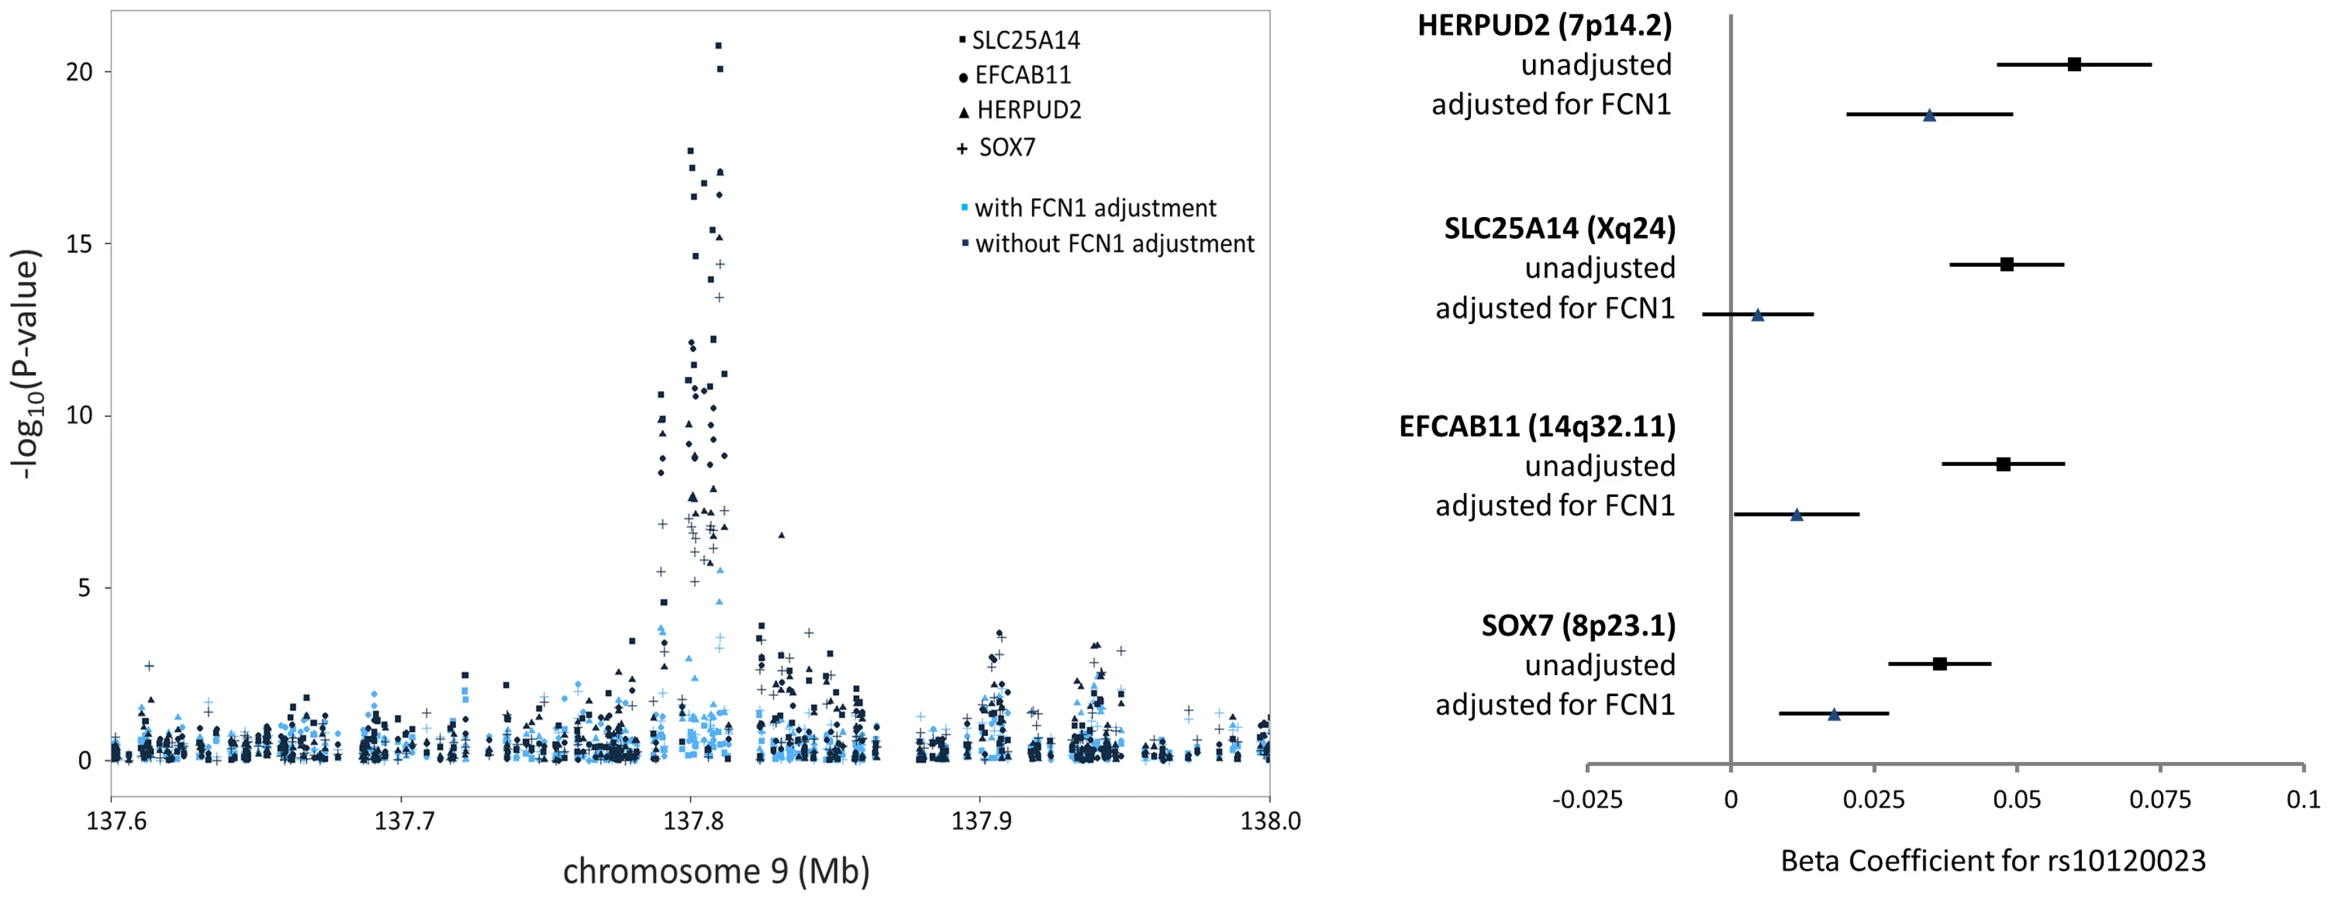
Among the 39 trans-eQTL associations showing strong evidence of mediation (Table S2), seven trans-eQTLs were present more than once, represented by cis-mediators AK125871, GNLY, GATA2, TREML1, FCN1, RPS26, and RBPMS2. The trans-eSNPs showing mediation by GATA2 (3q21.3), FCN1 (9q34.3), and RPS26 (12q13.2) are also associated with white blood cell subtypes [13], systemic inflammation (and FCN1 protein activity) [14], and type 1 diabetes risk [15], respectively. All four trans-eQTL associations observed for the FCN1 region (represented by rs10120023) were substantially reduced after adjustment for FCN1 expression (ILMN_1668063) (Fig. 3). Similar results for GATA2 and RPS26 are shown in Figure S5.
Among the 245 trans-eQTL associations for which no potential mediator was identified in the cis-eQTL analysis, we selected the probe with the strongest association to the lead trans-eSNP and conducted mediation analysis. However, little evidence of mediation was observed (Figure S6).
“Partial mediation” can be due to measurement error and low LD
Evidence for mediation is often observed as “partial” mediation, as the trans-eQTL association is not completely eliminated after adjustment for a cis-transcript. To aid our interpretation of partial mediation, we simulated cis - and trans-eQTL expression data based on real genotype data assuming complete mediation (see Methods). Our simulations show that evidence for mediation (in terms of the “proportion mediated” and the Sobel P) decreases as LD between the causal variant and the measured variant decreases and as measurement error increases (measured as the correlation between the true mediator and our measurement of the mediator) (Fig. 4). In other words, even when trans-eQTL associations are fully mediated by a cis-transcript, evidence for mediation will be detected as “partial mediation” when there is measurement error for the mediating probe and/or imperfect LD between the causal variant and the measured variant under analysis.

The effect of cis-trans confounding on mediation analysis
In our mediation analysis, the estimate of the mediation proportion is less than zero, and occasionally greater than 1 (Fig. 2), a somewhat counter-intuitive finding that suggests the presence of bias. One potential source of bias is “mediator-outcome” confounding [16], which occurs when an unobserved variable (or set of variables) affects both the cis-mediator and the trans-transcript. In this scenario, the estimate of association between the SNP and the trans-gene when adjusting for the potential mediator (i.e., the “direct effect” of the SNP on the trans-gene, βadj) will be biased. When cis-trans confounding is absent, the direct effect under full mediation should be zero (βadj = 0; percent mediation = 100%). Using simulated data, we demonstrate the effect of this bias on the estimate of proportion of the trans-eQTL effect that is mediated (β - βadj)/β) (Fig. 5). This bias can go in either direction, depending on the directions of the effects of the confounder with the cis-mediator, the confounder on the trans-transcript, and the non-reference allele (in our case, the minor allele) on the cis-transcript (Figure S7). The magnitude of the bias depends on the strength of confounding and the effect of the cis-gene on the trans-gene. Thus, there is no expectation regarding the direction in which this bias should affect the estimate of βadj. Exceptionally strong bias has the potential to qualitatively change the results of mediation analysis, such large changes in the direction or substantial strengthening of a trans-eQTL association after adjustment for a potential cis-mediator, but we observe very few examples of these phenomena in our data (see below).

Mediation can be detected when the true mediator is not measured
In addition to cis-trans confounding, bias can arise when the analyzed cis-transcript is not the true mediator, but is correlated with the true mediator. More specifically, evidence for mediation will be observed if the transcript used for mediation analysis is influenced by a cis-variant that is in LD with the causal trans-eSNP and is correlated with the true mediator, due either to confounding (due to an unobserved transcript or factor) or a causal relationship between the analyzed transcript and the true mediator (Figure S8 and Figure S9). When the causal relationships shown in Figure S8B and Figure S8C are positive effects (producing positive correlations), and the LD between the expression-increasing alleles is positive, the adjusting for the selected transcript will attenuate the trans-eQTL association. However, when both positive and negative relationships are present, adjusting for the selected transcript can increase the magnitude of the trans-association (Figure S9A and Figure S9B). Thus, even when the true mediator is not measured, it is still possible to obtain indirect evidence of that a trans-eQTLs is attributable to cis-mediation.
In contrast, when an unobserved variable influences both the selected cis-transcript and the trans-gene (Figure S8D), evidence of mediation can be falsely detected, and similar to cis-trans confounding, the estimate can be biased in either direction (Figure S9C), depending on the direction of the effects of the confounder and the positivity/negativity of the LD between expression-increasing alleles.
Adjusting for a potential cis-mediator can strengthen or change the direction of a trans-association
We observe several instances in which adjusting for a potentially-mediating transcript substantially strengthened or reversed the direction of the trans-association (Sobel P<10−5) (Table S3). As noted in the above sections, this estimate could potentially be biased due to exceptionally strong cis-trans confounding. However, additional causal diagrams that are consistent with this phenomenon are shown in Figure S10. In the first scenario, a causal trans-eQTL variant affects a trans-gene though multiple cis-mediators. In the second, two causal trans-eQTL SNPs are in LD, and each affects the same trans-gene, through two different cis-mediators. In order to determine if these proposed scenarios potentially explain our two most striking examples of these phenomena, we regressed the trans-gene on the trans-eSNP, adjusting for all measured cis-transcripts correlated with the trans-eSNP (Table S3). For these trans-eQTLs, adjusting for additional transcripts did not substantially attenuate the trans-association, suggesting that these “direction changes” are due to unmeasured mediators or unobserved confounding variables.
Characteristics of trans-eQTLs that do not show strong evidence of mediation
For>140 of our 189 significant trans-/cis-eSNPs (Fig. 2A), the Sobel P is>10−5 and the “mediation proportion” is distributed around zero. While it is difficult to identify specific examples of true mediation among this group, we hypothesize that non-uniformity of the Sobel P-value distribution in this range is likely due to a mixture of true mediation, bias due to confounding of the cis-trans association, and correlation between the true (unmeasured) mediator and the probe selected for mediation analysis. These phenomena are described in detail in the sections above, and the latter two phenomena can result in both positive and negative bias for the estimate of the “mediation proportion”.
Among our observed trans-eQTLs, those that do not show mediation are, on average, further from transcription start sites or end sites (TSS or TES) as compared to those that show mediation (Table S4), suggesting that some trans-eQTLs do not influence the expression of nearby protein-coding genes. When considering only trans-eSNPs that lie <30 kb from a TSS or TES, those that do not show mediation are more likely to lie near a gene for which we do not have expression data (Table S4), suggesting that a substantial number of the true mediators for these trans-eQTLs are not represented by probes in our dataset. Trans-eSNPs showing no mediation were somewhat more likely to tag (r2>0.7) non-synonymous SNPs than non-mediated trans-eSNPs, indicating that coding changes may mediate the effects of trans-eQTLs for which we could not identify clear mediators (Table S4). A similar pattern was not observed for splice-modifying SNPs.
Replication of trans-eQTLs
A total of 43 of the 419 (10%) unique gene-level trans-eQTLs observed among our Bangladeshi participants (FDR of 0.05) have been observed in prior trans-eQTL studies using RNA from blood cells (peripheral or transformed) from participants of primarily European ancestry [5], [7], [11], [17]. Among the 2,493 trans-eQTLs with P<10−7, 59 have been observed in prior studies (Table S5). Probability of replication depended strongly on P-value, with 27% of our findings with P<10−15 replicating, 7% with P between 8.4×10⁻⁹ and 10−15, and 1% with P between 10−7 and 8.4×10⁻⁹. For trans-eQTLs passing the FDR threshold, there was not strong evidence that those showing evidence of mediation were more likely to replicate than those that did not show evidence of mediation, however, for trans-eQTLs not passing the FDR threshold (P>8.4×10⁻⁹ but P<10−7), a higher percentage of replication was observed among mediated trans-eQTLs, although there were only 16 of mediation among this group (Table S6).
Replication of mediation results
Using data from two independent cohorts of European Ancestry, the Groningen (n = 1,240) and Estonian EGCUT (n = 891) cohorts [11], we attempted to replicate our mediation signals. In these cohorts, complete data on the lead SNP, cis-probe, and trans-probe (based on RNA from whole blood) were available for 21 of the mediated trans-eQTL associations, and only one of these showed strong evidence of being a trans-eQTL in both cohorts. For this eQTL (rs6785206, associated with GATA2 in cis and CLC in trans), we observed evidence of mediation in both cohorts, with the trans-eQTL association reduced in magnitude by 21% and 38%, respectively, after adjusting for the cis-mediator. Six additional trans-eQTL associations were replicated in one or the two cohorts, and we observed evidence consistent with cis-mediation for five of the six (Table S7).
Discussion
In this work, we have conducted a comprehensive analysis of cis-mediation underlying trans-eQTLs using data from the first large genome-wide eQTL study of South Asian individuals. Approximately 44% of all trans-eQTLs detected at an FDR of 0.05 also showed evidence of being a cis-eQTL, enabling analysis potential mediation by cis-transcripts. Among analyzed trans-eQTLs, ∼21% showed strong evidence of mediation by a measured cis-transcript. Analysis of simulated data demonstrated that partial rather than complete mediation will be detected in the presence of (1) measurement error for mediating transcripts and (2) imperfect LD between measured SNPs and the causal variants. Simulations also demonstrate that cis-trans confounding can bias estimates obtained from mediation analysis, while correlations among neighboring cis-transcripts, can enable detection of mediation when the true mediator is unmeasured. Observing evidence of mediation was more likely for trans-eQTLs with smaller P-values and when the lead trans-eSNP was in strong LD with the lead cis-eSNP for the potentially-mediating transcript. Demonstration of cis-mediation for observed trans-eQTLs provides a form of validation, a clear biological mechanism, and an approach for enhancing future trans-eQTL discovery.
Among our 434 significant trans-eQTL associations, we lacked data on potential mediators for 245 trans-associations (i.e., the lead trans-eSNP was not identified as a cis-eSNP in genome-wide cis-eQTL analyses). This lack of data on potential mediators could be due to several factors. First, many mediators may be unmeasured or excluded as a consequence of QC (Table S4). Second, some trans-eQTL effects may not be mediated by expression of a cis-transcript. For example, a trans effect could be due to variation in the coding sequence of a regulatory factor (Table S4), physical inter-chromosomal interactions, non-coding RNA, or other mechanisms that do not entail mediation by cis-expression of a protein-coding gene. Third, some trans-eQTLs may be false positives. This is likely the case for many trans-eQTLs of marginal significance (5×10⁻⁹<P<10−7), which are less likely to be cis-eQTLs than FDR-significant trans-eQTLs. However, even for highly-significant trans-eQTLs (P<10−15), ∼38% lack data on a potential cis-mediator (Table 2). Fourth, it is possible that trans-eQTLs may be due to cis effects that are detectable as very weak associations in our dataset; however, our mediation analysis for trans-eSNPs that were not identified as cis-eSNPs did not provide strong evidence for this hypothesis (Figure S6). All of these phenomena are possible explanations for the substantial number of trans-eQTLs for which we lack data on a potential cis-mediator.
Our working hypothesis is that a substantial fraction of trans-eQTLs are fully-mediated by a transcript that is regulated in cis by the causal trans-eQTL variant (Fig. 1). While we did not observe complete mediation for most observed trans-eQTLs, we demonstrate that full mediation will be observed as partial mediation in the presence of mediator measurement error and/or imperfect LD between the causal variant and the variant used for analysis. Measurement error and imperfect LD are typically present in eQTL studies; thus, full mediation will frequently be observed as partial mediation. Factors that contribute to measurement error include: experimental error, cell type-specific eQTLs in the presence of cell mixtures, stochastic or temporal variability in expression, and non-specific measurement of the mediating transcript(s) (i.e., some probes bind multiple isoforms). Observing partial mediation may also be due, in part, to the Winner's curse, as trans-eQTL associations that are overestimated may not be fully explainable by a cis-mediator. For the trans-eQTL that lacked clear evidence of mediation, potential explanations include: analyzing a cis-transcript that is not the true mediator (perhaps due to missing data), low power due to measurement error, or a false positive trans-eQTL.
In this work, we observe a subset of trans-eQTLs that are clearly attenuated after adjustment for a cis-mediator (i.e., mediation proportion>0 and Sobel P<10−5), as expected based on the mediation hypothesis (Fig. 2A). However, for the remaining trans-eQTLs, the mediation proportion estimates are scattered around zero (i.e., the trans association often gets somewhat stronger after adjustment) and the Sobel P distribution is non-uniform. We hypothesize that many of these “significant” estimates are due to a mixture of true mediation and the various sources of potential bias we describe in this work, including cis-trans confounding and correlation between the true (unmeasured) mediator and the transcript selected for mediation analysis. These types of bias have no expectation regarding directionality, so a distribution of mediation proportions that includes zero is expected.
Potential confounders of the cis-trans association include demographic and environmental factors, as well as a wide-array of biological phenomenon, some of which may be captured by measured expression features. Omitting such variables from the regression model can bias the estimates of the “direct effect” of the SNP on the trans-gene and the “mediation proportion”. The direction of this bias will depend on the direction of the effects for the omitted confounder(s). We attempted to control for potential confounding factors in this work using only principle components adjustment (see methods), but this limitation did not prevent us from detecting many examples of cis-mediation. However, confounding bias is likely to prevent detection of weaker mediation signals. Because genome-wide expression data contains very large numbers of correlated genes (too many to adjust for individually), additional research is needed to develop methods for comprehensive adjustment for cis-trans confounding in analyses of mediation in the genome-wide setting.
Few prior studies have assessed cis-mediation for trans-eQTL associations at the genome-wide level. Jian et al. described the use of mediation analysis in order to identify eQTLs for CYP2D6 activity [18]. Battle, et al. [19] used RNA sequencing data from whole blood on 922 genotyped individuals to characterize the effects of regulatory variation on transcriptome diversity. They observed 138 genes regulated by trans-variants and 76 trans-eQTL SNPs that were associated with expression of a proximal gene. Using a likelihood-based approach [20], [21], Battle et al. reported that 85% of identified trans effects were mediated by cis transcripts, but with only 4% showing evidence of “full mediation” and the remaining 81% showing evidence of partial mediation. However, the likelihood-based test for partial mediation used by Battle, et al. is also based on a regression the trans-gene on the SNP and the cis-mediator, and is therefore also prone to confounding biases caused by unobserved variables.
The number of trans-eQTLs observed in this South Asian population is somewhat larger than prior studies of similar sample size [5], [6], [11]. Prior studies have also noted low rates of replication for trans-eQTLs across studies, even for studies of similar ancestry [5], [9]. For example, 46 of the 130 trans-eQTLs observed by Fehrmann et al. (in whole blood among 1,469 samples) could be replicated in an eQTL study of monocyte RNA at P<10−5 among 1,490 samples [6]. Difficulties in replication have also been observed in trans-eQTL studies of mice [22]. Replication was markedly better in a recent trans-eQTL meta-analysis, presumably due in part to large sample size (n>5,000) and a focus on trait-associated SNPs [11]. Several factors may contribute to the low rates of replication of our observed trans-eQTLs in prior studies. First, differences between population, both genetic and environmental may impact trans-eQTL patterns. Second, there are differences in RNA source, as prior trans-eQTL studies used whole blood or monocytes, while our source is PBMCs, consisting of monocytes (∼15%), T lymphocytes (∼65%), and B lymphocytes (∼20%), representing ∼35% of peripheral white blood cells. Third, we lack complete lists of trans-eQTL for replications purposes, as we are limited to examining lists of only the strongest trans-eQTL associations provided by the authors of prior papers.
Mediation analysis is an attractive method for characterizing observed trans-eQTL associations for several reasons. First, it provides putative regulatory mechanisms for observed trans-eQTLs, potentially enhancing our understanding of disease-associated variants and human disease biology. Second, evidence of mediation provides a form of validation for trans-eQTLs. Independent replication (using the same cell type and population) is the ideal form of validation, but such data sources are not always available. Third, detecting mediation is methodologically straightforward, requiring only conditional linear regression techniques and simple equations for estimating effects and significance (see methods) [23]. Fourth, evidence of mediation could potentially be used as weights in integrative analyses or as priors in Bayesian analyses to enhance discovery of trans-eQTLs that have measured mediators. Mendelian randomization (i.e., instrumental variable (IV)) approaches could also be considered as a complimentary approach, in which cis-eSNPs are used as IVs for cis-transcripts and which are then screened, genome-wide, for effects on expression of trans-genes.
Our ability to detect cis-mediation will be enhanced by using whole-transcriptome RNA-sequencing data, which capture the vast majority of transcribed sequences, better reflecting the full complexity of the transcriptome. Array-based platforms capture only a fraction of transcribed sequences and probe-based measures often reflect multiple isoforms of a gene. RNA-sequencing can also provide enhance measurement precision for mediating transcripts, as would cell-type specific RNA sources. Very high-density genotype data will also enhance mediation analysis, as statistical evidence of mediation will be stronger when causal variants or strong tagging variant are directly measured.
In terms of sample size, this is the largest trans-eQTL study of humans to date that analyzes genome-wide variants in an agnostic fashion. An additional strength of this study is the rapid time between the blood draw and the extraction and processing of RNA. While this is often not reported in eQTLs studies conducted in the epidemiological setting, our processing protocol is excellent for studies of this size, especially for a low-resource setting such as Bangladesh. In addition, this is the first eQTL study conducted in a South Asian population. A recent multi-population eQTL study included U.S. residents of Indian ancestry [3]; however, the sample was relatively small, and RNA was obtained from lymphoblastoid cells lines and was thus prone to the effects of transformation with Epstein-Barr virus.
In conclusion, we have described cis - and trans-eQTLs in a large sample of South Asians and used mediation analysis to provide evidence that cis-mediation is often observed for trans-eQTLs in humans. In addition, using simulated data, we demonstrate how unobserved confounding variables and incorrect mediator selection can bias mediation estimates. Mediation analysis will be useful for validation and discovery of trans-eQTLs (especially when appropriate data for replication is not available) and is a valuable tool for enhancing our understanding of the biological and regulatory mechanism underlying trans-eQTLs.
Methods
Study participants
Subjects genotyped for this work were participants in the Bangladesh Vitamin E and Selenium Trial (BEST) [24]. BEST is a 2×2 factorial randomized chemoprevention trial evaluating the long-term effects of vitamin E and selenium supplementation on non-melanoma skin cancer risk among 7,000 individuals with arsenic-related skin lesions living in Araihazar, Matlab, and surrounding areas. Participants included in this work are a subset of BEST participants from Araihazar that have available data on genome-wide SNPs and array-based expression measures (described below).
SNP data and imputation
DNA extraction was carried out from the whole blood using the QIAamp 96 DNA Blood Kit (cat # 51161) from Qiagen, Valencia, USA. Concentration and quality of all extracted DNA were assessed using Nanodrop 1000. As starting material, 250 ng of DNA was used on the Illumina Infinium HD SNP array according to Illumina's protocol. Samples were processed on HumanCytoSNP-12 v2.1 chips with 299,140 markers and read on the BeadArray Reader. Image data was processed in BeadStudio software to generate genotype calls.
Quality control was conducted as described previously for a larger sample of 5,499 individuals typed for 299,140 SNPs [25], [26]. First, we removed DNA samples with very poor call rates (<90%; n = 8) and SNPs that were poorly called (<90%) or monomorphic (n = 38,753). Individuals with gender mismatches were removed (n = 79), as were technical replicate DNA samples run to assure high genotyping accuracy (n = 53). No individuals had outlying autosomal heterozygosity or inbreeding values. After inspecting distributions of SNP and samples call rates, we excluded samples with call rates <97% (n = 5) and SNPs with call rates <95% (n = 1,045). SNPs with HWE p-values<10−10 were excluded (n = 1,045). This QC resulted in 5,499 individuals with high-quality genotype data for 257,747 SNPs. The MaCH software [27] was used to conduct genotype imputation using HapMap3 GIH reference haplotypes. Only high-quality imputed SNPs (imputation r2>0.5) with SNPs with MAF>0.05 were included in this analysis. A subset 1,799 individuals with available data on array-based expression measures was used for this project
Gene expression data
RNA was extracted from PBMCs, preserved in buffer RLT, and stored at −86°C using RNeasy Micro Kit (cat# 74004) from Qiagen, Valencia, USA. Concentration and quality of RNA samples were assessed on Nanodrop 1000. cRNA synthesis was done from 250 ng of RNA using Illumina TotalPrep 96 RNA Amplification kit. As recommended by Illumina we used 750 ng of cRNA on HumanHT-12-v4 for gene expression. Expression data were quantile normalized and log2 transformed. The chip contains a total of 47,231 probes covering 31,335 genes. There were 1,825 unique individuals in both expression data and SNP data. For the vast majority of participants, between 30% and 47% of probes had detection P values <0.05. However, 26 individuals had>30% of probes with detection p-value <0.05, and these outlying individuals were excluded from the analysis, leaving an analysis sample size of 1,799. For this analysis, no probes were excluded based on detection P-values.
Identification of probes that map to a single gene
To ensure each probe mapped uniquely to a single gene, we aligned the Illumina probe sequences to all transcriptome sequences contained in both the knownGeneMrna and the knownGeneTxMrna tables from the UCSC Genome Browser (version GRCh37/hg19). Probe sequences were aligned using BLAST, as recommended by Barbosa-Morais et al. [28]: (blastn -dust no -evalue 10e-6). This resulted in alignments between 38,924 probes and 66,864 transcripts. From these alignments, we selected un-gapped alignments with up to 2 mismatches, as recommended by Barbosa-Morais et al., resulting in alignments between 35,202 probes and 61,350 transcripts. We then determined which transcripts (i.e., isoforms) belonged to the same gene using the knownIsoforms table from UCSC genome browser, which resulted in 35,202 probes mapped to 23,419 isoform clusters (i.e., genes). We did not disqualify probes that mapped to several isoforms of the same gene, provided they did not map to isoforms of any second gene. After excluding probes that mapped to multiple genes, we identified 31,853 probes were specific to 20,143 genes.
Exclusion of probes that bind to sequences containing SNPs
For the 31,853 specific probes, we obtained absolute genomic coordinates from the UCSC knownGene table, which contains genomic coordinates for all transcripts in knownGeneMrna/knownGeneTxMrna, including gaps introduced by introns. We referred to the UCSC snp135Common table to count the number of SNPs in each probe, according to the probe's genomic coordinates. Out of the 31,853 specific probes, 8,880 probes contained one or more SNPs, and these were excluded from all cis-eQTL analyses. Of these, the majority (6,194 probes) only contained a single SNP.
Expression data processing
We used probe-level data for this analysis (as opposed to combining probe data into gene-level expression traits), primarily because some probes bind specific isoforms of a transcript that are not detected by other probes that target the same gene. Probe intensity values were log-transformed. Batch effects (22 batches total, representing 22 96-well plates) were assessed using the empirical Bayes framework implemented in the Surrogate Variable Analysis (SVA) software package (ComBat) [29]. SVA did not detect any significant surrogate variables, thus we used principle components (PC) analysis to estimate 100 PCs that were subsequently considered as potential latent variables that may represent variability attributable to technical (i.e., non-biological) factors.
Statistical methods for eQTL analysis
All expression values were log-transformed prior to analysis. Linear regression, as implemented in the matrix-eQTL software package [30] was used to conduct genome-wide cis - and trans-eQTL analyses. Cis associations were tested for SNPs and probes <1 Mb apart (i.e., a 2Mb window centered on each SNP). Trans-associations were tested for all inter-chromosomal SNP-probe pairs, as well as for intra-chromosomal SNPs-probe pairs>10 Mb apart. For both cis and trans analyses, we used an FDR of 0.05 to report the significant associations, as calculated by the matrix-eQTL software. We generated data on 100 PCs, and conducted cis-eQTL analyses multiple times, adjusting for 20, 40, 60, 80, and 100 PCs. The number of cis-eQTLs detected increased as we adjusted for additional PCs, but the increase in power was very small for 100 PCs as compared to 80, so we elected to adjust for 80 PCs in the cis-eQTL analysis. For the trans-eQTL analysis, we only adjusted for the 14 (of the 80) PCs that were not associated with any SNP at a P-value>5×10⁻⁸. Genome-wide trans-eQTL analyses showed little evidence of inflation due to population structure of genotyping artifacts (Figure S11), consistent with our prior work demonstrating little evidence of population structure among our study participants. Lead SNPs fear each eQTL were defined as the SNP with the smallest P-value for an expression trait, with trans-associations>5Mb apart considered independent trans-eQTL associations.
Assessment of off target binding for probes involved in trans-eQTLs
Among our observed trans-eQTL associations with P<10−7, we sought to eliminate false positives due to loose, off-target binding of the expression probe near the correlated SNP. A localized high-sensitivity BLAST was performed (blastn -dust no -evalue 1000). For each instance of BLAST, the query was the sequence of the expression probe from our list of trans-eQTLs, and the target was the genome sequence from a 4Mb window centered on the corresponding SNP (hg19, retrieved from UCSC). Note that our initial probe QC used a lower-sensitivity BLAST with a much larger query and target sets (i.e.: all HT-12 probes and all sequences UCSC's knownGeneMrna, knownGeneTxMrna). After identifying putative trans-eQTL associations, smaller query and target sets could be selected for a higher-sensitivity BLAST. This two-stage approach was also used by Fehrmann et al. [5]. From the BLAST results, we accepted alignments with: alignment length> = 15bp; or alignment length> = 20 and number of mismatches < = 1; or alignment length> = 30 and number of mismatches < = 2; or alignment length> = 50 and number of mismatches < = 15.
Enrichment analysis
Trait-associated SNPs were selected from the NHGRI's GWAS catalog based on a reported P<5×10⁻⁸. The resulting list of SNPs was pruned to eliminate SNPs with high LD (no pair-wise r2>0.3). For the GWAS enrichment analysis, we compared the catalog SNPs with a reported P<5×10⁻⁸ to catalog SNPs with P>5×10⁻⁸, a method previously used by Westra et al. [11]. For this analysis, a Fisher's exact test was used to assess significance of enrichment. For the cis/trans enrichment analysis, random sets of SNPs were extracted from our dataset matched to our set of trait-associated SNPs based on MAF (10 categories) and distance to transcription start site (10 bins). Empirical P-values were estimated using 1,000 replicate datasets.
Mediation analysis
To identify trans-eQTLs showing evidence of mediation, we restricted to those lead trans-eSNPs (P<10−7) which has at least one associated nearby (<1 Mb) probe (cis-probe) with association (P<2.2×10⁻³, the P threshold used for the cis-eQTL analysis). For trans-eSNPs associated with multiple cis-probes, we selected the associated cis-probe whose lead cis-eSNP was in strongest LD with the lead trans-SNP. Mediation analysis was conducted as follows: For lead trans-eSNPs that were associated with a cis probe, the trans-association was re-estimated, adjusting for expression of the local transcript measured by the probe. The difference between the beta coefficients for the trans-association before and after adjustment for the cis probe was expressed as the “proportion of the total effect that is mediated” (i.e., % mediation), calculated as (βunadj – βadj)/βunadj[23], with βunadj and βadj known as the total effect the direct effect, respectively. The Sobel P-value for mediation [31] was calculated by first estimating the cis-adjusted trans-association for the lead trans-eSNP:

We then estimated the trans-eSNP's association with the probe in cis (the potentially mediating probe):

The P-value was then estimated by comparing this following t statistic to a normal distribution:


where SE is the pooled standard error term calculated from the above beta coefficients and their variances. β1 β2 is often referred to as the indirect effect.
Simulations to assess why “partial” mediation is observed
Using real genotype data for all 1,799 participants, we selected a causal variant for simulation purposes and generated data on a cis-transcript (standard normal distribution) influenced by the causal variant (R2 = 0.1) and a trans-transcript (standard normal distribution) influenced by the cis-transcript (β = 0.2). We introduced measurement error by adding normally-distributed error components to both the cis - and trans-transcripts. Standard deviations for these components were chosen to produce specific r2 values (1.00, 0.75, 0.50, 0.25, and 0.10) for the correlation between the true mediator and the measure transcript, with lower values reflecting higher error. For each measurement error scenario, 500 datasets were simulated, and analyses were conducting using variants with a wide range of LD (i.e., r2 values) with the true causal variant.
Simulations to assess the impact of confounding between cis - and trans-transcripts
In order to assess the impact of confounding between a cis-mediating transcript and a trans-gene involved in a trans-eQTL association, we generated data similar to that described above, but introduced an “unobserved” variable (U) that affects both the cis - and trans-transcripts. We varied the strength of the cis-eQTL effect in terms of its r2 (0.05 to 0.4), the strength of the effect of the cis-transcript on the trans-transcript (0.1, 0.2, and 0.3), and the strength of the confounding relationship in terms of the effects of U on the cis-transcript (βU-cis) and the trans-transcript (βU-trams = |βU-cis|). The SNP was coded as the number of alleles that increase the abundance of the cis-transcript.
Simulations to assess the consequences of selecting the wrong mediator
In order to assess the impact of selecting a cis-transcript for mediation analysis that is not the true mediator, we conducted similar simulations as those described above, but generated data on an additional transcript influenced by a variant near the causal variant for the true mediating transcript. We first selected several SNPs near the selected causal variant for the primary cis-/trans-eQTL with a wide range of LD r2 values, and we then treated these variants as causal variants for a second eQTL association for a different transcript that does not affect the trans-transcript. In the simplest scenario, we simulated data with no dependency between the true cis-mediator and the selected transcript other than correlation due to LD between the causal variants that influence their expression (Figure S8A). We then introduced correlation between the two cis-transcripts using several different approaches. First, we introduced confounding by an unmeasured factor, using effect sizes of 0.3 and 0.5 on both transcripts to represent “weak” and “strong” confounding (Figure S8B). We also introduced “negative confounding”, in which the effect of the unmeasured confounder was positive for one cis-transcript and negative for the other. Second, we introduced an effect of the true cis-mediator on the selected transcript, exploring both positive and negative effect (beta = 0.25 and −0.25), as well as the reverse causal relationship where the selected transcript affects the true cis-mediator (beta = 0.25 and −0.25). Lastly, we introduced an unmeasured confounding factor affecting both the trans-gene and the selected cis-transcript (Figure S8D).
Replication of trans-eQTLs based on previous eQTL studies
Data for replicating observed trans-eQTLs was obtained from several prior trans-eQTL studies using a RNA extracted from peripheral blood or subtypes of white blood cells [5], [7], [11]. Consensus trans-eQTLs from HapMap lymphoblastoid cells line studies were also used for replication purposes [17]. Considering multiple genotyping and expression platforms were used across these studies, replication as defined as trans-associations which involve the same expressed gene (based on HUGO gene symbol) and the SNPs in the same genomic region (<500 kb apart).
Ethics and data sharing statements
This research as approved by the Institutional Review Boards of The University of Chicago, Columbia University, and the Bangladesh Medical Research Council, and all study participants provided informed consent. Summary statistics for the cis - and trans-eQTL analyses as well as the mediation analysis are available at http://doi.org/10.5061/dryad.tp097.
Supporting Information
Zdroje
1. DixonAL, LiangL, MoffattMF, ChenW, HeathS, et al. (2007) A genome-wide association study of global gene expression. Nat Genet 39 : 1202–1207.
2. StrangerBE, NicaAC, ForrestMS, DimasA, BirdCP, et al. (2007) Population genomics of human gene expression. Nat Genet 39 : 1217–1224.
3. StrangerBE, MontgomerySB, DimasAS, PartsL, StegleO, et al. (2012) Patterns of cis regulatory variation in diverse human populations. PLoS Genet 8: e1002639.
4. VeyrierasJB, KudaravalliS, KimSY, DermitzakisET, GiladY, et al. (2008) High-resolution mapping of expression-QTLs yields insight into human gene regulation. PLoS Genet 4: e1000214.
5. FehrmannRS, JansenRC, VeldinkJH, WestraHJ, ArendsD, et al. (2011) Trans-eQTLs reveal that independent genetic variants associated with a complex phenotype converge on intermediate genes, with a major role for the HLA. PLoS Genet 7: e1002197.
6. ZellerT, WildP, SzymczakS, RotivalM, SchillertA, et al. (2010) Genetics and beyond—the transcriptome of human monocytes and disease susceptibility. PLoS One 5: e10693.
7. FairfaxBP, MakinoS, RadhakrishnanJ, PlantK, LeslieS, et al. (2012) Genetics of gene expression in primary immune cells identifies cell type-specific master regulators and roles of HLA alleles. Nat Genet 44 : 502–510.
8. SchadtEE, MolonyC, ChudinE, HaoK, YangX, et al. (2008) Mapping the genetic architecture of gene expression in human liver. PLoS Biol 6: e107.
9. InnocentiF, CooperGM, StanawayIB, GamazonER, SmithJD, et al. (2011) Identification, replication, and functional fine-mapping of expression quantitative trait loci in primary human liver tissue. PLoS Genet 7: e1002078.
10. LiQ, SeoJH, StrangerB, McKennaA, Pe'erI, et al. (2013) Integrative eQTL-based analyses reveal the biology of breast cancer risk loci. Cell 152 : 633–641.
11. WestraHJ, PetersMJ, EskoT, YaghootkarH, SchurmannC, et al. (2013) Systematic identification of trans eQTLs as putative drivers of known disease associations. Nat Genet 45 : 1238–1243.
12. NicolaeDL, GamazonE, ZhangW, DuanS, DolanME, et al. (2010) Trait-associated SNPs are more likely to be eQTLs: annotation to enhance discovery from GWAS. PLoS Genet 6: e1000888.
13. OkadaY, HirotaT, KamataniY, TakahashiA, OhmiyaH, et al. (2011) Identification of nine novel loci associated with white blood cell subtypes in a Japanese population. PLoS Genet 7: e1002067.
14. Munthe-FogL, HummelshojT, HonoreC, MollerME, SkjoedtMO, et al. (2012) Variation in FCN1 affects biosynthesis of ficolin-1 and is associated with outcome of systemic inflammation. Genes Immun 13 : 515–522.
15. BarrettJC, ClaytonDG, ConcannonP, AkolkarB, CooperJD, et al. (2009) Genome-wide association study and meta-analysis find that over 40 loci affect risk of type 1 diabetes. Nat Genet 41 : 703–707.
16. RichiardiL, BelloccoR, ZugnaD (2013) Mediation analysis in epidemiology: methods, interpretation and bias. Int J Epidemiol 42 : 1511–1519.
17. XiaK, ShabalinAA, HuangS, MadarV, ZhouYH, et al. (2012) seeQTL: a searchable database for human eQTLs. Bioinformatics 28 : 451–452.
18. JiangG, ChakrabortyA, WangZ, BoustaniM, LiuY, et al. (2013) New aQTL SNPs for the CYP2D6 identified by a novel mediation analysis of genome-wide SNP arrays, gene expression arrays, and CYP2D6 activity. Biomed Res Int 2013 : 493019.
19. BattleA, MostafaviS, ZhuX, PotashJB, WeissmanMM, et al. (2014) Characterizing the genetic basis of transcriptome diversity through RNA-sequencing of 922 individuals. Genome Res 24 : 14–24.
20. MillsteinJ, ZhangB, ZhuJ, SchadtEE (2009) Disentangling molecular relationships with a causal inference test. BMC Genet 10 : 23.
21. SchadtEE, LambJ, YangX, ZhuJ, EdwardsS, et al. (2005) An integrative genomics approach to infer causal associations between gene expression and disease. Nat Genet 37 : 710–717.
22. van NasA, Ingram-DrakeL, SinsheimerJS, WangSS, SchadtEE, et al. (2010) Expression quantitative trait loci: replication, tissue - and sex-specificity in mice. Genetics 185 : 1059–1068.
23. BaronRM, KennyDA (1986) The moderator-mediator variable distinction in social psychological research: conceptual, strategic, and statistical considerations. J Pers Soc Psychol 51 : 1173–1182.
24. ArgosM, RahmanM, ParvezF, DignamJ, IslamT, et al. (2013) Baseline comorbidities in a skin cancer prevention trial in Bangladesh. Eur J Clin Invest 43 : 579–588.
25. PierceBL, KibriyaMG, TongL, JasmineF, ArgosM, et al. (2012) Genome-wide association study identifies chromosome 10q24.32 variants associated with arsenic metabolism and toxicity phenotypes in Bangladesh. PLoS Genet 8: e1002522.
26. PierceBL, TongL, ArgosM, GaoJ, FarzanaJ, et al. (2013) Arsenic metabolism efficiency has a causal role in arsenic toxicity: Mendelian randomization and gene-environment interaction. Int J Epidemiol 42 : 1862–1871.
27. LiY, WillerCJ, DingJ, ScheetP, AbecasisGR (2010) MaCH: using sequence and genotype data to estimate haplotypes and unobserved genotypes. Genet Epidemiol 34 : 816–834.
28. Barbosa-MoraisNL, DunningMJ, SamarajiwaSA, DarotJF, RitchieME, et al. (2010) A re-annotation pipeline for Illumina BeadArrays: improving the interpretation of gene expression data. Nucleic Acids Res 38: e17.
29. JohnsonWE, LiC, RabinovicA (2007) Adjusting batch effects in microarray expression data using empirical Bayes methods. Biostatistics 8 : 118–127.
30. ShabalinAA (2012) Matrix eQTL: ultra fast eQTL analysis via large matrix operations. Bioinformatics 28 : 1353–1358.
31. SobelME (1987) Direct and Indirect Effects in Linear Structural Equation Models. Sociological Methods & Research 16 : 155–176.
Štítky
Genetika Reprodukční medicínaČlánek vyšel v časopise
PLOS Genetics
2014 Číslo 12
- Kazuistika – Perspektivy využití precizované medicíny v rámci personalizované specifické terapie onkologických pacientů
- Nobelova cena za chemii pro genetické nůžky: Objev, který změní naši budoucnost?
- Technologie na bázi RNA v klinické praxi: od přebarvených petúnií k terapii vzácných a dosud jen obtížně léčitelných chorob u lidí
- „Nepředstavovali jsme si, že náš výzkum povede přímo ke vzniku nových léků, dokonce ještě za našeho života“
- Bezplatné služby pro diagnostiku ATTRv amyloidózy pro kardiology
Nejčtenější v tomto čísle
- Tetraspanin (TSP-17) Protects Dopaminergic Neurons against 6-OHDA-Induced Neurodegeneration in
- Maf1 Is a Novel Target of PTEN and PI3K Signaling That Negatively Regulates Oncogenesis and Lipid Metabolism
- The IKAROS Interaction with a Complex Including Chromatin Remodeling and Transcription Elongation Activities Is Required for Hematopoiesis
- Echoes of the Past: Hereditarianism and
Zvyšte si kvalifikaci online z pohodlí domova
Mazová zátka a její řešení
nový kurzVšechny kurzy