
, and Reprogram Thymocytes into Self-Renewing Cells
Deciphering the initiating events in lymphoid leukemia is important for the development of new therapeutic strategies. In this manuscript, we define oncogenic reprogramming as the process through which non-self-renewing progenitors are converted into pre-leukemic stem cells with sustained self-renewal capacities. We provide strong genetic evidence that this step is rate-limiting in leukemogenesis and requires the activation of a self-renewal program by oncogenic transcription factors, as exemplified by SCL and LMO1. Furthermore, NOTCH1 is a pathway that drives cell fate in the thymus. We demonstrate that homeostatic NOTCH1 levels that are highest in specific thymocyte subsets determine their susceptibilities to oncogenic reprogramming by SCL and LMO1. Our data provide novel insight into the acquisition of self-renewal as a critical first step in lymphoid cell transformation, requiring the synergistic interaction of oncogenic transcription factors with a cellular context controlled by high physiological NOTCH1.
Published in the journal:
. PLoS Genet 10(12): e32767. doi:10.1371/journal.pgen.1004768
Category:
Research Article
doi:
https://doi.org/10.1371/journal.pgen.1004768
Summary
Deciphering the initiating events in lymphoid leukemia is important for the development of new therapeutic strategies. In this manuscript, we define oncogenic reprogramming as the process through which non-self-renewing progenitors are converted into pre-leukemic stem cells with sustained self-renewal capacities. We provide strong genetic evidence that this step is rate-limiting in leukemogenesis and requires the activation of a self-renewal program by oncogenic transcription factors, as exemplified by SCL and LMO1. Furthermore, NOTCH1 is a pathway that drives cell fate in the thymus. We demonstrate that homeostatic NOTCH1 levels that are highest in specific thymocyte subsets determine their susceptibilities to oncogenic reprogramming by SCL and LMO1. Our data provide novel insight into the acquisition of self-renewal as a critical first step in lymphoid cell transformation, requiring the synergistic interaction of oncogenic transcription factors with a cellular context controlled by high physiological NOTCH1.
Introduction
An important attribute of stem cell populations is the capacity to self-renew indefinitely both in normal development and during the process of cell transformation. Cancer stem cells, initially identified in acute myeloblastic leukemias [1], can self-renew indefinitely to propagate and maintain the disease [2]. This led to the experimental definition of leukemia initiating cell (LIC) characterized by their capacities to initiate the disease in transplanted host mice [1], [3]. Important questions remain to be resolved with regards to the nature of the cell of origin of cancer, that is the normal cells from which cancer originates [4]–[6] and the mechanisms that drive the transition to an initiated state [7]. It was initially thought that the capacity for self-renewal of LICs, also referred to as leukemic stem cells (LSCs), is conferred by the cell of origin of cancer, that is, primitive hematopoietic stem/progenitor cells (HSPCs), even though the leukemic phenotype is manifest in differentiating myeloblasts [3]. Alternatively, oncogenes acting on committed progenitors can induce a stem cell gene signature [8], leading to the reprogramming of non-self-renewing progenitors into pre-leukemic stem cells (pre-LSCs) [9], [10]. Nonetheless, only subsets of progenitors are susceptible to oncogenic reprogramming, raising questions on the molecular events that determine the susceptibility of target cells to oncogenes.
Normal thymic progenitors have limited if any self-renewal capacity [11], [12]. Bone marrow-derived progenitors settle in the thymus and gradually acquire T cell characteristics while losing “stemness” [13]. The NOTCH1 pathway is a master regulator of thymopoiesis acting at several steps, in particular at the DN3 stage where NOTCH1 together with the pre-TCR drives irreversible T-lineage commitment [14]. NOTCH1 gain-of-function mutations were found in more than half of human T-ALL [15] and in most mouse models [16], [17]. The significance of Notch1 for oncogenic transformation has been well established whereas the role of Notch1 in hematopoietic stem cell (HSC) self-renewal has been controversial (reviewed in [18]). NOTCH activity is highly context-dependent [19]. Hence, a hyperactive Notch1 allele (NICD; hereafter referred to as the Notch1 oncogene) is shown to cause an exhaustion of HSCs at the expanse of T-LSCs [20]. Once transformed, LICs in Notch1-induced T-ALL depend on continued Notch1 signals for maintenance [15], [21]–[23] and on several downstream effectors that include Hes1 [24]–[28] and Myc [27], [29]. These LICs were found in the immature single positive (ISP8) population, raising the question whether or not ISP8 are the cell of origin of T-ALL. Moreover, Notch1 is a weak tumor initiator [30]. Finally, the importance of Notch1 in pre-LSCs remains to be clarified.
Self-renewal in normal HSCs is controlled by a network of transcription factors [31]. This network includes the basic helix-loop-helix (bHLH) transcription factors SCL/TAL-1 [32], [33] and the highly homologous LYL1 [34]. Both SCL [35] and LYL1 form DNA binding heterodimers with E-proteins (e.g. E2A and HEB) that are also bHLH factors and directly interact with nuclear co-factors LIM-only (LMO) proteins to form transcription complexes that drive lineage-specific gene expression in hematopoietic cells [36], [37]. SCL is partly redundant with LYL-1 in HSCs [34]. SCL, LYL1 and LMO1/2 expression decreases drastically at early stages of T-cell differentiation [13]. Their ectopic expression in the thymus, commonly driven by chromosomal rearrangements, is associated with T-ALL [38].
Overexpression of LMO1 or LMO2 in the thymus induces leukemia in mice with low penetrance and long latency [39]. This results from the emergence of pre-LSCs with altered gene expression [9]. Strikingly, T-ALL onset is accelerated by genetic collaboration with SCL [40], [41]. How SCL induces T-ALL remains to be clarified. Indeed, two mechanisms have been proposed for SCL-mediated leukemogenesis. SCL heterodimerizes with and inhibits the activity of E-proteins [42]–[44] [45]–[47], in particular of E2A and HEB that are nodal regulators in the T lineage (reviewed in [48], [49]). Accordingly, SCL inhibitory activity is sufficient to cause differentiation arrest in both B - [50] and T lineages [51]. Inhibition of E protein and differentiation blockade were, however, insufficient for leukemogenesis since most SCL transgenic lines did not develop T-ALL [40], [51], [52], with the exception of one transgenic model [53], [54]. In parallel, inhibitor of DNA-binding ID1 that sequesters E2A/HEB away from DNA was found to induce T-ALL in transgenic mice [55]. This led to the current view that bHLH oncogenic transcription factors that include SCL (or TAL1), TAL2 and LYL1 form inactive transcriptional complexes that induce T-ALL via inhibition of E proteins (reviewed in [49], [56]). With the predicament that cancer development is a Darwinian evolutionary process, the natural selection for genetic variants in which E proteins are inhibited should involve a variety of mechanisms, upregulation of bHLH transcription factors, of ID1-4 proteins that sequester E proteins away from DNA and/or inactivation of E protein encoding genes. The absence of the two latter categories so far in human T-ALL samples argues in favor of the second hypothesis, that transcription activation by oncogenic bHLH factors is an important leukemogenic driver. In support of this hypothesis, there is evidence for target gene activation in leukemic T cells [9], [57]–[60]. Nonetheless, how the SCL-LMO1/2 collaboration establishes a pre-leukemic state to initiate T-ALL remains ill-defined. Recently, Lyl1 gene invalidation is shown to abrogate LMO2 self-renewal activity in pre-LSCs, suggesting that Lyl1 is an important downstream target of LMO2 [61]. However, overexpressing LYL1 on its own is clearly insufficient for thymocyte reprogramming [9], indicating that the molecular context for cell transformation and/or thymocyte reprogramming by LYL1 remains to be uncovered. The inability of SCL or LYL1 to induce T-ALL on their own and the long latency required for LMO1/2-induced leukemogenesis strongly support the view that oncogene cooperativity drives synergistic modulation of gene expression, associated with major change in cellular reorganization [62]. Understanding the process of oncogene cooperativity in leukemia initiation can reveal mechanisms that control the growth of leukemic stem cells [63].
Recent genome-wide studies of leukemic samples at diagnosis have been highly informative on the mutational process and potential driver mutations in acute leukemias [64], [65]. These powerful approaches did not allow for a clear distinction between initiating events in leukemogenesis and collaborating events that contribute to disease progression, which were revealed through two distinct approaches, the study of rare monochorionic twins [10] or of mouse models. Major questions remain nonetheless to be investigated. For example, it is not clear what determines the nature of the target cells of oncogenic reprogramming [5].
We used converging genome-wide approaches together with molecular and genetic approaches to provide novel evidence how the necessary collaboration between SCL, LMO1 and Notch1 determines the target cells of transformation in T-ALL and to identify novel mechanisms by which these oncogenes cooperate to activate stem cell genes and to convert normal thymocytes into self-renewing pre-LSCs. In particular, transcription activation posits a requirement for direct SCL-LMO1 interaction to assemble transcription activation complexes at target loci. In the present study, we generated transgenic mice expressing a mutant SCL that is unable to associate with LMO1/2 but retains its capacity to inhibit E2A/HEB, to provide genetic evidence for the importance of transcription activation in thymocyte reprogramming and in leukemogenesis.
Results
SCL and LMO1 oncogenes confer an aberrant self-renewal to DN3 pre-leukemic thymocytes
The capacity for sustained self-renewal is best observed in serial transplantation assays. While normal thymocytes did not engraft in transplanted hosts, SCLtgLMO1tg thymocytes afforded thymic reconstitution which was sustained through three serial transplantations (Fig. 1A–C). Thymocyte differentiation in the thymus progresses from the double negative stages (DN1-4) to the CD4+CD8+ double positive (DP) stage and finally mature single positive CD4+ (SP4) or CD8+ (SP8) cells (S1A,B Fig.). In primary and secondary transplantation, donor-derived cells retained a capacity to give rise to DP cells. However, after the tertiary transplantation, the proportion of donor-derived DN3 thymocytes increased markedly (Fig. 1B), resulting in a cumulative 75-fold amplification (Fig. 1C). In contrast, the other thymocyte subsets decreased during the same time-frame. We transplanted purified ETP, DN1-4 and DP populations from pre-leukemic SCLtgLMO1tg mice (Fig. 1D). Only purified DN3 cells efficiently engrafted the thymus of recipient mice, (left panel). A fraction of mice transplanted with DN1 and DN2 cells exhibited less than 1% engrafment and were “negative” by definition, although this was different from the absence of engrafment from DP cells. Furthermore, purified DN3 thymocytes retained the capacity to differentiate in vivo into DP and SP cells and, at the same time, to expand and self-renew (right panel).

Interestingly, donor-derived SP4 or SP8 thymocytes recovered from transplanted mice were activated by TCR stimulation to the same extent as normal host thymocytes by upregulating the CD69 activation marker (Fig. 1E). This indicates that engrafted SCLtgLMO1tg thymocytes were non-leukemic. Accordingly, transplanted mice remained aleukemic, with small thymi and normal spleen size, despite the elevated expansion of DN3 thymocytes (S1C Fig.). Together, our results indicate that the SCL and LMO1 oncogenes reprogram DN3 thymocytes into pre-LSCs that have acquired de novo self-renewing activity and retained their capacity to differentiate into functional T cells.
The activity of SCL-LMO1 in DN3 thymocytes is sensitive to NOTCH levels
The DN3 stage in the thymus marks T-lineage commitment driven by NOTCH1 acting in concert with the pre-TCR. We therefore addressed the question whether these two pathways contribute to DN3 cell reprogramming by SCL-LMO1. We first addressed the functional importance of NOTCH1 in this process by lowering or increasing NOTCH activity. The expansion of pre-leukemic SCL-LMO1 DN3 cells was recapitulated in vitro by co-culture on OP9 stromal cells expressing the NOTCH ligand Delta-like-1 (OP9-DL1) [66] (Fig. 2A). DAPT, an inhibitor of the -secretase, abrogated this expansion (Fig. 2A) without affecting the viability of the OP9-DL1 stromal cells (S2 Fig.). Strikingly, DAPT-treated DN3 cells were no longer able to engraft compared to control cells exposed to the vehicle alone when transplanted at equal numbers, suggesting that physiologic Notch1 signaling is required for SCL-LMO1 activity. We then addressed the consequences of supraphysiologic Notch1 signaling on thymocyte reprogramming. Oncogenic Notch1 has well established functions in leukemia induction and leukemia maintenance (reviewed in [18]). Nonetheless, the role of Notch1 during this initial transition stage from a cell with finite life span to an aberrantly self-renewing pre-LSC remains to be addressed. Surprisingly, pre-leukemic Notch1tg thymocytes did not repopulate the thymus of recipient mice (Fig. 2B). Rather, Notch1 significantly enhanced the engraftment of SCLtgLMO1tg thymocytes (Fig. 2B). These cells also became independent of the thymic microenvironment (S3A–B Fig.). Therefore, Notch1 acts as a strong enhancer of SCL-LMO1 self-renewal activity but lacks intrinsic reprogramming activity in the absence of other oncogeneic transcription factors.

Notch1 oncogene confers a proliferative advantage to SCL-LMO1-induced pre-LSCs independently of a functional pre-TCR
To determine whether the Notch1 oncogene modifies the frequency of SCL-LMO1 pre-LSCs and/or their expansion at the clonal level, we performed limiting dilution assays using DN3 pre-leukemic thymocytes (Fig. 2C). A hyperactive Notch1 allele increased by 60-fold the frequency of SCL-LMO1-induced pre-LSCs (Fig. 2C). In contrast, Notch1 did not significantly modify the expansion potential of individual pre-LSC when transplanted at ∼1 competitive repopulating unit, (S3C Fig.). Therefore, Notch1 expands the pool of SCLtgLMO1tg pre-LSCs in vivo. We took advantage of the Tcrβ gene rearrangement as a clonal mark to assess the diversity of pre-LSCs in transplantation assays (S3D Fig.). Pre-leukemic thymocytes were polyclonal before transplantation. Engrafted SCLtgLMO1tg thymocytes exhibited an oligoclonal signature whereas Notch1tgSCLtgLMO1tg thymocytes remained polyclonal after transplantation. Furthermore, we ruled out the possibility that SCLtgLMO1tg thymocytes had acquired Notch1 mutations (S1 Table). These results indicated that a limited number of SCL-LMO1 expressing clones were able to self-renew in the absence of Notch1 while multiple clones were able to self-renew in the presence of Notch1.
We next addressed the role of the pre-TCR in the self-renewal activity induced by SCL-LMO1 and Notch1. We exploited the Cd3ε-/- genetic mouse model in which thymocyte differentiation is blocked at the DN3a stage because of a non-functional pre-TCR/TCR (S1 Fig. and S4A Fig.). We observed that pre-TCR signalling did not modify the frequency of SCL-LMO1-induced pre-LSCs nor the genetic collaboration between Notch1 and SCL-LMO1 in thymocyte reprogramming (Fig. 2C). Moreover, the transplantation of pre-leukemic Cd3ε-/-SCLtgLMO1tg thymocytes resulted in thymic reconstitution in primary, secondary and tertiary recipient mice (S4B Fig., left panel), associated with DN3 cell expansion over serial transplantations (S4B Fig., right panel), as observed with SCLtgLMO1tg thymocytes (Fig. 1C).
We therefore took advantage of Cd3ε-/- mice to specifically assess the effects of the Notch1 transgene. We transplanted SCLtgLMO1tg thymocytes in competition with Notch1tgSCLtgLMO1tg thymocytes. The formers were marked with GFP to distinguish between the two cell types. Strikingly, the hyperactive Notch1 allele conferred a marked competitive advantage to SCLtgLMO1tg pre-leukemic thymocytes when transplanted at equal concentrations both at the limiting (1×10³) and higher (1×10⁶) cell doses (Fig. 2D and S4C Fig.). SCLtgLMO1tgGfptg thymocytes became competitive only when transplanted at 20-fold excess. These results indicate that oncogenic Notch1 confers a competitive advantage to SCLtgLMO1tg pre-LSCs.
Constitutive Notch1 activation expands the pool of SCL-LMO1-induced pre-LSCs to all DN-ISP8 populations
In addition, the capacity of Notch1tgSCLtgLMO1tg thymocytes to engraft was no longer confined to DN3 but was found in all DN subsets (DN1-DN4) and immature single-positive CD8 (ISP8) cells but not in DP thymocytes (S4D Fig.). Strikingly, these purified DN-ISP8 thymocytes preferentially gave rise to the same populations in transplantation, indicative of self-renewal activity (Fig. 2E). Therefore, elevating Notch1 activity was sufficient to convert all immature thymocytes (DN1 to ISP8) into cellular targets of SCL-LMO1 reprogramming activity. This expansion of cellular targets concur with the limiting dilution assay indicating that Notch1 increased the frequency of pre-LSCs.
We conclude that NOTCH1 levels determine the expressivity of SCL-LMO1 in thymocyte reprogramming.
The Notch1-Hes1/Myc pathway as an enhancer of SCL/LMO1 self-renewal activity
Our findings indicate that SCL-LMO1 self-renewal activity is confined to the DN3 stage (Fig. 1D), is GSI-responsive and is sensitive to NOTCH1 levels (Fig. 2A–B). Interestingly, DN3 thymocytes are normally more sensitive to decreased Notch1 gene dosage compared to earlier thymocyte progenitors [67]. We therefore capitalized on the comprehensive gene expression data from the Immunological genome project (Immgen) together with NOTCH1 ChIP-Seq data [68] and HSC self-renewal resources to inform about candidate genes in pre-LSC self-renewal. First, we investigated the upregulation pattern of NOTCH1-bound genes that are GSI-responsive during early thymocyte differentiation. Considering genes that increased by more than 1.3-fold at each transitional stage, the analysis revealed that the percentage of up-regulated NOTCH1-bound genes steadily increased from the ETP to the DN3a stage and decreased thereafter (Fig. 3A and S2 Table) as expected (reviewed in [69]). The general trend was also observed for the total transcriptome but the magnitude of the effect was stronger for the NOTCH1-bound genes (Fig. 3A). Furthermore, NOTCH1-bound genes sharply decreased at the DP stage when the total transcriptome increased. Finally, DN3 cells in WT and SCL-LMO1 mice exhibit the highest levels of Notch1 and Notch3 genes and of the NOTCH reporter activity in Transgenic Notch Reporter (TNRtg) mice (S5A–B Fig.) as reported [23]. Therefore, NOTCH activity was highest in DN3 thymocytes, coinciding with the self-renewal activity of SCL-LMO1. MYC has been implicated downstream of NOTCH1 in T-ALL [27]. Interestingly, we found that the increase in MYC target genes coincided with that of NOTCH1 and peaked at the DN2-DN3a transition (Fig. 3A).

Candidate genes operating with SCL-LMO1 at the DN3 stage should also be GSI-responsive, as engraftment by SCL-LMO1 DN3 thymocytes was DAPT-sensitive. These genes should operate prior to pre-TCR signalling, i.e. at the DN3a stage, since SCL-LMO1-induced self-renewal activity was fully efficient in Cd3ε-deficient DN3 thymocytes (Fig. 2C and S4B Fig.). Based on the list of GSI-responsive NOTCH1-bound genes published by Wang et al [68], 25 were found to increase at the DN2 to DN3a transition (S2 Table). We next intersected this short list with HSC self-renewal resources [70], [71] and found 3 genes Hes1, Myc and Bcl6 (Fig. 3B). We ruled out Bcl6 because of high expression in DP cells that are resistant to cellular reprogramming while both Myc and Hes1 decreased at this stage (Fig. 3C). We noticed that Notch1 target genes correlate well with Notch1 mRNA levels during thymocyte differentiation, except Myc. Despite this, the increase in MYC-bound genes at the DN2-DN3a transition correlates with that of NOTCH1-bound genes (Fig. 3A). These observations suggest MYC activity is subject to additional levels of regulation. Myc is a well known target of NOTCH1 in T-ALL [27], [72]. Moreover, Hes1 overexpression expanded HSCs in culture [70], [73] whereas Hes1 invalidation decreased LSCs in Notch1-induced T-ALL [24]. We therefore determined whether Hes1 or Myc may be important for this new activity of Notch1 at enhancing SCL-LMO1 reprogramming activity.
To determine whether Hes1 or Myc can substitute for Notch1 as an enhancer of SCL-LMO1, we overexpressed these genes in HSCs from SCL-LMO1 transgenic mice using the MSCV retroviral vector (Fig. 3D). Both Hes1 and Myc caused an expansion of the DN3 population in transplanted mice, which was twenty to forty fold higher than that observed with the control vector (GFP) (Fig. 3E). Furthermore, all DN populations were expanded by Myc whereas the activity of Hes1 was more specific to the DN3 population (Fig. 3E and S6A Fig.). Thymocytes overexpressing Hes1 or Myc were recovered and transplanted into secondary mice at the limiting dose of ∼1 CRU per mouse. Consistent with this limiting dose, the proportion of engrafted mice remained at 30% in the Gfp and Hes1 groups (Fig. 3F), suggesting that the frequency of pre-LSC was not modified by Hes1. Nonetheless, the total number of DN3 thymocytes recovered from these mice were modestly higher with Hes1. In contrast, Myc overexpression expanded the population of DN3 and 5 of 6 mice were reconstituted, indicative of increased pre-LSC frequency (Fig. 3F). Therefore, Myc expanded DN3 thymocytes and increased their self-renewal activities, thus recapitulating the activity of the Notch1 transgene. In comparison, Hes1 activity was mostly in DN3 expansion. Accordingly, thymocytes from Notch1tgSCLtgLMO1tg mice in which Hes1 levels were decreased by a Hes1-directed shRNA (S6B Fig., upper panel) exhibited two-fold decreased regenerative capacities compared to control cells expressing the empty vector (S6B Fig., lower panel). Moreover, the self-renewing DN and ISP8 populations were similarly decreased while DP cells that lacked self-renewal activity were unaffected (S6B Fig., lower panel). Therefore, Hes1 is required downstream of Notch1 as an expansion factor, whereas Myc controls both self-renewal activity and cell expansion.
In summary, our results indicate that Notch1 signal controls both Hes1 and Myc and determines the capacity of DN3 thymocytes to be reprogrammed by SCL-LMO1.
SCL-LMO1 upregulated a stem cell gene signature in DN3 thymocytes
To identify candidate genes that confer self-renewal capability to pre-leukemic DN3 thymocytes, we made use of the Cd3ε-deficient mouse model in which oncogene-induced self-renewal activity was unaltered (Fig. 4A). We compared gene expression profiles of thymocytes from SCL-LMO1 transgenic and age-matched non transgenic Cd3ε-/- mice, taken three weeks after birth. At this time point, the transcriptome analysis identified only 53 up-regulated and 33 down-regulated genes in SCL-LMO1 expressing thymocytes (S3 Table), indicating that the gene expression programs in the two cell types were comparable. We compared this list of differentially expressed genes with the genome binding profiles of SCL and LMO2 in several hematopoietic cell lines identified from a compendium of ChIP-seq datasets [74]. Within the down-regulated genes, only three had SCL peaks (Cdc6, Cdkn1a and Slc4a1) and none are presumed LMO2 target. In contrast, 9 of the up-regulated genes are presumed direct SCL and LMO2 targets (S7A Fig. and S3 Table). These observations concur with the view that SCL together with LMO2 preferentially enhances transcription. We overlapped the SCL-LMO1 up-regulated gene set with a compendium of molecular signatures (http://discovery.hsci.harvard.edu/). We found a subset of genes that are frequent in stem cell and cancer signatures (S7B Fig. and S4 Table), that includes Hhex, Nfe2 and Lyl1. In particular, Lyl1 is associated with HSC and cancer cell signature (S7B Fig.) and controls HSC survival [34] (S7B Fig.; www.bonemarrowhsc.com).

Next, we applied gene set enrichment analysis (GSEA) to uncover transcription factor signatures enriched in SCL-LMO1 thymocytes, using a compendium of 55 ChIP-seq datasets representing 31 hematopoietic transcription factors from the HemoChIP project and others (see Materials and Methods). Surprisingly, the LYL1 signature was the most up-regulated in SCL-LMO1-expressing DN3 thymocytes (Fig. 4B). Significantly, GSEA analysis also detected an up-regulated signature of SCL transcriptional partners, GATA2, LMO2, LDB1, ETO2 and SCL, together with LYL1 and RUNX1-bound genes [75]. On the other hand, NOTCH1 signature was not significantly enriched in this gene set, concurring with the view that SCL-LMO1 and Notch1 operate in parallel pathways. Furthermore, all LYL1-bound genes are comprised within the SCL-LMO1-bound gene set (S7A Fig., right panel). Overall, our transcriptome analysis predicted a hierarchy downstream of SCL-LMO1 in which Lyl1 could coordinate a Notch1-independent self-renewal network (Fig. 4C).
By ChIP analysis, we found that SCL occupancy of the Lyl1 locus in SCL-expressing DN cells (+ SCL) induced a 2 - to 4-fold higher LMO1 binding to the Lyl1 promoter compared to control cells (-SCL) (Fig. 4D). Finally, we observed by qRT-PCR that Lyl1 expression was significantly up-regulated by SCL-LMO1 (Fig. 4E), concurring with our microarray results. In contrast, the Notch1 oncogene did not modify Lyl1 expression in DN3 thymocytes expressing or not SCL-LMO1 (Fig. 4E).
We conclude that SCL and LMO1 induce aberrant stem cell gene expression in DN3 thymocytes and reprogram these cells to acquire stem cell-like properties.
Inhibition of E protein is insufficient for leukemogenesis
SCL activates or represses gene expression, depending on its protein partners (reviewed in [76]). Transcription activation critically depends on direct SCL-LMO1 or -LMO2 interaction to assemble a transcription complex on DNA [36], [37]. This interaction is dispensable for transcription inhibition of E protein targets, which is directly attributed to SCL interaction with E2A or HEB.
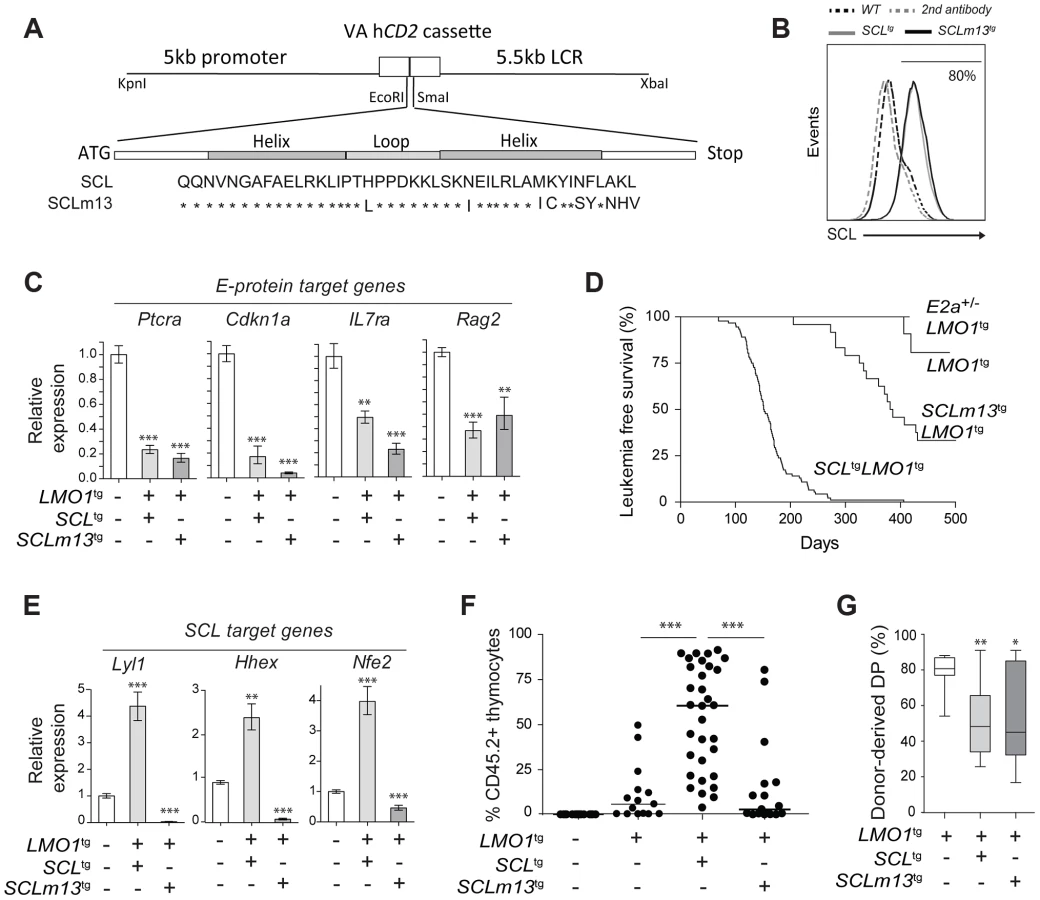
In particular, GSEA analysis indicated that E2A-presumed targets were not enriched within the list of differentially expressed genes (S8A Fig.), suggesting that inhibition of E2A activity by SCL-LMO1 in DN3 thymocytes was not a major perturbation at the molecular level. We designed the SCLm13 that is specifically defective in LMO1/2 binding while heterodimerization with E2A/HEB was unaffected [37] (S8B Fig.). Compared to wild type SCL, SCLm13 failed to activate the transcription of Lyl1 in transient assays whereas inhibition of E protein activity remained intact (S8C Fig.). We previously identified Ptcra as a direct target of HEB/E2A that is inhibited by SCL [46]. We therefore stably introduced SCL and SCLm13 in the DN cell line AD10 and found that both genes inhibited the expression of Ptcra to the same extent, indicating that direct SCL-LMO1/2 interaction was dispensable for inhibition of E proteins (S8D Fig.).
E proteins are major cell fate deteminants in the thymus [77], [78], leading to the current view that T-ALL induction by SCL-LMO1/2 is due to E protein titration and inhibition [47]. To directly address the question whether the inhibition of E2A by SCL-LMO1 was sufficient for leukemogenesis, we generated transgenic mice expressing wild type SCL or the SCLm13 mutant at comparable levels (Fig. 5A–B). We observed that SCLm13 fully retained its capacity to inhibit the expression of E protein target genes in DN3 thymocytes (Fig. 5C). Significantly, while SCLm13 still inhibited E proteins (S8D Fig.), there was a striking difference between the survival curves of SCLtgLMO1tg and SCLm13tgLMO1tg transgenic lines (Fig. 5D). LMO1tg mice develop T-ALL with 20% penetrance and delayed onset at 400 days, as reported [39]. In contrast, the disease was fully penetrant in SCLtgLMO1tg mice, with an accelerated onset of 170 days [17], [40]. In SCLm13tgLMO1tg mice however, leukemia onset was delayed to 380 days and the penetrance reduced to 65% (Fig. 5D), underscoring the importance of SCL-LMO1 interaction in leukemogenesis. To further address the question whether the genetic collaboration between SCL and LMO1 in leukemogenesis was due to inhibition of E proteins, we generated E2a+/-LMO1tg mice. Loss of one E2a allele significantly decreased expression levels of E2A target genes in DN thymocytes (S8E Fig.) but did not mirror the collaboration of the SCL transgene with LMO1 to induce T-ALL. Together, our results indicate that inhibition of E2A is insufficient for leukemogenesis and that direct SCL-LMO1 interaction is an important determinant of leukemia onset and disease penetrance.
Transcription activation by SCL-LMO1 is required for thymocyte reprogramming
We next addressed the question whether direct SCL-LMO1 interaction is required for self-renewal activity in DN3 thymocytes. The m13 mutation severely impaired the activation of self-renewal genes including Lyl1 (Fig. 5E) and drastically decreased the capacity of total thymocytes (Fig. 5F) or purified DN3 thymocytes (S9A Fig.) to reconstitute the thymus of transplanted hosts. Thymic engraftment of SCLm13tgLMO1tg thymocytes were reproducibly decreased to levels observed with LMO1tg only. Nonetheless, SCLm13 retained the same capacity as SCL to block the DN to DP transition compared to LMO1 alone (Fig. 5G and S9B Fig.), a transition stage controlled by E2a and Heb gene dosage [79], [80]. Together, our results indicate that inhibition of E protein and thymocyte differentiation blockade are distinct from the acquisition of self-renewal activity, which requires direct SCL-LMO1 interaction and transcription activation of a self-renewal program.
Lyl1 can substitute for SCL to collaborate with LMO1 and reprogram thymocytes
Network analysis point to the importance of Lyl1 downstream of SCL-LMO2 (Fig. 4C), consistent with published results [61]. Yet, ectopic expression of Lyl1 on its own did not recapitulate LMO2-induced aberrant self-renewal in thymocytes [9]. We reasoned that LYL1 activity most likely requires interaction with LMO1/2 for the following reasons: (i) the SCL interaction interface with LMO1/2 is conserved in LYL1 [36]; (ii) LYL1 is in complex with SCL and LMO2 [81]; (iii) LYL1 binding to DNA often overlaps with SCL and LMO2 binding [75]; and (iv) Lyl1 is redundant with Scl in controlling HSC self-renewal [34]. We therefore generated LYL1tgLMO1tg mice to address the question whether LYL1 enhances LMO1 self-renewal activity. LYL1 enhanced by 3-fold the activity of LMO1 on thymocyte engraftment (compare Fig. 6A, left panel and Fig. 5F), whereas LYL1 alone did not reprogram thymocytes as expected. Similar to SCL-LMO1, LYL1-LMO1 expanded DN3 cells only after transplantation (Fig. 6A, right panel and S10 Fig.) and this expansion was in the same order of magnitude compared to the inactive SCLm13-LMO1 (Fig. 6B). The virtual convergence of SCL-LMO2 and LYL1-LMO2 target genes (Fig. 4C) may explain the capacity of LYL1-LMO1 to mimic SCL-LMO1 in DN3 thymocytes (Fig. 6A–B).

By RNA-Seq of 12 T-ALL patient samples, we found that LYL1 and HHEX mRNA levels are highly correlated with LMO2 levels (r = 0.8, Fig. 6C), concurring with the view that LYL1 and HHEX are downstream targets of LMO2 in T-ALL.
Interestingly, LYL1 expression in the absence of TAL1 was found in 4 of 12 samples but TAL1 expression was never found in the absence of LYL1 (Fig. 6C). These observations concur with the view that TAL1 is upstream of LYL1 (Fig. 4C–E) and with the essential role of Lyl1 in pre-thymic progenitors as well as in ETP-DN2 [82]. Moreover, the absence of correlation between TAL1 and LMO2 mRNA levels are consistent with the observations that LYL1, but not TAL1, is essential for LMO2-induced T-ALL [61].
We observed higher LYL1, LMO2, HHEX and MEF2C levels in ETP and pro-T ALL in adult (Fig. 6C) and pediatric (S11 Fig. [38]) T-ALL, consistent with this gene triad being direct targets of activation by MEF2C [83]. Nonetheless, LYL1 and LMO1/2 expression was detected in a majority of T-ALL samples independently of MEF2C or of phenotypic classification and included TLX1/3 - and HOXA9-expressing leukemias (Fig. 6C and S11 Fig.). These observations suggest that the molecular pathways controlling self-renewal described here is not limited to T-ALL samples harboring TAL1 or LMO1/2 translocations but may be relevant to other oncogenic subtypes of T-ALL.
Discussion
Self-renewal as an initiating event in leukemia
Self-renewal is a mandatory trait of cancer stem cells as drivers of clonal expansion and evolution through layers of selective pressure [7]. This self-renewal activity is essential for long-term propagation. We now provide evidence that self-renewal is an initiating event triggered by the reactivation of stem cell genes in thymocytes (Fig. 7A), as exemplified by chromosomal translocations driving ectopic SCL, LYL1 or LMO1/2 expression in thymocytes. Our data indicate that LYL1 coordinates a self-renewal network downstream of SCL-LMO1 to reprogram thymocytes with a finite life span into self-renewing pre-LSCs. Importantly, these self-renewal genes require the high levels of physiological NOTCH1 in DN3 thymocytes for expressivity. Their activities are therefore modulated by the thymic mircroenvironment. Furthermore, the Notch1 oncogene is devoid of intrinsic self-renewal activity but dramatically enhances SCL-LMO1 activity by conferring a proliferative advantage to SCL-LMO1-primed pre-LSCs and by recruiting all immature thymocytes into division to expand the pool of pre-LSCs (Fig. 7B). Consequently, the hyperactive NOTCH1 allele acts as a strong enhancer of SCL-LMO1 by conferring additional fitness traits to SCL-LMO-initiated pre-LSCs, and allows for escape from envrironmental signals.

Transcription activation by SCL-LMO1: reprogramming DN3 thymocytes into self-renewing pre-LSCs
LMO2 interaction with SCL has several consequences. First, interaction with SCL protects LMO1/2 from proteasomal degradation [37]. Second, SCL brings LMO2 to DNA, with two possible outputs: transcription activation or transcription inhibition. E proteins are major drivers of thymocyte development by activating gene expression programs that control cell survival, cell cycle and T-cell differentiation. In particular, SCL-LMO1 inhibit E protein activity and thymocyte differentiation [46], [47], leading to the current view that SCL-LMO1/2 induced T-ALL is due to E protein inhibition [47]. We bring several lines of evidence to indicate that the inhibition of E proteins is not the major cause of T-ALL. First, within the differentially expressed gene set in SCL-LMO1 DN3 thymocytes, we found a significant enrichment for binding by all SCL transcriptional partners, whereas E2A binding was not enriched. Second, removal of one E2a allele did not collaborate with LMO1 to induce T-ALL even though E2a was haploinsufficient for target gene expression. Third, we show that inhibition of E protein activity by the SCLm13 mutant did not enhance LMO1 self-renewal activity, resulting a dramatically decreased leukemogenic activity compared to wild type SCL, as assessed by decreased penetrance and increased latency. The modest enhancement of LMO1 in T-ALL induction by SCLm13 remains compatible with a tumor suppressor function for E proteins [47]. Therefore, the interaction of LMO1 with SCL, which is required to assemble a transcriptionally active complex on DNA [37], is an important determinant of T-ALL development due to the reactivation of stem cell genes in DN3a thymocytes, during the pre-leukemic stage. By network analysis of the SCL-LMO1 transcriptome in DN3a thymocytes, we identified a hierarchy downstream of SCL-LMO1 which is controlled by Lyl1. Previous work indicated that Lyl1 is critical for the oncogenic functions of LMO2, consistent with a non-redundant function for Lyl1 in lymphoid progenitors and ETP [82]. This finding not mirrored by ectopic Lyl1 expression in the thymus [9] whereas Hhex deficiency [84] is mirrored by Hhex overexpression [9]. Considering that LYL1 and LMO2 chromosomal rearrangements were found simultaneously in a rare case of human T-ALL [85], we now report that LYL1 collaborates with LMO1 to reprogram DN3 thymocytes.
In summary, we provide genetic evidence that transcription activation by SCL and LMO1 is a major determinant of self-renewal in pre-LSCs and of the aggressiveness of T-ALL.
Notch1 as a strong enhancer of SCL-LMO1 that expands the pool of pre-LSCs
NOTCH signaling is essential for T-cell commitment and specification. In particular, NOTCH1 cooperates with the pre-TCR to control cell survival and proliferation at the DN to DP transition [14], at a critical checkpoint in the thymus. We previously showed that pre-TCR activity at the DN3 stage is required for the acquisition of Notch1 mutations in SCLtgLMO1tg thymocytes [17]. Once mutated, these hyperactive Notch1 alleles are sufficient to drive progression to T-ALL in concert with SCL-LMO1. Therefore, the pre-TCR is a strong determinant of leukemia onset and of disease penetrance. Strikingly, we show here that the initiating event of reprogramming DN3 thymocytes into self-renewing pre-LSCs by SCL-LMO1 is independent of the pre-TCR but requires NOTCH1 signal. Taken together, our observations indicate that the pre-TCR is a collaborating event in disease progression but dispensable for the initial transition from DN3 cells to pre-LSCs. In contrast, we show that high levels of physiologic Notch signals in DN3 cells were required for SCL-LMO1 reprogramming activity.
Functional studies of the NOTCH1 oncogene at time of overt leukemia in both human [21], [22] and murine LSCs [23], [86], [87] showed that NOTCH1 controls leukemia initiating cell activity. In contrast, the role NOTCH1 in HSC self-renewal was controversial [30], [88], [89]. Using the mouse model as a unique opportunity to specifically understand initiating events in T-ALL, we unexpectedly found that a hyperactive NOTCH1 allele is devoid of intrinsic reprogramming activity in thymocytes, suggesting that weaker leukemia-associated Notch1 alleles [30] also lack this activity, similar to Notch3 [9]. Instead, high levels of NOTCH1 activity sensitize target cells to the reprogramming activity of SCL and LMO1. Indeed, supraphysiologic NOTCH signaling was required past the DN3 stage, when physiologic NOTCH activity fell sharply. Therefore, our work provides a distinct conceptual framework to grasp the significance of the frequent co-occurrence of NOTCH1 gain of function mutations with major classes of oncogenic transcription factors in T-ALL.
Multiple genetic interactions have been described for Notch1 [26], [27], [90] (reviewed in [91]). Similar to Notch1, Hes1 also drives T-cell development and inhibits alternate fates [92]. Interestingly, the conditional invalidation of Hes1 in adult hematopoietic cells led to T-cell defects and disrupted T-ALL maintenance [24]. Whether Hes1 contributes to oncogenic reprogramming of thymocytes at the initiation of the disease remained to be addressed. Here, we show that the hyperactive Notch1 allele upregulates Hes1 by 4-fold in DN3 thymocytes, which was insufficient for thymocyte self-renewal in vivo and required co-expression of the SCL-LMO1 oncogenes.
Myc is required for the correct balance between self-renewal and differentiation of normal HSCs. Indeed, enforced Myc expression leads to HSC exhaustion whereas Myc deficiency results in increased HSC pool and self-renewal [93]-[95]. Our analysis of the Immgen data set indicates that MYC target genes but not Myc mRNA levels correlate with NOTCH1 activity during normal differentiation. This indicates additional levels of regulation; in particular MYC proteins are regulated by the ubiquitin ligase FBW7 in HSCs [96], which is frequently mutated in T-ALL patients [97]. These observations point to the critical importance of regulating MYC levels in thymocytes. MYC is a well-documented target of NOTCH1 in leukemogenesis [27]. Furthermore, Myc promotes fibroblast reprogramming into induced pluripotent stem cells [98]. We now show that ectopic Myc expression in thymocytes recapitulates the activity of the Notch1 transgene to enhance thymocyte reprogramming by SCL-LMO1. Our observations on the role of Notch1-Myc as an enhancer of SCL-LMO1 shed light on the pathway through which the BET-bromodomain inhibitors (JQ1) that inhibited Myc could decrease the growth of primary leukemic cells, i.e. most likely due to interference with the NOTCH1 pathway [87], [99], [100]. Finally, our observations on the primordial role of Myc over Hes1 in substituting for NOTCH1 signals is consistent with the model of feed-forward-loop activated by NOTCH1 and MYC that promotes leukemic cell growth [29].
Therefore, our work clarifies the important role of Notch1-Hes1/Myc in the thymus as enhancers of self-renewal, but not as oncogenes with reprogramming activity. The Scl and Lmo2 genes [46] are silenced in DN3 thymocytes by a repressive histone mark [13]. We therefore surmised that chromosomal translocations or retroviral integration upstream of the LMO2 locus observed in pediatric T-ALL overcome these repressive marks to cause ectopic expression of oncogenes such as LYL1, SCL and LMO2 which, in the context of DN3 thymocytes, collaborate with NOTCH1-HES1/MYC to confer aberrant self-renewal to these cells. We therefore propose a model in which SCL-LMO1-Lyl1 and Notch1-Hes1 are complementary in thymocyte reprogramming (Fig. 7B).
Oncogenic reprogramming sets a pre-leukemic state by enabling self-renewal
Phenotypic plasticity or lineage infidelity is often observed in cancer [101]. A recent report indicates that phenotypic plasticity predisposes reprogrammed fibroblasts to express stem cell characteristics and to induce tumors in nude mice [102]. In contrast, we show here that pre-leukemic stem cells conserve their DN3 phenotype through three rounds of transplantation and that the acquisition of self-renewal as an essential stem cell characteristic can occur in the absence of phenotypic plasticity. Therefore, our data indicate that phenotype plasticity is not an essential premise for oncogenic reprogramming whereas self-renewal is a mandatory trait [7].
The cell of origin of T-ALL was inferred from the phenotype of the leukemic cells [38], or of LICs which was closer to the phenotype of a T-cell progenitor [22], [103]. Nonetheless, LICs. have evolved through several selective constraints and acquired additional complexity and are defined as cells that produce an overt invasive leukemia. Here we define the cell of origin of T-ALL and the mechanisms by which oncogenes reprogram normal thymocytes. We bring evidence that the activation of a self-renewal program requires collaboration between several genes and incoming environmental signals, which is likely to determine the nature of the cell of origin of leukemia. Thus, SCL, LYL1 or Notch1 are not endowed with intrinsic reprogramming activity. Both SCL and LYL1 strongly enhanced LMO1 self-renewal activity in DN3 thymocytes due to higher endogenous NOTCH1. Furthermore, the combination of three oncogenes, Notch1, SCL and LMO1 had the strongest effect on self-renewal. Therefore, our data provide new mechanistic insights into the original two-hit model of cell transformation. Instead of each oncogene acting independently as a master switch in leukemia initiation, our work argues for the coincidence detection model in which biological outputs depend on the simultaneous occurrence of multiple signals within a network. Such cooperativity governs the process of self-renewal in pre-LSCs, which is an initiating event in T-ALL.
High LYL1 and LMO2 expression in T-ALL was previously associated with immature or ETP-ALL [38], [83], [104]. While TAL1 expression in T-ALL was linked with a late cortical stage of T cell differentiation on the basis of cell surface markers [38] or whole transcriptome [104], we provide cellular and genetic evidence that the initiating events occur in earlier stages in which NOTCH1 signals are highest, i.e. at the DN2b to DN3a transition, and that the Cd3ε gene is dispensable. These observations prompted us to examine the transcriptome of human adult T-ALL (Leucegene-IRIC) [105] and pediatric T-ALL [38]. This analysis also revealed that LYL1 and LMO2 were high in ETP and pro-T ALL but were detectable in almost all samples, suggesting that the molecular network defined in our study might operate in most T-ALL [106]. The importance of the SCL-LMO1 interaction described here for pre-LSC self-renewal activity, combined with the molecular view of this interaction interface suggests that targeting SCL-LMO interaction might represent a novel and promising therapeutic avenue. Such approach will be applicable to LYL1-LMO2 since the residues interacting with LMO2 are conserved between SCL and LYL1.
Materials and Methods
Mice and ethics statement
All animals were maintained in pathogen-free conditions according to institutional animal care and guidelines set by the Canadian Council on Animal Care. Our protocol entitled “T-cell acute lymphoblastic leukemia induced by the SCL oncogene” was approved by the Ethics Committee of experimentation on animals of the University of Montreal, CDEA (Comité de d?ontologie de l'expérimentation sur les animaux).
Transgenic mice were previously described: pSil-TSCL (SCLtg) [40], Lck-LMO1 (LMO1tg) and Lck-NotchIC9 (Notch1tg) (NIAID/Taconic Repository Bethesda), E2a+/- [107], Lck-LYL1 (LYL1tg) (International Mouse Strain Resource), Transgenic Notch Reporter (TNRtg) (Tg(Cp-EGFP)25Gaia, The Jackson Laboratory, Maine, United States) and Cd3ε-/- [108]. Mice cohorts were generated by cross-breeding. Their genotypes were verified by PCR. The gene encoding the short isoform (p22) of wild-type and m13 mutant [37] SCL protein was amplified by PCR using the following primers: 5′-GCGCGAATTCATGGAGATTACTGATGGT-3′ and 5′-TATACCCGGGTCACCGAGGGCCG-GCTCC-3′. These fragments were digested with EcoRI and SmaI and subcloned in Cd2-VA minigene construct (gift from Dr Dimitris Kioussis, National Institute for Medical Research, London, UK) [109], [110]. DNA was microinjected into the pronucleus of C57BL6 mice by IRIC Transgenesis Core Facility, University of Montreal. Transgenic mice were backcrossed into the C57BL6 background for more than 10 generations.
Transplantation assay
Pre-leukemic thymocytes from donor mice (CD45.2+) are transplanted intravenously into sub-lethally irradiated (600cGy) recipient mice (CD45.1+). Thymic chimerism in the T-lineage (Thy1.2+) was analysed by flow cytometry (FACS) and illustrated by the percentage of donor-derived cells (% CD45.2+) found in the recipient thymus.
Limiting dilution assays
Pre-leukemic thymocytes from SCLtgLMO1tg and Notch1tgSCLtgLMO1tg mice were transplanted into sub-lethally (600 cGy) irradiated hosts (CD45.1+) at various cell doses (107, 106, 105, 104, 103, and 102) per recipient mouse (n = 7 mice for each dose). Mice were scored positive when T-cell lineage reconstitution was more than 1%. Pre-leukemic stem cell (pre-LSC) frequency (Range pre-LSC ± Confidence Interval) and Competitive Re-populating Unit (CRU) frequency for the indicated genotypes were calculated by applying Poisson statistics using the Limiting Dilution Analysis software (Stem Cell Technologies). The same strategy was used to compare the pre-LSC frequencies of DN3 SCLtgLMO1tg and Cd3ε-/-SCLtgLMO1tg thymocytes. The mean activity of pre-leukemic stem cells (MAS) is calculated according to the Harrison formula [111], [112]. MAS represent the pre-LSC potential of approximately 1 CRU: MAS = [RU]/[CRU] where RU represents the re-populating activity of pre-LSC and CRU was determined by limiting dilution analysis as above. RU was calculated as previously described [33]. Since the number of competitor cells corresponds to the number of cells in the thymus of sub-lethally irradiated recipient mice, the formula was applied as follows: RU = [number of donor-derived cells]/[number of competitor host cells in recipient mouse thymus].
In vivo competitive assay
Pre-leukemic Cd3ε-/-Notch1tgSCLtgLMO1tg thymocytes (CD45.2+ GFP-) from one-week-old mice were mixed with Cd3ε-/-GfptgSCLtgLMO1tg competitor thymocytes (CD45.2+ GFP+) in two ratios (1∶1 and 1∶20) at the indicated cell doses in Fig. 2D and S4C Fig. Mixed cells were then transplanted in irradiated hosts (CD45.1+). Thymic reconstitution by transplanted cells was assessed by FACS analysis 3 weeks post-transplantation.
Immunostaining and FACS analysis
Single-cell suspensions were prepared from thymi of mice of the indicated ages and genotypes. Immunostaining was done as previously described [46]. All antibodies used for flow cytometry analysis were from Pharmingen (BD Biosciences, Mississauga, Ontario, Canada): CD44 (IM7), CD25 (PC61.5), CD4 (RM4-4), CD8 (53-6.7), Thy1.2 (30-H12) and CD24 (30-F1). Dead cells were excluded by propidium iodide staining. FACS, cell cycle and cell division analysis were performed on a LSRII cytometer (BD Biosciences) using DIVA (BD Biosciences) and ModFit LT (Verity Software House, Topsham, Maine, United States) software.
Nuclear SCL labeling
For nuclear SCL labeling, thymocytes were fixed and permeabilized with Fixation/Permeabilization Solution Kit and washed 3 times with Perm/Wash buffer (BD Cytofix/Cytoperm, 554714; BD Biosciences, Mississauga, Ontario, Canada). The cells were then labeled with the monoclonal anti-human SCL BTL73 [113] at 1∶10 dilution, washed extensively with PBS, followed by a goat anti-mouse antibody coupled to FITC. The antibody was a generous gift from Danièle Mathieu-Mahul (Institut de Génétique Moléculaire, Montpellier, France).
Co-culture conditions
Pre-leukemic cells were purified by FACS from transgenic mice and co-cultured on (GFP-positive) OP9 and OP9-DL1 stromal cell lines, as described previously [66]. Briefly, pre-leukemic cells were co-cultured on OP9 and OP9-DL1 cells in reconstituting a-MEM medium (12561, Gibco, Life Technologies, Burlington, Ontario, Canada) supplemented with 10% FBS (12318, Gibco), HEPES 10 mM (15630-080, Gibco), sodium pyruvate 1 mM (11360-070, Gibco), b-mercaptoethanol 55 µM (21985-023, Gibco), glutamax 2 mM (15750-060, Gibco), penicillin/Streptomycin (15140-122, Gibco), 5 ng/mL FLT-3 Ligand (308-FK, R&D system) and 5 ng/mL IL-7 (407-ML, R&D system). Medium was half changed twice per week and the cells were counted and phenotyped by FACS after co-culture.
T-cell activation assay
T-cell stimulation was assessed using anti-CD3/CD28 beads as previously described [114]. Briefly, engrafted SCLtgLMO1tg pre-leukemic T cells (donor thymocytes) and host thymocytes were purified by FACS and co-cultured on a OP9-DL1 stromal cell line over 3 days with anti-CD3/CD28 beads (Dynabeads Mouse T-Activator CD3/CD28, 114.52D, Invitrogen, Life Technologies, Burlington, Ontario, Canada). The expression of the activation marker CD69 (H1.2F3, eBioscience, San Diego, California, United States) was then analyzed by flow cytometry at the surface of SP4 and SP8 cells. Host B cells purified from the spleen were used as a negative control.
Cell cycle assay
DN3 thymocytes from WT, SCLtgLMO1tg, Notch1tg and Notch1tgSCLtgLMO1tg mice were purified by FACS and co-cultured on OP9-DL1 stromal cell line during 3 days. Derived-thymocytes were immunostained with T cell markers and then fixed and permeabilized (CytofixCytoperm Plus, BD Bioscience) during 30 minutes before the staining with the Ki67-FITC antibody. The DAPI was added at the end of the staining as a marker of DNA content. Cycle cycle analysis of DN3 thymocytes was finally analysed by FACS.
Microarray analysis
RNAs collected from Cd3ε-/- and Cd3ε-/-SCLtgLMO1tg thymocytes were amplified and hybridized onto Affymetrix Mouse Genome 430A 2.0 arrays (Ottawa Genome Centre, Ottawa, Ontario, Canada). Raw data pre-processing and differential expression analysis was carried out using Bioconductor packages in the R environment, according to the following pipeline: (i) probesets were summarized and normalized using the RMA procedure implemented in the Affy package [115]; (ii) absent/present probesets were detected using the MAS5 implementation of the Affy package, and probesets deemed absent in both conditions (Cd3ε-/- and Cd3ε-/-SCLtgLMO1tg) were removed from downstream analysis; and (iii) detection of differentially expressed genes was carried out using the Rank Products package [116].
Collection and analysis of ChIP-Seq datasets
We collected genome-wide chromatin occupancy data for 31 hematopoietic transcription factors (51 ChIP-seq experiments in total) from Wang et al [68] and the HemoChIP project [74]. NOTCH1-binding peaks in G4A2 and T6E murine cell lines were computed using the Galaxy tool, according to the following steps: (i) sequence reads were mapped to the mouse genome mm9 using Bowtie with default parameters (maximum 2 mismatches); and (ii) peak coordinates were determined by the MACS tool, using the Pvalue cutoff <10–9. Peak coordinates for the HemoChIP dataset mapped to the mouse genome mm9 were downloaded from http://hscl.cimr.cam.ac.uk/ChIP-Seq_Compendium/ChIP-Seq_Compendium2.html. Finally, all peaks were associated to their closest transcription start sites in the mouse genome using PeakAnalyzer v.1.4 tool [117]. Gene lists bound by transcription factors used in downstream analyses (Figs. 4A, 5D, 6A) included only those genes containing at least one binding site for the given regulator within the proximal promoter (2 kb region around the transcription start site).
RT-qPCR
Total RNAs were prepared from 50,000 purified cell population cells from 1-week-old mice using RNeasy extraction kit (Qiagen, Mississauga, Ontario, Canada). First strand cDNA syntheses were performed by reverse transcription as described [46]. Primer sequences are listed in S5 Table. Real-time quantitative PCR was done with SYBR Green Master Mix (Applied Biosystems, Foster City, California, United States) on Stratagene Mx3000 apparatus (Stratagene, La Jolla, California, United States). ΔΔCt values were calculated using Ct values from β-actin gene as reference.
ChIP assays
The DN thymoma cell line AD10.1 [46] was cultured in IMDM (Invitrogen, Burlington, Ontario, Canada) containing 10% inactivated foetal calf serum (FSC) and 50 µM β-mercaptoethanol. The parental cell line was retrovirally transduced with MSCV empty vector or MSCV-SCL-expressing vector, and stable transfectants were kept under neomycin selection (1 mg/mL). Chromatin immunoprecipitation were performed as described previously [118] using the following antibodies: anti-SCL mouse monoclonal antibodies BTL73 (generously provided by Dr. D. Mathieu-Mahul, Institut de Génétique Moléculaire, Montpellier, France), rabbit anti-LMO1 (Bethyl Laboratories, A300-314A; Cedarlane Laboratories, Burlington, Ontario, Canada), and anti-rabbit IgG (Sigma, St-Louis, Missouri, United States). Oligonucleotide sequences used for promoter amplification are shown in S5 Table.
Gene transfer into bone marrow cells
Gene transfer into bone marrow cells from 1-week-old pre-leukemic Notch1tgSCLtgLMO1tg mice was performed essentially as previously described [119]. Bone marrow cells were depleted of lineage positive cells through immunomagnetic bead cell separation (LIN-) and plated in suspension culture in IMDM with 15% FCS, 100 ng/mL murine Steel Factor (SF), 10 ng/mL human IL-6, 100 ng/ml human IL-11 and 5 ng/mL murine IL-3, at a concentration of 1×10⁶ cells/mL. All cytokines were produced as COS cell supernatants and were calibrated against recombinant standards. For the over-expression of Hes1 and c-Myc, LIN- cells were overlaid on irradiated (1500 cGy) virus producing GP+E-86 cells contenaining the MSCV-GFP or –Hes1 or c-Myc in the presence of 0.8 µg/mL of polybrene (Sigma Aldrich) for 48h. For the down-regulation of Hes1, LIN- cells were infected using lentiviral vectors containing either non-targeting shCTL or shHes1 (Sigma, TRCN0000028854; St. Louis, Missouri, United States) for 48 h. Following infection, cells were selected for 2 d with puromycin (1.5 µg/ml) and transplanted into irradiated CD45.1 hosts.
Transcriptome sequencing of T-ALL patient samples
11 T-ALL samples were collected by the Quebec Leukemia Cell Bank with informed consent. The project was approved by the Research Ethics Board of the Maisonneuve-Rosemont Hospital and Université de Montréal. These samples include the complete array of phenotypic T-ALL, ranging from ETP (1 sample) to cortical T (3 samples), as previously published [105]. Transcriptome libraries were generated from 4 µg total RNA. Sequence data obtained by paired-end sequencing (2×100 bp, Illumina HiSeq2000) were mapped to the mouse reference genome and analyzed as reported. RNA-seq yielded 15 Gb of mapped reads per sample, with an average of 15.2 reads per kilobase per million (RPKM). Data were log2 transformed and normalized between samples. RPKM values are taken as measures of the relative molar RNA concentration for each set of transcript. Correlation coefficients calculated for LMO2 are shown in Fig. 6C.
Additional details for clonality analysis, co-immunoprecipitation, Luciferase assays and Notch1 sequencing are provided in S1 Protocol.
Supporting Information
Zdroje
1. LapidotT, SirardC, VormoorJ, MurdochB, HoangT, et al. (1994) A cell initiating human acute myeloid leukaemia after transplantation into SCID mice. Nature 367 : 645–648.
2. ValentP, BonnetD, WohrerS, AndreeffM, CoplandM, et al. (2013) Heterogeneity of neoplastic stem cells: theoretical, functional, and clinical implications. Cancer Res 73 : 1037–1045.
3. BonnetD, DickJE (1997) Human acute myeloid leukemia is organized as a hierarchy that originates from a primitive hematopoietic cell. Nat Med 3 : 730–737.
4. JordanCT (2009) Cancer stem cells: controversial or just misunderstood? Cell Stem Cell 4 : 203–205.
5. Vicente-DuenasC, Romero-CamareroI, CobaledaC, Sanchez-GarciaI (2013) Function of oncogenes in cancer development: a changing paradigm. EMBO J 32 : 1502–1513.
6. NguyenLV, VannerR, DirksP, EavesCJ (2012) Cancer stem cells: an evolving concept. Nat Rev Cancer 12 : 133–143.
7. GreavesM, MaleyCC (2012) Clonal evolution in cancer. Nature 481 : 306–313.
8. KrivtsovAV, TwomeyD, FengZ, StubbsMC, WangY, et al. (2006) Transformation from committed progenitor to leukaemia stem cell initiated by MLL-AF9. Nature 442 : 818–822.
9. McCormackMP, YoungLF, VasudevanS, de GraafCA, CodringtonR, et al. (2010) The Lmo2 oncogene initiates leukemia in mice by inducing thymocyte self-renewal. Science 327 : 879–883.
10. HongD, GuptaR, AncliffP, AtzbergerA, BrownJ, et al. (2008) Initiating and cancer-propagating cells in TEL-AML1-associated childhood leukemia. Science 319 : 336–339.
11. BhandoolaA, SambandamA (2006) From stem cell to T cell: one route or many? Nat Rev Immunol 6 : 117–126.
12. MartinsVC, RuggieroE, SchlennerSM, MadanV, SchmidtM, et al. (2012) Thymus-autonomous T cell development in the absence of progenitor import. J Exp Med 209 : 1409–1417.
13. ZhangJA, MortazaviA, WilliamsBA, WoldBJ, RothenbergEV (2012) Dynamic transformations of genome-wide epigenetic marking and transcriptional control establish T cell identity. Cell 149 : 467–482.
14. CiofaniM, SchmittTM, CiofaniA, MichieAM, CuburuN, et al. (2004) Obligatory role for cooperative signaling by pre-TCR and Notch during thymocyte differentiation. J Immunol 172 : 5230–5239.
15. WengAP, FerrandoAA, LeeW, MorrisJPt, SilvermanLB, et al. (2004) Activating mutations of NOTCH1 in human T cell acute lymphoblastic leukemia. Science 306 : 269–271.
16. O'NeilJ, CalvoJ, McKennaK, KrishnamoorthyV, AsterJC, et al. (2006) Activating Notch1 mutations in mouse models of T-ALL. Blood 107 : 781–785.
17. TremblayM, TremblayCS, HerblotS, AplanPD, HebertJ, et al. (2010) Modeling T-cell acute lymphoblastic leukemia induced by the SCL and LMO1 oncogenes. Genes Dev 24 : 1093–1105.
18. BigasA, EspinosaL (2012) Hematopoietic stem cells: to be or Notch to be. Blood 119 : 3226–3235.
19. KochU, LehalR, RadtkeF (2013) Stem cells living with a Notch. Development 140 : 689–704.
20. Chiang MY, Shestova O, Xu L, Aster JC, Pear WS (2012) Divergent effects of supraphysiological Notch signals on leukemia stem cells and hematopoietic stem cells. Blood.
21. ArmstrongF, de la GrangePB, GerbyB, RouyezMC, CalvoJ, et al. (2009) NOTCH is a key regulator of human T-cell acute leukemia initiating cell activity. Blood 113 : 1730–1740.
22. GerbyB, ClappierE, ArmstrongF, DeswarteC, CalvoJ, et al. (2011) Expression of CD34 and CD7 on human T-cell acute lymphoblastic leukemia discriminates functionally heterogeneous cell populations. Leukemia 25 : 1249–1258.
23. TatarekJ, CullionK, AshworthT, GersteinR, AsterJC, et al. (2011) Notch1 inhibition targets the leukemia-initiating cells in a Tal1/Lmo2 mouse model of T-ALL. Blood 118 : 1579–1590.
24. WendorffAA, KochU, WunderlichFT, WirthS, DubeyC, et al. (2010) Hes1 is a critical but context-dependent mediator of canonical Notch signaling in lymphocyte development and transformation. Immunity 33 : 671–684.
25. DudleyDD, WangHC, SunXH (2009) Hes1 potentiates T cell lymphomagenesis by up-regulating a subset of notch target genes. PLoS One 4: e6678.
26. D'AltriT, GonzalezJ, AifantisI, EspinosaL, BigasA (2011) Hes1 expression and CYLD repression are essential events downstream of Notch1 in T-cell leukemia. Cell Cycle 10 : 1031–1036.
27. WengAP, MillhollandJM, Yashiro-OhtaniY, ArcangeliML, LauA, et al. (2006) c-Myc is an important direct target of Notch1 in T-cell acute lymphoblastic leukemia/lymphoma. Genes Dev 20 : 2096–2109.
28. SteiningerA, MobsM, UllmannR, KochertK, KreherS, et al. (2011) Genomic loss of the putative tumor suppressor gene E2A in human lymphoma. J Exp Med 208 : 1585–1593.
29. PalomeroT, LimWK, OdomDT, SulisML, RealPJ, et al. (2006) NOTCH1 directly regulates c-MYC and activates a feed-forward-loop transcriptional network promoting leukemic cell growth. Proc Natl Acad Sci U S A 103 : 18261–18266.
30. ChiangMY, XuL, ShestovaO, HistenG, L'HeureuxS, et al. (2008) Leukemia-associated NOTCH1 alleles are weak tumor initiators but accelerate K-ras-initiated leukemia. J Clin Invest 118 : 3181–3194.
31. SwiersG, PatientR, LooseM (2006) Genetic regulatory networks programming hematopoietic stem cells and erythroid lineage specification. Dev Biol 294 : 525–540.
32. ReynaudD, RavetE, TiteuxM, MazurierF, ReniaL, et al. (2005) SCL/TAL1 expression level regulates human hematopoietic stem cell self-renewal and engraftment. Blood 106 : 2318–2328.
33. LacombeJ, HerblotS, Rojas-SutterlinS, HamanA, BarakatS, et al. (2010) Scl regulates the quiescence and the long-term competence of hematopoietic stem cells. Blood 115 : 792–803.
34. SouroullasGP, SalmonJM, SablitzkyF, CurtisDJ, GoodellMA (2009) Adult hematopoietic stem and progenitor cells require either Lyl1 or Scl for survival. Cell Stem Cell 4 : 180–186.
35. PorcherC, SwatW, RockwellK, FujiwaraY, AltFW, et al. (1996) The T cell leukemia oncoprotein SCL/tal-1 is essential for development of all hematopoietic lineages. Cell 86 : 47–57.
36. SchlaegerTM, SchuhA, FlitterS, FisherA, MikkolaH, et al. (2004) Decoding hematopoietic specificity in the helix-loop-helix domain of the transcription factor SCL/Tal-1. Mol Cell Biol 24 : 7491–7502.
37. LecuyerE, LariviereS, SincennesMC, HamanA, LahlilR, et al. (2007) Protein stability and transcription factor complex assembly determined by the SCL-LMO2 interaction. J Biol Chem 282 : 33649–33658.
38. FerrandoAA, NeubergDS, StauntonJ, LohML, HuardC, et al. (2002) Gene expression signatures define novel oncogenic pathways in T cell acute lymphoblastic leukemia. Cancer Cell 1 : 75–87.
39. McGuireEA, RintoulCE, SclarGM, KorsmeyerSJ (1992) Thymic overexpression of Ttg-1 in transgenic mice results in T-cell acute lymphoblastic leukemia/lymphoma. Mol Cell Biol 12 : 4186–4196.
40. AplanPD, JonesCA, ChervinskyDS, ZhaoX, EllsworthM, et al. (1997) An scl gene product lacking the transactivation domain induces bony abnormalities and cooperates with LMO1 to generate T-cell malignancies in transgenic mice. EMBO J 16 : 2408–2419.
41. LarsonRC, LavenirI, LarsonTA, BaerR, WarrenAJ, et al. (1996) Protein dimerization between Lmo2 (Rbtn2) and Tal1 alters thymocyte development and potentiates T cell tumorigenesis in transgenic mice. Embo J 15 : 1021–1027.
42. HsuHL, WadmanI, TsanJT, BaerR (1994) Positive and negative transcriptional control by the TAL1 helix-loop-helix protein. Proc Natl Acad Sci U S A 91 : 5947–5951.
43. ParkST, SunXH (1998) The Tal1 oncoprotein inhibits E47-mediated transcription. Mechanism of inhibition. J Biol Chem 273 : 7030–7037.
44. ChervinskyDS, ZhaoXF, LamDH, EllsworthM, GrossKW, et al. (1999) Disordered T-cell development and T-cell malignancies in SCL LMO1 double-transgenic mice: parallels with E2A-deficient mice. Mol Cell Biol 19 : 5025–5035.
45. YanW, YoungAZ, SoaresVC, KelleyR, BenezraR, et al. (1997) High incidence of T-cell tumors in E2A-null mice and E2A/Id1 double-knockout mice. Mol Cell Biol 17 : 7317–7327.
46. HerblotS, SteffAM, HugoP, AplanPD, HoangT (2000) SCL and LMO1 alter thymocyte differentiation: inhibition of E2A-HEB function and pre-T alpha chain expression. Nat Immunol 1 : 138–144.
47. O'NeilJ, ShankJ, CussonN, MurreC, KelliherM (2004) TAL1/SCL induces leukemia by inhibiting the transcriptional activity of E47/HEB. Cancer Cell 5 : 587–596.
48. MurreC (2005) Helix-loop-helix proteins and lymphocyte development. Nat Immunol 6 : 1079–1086.
49. KeeBL (2009) E and ID proteins branch out. Nat Rev Immunol 9 : 175–184.
50. HerblotS, AplanPD, HoangT (2002) Gradient of E2A activity in B-cell development. Mol Cell Biol 22 : 886–900.
51. GoardonN, SchuhA, HajarI, MaX, JouaultH, et al. (2002) Ectopic expression of TAL-1 protein in Ly-6E.1-htal-1 transgenic mice induces defects in B - and T-lymphoid differentiation. Blood 100 : 491–500.
52. RobbL, RaskoJE, BathML, StrasserA, BegleyCG (1995) scl, a gene frequently activated in human T cell leukaemia, does not induce lymphomas in transgenic mice. Oncogene 10 : 205–209.
53. KelliherMA, SeldinDC, LederP (1996) Tal-1 induces T cell acute lymphoblastic leukemia accelerated by casein kinase IIalpha. Embo J 15 : 5160–5166.
54. AifantisI, RaetzE, BuonamiciS (2008) Molecular pathogenesis of T-cell leukaemia and lymphoma. Nat Rev Immunol 8 : 380–390.
55. KimD, PengXC, SunXH (1999) Massive apoptosis of thymocytes in T-cell-deficient Id1 transgenic mice. Mol Cell Biol 19 : 8240–8253.
56. Van VlierbergheP, FerrandoA (2012) The molecular basis of T cell acute lymphoblastic leukemia. J Clin Invest 122 : 3398–3406.
57. OnoY, FukuharaN, YoshieO (1998) TAL1 and LIM-only proteins synergistically induce retinaldehyde dehydrogenase 2 expression in T-cell acute lymphoblastic leukemia by acting as cofactors for GATA3. Mol Cell Biol 18 : 6939–6950.
58. LecuyerE, HerblotS, Saint-DenisM, MartinR, BegleyCG, et al. (2002) The SCL complex regulates c-kit expression in hematopoietic cells through functional interaction with Sp1. Blood 100 : 2430–2440.
59. KusyS, GerbyB, GoardonN, GaultN, FerriF, et al. (2010) NKX3.1 is a direct TAL1 target gene that mediates proliferation of TAL1-expressing human T cell acute lymphoblastic leukemia. J Exp Med 207 : 2141–2156.
60. SandaT, LawtonLN, BarrasaMI, FanZP, KohlhammerH, et al. (2012) Core transcriptional regulatory circuit controlled by the TAL1 complex in human T cell acute lymphoblastic leukemia. Cancer Cell 22 : 209–221.
61. McCormack MP, Shields BJ, Jackson JT, Nasa C, Shi W, et al.. (2013) Requirement for Lyl1 in a model of Lmo2-driven early T-cell precursor ALL. Blood.
62. McMurrayHR, SampsonER, CompitelloG, KinseyC, NewmanL, et al. (2008) Synergistic response to oncogenic mutations defines gene class critical to cancer phenotype. Nature 453 : 1112–1116.
63. AshtonJM, BalysM, NeeringSJ, HassaneDC, CowleyG, et al. (2012) Gene sets identified with oncogene cooperativity analysis regulate in vivo growth and survival of leukemia stem cells. Cell Stem Cell 11 : 359–372.
64. Cancer Genome Atlas Research N (2013) Genomic and epigenomic landscapes of adult de novo acute myeloid leukemia. N Engl J Med 368 : 2059–2074.
65. Kalender AtakZ, GianfeliciV, HulselmansG, De KeersmaeckerK, DevasiaAG, et al. (2013) Comprehensive analysis of transcriptome variation uncovers known and novel driver events in T-cell acute lymphoblastic leukemia. PLoS Genet 9: e1003997.
66. SchmittTM, Zuniga-PfluckerJC (2002) Induction of T cell development from hematopoietic progenitor cells by delta-like-1 in vitro. Immunity 17 : 749–756.
67. TanJB, VisanI, YuanJS, GuidosCJ (2005) Requirement for Notch1 signals at sequential early stages of intrathymic T cell development. Nat Immunol 6 : 671–679.
68. WangH, ZouJ, ZhaoB, JohannsenE, AshworthT, et al. (2011) Genome-wide analysis reveals conserved and divergent features of Notch1/RBPJ binding in human and murine T-lymphoblastic leukemia cells. Proc Natl Acad Sci U S A 108 : 14908–14913.
69. AsterJC, PearWS, BlacklowSC (2008) Notch signaling in leukemia. Annu Rev Pathol 3 : 587–613.
70. DeneaultE, CellotS, FaubertA, LaverdureJP, FrechetteM, et al. (2009) A functional screen to identify novel effectors of hematopoietic stem cell activity. Cell 137 : 369–379.
71. RossiL, LinKK, BolesNC, YangL, KingKY, et al. (2012) Less is more: unveiling the functional core of hematopoietic stem cells through knockout mice. Cell Stem Cell 11 : 302–317.
72. SharmaVM, CalvoJA, DraheimKM, CunninghamLA, HermanceN, et al. (2006) Notch1 contributes to mouse T-cell leukemia by directly inducing the expression of c-myc. Mol Cell Biol 26 : 8022–8031.
73. KunisatoA, ChibaS, Nakagami-YamaguchiE, KumanoK, SaitoT, et al. (2003) HES-1 preserves purified hematopoietic stem cells ex vivo and accumulates side population cells in vivo. Blood 101 : 1777–1783.
74. HannahR, JoshiA, WilsonNK, KinstonS, GottgensB (2011) A compendium of genome-wide hematopoietic transcription factor maps supports the identification of gene regulatory control mechanisms. Exp Hematol 39 : 531–541.
75. WilsonNK, FosterSD, WangX, KnezevicK, SchutteJ, et al. (2010) Combinatorial transcriptional control in blood stem/progenitor cells: genome-wide analysis of ten major transcriptional regulators. Cell Stem Cell 7 : 532–544.
76. LecuyerE, HoangT (2004) SCL: from the origin of hematopoiesis to stem cells and leukemia. Exp Hematol 32 : 11–24.
77. IkawaT, KawamotoH, GoldrathAW, MurreC (2006) E proteins and Notch signaling cooperate to promote T cell lineage specification and commitment. J Exp Med 203 : 1329–1342.
78. MiyazakiK, MiyazakiM, MurreC (2014) The establishment of B versus T cell identity. Trends Immunol 35 : 205–210.
79. BainG, QuongMW, SoloffRS, HedrickSM, MurreC (1999) Thymocyte maturation is regulated by the activity of the helix-loop-helix protein, E47. J Exp Med 190 : 1605–1616.
80. ZhuangY, ChengP, WeintraubH (1996) B-lymphocyte development is regulated by the combined dosage of three basic helix-loop-helix genes, E2A, E2-2, and HEB. Mol Cell Biol 16 : 2898–2905.
81. DeleuzeV, El-HajjR, ChalhoubE, DohetC, PinetV, et al. (2012) Angiopoietin-2 is a direct transcriptional target of TAL1, LYL1 and LMO2 in endothelial cells. PLoS One 7: e40484.
82. ZohrenF, SouroullasGP, LuoM, GerdemannU, ImperatoMR, et al. (2012) The transcription factor Lyl-1 regulates lymphoid specification and the maintenance of early T lineage progenitors. Nat Immunol 13 : 761–769.
83. HommingaI, PietersR, LangerakAW, de RooiJJ, StubbsA, et al. (2011) Integrated transcript and genome analyses reveal NKX2-1 and MEF2C as potential oncogenes in T cell acute lymphoblastic leukemia. Cancer Cell 19 : 484–497.
84. SmithS, TripathiR, GoodingsC, ClevelandS, MathiasE, et al. (2014) LIM Domain Only-2 (LMO2) Induces T-Cell Leukemia by Two Distinct Pathways. PLoS One 9: e85883.
85. HommingaI, VuerhardMJ, LangerakAW, Buijs-GladdinesJ, PietersR, et al. (2012) Characterization of a pediatric T-cell acute lymphoblastic leukemia patient with simultaneous LYL1 and LMO2 rearrangements. Haematologica 97 : 258–261.
86. GiambraV, JenkinsCR, WangH, LamSH, ShevchukOO, et al. (2012) NOTCH1 promotes T cell leukemia-initiating activity by RUNX-mediated regulation of PKC-theta and reactive oxygen species. Nat Med 18 : 1693–1698.
87. KingB, TrimarchiT, ReavieL, XuL, MullendersJ, et al. (2013) The ubiquitin ligase FBXW7 modulates leukemia-initiating cell activity by regulating MYC stability. Cell 153 : 1552–1566.
88. MaillardI, KochU, DumortierA, ShestovaO, XuL, et al. (2008) Canonical notch signaling is dispensable for the maintenance of adult hematopoietic stem cells. Cell Stem Cell 2 : 356–366.
89. YuanJS, KousisPC, SulimanS, VisanI, GuidosCJ (2010) Functions of notch signaling in the immune system: consensus and controversies. Annu Rev Immunol 28 : 343–365.
90. PhelanJD, SabaI, ZengH, KosanC, MesserMS, et al. (2013) Growth factor independent-1 maintains Notch1-dependent transcriptional programming of lymphoid precursors. PLoS Genet 9: e1003713.
91. TzonevaG, FerrandoAA (2012) Recent advances on NOTCH signaling in T-ALL. Curr Top Microbiol Immunol 360 : 163–182.
92. De ObaldiaME, BellJJ, WangX, HarlyC, Yashiro-OhtaniY, et al. (2013) T cell development requires constraint of the myeloid regulator C/EBP-alpha by the Notch target and transcriptional repressor Hes1. Nat Immunol 14 : 1277–1284.
93. LaurentiE, Varnum-FinneyB, WilsonA, FerreroI, Blanco-BoseWE, et al. (2008) Hematopoietic stem cell function and survival depend on c-Myc and N-Myc activity. Cell Stem Cell 3 : 611–624.
94. BaenaE, OrtizM, MartinezAC, de AlboranIM (2007) c-Myc is essential for hematopoietic stem cell differentiation and regulates Lin(-)Sca-1(+)c-Kit(-) cell generation through p21. Exp Hematol 35 : 1333–1343.
95. WilsonA, MurphyMJ, OskarssonT, KaloulisK, BettessMD, et al. (2004) c-Myc controls the balance between hematopoietic stem cell self-renewal and differentiation. Genes Dev 18 : 2747–2763.
96. ReavieL, Della GattaG, CrusioK, Aranda-OrgillesB, BuckleySM, et al. (2010) Regulation of hematopoietic stem cell differentiation by a single ubiquitin ligase-substrate complex. Nat Immunol 11 : 207–215.
97. O'NeilJ, GrimJ, StrackP, RaoS, TibbittsD, et al. (2007) FBW7 mutations in leukemic cells mediate NOTCH pathway activation and resistance to gamma-secretase inhibitors. J Exp Med 204 : 1813–1824.
98. NakagawaM, TakizawaN, NaritaM, IchisakaT, YamanakaS (2010) Promotion of direct reprogramming by transformation-deficient Myc. Proc Natl Acad Sci U S A 107 : 14152–14157.
99. RoderickJE, TesellJ, ShultzLD, BrehmMA, GreinerDL, et al. (2014) c-Myc inhibition prevents leukemia initiation in mice and impairs the growth of relapsed and induction failure pediatric T-ALL cells. Blood 123 : 1040–1050.
100. LoosveldM, CastellanoR, GonS, GoubardA, CrouzetT, et al. (2014) Therapeutic targeting of c-Myc in T-cell acute lymphoblastic leukemia, T-ALL. Oncotarget 5 : 3168–3172.
101. SmithLJ, CurtisJE, MessnerHA, SennJS, FurthmayrH, et al. (1983) Lineage infidelity in acute leukemia. Blood 61 : 1138–1145.
102. IschenkoI, ZhiJ, MollUM, NemajerovaA, PetrenkoO (2013) Direct reprogramming by oncogenic Ras and Myc. Proc Natl Acad Sci U S A 110 : 3937–3942.
103. ChiuPP, JiangH, DickJE (2010) Leukemia-initiating cells in human T-lymphoblastic leukemia exhibit glucocorticoid resistance. Blood 116 : 5268–5279.
104. SoulierJ, ClappierE, CayuelaJM, RegnaultA, Garcia-PeydroM, et al. (2005) HOXA genes are included in genetic and biologic networks defining human acute T-cell leukemia (T-ALL). Blood 106 : 274–286.
105. SimonC, ChagraouiJ, KroslJ, GendronP, WilhelmB, et al. (2012) A key role for EZH2 and associated genes in mouse and human adult T-cell acute leukemia. Genes Dev 26 : 651–656.
106. NagelS, VenturiniL, MeyerC, KaufmannM, ScherrM, et al. (2010) Multiple mechanisms induce ectopic expression of LYL1 in subsets of T-ALL cell lines. Leuk Res 34 : 521–528.
107. ZhuangY, KimCG, BartelmezS, ChengP, GroudineM, et al. (1992) Helix-loop-helix transcription factors E12 and E47 are not essential for skeletal or cardiac myogenesis, erythropoiesis, chondrogenesis, or neurogenesis. Proc Natl Acad Sci U S A 89 : 12132–12136.
108. MalissenM, GilletA, ArdouinL, BouvierG, TrucyJ, et al. (1995) Altered T cell development in mice with a targeted mutation of the CD3-epsilon gene. EMBO J 14 : 4641–4653.
109. ZhumabekovT, CorbellaP, TolainiM, KioussisD (1995) Improved version of a human CD2 minigene based vector for T cell-specific expression in transgenic mice. J Immunol Methods 185 : 133–140.
110. GreavesDR, WilsonFD, LangG, KioussisD (1989) Human CD2 3'-flanking sequences confer high-level, T cell-specific, position-independent gene expression in transgenic mice. Cell 56 : 979–986.
111. HarrisonDE, JordanCT, ZhongRK, AstleCM (1993) Primitive hemopoietic stem cells: direct assay of most productive populations by competitive repopulation with simple binomial, correlation and covariance calculations. Exp Hematol 21 : 206–219.
112. EmaH, NakauchiH (2000) Expansion of hematopoietic stem cells in the developing liver of a mouse embryo. Blood 95 : 2284–2288.
113. TanigawaT, ElwoodN, MetcalfD, CaryD, DeLucaE, et al. (1993) The SCL gene product is regulated by and differentially regulates cytokine responses during myeloid leukemic cell differentiation. Proc Natl Acad Sci U S A 90 : 7864–7868.
114. TrickettA, KwanYL (2003) T cell stimulation and expansion using anti-CD3/CD28 beads. J Immunol Methods 275 : 251–255.
115. GautierL, CopeL, BolstadBM, IrizarryRA (2004) affy—analysis of Affymetrix GeneChip data at the probe level. Bioinformatics 20 : 307–315.
116. BreitlingR, ArmengaudP, AmtmannA, HerzykP (2004) Rank products: a simple, yet powerful, new method to detect differentially regulated genes in replicated microarray experiments. FEBS Lett 573 : 83–92.
117. Salmon-DivonM, DvingeH, TammojaK, BertoneP (2010) PeakAnalyzer: genome-wide annotation of chromatin binding and modification loci. BMC Bioinformatics 11 : 415.
118. TremblayM, HerblotS, LecuyerE, HoangT (2003) Regulation of pT alpha gene expression by a dosage of E2A, HEB, and SCL. J Biol Chem 278 : 12680–12687.
119. LacombeJ, KroslG, TremblayM, GerbyB, MartinR, et al. (2013) Genetic interaction between Kit and Scl. Blood 122 : 1150–1161.
120. LachmannA, XuH, KrishnanJ, BergerSI, MazloomAR, et al. (2010) ChEA: transcription factor regulation inferred from integrating genome-wide ChIP-X experiments. Bioinformatics 26 : 2438–2444.
Štítky
Genetika Reprodukční medicínaČlánek vyšel v časopise
PLOS Genetics
2014 Číslo 12
- Kazuistika – Perspektivy využití precizované medicíny v rámci personalizované specifické terapie onkologických pacientů
- Nobelova cena za chemii pro genetické nůžky: Objev, který změní naši budoucnost?
- Technologie na bázi RNA v klinické praxi: od přebarvených petúnií k terapii vzácných a dosud jen obtížně léčitelných chorob u lidí
- „Nepředstavovali jsme si, že náš výzkum povede přímo ke vzniku nových léků, dokonce ještě za našeho života“
- Bezplatné služby pro diagnostiku ATTRv amyloidózy pro kardiology
Nejčtenější v tomto čísle
- Tetraspanin (TSP-17) Protects Dopaminergic Neurons against 6-OHDA-Induced Neurodegeneration in
- Maf1 Is a Novel Target of PTEN and PI3K Signaling That Negatively Regulates Oncogenesis and Lipid Metabolism
- The IKAROS Interaction with a Complex Including Chromatin Remodeling and Transcription Elongation Activities Is Required for Hematopoiesis
- Echoes of the Past: Hereditarianism and
Zvyšte si kvalifikaci online z pohodlí domova
Mazová zátka a její řešení
nový kurzVšechny kurzy