
Genetic Basis of Haloperidol Resistance in Is Complex and Dose Dependent
Variation in response to a drug can be determined by many factors. In the model organism baker's yeast, many studies of chemical resistance traits have uncovered a complex genetic basis of such resistance. However, an in-depth study of how drug dose alters the effects of underlying genetic factors is lacking. Here, we employed linkage analysis to map the specific genetic loci underlying response to haloperidol, a small molecule therapeutic drug, using a large panel of segregants from a cross between two genetically divergent yeast strains BY (a laboratory strain) and RM (a vineyard strain). We found that loci associated with haloperidol resistance are dose-dependent. We also showed that variants in the oxysterol-binding-protein-like domain of the gene SWH1 underlie the major locus detected at all doses of haloperidol. Genetic interactions among genes SWH1, MKT1, and IRA2 in the RM background contribute to the differential response at high concentrations of haloperidol.
Published in the journal:
. PLoS Genet 10(12): e32767. doi:10.1371/journal.pgen.1004894
Category:
Research Article
doi:
https://doi.org/10.1371/journal.pgen.1004894
Summary
Variation in response to a drug can be determined by many factors. In the model organism baker's yeast, many studies of chemical resistance traits have uncovered a complex genetic basis of such resistance. However, an in-depth study of how drug dose alters the effects of underlying genetic factors is lacking. Here, we employed linkage analysis to map the specific genetic loci underlying response to haloperidol, a small molecule therapeutic drug, using a large panel of segregants from a cross between two genetically divergent yeast strains BY (a laboratory strain) and RM (a vineyard strain). We found that loci associated with haloperidol resistance are dose-dependent. We also showed that variants in the oxysterol-binding-protein-like domain of the gene SWH1 underlie the major locus detected at all doses of haloperidol. Genetic interactions among genes SWH1, MKT1, and IRA2 in the RM background contribute to the differential response at high concentrations of haloperidol.
Introduction
The budding yeast Saccharomyces cerevisiae has become a powerful model for elucidating fundamental principles and mechanisms of complex trait genetics [1]. Many quantitative trait loci (QTL) – and the causal genes underlying these loci – have been identified for diverse biological processes, including gene expression [2]–[4], high-temperature growth [5]–[8], DNA damage repair [9], sporulation efficiency [10]–[12], and drug sensitivity [7], [13], [14]. In studies of chemical resistance traits, compound concentrations with the highest heritability are typically selected for further analysis [15]. However, the extent to which the genetic architecture underlying the response to a drug is specific to the drug dose is a major open question.
Following initial observations of complex and dose-dependent inheritance patterns of the response to the small molecule haloperidol, we set out to investigate the genetic basis of haloperidol resistance as a function of dose. Haloperidol is a psychoactive drug that binds to dopamine and serotonin receptors in humans [16], and is widely used for treating schizophrenia. In Saccharomyces cerevisiae (which does not contain the pharmacologically relevant haloperidol targets), haloperidol exerts effects on vesicle transport and amino acid metabolism [17], demonstrating perturbations of fundamental cellular physiology upon exposure to the drug. Haloperidol, a cationic amphiphilic drug, has been shown at concentrations of 10–200 µM to cause defects in phospholipid metabolism/transport [18], [19] and trigger autophagy upon accumulation [20] in yeast, and to result in degradation of membranes [21] in vitro. Haloperidol was also found to inhibit both sterol Δ8,7 isomerase (Erg2) and C-14 reductase (Erg24) activities in yeast [22], [23]. An early biochemical study showed that haloperidol binds to Erg2 in yeast, and causes decreased ergosterol levels [23]. Erg2 functions in the ergosterol biosynthesis pathway, suggesting haloperidol's interference with sterol metabolism and trafficking.
Here, we used a large panel of 1008 segregants from a cross between a laboratory strain BY4724 (hereafter referred to as BY) and a vineyard strain RM11-1a (hereafter RM) to study yeast growth in haloperidol. We identified a total of nine genomic loci associated with resistance to haloperidol with different dose-specificity. We further identified SWH1 as a major gene contributing to resistance to haloperidol at all concentrations, and showed that variants within its oxysterol binding protein (OBP)-like domain are responsible for resistance. We also showed that variants in MKT1 and IRA2 underlie loci that have effects predominantly at high haloperidol concentrations, and found complex, background-dependent genetic interactions among the allelic states of SWH1, MKT1, and IRA2. This study sheds light on the contribution of QTL-dosage interaction to chemical resistance in yeast, and the complexity of the underlying sources of variation in quantitative traits.
Results
Haloperidol induces pH dependent sensitivity and vacuole defects
To assess the biological effects of haloperidol in S. cerevisiae, we examined susceptibility of the laboratory strain BY carrying gene deletions erg2Δ, erg24Δ, or erg4Δ to haloperidol in rich medium (Fig. 1A). Erg2, Erg24, and Erg4 make up three important steps in the ergosterol biosynthesis pathway in yeast [24]. BY erg2Δ and BY erg24Δ strains had growth defects in rich medium, but neither was completely resistant to haloperidol. Erg4 catalyzes the final step in the ergosterol biosynthesis pathway, and it has been shown that erg4Δ mutants lack detectable levels of ergosterol [25]. Deleting ERG4 did not eliminate the sensitivity to haloperidol (Fig. 1A); thus, haloperidol has biological effects other than those on the ergosterol pathway [17].

Similar to previous observations with other cationic amphiphilic drugs [18], [20], we found sensitivity to haloperidol to be pH dependent (Fig. 1A). Acidic pH ( = 4.3) [26] completely rescued growth in the presence of 150 µM haloperidol (Fig. 1A). pH related phenotypes are often indicative of vacuole-related defects [27]. Staining of the vacuole and vacuolar membrane of haloperidol-treated cells showed that vacuoles were intact (Fig. 1B). Measuring acidity with fluorescent dye quinacrine (which accumulates in acidic compartments) revealed decreased vacuolar acidity upon longer exposure to haloperidol (Fig. 1B). Quinacrine efficiently labeled the cytoplasm in the presence of haloperidol, suggesting that proton-pumping mechanisms are impaired (Fig. 1B).
Haloperidol resistance differs between strains and shows transgressive segregation
We compared growth of BY and RM in the presence of different concentrations of haloperidol (0–240 µM). Although RM has higher baseline growth in the absence of haloperidol, it is more sensitive to haloperidol at concentrations ranging from 40 to 160 µM (Fig. 2A).

We also tested segregants from a cross between BY and RM and found that resistance to haloperidol showed transgressive segregation, with some progeny exhibiting phenotypes more extreme than either parent (Fig. 2B). For instance, haloperidol concentration of 200 µM completely inhibited the growth of both parental strains at 48 hours, but ∼8.5% of segregants were able to grow. A formal statistical test for transgressive segregation [28] showed that it was significant at all measured concentrations of haloperidol between 40 µM and 200 µM (p<0.0001 in all cases; see Methods for details).
Loci underlying haloperidol resistance have dose-dependent effects
We sought to further understand the genetics underlying growth in the presence of haloperidol through QTL mapping. We carried out linkage analysis in a panel of 1008 BY-RM segregants [15] for growth at five different concentrations of haloperidol (40, 80, 120, 160, 200 µM) and identified nine distinct significant QTL (Fig. 3A). At the major locus on the right arm of chromosome I, the allele from RM (the sensitive parent) promoted growth in the presence of haloperidol, consistent with our observation of transgressive segregation (Fig. 2B). RM alleles at loci on chromosomes V, XII and XV also confer greater resistance, while BY alleles confer higher resistance at the remaining five loci (Fig. 3).
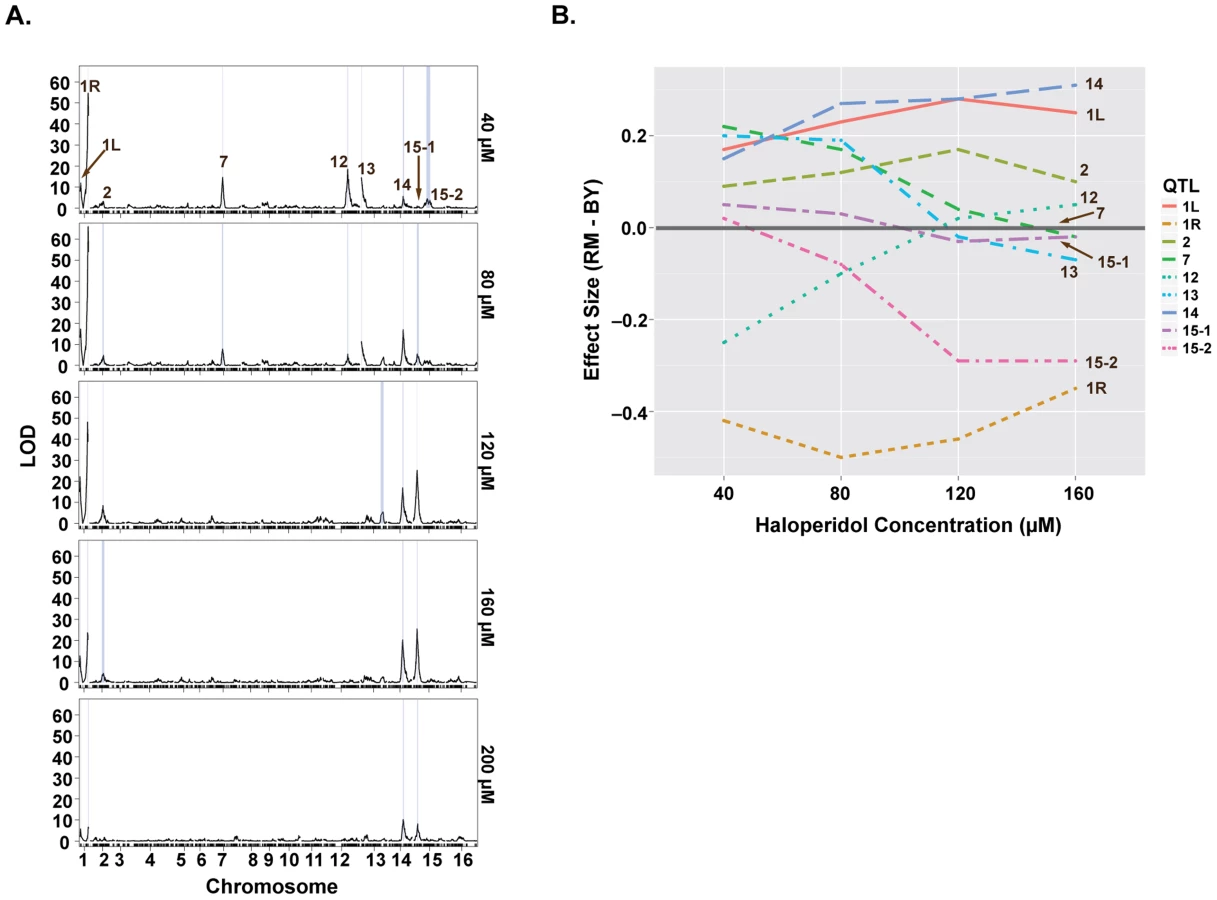
Some of the loci were detected only at certain doses of haloperidol, and the effect sizes of most loci were dose-dependent (Fig. 3). For instance, the loci on chromosomes VII, XII, and XIII were only detected at the two lower doses, while the effects of loci on chromosomes XIV and XV primarily manifested at the higher doses (Fig. 3B). Most loci had undetectable or weak effects at 200 µM, because few segregants grew at this dose.
We quantified the amount of variation explained by these nine loci by fitting a linear model with additive QTL. This model explained between 35.9% and 54.7% of the total phenotypic variance at concentrations 40–160 µM (S1 Table). The locus on chromosome I (right arm) alone explained 21.4%, 26.7%, 21.4%, 11.6% of the variance at these four doses, respectively.
Polymorphisms in the OBP domain of SWH1 underlie major QTL on chromosome I
The major QTL on the right arm of chromosome I had significant additive effects at all concentrations of haloperidol. The confidence interval of this peak contained the gene SWH1 (also known as OSH1), which encodes a yeast homologue of the mammalian oxysterol-binding protein (OSBP) [29]. OSBPs are a family of proteins with the ability to bind oxysterols [30], [31], which are oxidized derivatives of sterols in the cell.
We sequenced the coding region of the BY and RM alleles of SWH1 and identified 13 synonymous single nucleotide polymorphisms (SNPs), 9 non-synonymous SNPs, and a 6 base pair indel between the two alleles (S2 Table, Fig. 4E). According to Pfam alignments with the amino acid sequence of Osh4 (which recently had its crystal structure solved [32]), Swh1 contains ankyrin repeats, a pleckstrin-homology-protein-like domain (PH), and an oxysterol-binding-protein-like domain (OBP) at the C-terminus [29]. Three of the non-synonymous SNPs between BY and RM are located in the OBP domain, five are in the linker region between the PH domain and OBP domain, and one is in the PH domain (Fig. 4E).

To test whether SWH1 allelic variation caused differences in growth at different haloperidol concentrations, we conducted a reciprocal hemizygosity analysis [5]. The BY/RM hybrids carrying either only the BY or only the RM allele of SWH1 grew differently in the presence of haloperidol, demonstrating that SWH1 contributes to the variable response (Fig. 4A). Specifically, the hybrid carrying only the RM allele of SWH1 (swh1BYΔ/SWH1RM) showed a higher growth rate compared to the hybrid carrying only the BY allele (SWH1BY/swh1RMΔ). Thus, SWH1RM is the resistant allele relative to SWH1BY, confirming the QTL results.
We found that deletion of SWH1 in both BY and RM haploid backgrounds conferred higher growth rates across the response range to haloperidol (Fig. 4B). This illustrates that SWH1 loss of function leads to greater haloperidol resistance. To gain some insight into the relative function of the BY and RM alleles of SWH1, we examined the growth rates of the BY/RM hybrid carrying none, either, or both BY and RM copies of SWH1 (Fig. 4A). With the BY allele of SWH1 intact in the hybrid, little difference in growth rate was observed with or without the RM allele, indicating that a single copy of the BY allele of SWH1 is sufficient for function. Next, comparing the growth rates of the SWH1 hemizygotes (swh1BYΔ/SWH1RM or SWH1BY/swh1RMΔ) relative to the deletion (swh1BY Δ/swh1RM Δ), growth of swh1BYΔ/SWH1RM was more similar to swh1BY Δ/swh1RM Δ (Fig. 4A). These results demonstrate that the RM allele of SWH1 is the less functional of the two. However, the RM allele is not a complete loss-of-function, as deleting the RM allele of SWH1 still increased haloperidol resistance (Fig. 4B).
Analysis in the BY and RM haploids and their hybrid illustrated that reducing SWH1 function leads to haloperidol resistance. To explicitly test the effect of SWH1 polymorphisms on haloperidol resistance, we swapped the SWH1 coding region in both BY and RM (replacing the coding region with the copy from the other strain). Introducing the functional BY allele into the RM background slightly reduced resistance to haloperidol, whereas having the RM allele of SWH1 in BY increased resistance. The results from allele replacements in BY and RM haploids demonstrated that SWH1 affects resistance to haloperidol in both genetic backgrounds (Fig. 4C).
To gain further insight into the mechanism of resistance to haloperidol, we looked more specifically at the polymorphisms between BY and RM in the SWH1 gene. Among all 22 SNPs residing in the coding region of SWH1, three of the non-synonymous SNPs between BY and RM (D1020G, S1085L, and I1098V) are located in the OBP domain (Fig. 4E, S2 Table). We replaced the OBP domain of SWH1 in BY with the counterpart from RM (hereafter BY SWH1OBP-RM) and tested resistance to haloperidol between the replacement strains (Fig. 4D). BY SWH1OBP-RM fully recapitulated the increased resistance to haloperidol achieved by replacing the entire coding region of SWH1 in BY with the RM allele. According to structure-based alignments of Swh1 with the crystal structure of full length Osh4 in yeast [32], D1020G lies within β-sheets (β14 - β15) that form a hydrophobic tunnel, which can bind one sterol molecule [32]. Therefore, we speculate that D1020G in RM may result in an altered structural form of the binding pocket and reduce Swh1 activity.
Polymorphisms in IRA2 and MKT1 contribute to haloperidol resistance
Among the loci identified for haloperidol resistance, those on chromosomes XIV and XV became the major QTL at higher doses of the drug. IRA2, a gene previously identified to contain variants underlying differences in gene expression and metabolite levels [33], [34], resides within the locus on chromosome XV. IRA2 encodes a GTPase activating protein that inhibits RAS, which mediates cellular responses in nutrient limiting conditions via the Ras/PKA pathway [35]–[37]. Analyzing allele replacement strains for IRA2 [34], we saw that in both parental backgrounds, the allelic state of IRA2 influenced resistance to haloperidol. The IRA2RM allele in both BY and RM genetic backgrounds was more resistant to the drug (Fig. 5A).

The locus on chromosome XIV is a QTL hotspot identified in many chemical stresses, and as a QTL for growth in rich medium [14], [15], [38]. It contains the gene MKT1, which encodes a protein member of a complex involved in HO regulation [39]. A laboratory strain allele of MKT1 has been shown to influence gene expression [34], DNA replication stress [40] and mitochondrial genome stability [41]. Using BY and RM allele replacement strains from [41], we confirmed MKT1 as the gene underlying the chromosome XIV locus (Fig. 5B). We further found that MKT1 only had an effect in the RM background: replacing MKT1RM with MKT1BY led to near complete resistance, while the reciprocal allele swap had little effect on BY (Fig. 5B). The observation that the BY allele of MKT1 led to greater growth in haloperidol is the opposite of what has been seen for growth in other conditions in previous complex trait studies, which found the MKT1BY allele to be deleterious for growth in the absence of functional mitochondria and in the presence of the drug 4-NQO [9], [41].
Complex genetic interactions among haloperidol resistance loci
To quantify the amount of phenotypic variance explained by genetic variation, we calculated broad - and narrow-sense heritability [15] at the five concentrations of haloperidol (Table 1). Narrow-sense heritability ranged from 0.56 to 0.71 at doses from 40–160 µM and decreased dramatically at 200 µM. Broad-sense heritability was consistently high (>∼75%) at all doses.

Differences between broad - and narrow-sense heritability suggest that non-additive interactions contribute to phenotypic variance [15]. We tested for statistical interactions between additive QTL detected in at least one haloperidol concentration, and found 9, 10, 3, 5 and 5 significant pair-wise QTL interactions (out of 36 possible locus pairs) at the five doses (Bonferroni-corrected p<0.005, S1 Table, S3 Table). Incorporating the corresponding significant two-way QTL interactions in the QTL model at each dose explained an additional 11.0%, 6.6%, 1.7%, 7.8%, and 7.2% of phenotypic variance at 40 µM, 80 µM, 120 µM, 160 µM, and 200 µM haloperidol, respectively (S3 Table). At 40 µM, the additional variance explained accounted for most of the difference between broad - and narrow-sense heritability (14.6%), and at 80 µM half of this difference (12.9%) was captured (Table 1). However, at higher doses, taking into account two-way interactions explained little of the differences between broad - and narrow-sense heritability (Table 1), suggesting the presence of higher-order interactions, interactions between loci with no detectable main effects, or other non-additive contributions to broad-sense heritability.
We detected significant pair-wise interactions at 160 µM and 200 µM among all pairs of loci on chromosomes I, XIV, and XV that correspond to SWH1, MKT1, and IRA2 (S1 fig., S3 Table). To further explore these interactions, we generated allele replacement strains in both BY and RM carrying all 8 combinations of SWH1, MKT1, and IRA2 alleles (16 total strains), and measured their growth at 200 µM haloperidol. We tested these allelic effects and their interactions using analysis of variance (ANOVA) and found that the pairwise interaction terms were not significant, but all locus pairs had a significant interaction effect with the genetic background (S4 Table). We therefore performed ANOVA in the BY and RM background separately. The pair-wise interactions among SWH1, MKT1, and IRA2 were all significant in the RM background, but none were significant in the BY background (Table 2, S4, S5, and S6 Table).

These results suggest that complex interactions among the three tested alleles (SWH1, MKT1, IRA2) and the genetic background determine resistance to haloperidol. In the RM background, the allelic state of SWH1 influenced the effect of MKT1. Introduction of MKT1BY dramatically increased growth, but only in the presence of SWH1RM (Fig. 6A). We also found interactions between the alleles of SWH1 and IRA2 in the RM background (Fig. 6B). IRA2RM increased growth in RM when it carried SWH1RM and MKT1BY (Fig. 6B, left panel), but reduced growth when it carried SWH1BY and MKT1RM (Fig. 6, right panel). Further, the allelic state of SWH1 influenced the direction of effect for IRA2. IRA2BY promoted growth in the presence of the BY allele of SWH1 (Fig. 6C, left panel), but reduced growth in the presence of the RM allele of SWH1 (Fig. 6C, right panel).

Growth of both BY and RM in haloperidol was completely rescued by the genotype combination MKT1BY, IRA2RM and SWH1RM (Fig. 6). However, MKT1RM only caused sensitivity to haloperidol in RM (Fig. 6B, right panel), even in the presence of SWH1RM and IRA2RM. We therefore conclude that MKT1RM, in combination with other unidentified factors in the RM background contribute to the sensitivity of RM to haloperidol.
Discussion
The genetic architectures of chemical resistance in yeast range from relatively simple (involving a single locus) to highly complex (>20 loci) [9], [13]–[15]. These studies typically tested only one dose per compound. Here, we explored the full dose response range of the small molecule drug haloperidol to dissect the genetic architecture of dose-response variation in S. cerevisiae. We have shown that loci underlying haloperidol resistance have dose-dependent effects. We identified QTL that showed effects only at low doses of haloperidol, and loci that showed significant effects primarily at higher concentrations of the drug. Our study demonstrates QTL-dosage interaction within the response range of a single drug, and provides new insight into the complex genetic basis of drug resistance in yeast.
We identified SWH1 (OSH1) to be the causal gene underlying the largest effect locus in response to haloperidol. Swh1 is a protein similar to the mammalian oxysterol-binding protein and targets to both the Golgi and the nucleus-vacuole junction in yeast [42]. Swh1 that associates with the nucleus-vacuole junction has been shown to act as a substrate for a degradation process, named the piecemeal microautophagy of the nucleus (PMN) [43]. Our observation that variants within the OBP domain of Swh1 contribute to resistance to haloperidol suggests that cellular transport, perhaps of sterol-related molecules, is affected in the presence of haloperidol. Cationic amphiphilic drugs have been linked to phospholipidosis and cellular membrane damage [19], and our identification of Swh1 suggests a potential role for oxysterol binding proteins in these defects. We found that after 6 hours of exposure to haloperidol, yeast vacuoles were enlarged, with the cytoplasm more acidic than the vacuoles, suggesting that haloperidol leads to vacuole dysfunction and further linking Swh1, vacuole functions, and haloperidol resistance. The same locus was previously linked to growth in E6 berbamine, cobalt chloride, copper sulphate, and neomycin [13], [15]; it also overlaps with a QTL hotspot in response to a panel of small-molecule therapeutic drugs [13], suggesting that this locus has pleiotropic effects.
In S. cerevisiae, there are seven OSBP homologues (OSH1-7) [44]. Previous studies of the yeast OSH genes suggested that the seven oxysterol-binding proteins shared at least one essential role in the cell (only deletion of all seven genes is lethal), and their functions have significant overlap [44]. We have here provided genetic evidence that Swh1 functions are related to resistance to haloperidol. BY and RM display variation in both the coding and non-coding regions of the remaining six OSH genes. These six OSH genes do not lie in the detected QTL intervals, suggesting that the variants within these genes may lack effects on growth in the presence of haloperidol, either because they do not alter gene function or because only SWH1 has an effect on growth in the presence of haloperidol. Further studies are required to tease apart the specific functions of the individual yeast OSH genes.
We showed that polymorphisms in MKT1 contribute to yeast growth in the presence of high concentrations of haloperidol. MKT1 is also a hotspot identified in eQTL [34], protein QTL [45]–[47], and drug resistance studies [13] in yeast. The BY (isogenic derivative of S288c) allele of MKT1, which is not present in other strain backgrounds, was previously shown to reduce formation of petite colonies and compromise growth of petite cells [41]. Lipophilic cations can pass through phospholipid membranes, especially those with a large transmembrane potential, such as the mitochondrial inner membrane. This leads to the accumulation of these drugs in the mitochondrial matrix, inducing mitochondrial respiration inhibition [48]. The observation that the BY allele of MKT1 confers resistance to haloperidol suggests that haloperidol may compromise mitochondrial integrity. Variants in IRA2 also contribute to haloperidol resistance. The RM allele of IRA2 inhibits the Ras/PKA pathway more strongly than the BY allele [34]. Since PKA inhibits Msn2/Msn4, the major transcription factors in stress response [49], [50], the RM allele of IRA2 is predicted to lead to stronger stress response, suggesting that stronger stress response may be advantageous at high haloperidol concentrations.
In this study, we demonstrated complex interactions among the alleles of SWH1, MKT1, and IRA2 in the RM background at 200 µM haloperidol. Pair-wise interactions between identified loci explained the majority of the difference between broad - and narrow-sense heritability at 40 µM haloperidol, but not at higher doses, suggesting higher order interactions or other non-additive contributions. Previous studies in yeast using sporulation efficiency as a model for complex traits [10], [11] revealed linkage between small - and large-effect QTL, as well as interactions among these QTL. Small-effect QTL were found to depend on the allelic status of the large-effect QTL [11], which is similar to our observation that the effects of IRA2 and MKT1 were dependent on the allele of SWH1 – the gene underlying the large effect QTL. Through allele replacement analyses, we found that the interactions between SWH1, MKT1, and IRA2 were present in the RM background but absent in the BY background, illustrating the value of studying genetically diverse strains.
Haloperidol and many antidepressants are cationic amphiphilic drugs that accumulate in membranes in the absence of their specific targets [51]. SWH1 is functionally related to sterol trafficking and the membrane system, and underlies the QTL detected throughout the entire dose response in haloperidol. The identification of MKT1 and IRA2 at higher concentrations of haloperidol suggests the effects of other cellular processes and stress responses. Given the current knowledge on the functions of these identified genes, the interactions between SWH1, MKT1, and IRA2 could reflect underlying mechanisms that connect the membrane system, sterol metabolism, and stress response. The as yet unidentified genes underlying the remaining QTL may provide further insight into the mechanisms of action of haloperidol.
Materials and Methods
Yeast strains, media, and chemicals
S. cerevisiae strains BY4724 and RM11-1a derived strains were used in this study. The panel of 1008 prototrophic segregants derived from BY (MATa) and RM (MATα hoΔ::HphMX4 flo8Δ::NatMX4 AMN1BY) was previously generated [15]. Allele replacement strains were constructed via the Delitto Perfetto approach using the CORE cassette [52]. This two-step process was performed by first inserting a URA3-KanMX4 cassette from pCORE to generate yfgΔ::URA3-KanMX4; then the region of interest was amplified through high-fidelity PCR from the donor strain, and inserted to replace the URA3-KanMX4 cassette. The loss of the URA3-KanMX4 cassette was selected via 5-Fluoroorotic Acid (5-FOA) counter selection of URA3 and further selected via loss of G418 resistance. Single colonies were isolated at each step, cassette insertions were confirmed via PCR, and allele replacements were sequenced to verify the presence of the correct allele. Transformations were performed by the standard lithium acetate method. All gene sequences were obtained from the Saccharomyces Genome Database (http://www.yeastgenome.org/). All DNA sequencing related to strain construction and confirmation was performed through standard dideoxy methods.
Cultures were grown in rich medium (YPD, 1% yeast extract, 2% peptone and 2% glucose). YPD liquid media and agar plates were made as described [53]. SPO++ was used for sporulation (http://www.genomics.princeton.edu/dunham/sporulationdissection.htm). Selection plates for strain construction were made with YPD containing the respective drugs at standard doses. Haloperidol was purchased from Sigma (Sigma H1512). All drugs in this study are dissolved in DMSO. Because BY and RM exhibit growth defects only at DMSO concentrations >3% (v/v%), DMSO concentrations in all experiments were kept at <1%.
Selection agar plate construction
Drug selection agar plates were made with Nunc OmniTray (Thermo Scientific 264728). 50 mL of YPD with drug concentrations specified were poured into each tray, the trays were placed on a flat surface to solidify in order to obtain best pinning results. All trays contained the same final DMSO concentration. Each experiment was performed with the same batch of YPD. Each plate was made 6 times to allow testing 2 full replicates of the entire segregant panel in 2 different layout configurations. Segregants were pinned on to each agar tray in 384 well format. Haloperidol concentrations for agar plates were selected to be 40, 80, 120, 160, and 200 µM. These concentrations capture the growth differences between BY and RM, yet maintain enough colony growth to allow QTL mapping.
Yeast colony growth measurement
The 1008 segregant panel are stored at −80°C in 96 well format. They were inoculated in YPD and cultured in 384-well plates for ∼48 hours or until saturation. Two configurations were used when converting from 96 to 384 well format, to control for position effect and growth differences due to neighboring cells (including blank controls). Culture plates were then fully resuspended and pinned onto corresponding agar plates with 384 long pins using Singer RoToR. The pinned agar plates were incubated at 30°C for 48–72 hr (as specified) and scanned with an Epson 700 transparency scanner. TIFF images (400 dpi) were processed for end-point colony size and effective colony radius was used as proxy for growth [15].
QTL mapping
In order to control for both intrinsic growth rate differences and plate position effects, end point effective colony radiuses (as described in “Yeast colony growth measurement”) were normalized for growth on control media (YPD supplemented with same amounts of DMSO as solvent control) through fitting a regression for effect of growth that were in the same layout configuration on YPD. Residuals were used for QTL mapping. Linkage was determined by calculating LOD scores for each genotype marker using both Haley-Knott regression and non-parametric linkage mapping with the R/qtl package. QTL were called at a LOD cutoff of 3. Significance was further determined by 1000 permutations of phenotypic values, and re-calculation of LOD scores.
Growth rate quantification
Yeast cells were inoculated in rich medium in 96-well plates (Costar 3370) and incubated at 30°C until saturation. 1% (v/v%) of saturated culture was used in fresh medium (with or without drug) for growth rate measurement (starting optical density OD <0.05). Growth curves were recorded using Synergy 2 Multi-Mode Microplate Reader (BioTek Instruments) at 30°C with continuous fast linear shaking (100 µL/well). OD600 were collected at 15-minute intervals for up to 24 hours. Growth curves were spline fitted, and the maximum fitted slope during logarithmic phase was used as maximum growth rate. Each strain/condition was performed in triplicate. Growth rates are shown as the mean ± sstandard deviation. A t-test was performed between samples in comparison to obtain p-values. All data fitting and comparison were performed in R (http://www.r-project.org/).
Replacement analysis
Thirty-six replicates each of sixteen replacement strains (BY background: SWH1RM, MKT1RM, IRA2RM, IRA2RM SWH1RM, IRA2RM MKT1RM, SWH1RM MKT1RM, SWH1RM IRA2RM MKT1RM; RM background: SWH1BY, MKT1BY, IRA2BY, MKT1BY SWH1BY, MKT1BY IRA2BY, SWH1BY IRA2BY, SWH1BY MKT1BY IRA2BY) and wild type progenitor BY and RM strains were spotted onto YPD agar supplemented with 0, 40, 80, 120, 160, 200 µM haloperidol. Plates were incubated at 30°C for ∼72 hr, then scanned as described above in “Yeast colony growth measurement”. Colony radiuses were extracted after image processing. The effect of replacements or replacement combinations was compared to their otherwise isogenic progenitor through analysis of variance (ANOVA). The analysis was conducted in R.
Transgressive test
The test for transgression was adapted from [28]. Briefly, segregants and parents were tabulated, and the pooled variance was calculated. Segregants that were 2 standard deviations above the mean of the high parent or below the mean of the low parent were counted. The null model was constructed by pooling the segregants and parents, and the null parents and null segregants were randomly sampled from this pool. Significance was determined based on resampling 10,000 times the pooled null model.
Vacuole fluorescent staining and microscopy
Yeast cells in early to mid log-phase were divided into two cultures of equal volume. Haloperidol (final concentration 150 µM) was added to one half, while an equal volume of DMSO as solvent control was added to the other half. The cultures were incubated at 30°C on a shaker for ∼2 hr. Then, 2×10⁶ cells were harvested from each culture for subsequent staining.
Quinacrine (Sigma Q3251) staining of vacuoles was performed as described in [54]. Harvested cells were washed once in buffered YPD (supplemented with 100 mM HEPES, pH 7.6), resuspended in 100 µL of the same buffered medium and quinacrine at a final concentration of 200 µM. Cell suspensions were incubated at 30°C for 10min and placed on ice for 5min. Cells were pelleted, washed twice, resuspended with ice-old 100 mM HEPES, pH 7.6 buffer containing 2% glucose and kept on ice until imaging.
Carboxy-DCFDA (Yeast Vacuole Marker Sampler Kit, Molecular Probes Y-7531) staining was performed according to kit instructions. Briefly, harvested cells were washed and resuspended in 50 mM sodium citrate buffer, pH 5.0, containing 2% glucose. Carboxy-DCFDA at a final concentration of 10 µM was added to the cell suspension followed by incubation at room temperature for 15–30min.
For FM4-64 (Molecular Probes, T-3166) staining [55], harvested cells were resuspended in 50 µL YPD with 1 µL FM4-64 stock solution (1.6 µM in DMSO) and incubated at 30°C for 20min. Cells were washed subsequently with 1 mL YPD at room temperature and resuspended in 5 mL YPD to recover at 30°C on a shaker for 90–120min. Recovered cells were washed once in 1 mL sterile ddH2O and resuspended in 200–500 µL YNB for imaging.
All imaging was performed within 30min of staining on an Olympus IX81 inverted fluorescence microscope [56] using a 100× oil objective. Quinacrine and carboxy-DCFDA staining were visualized with Chroma SP101v2 (FITC), and FM4-64 with Chroma 49008 (mCherry TexasRed) filter sets. Images were acquired using Slidebook 5.0 digital image acquisition software (Intelligent Imaging Innovations) and processed using ImageJ version 1.46r.
Supporting Information
Zdroje
1. LitiG, LouisEJ (2012) Advances in Quantitative Trait Analysis in Yeast. Plos Genetics 8: e1002912.
2. BremRB, YvertG, ClintonR, KruglyakL (2002) Genetic dissection of transcriptional regulation in budding yeast. Science 296 : 752–755.
3. FayJC, McCulloughHL, SniegowskiPD, EisenMB (2004) Population genetic variation in gene expression is associated with phenotypic variation in Saccharomyces cerevisiae. Genome Biology 5: R26.
4. PicottiP, Clement-ZizaM, LamH, CampbellDS, SchmidtA, et al. (2013) A complete mass-spectrometric map of the yeast proteome applied to quantitative trait analysis. Nature 494 : 266–270.
5. SteinmetzLM, SinhaH, RichardsDR, SpiegelmanJI, OefnerPJ, et al. (2002) Dissecting the architecture of a quantitative trait locus in yeast. Nature 416 : 326–330.
6. SinhaH, DavidL, PasconRC, Clauder-MunsterS, KrishnakumarS, et al. (2008) Sequential elimination of major-effect contributors identifies additional quantitative trait loci conditioning high-temperature growth in yeast. Genetics 180 : 1661–1670.
7. Cubillos FA, Parts L, Salinas F, Bergstrom A, Scovacricchi E, et al.. (2013) High-Resolution Mapping of Complex Traits with a Four-Parent Advanced Intercross Yeast Population. Genetics 195 : 1141-+.
8. YangYD, Foulquie-MorenoMR, ClementL, ErdeiE, AnTH, et al. (2013) QTL Analysis of High Thermotolerance with Superior and Downgraded Parental Yeast Strains Reveals New Minor QTLs and Converges on Novel Causative Alleles Involved in RNA Processing. Plos Genetics 9: e1003693.
9. DemoginesA, SmithE, KruglyakL, AlaniE (2008) Identification and dissection of a complex DNA repair sensitivity phenotype in Baker's yeast. PLoS Genet 4: e1000123.
10. GerkeJ, LorenzK, CohenB (2009) Genetic interactions between transcription factors cause natural variation in yeast. Science 323 : 498–501.
11. LorenzK, CohenBA (2012) Small - and large-effect quantitative trait locus interactions underlie variation in yeast sporulation efficiency. Genetics 192 : 1123–1132.
12. DeutschbauerAM, DavisRW (2005) Quantitative trait loci mapped to single-nucleotide resolution in yeast. Nature Genetics 37 : 1333–1340.
13. PerlsteinEO, RuderferDM, RobertsDC, SchreiberSL, KruglyakL (2007) Genetic basis of individual differences in the response to small-molecule drugs in yeast. Nat Genet 39 : 496–502.
14. EhrenreichIM, TorabiN, JiaY, KentJ, MartisS, et al. (2010) Dissection of genetically complex traits with extremely large pools of yeast segregants. Nature 464 : 1039–1042.
15. BloomJS, EhrenreichIM, LooWT, LiteTL, KruglyakL (2013) Finding the sources of missing heritability in a yeast cross. Nature 494 : 234–237.
16. SumiyoshiT, KidoH, SakamotoH, UrasakiK, SuzukiK, et al. (1994) In vivo dopamine-D2 and serotonin-5-HT2 receptor binding study of risperidone and haloperidol. Pharmacol Biochem Behav 47 : 553–557.
17. EricsonE, GebbiaM, HeislerLE, WildenhainJ, TyersM, et al. (2008) Off-target effects of psychoactive drugs revealed by genome-wide assays in yeast. PLoS Genet 4: e1000151.
18. RaineyMM, KorostyshevskyD, LeeS, PerlsteinEO (2010) The antidepressant sertraline targets intracellular vesiculogenic membranes in yeast. Genetics 185 : 1221–1233.
19. HalliwellWH (1997) Cationic amphiphilic drug-induced phospholipidosis. Toxicol Pathol 25 : 53–60.
20. ChenJ, KorostyshevskyD, LeeS, PerlsteinEO (2012) Accumulation of an antidepressant in vesiculogenic membranes of yeast cells triggers autophagy. PLoS One 7: e34024.
21. CaseyDR, SebaiSC, ShearmanGC, CesO, LawRV, et al. (2008) Formulation affects the rate of membrane degradation catalyzed by cationic amphiphilic drugs. Industrial & Engineering Chemistry Research 47 : 650–655.
22. LumPY, ArmourCD, StepaniantsSB, CavetG, WolfMK, et al. (2004) Discovering modes of action for therapeutic compounds using a genome-wide screen of yeast heterozygotes. Cell 116 : 121–137.
23. MoebiusFF, BermoserK, ReiterRJ, HannerM, GlossmannH (1996) Yeast sterol C8-C7 isomerase: identification and characterization of a high-affinity binding site for enzyme inhibitors. Biochemistry 35 : 16871–16878.
24. Jones EW, Pringle JR, Broach JR (1992) The Molecular and Cellular Biology of the Yeast Saccharomyces: Cold Spring Harbor Laboratory Press.
25. ZweytickD, HrastnikC, KohlweinSD, DaumG (2000) Biochemical characterization and subcellular localization of the sterol C-24(28) reductase, erg4p, from the yeast saccharomyces cerevisiae. FEBS Lett 470 : 83–87.
26. OlcerM, HakyemezG (1988) Investigations of Some Physicochemical Properties of Haloperidol Which May Affect Its Activity. Journal of Clinical Pharmacy and Therapeutics 13 : 341–349.
27. BantaLM, RobinsonJS, KlionskyDJ, EmrSD (1988) Organelle assembly in yeast: characterization of yeast mutants defective in vacuolar biogenesis and protein sorting. J Cell Biol 107 : 1369–1383.
28. BremRB, KruglyakL (2005) The landscape of genetic complexity across 5,700 gene expression traits in yeast. Proceedings of the National Academy of Sciences of the United States of America 102 : 1572–1577.
29. SchmalixWA, BandlowW (1994) SWH1 from yeast encodes a candidate nuclear factor containing ankyrin repeats and showing homology to mammalian oxysterol-binding protein. Biochim Biophys Acta 1219 : 205–210.
30. TaylorFR, SaucierSE, ShownEP, ParishEJ, KandutschAA (1984) Correlation between Oxysterol Binding to a Cytosolic Binding-Protein and Potency in the Repression of Hydroxymethylglutaryl Coenzyme-a Reductase. Journal of Biological Chemistry 259 : 2382–2387.
31. DawsonPA, VanderwesthuyzenDR, GoldsteinJL, BrownMS (1989) Purification of Oxysterol Binding-Protein from Hamster Liver Cytosol. Journal of Biological Chemistry 264 : 9046–9052.
32. ImYJ, RaychaudhuriS, PrinzWA, HurleyJH (2005) Structural mechanism for sterol sensing and transport by OSBP-related proteins. Nature 437 : 154–158.
33. BreunigJS, HackettSR, RabinowitzJD, KruglyakL (2014) Genetic basis of metabolome variation in yeast. PLoS Genet 10: e1004142.
34. SmithEN, KruglyakL (2008) Gene-environment interaction in yeast gene expression. PLoS Biol 6: e83.
35. TanakaK, LinBK, WoodDR, TamanoiF (1991) Ira2, an Upstream Negative Regulator of Ras in Yeast, Is a Ras Gtpase-Activating Protein. Proceedings of the National Academy of Sciences of the United States of America 88 : 468–472.
36. TanakaK, NakafukuM, TamanoiF, KaziroY, MatsumotoK, et al. (1990) Ira2, a 2nd Gene of Saccharomyces-Cerevisiae That Encodes a Protein with a Domain Homologous to Mammalian Ras Gtpase-Activating Protein. Molecular and Cellular Biology 10 : 4303–4313.
37. BroachJR (1991) Ras Genes in Saccharomyces-Cerevisiae - Signal Transduction in Search of a Pathway. Trends in Genetics 7 : 28–33.
38. EhrenreichIM, BloomJ, TorabiN, WangX, JiaY, et al. (2012) Genetic architecture of highly complex chemical resistance traits across four yeast strains. PLoS Genet 8: e1002570.
39. TadauchiT, InadaT, MatsumotoK, IrieK (2004) Posttranscriptional regulation of HO expression by the Mkt1-Pbp1 complex. Mol Cell Biol 24 : 3670–3681.
40. TkachJM, YimitA, LeeAY, RiffleM, CostanzoM, et al. (2012) Dissecting DNA damage response pathways by analysing protein localization and abundance changes during DNA replication stress. Nature Cell Biology 14 : 966–976.
41. DimitrovLN, BremRB, KruglyakL, GottschlingDE (2009) Polymorphisms in multiple genes contribute to the spontaneous mitochondrial genome instability of Saccharomyces cerevisiae S288C strains. Genetics 183 : 365–383.
42. LevineTP, MunroS (2001) Dual targeting of Osh1p, a yeast homologue of oxysterol-binding protein, to both the Golgi and the nucleus-vacuole junction. Molecular Biology of the Cell 12 : 1633–1644.
43. KvamE, GoldfarbDS (2004) Nvj1p is the outer-nuclear-membrane receptor for oxysterol-binding protein homolog Osh1p in Saccharomyces cerevisiae. Journal of Cell Science 117 : 4959–4968.
44. BehCT, CoolL, PhillipsJ, RineJ (2001) Overlapping functions of the yeast oxysterol-binding protein homologues. Genetics 157 : 1117–1140.
45. FossEJ, RadulovicD, ShafferSA, GoodlettDR, KruglyakL, et al. (2011) Genetic Variation Shapes Protein Networks Mainly through Non-transcriptional Mechanisms. Plos Biology 9: e1001144.
46. KhanZ, BloomJS, GarciaBA, SinghM, KruglyakL (2009) Protein quantification across hundreds of experimental conditions. Proceedings of the National Academy of Sciences of the United States of America 106 : 15544–15548.
47. AlbertFW, TreuschS, ShockleyAH, BloomJS, KruglyakL (2014) Genetics of single-cell protein abundance variation in large yeast populations. Nature 506 : 494–497.
48. Dykens JA, Will Y (2008) Drug-induced mitochondrial dysfunction. Hoboken, NJ: John Wiley & Sons xvii, 616 p., 612 p., of plates p
49. Boy-MarcotteE, PerrotM, BussereauF, BoucherieH, JacquetM (1998) Msn2p and Msn4p control a large number of genes induced at the diauxic transition which are repressed by cyclic AMP in Saccharomyces cerevisiae. Journal of Bacteriology 180 : 1044–1052.
50. SchmittAP, McEnteeK (1996) Msn2p, a zinc finger DNA-binding protein, is the transcriptional activator of the multistress response in Saccharomyces cerevisiae. Proceedings of the National Academy of Sciences of the United States of America 93 : 5777–5782.
51. GoldsteinDB (1984) The effects of drugs on membrane fluidity. Annu Rev Pharmacol Toxicol 24 : 43–64.
52. StoriciF, LewisLK, ResnickMA (2001) In vivo site-directed mutagenesis using oligonucleotides. Nat Biotechnol 19 : 773–776.
53. Burke D, Dawson D, Stearns T (2000) Methods in Yeast Genetics: A Cold Spring Harbor Laboratory Course Manual: CSHL Press.
54. MoranoKA, KlionskyDJ (1994) Differential effects of compartment deacidification on the targeting of membrane and soluble proteins to the vacuole in yeast. J Cell Sci 107 (Pt 10): 2813–2824.
55. VidaTA, EmrSD (1995) A new vital stain for visualizing vacuolar membrane dynamics and endocytosis in yeast. J Cell Biol 128 : 779–792.
56. SilvermanSJ, PettiAA, SlavovN, ParsonsL, BriehofR, et al. (2010) Metabolic cycling in single yeast cells from unsynchronized steady-state populations limited on glucose or phosphate. Proc Natl Acad Sci U S A 107 : 6946–6951.
Štítky
Genetika Reprodukční medicínaČlánek vyšel v časopise
PLOS Genetics
2014 Číslo 12
- Kazuistika – Perspektivy využití precizované medicíny v rámci personalizované specifické terapie onkologických pacientů
- Nobelova cena za chemii pro genetické nůžky: Objev, který změní naši budoucnost?
- Technologie na bázi RNA v klinické praxi: od přebarvených petúnií k terapii vzácných a dosud jen obtížně léčitelných chorob u lidí
- „Nepředstavovali jsme si, že náš výzkum povede přímo ke vzniku nových léků, dokonce ještě za našeho života“
- Bezplatné služby pro diagnostiku ATTRv amyloidózy pro kardiology
Nejčtenější v tomto čísle
- Tetraspanin (TSP-17) Protects Dopaminergic Neurons against 6-OHDA-Induced Neurodegeneration in
- Maf1 Is a Novel Target of PTEN and PI3K Signaling That Negatively Regulates Oncogenesis and Lipid Metabolism
- The IKAROS Interaction with a Complex Including Chromatin Remodeling and Transcription Elongation Activities Is Required for Hematopoiesis
- Echoes of the Past: Hereditarianism and
Zvyšte si kvalifikaci online z pohodlí domova
Mazová zátka a její řešení
nový kurzVšechny kurzy