
Epistatic Adaptive Evolution of Human Color Vision
Mapping the genotype-phenotype relationship is necessary to understand how variable phenotypes have evolved in nature. The blue-sensitive visual pigment in human (human S1) evolved from the UV-sensitive pigment in the Boreoeutherian (or Boreotherian) ancestor (AncBoreotheria S1) by seven mutations. Mutagenesis experiments reveal that 4,008 (∼80%) of all 5,040 possible evolutionary trajectories connecting from AncBoreotheria S1 to human S1 are terminated prematurely. Quantum chemical analyses suggest that the premature termination of trajectories was caused by containing a dehydrated nonfunctional pigment. Phylogenetic analysis further suggests that the blue-sensitivity was achieved only gradually and almost exclusively by the seven non-additively interacting amino acids. During the period between 45 and 30 My ago, human S1 was in the final stage of developing its blue-sensitivity. This was the time when two red-sensitive pigments appeared by gene duplication and one of them became green-sensitive. Trichromatic color vision in the human lineage was fully developed by 30 My ago by interprotein epistasis among the three visual pigments. Manipulation of the genetically engineered ancestral molecule is the key to recapitulate the evolution of phenotypic adaptation and that of epistatic interaction separately.
Published in the journal:
. PLoS Genet 10(12): e32767. doi:10.1371/journal.pgen.1004884
Category:
Research Article
doi:
https://doi.org/10.1371/journal.pgen.1004884
Summary
Mapping the genotype-phenotype relationship is necessary to understand how variable phenotypes have evolved in nature. The blue-sensitive visual pigment in human (human S1) evolved from the UV-sensitive pigment in the Boreoeutherian (or Boreotherian) ancestor (AncBoreotheria S1) by seven mutations. Mutagenesis experiments reveal that 4,008 (∼80%) of all 5,040 possible evolutionary trajectories connecting from AncBoreotheria S1 to human S1 are terminated prematurely. Quantum chemical analyses suggest that the premature termination of trajectories was caused by containing a dehydrated nonfunctional pigment. Phylogenetic analysis further suggests that the blue-sensitivity was achieved only gradually and almost exclusively by the seven non-additively interacting amino acids. During the period between 45 and 30 My ago, human S1 was in the final stage of developing its blue-sensitivity. This was the time when two red-sensitive pigments appeared by gene duplication and one of them became green-sensitive. Trichromatic color vision in the human lineage was fully developed by 30 My ago by interprotein epistasis among the three visual pigments. Manipulation of the genetically engineered ancestral molecule is the key to recapitulate the evolution of phenotypic adaptation and that of epistatic interaction separately.
Introduction
The chance of survival of novel mutations is affected strongly by the molecular background in which they appear [1]–[3]. To understand the evolutionary dynamics of these mutations, it is necessary to characterize the phenotypic variation they generate. For vertebrates, however, understanding the genotype-phenotype relationship remains challenging because of technical difficulties in connecting the structure and function of evolving proteins and in evaluating non-additive (epistatic) interactions among amino acids unambiguously [3]–[7].
About 90% of human populations detect the entire range of visible color using three types of cone pigments: short wavelength-sensitive (SWS1) pigment (human S1), middle wavelength-sensitive (MWS) pigment (human M) and long wavelength-sensitive (LWS) pigment (human L), which detect light maximally (λmax) at 414, 530 and 560 nm, respectively [8], [9]. Human S1 can be made UV-sensitive (λmax = 360 nm) by introducing seven mutations T46F, L49F, F52T, L86F, P93T, G114A and T118S, whereas the UV-sensitive pigment in mouse (Mus musculus) (mouse S1, λmax = 359 nm) can be made blue-sensitive (λmax = 411 nm) by the seven reverse mutations; however, when the seven mutations are introduced into mouse S1 individually, none of the individual changes produce any λmax-shift [10], showing an extreme case of epistatic interactions. Largely free from the technical difficulties in evaluating the genotype-phenotype relationships as well as their strong associations to variable ecological and physiological environments, visual pigments make vertebrate vision a powerful model to directly study the dynamics of genotype-phenotype relationship during phenotypic adaptation [11]–[13]. The crystal structure of the visual pigments in bovine rod photoreceptors [14], [15] and a large dataset on ecology of vision [16]-[18] also allow us to link the chemistry, genetics, organismal biology and ecology of vertebrate vision.
Regulated primarily by the lens [19], photons with wavelengths shorter than 400 nm do not reach the retinas of some primates, including human, and sciurid rodents, whereas UV light does reach the retinas of mouse, rat and other mammals [19], [20]. As it may be suspected from these observations, SWS1 pigments in most vertebrate ancestors, including the mammalian ancestor, had λmax values of 360 nm and were UV-sensitive [21]. Subsequently, in the lineage leading to humans, the UV-transmitting lens evolved into a UV-absorbing lens [20]. To adapt to the UV-free retinal environment [19], [20], [22], human S1 switched from detecting UV to absorbing blue light during the last 90 million years (My) [21].
Making the UV-sensitive mouse S1 blue-sensitive may give an impression that human S1 evolved from the SWS1 pigment of the Boreoeutherian (or Boreotherian) ancestor (AncBoreotheria S1) by F46T, F49L, T52F, F86L, T93P, A114G and S118T. To prove this, however, we have to show that these mutations actually switched the λmax of AncBoreotheria S1 into that of human S1. Even if such critical mutations are identified, it is still unclear how they have accumulated mutations and modified the λmax of AncBoreotheria S1 during evolution. To address these questions, we engineer AncBoreotheria S1, construct all possible evolutionary trajectories that connect AncBoreotheria S1 and human S1, recapitulate the evolutionary changes in the epistatic interaction and the λmax separately; in this way, we establish the genotype-phenotype relationship unambiguously during the entire process of human S1 evolution. We then consider how human ancestors acquired the present trichromatic color vision based on the three cone pigments.
Results
Evolutionary trajectories
Based on the phylogenetic tree of 33 representative SWS1 pigments sampled from a wide range of vertebrate species (Fig. 1), the amino acid sequences at different nodes have been inferred using PAML [23] and AncBoreotheria S1 was reconstructed (for details, see Methods). The in vitro assay shows that AncBoreotheria S1 has a λmax (or simply λ) of 357 nm (Fig. 2A, in black spectrum) and its mutant with F46T, F49L, T52F, F86L, T93P, A114G and S118T has a λmax (λF46T/F49L/T52F/F86L/T93P/A114G/S118T) of 411 nm (S1 Table). These results, indeed, demonstrate that human S1 evolved from AncBoreotheria S1 (or AncBoreotheria (P357)) by accumulating the seven mutations.


To accommodate seven sequential amino acid replacements, there are 7! ( = 5,040) possible evolutionary trajectories. We traced all these trajectories by introducing seven single and all 120 possible combinations of the seven mutations into AncBoreotheria S1 and evaluating their effects on the λmax-shift (or Δλmax). The in vitro assays revealed that 60 out of 127 mutants could not make functional visual pigments, making 4,008 possible evolutionary paths prematurely terminated (S1 Fig.). These incomplete trajectories are caused most often by T52F primarily because if this mutation occurs first, the evolutionary path is immediately terminated. The phenotypic difference between AncBoreotheria S1 and the T52F mutant is obvious; that is, compared with the absorption spectrum of AncBoreotheria S1 with a clear peak at 357 nm, the T52F mutant does not have any absorption peak for the entire region of visible light, showing that the mutant is structurally unstable (Fig. 2A, in red spectrum). If F46T, F49L, F86L, T93P, A114G or S118T occur first, the numbers of trajectories that can accumulate the remaining 6 mutations are 134, 74, 252, 348, 102 and 122, respectively, with various magnitudes of Δλmax values during evolution (S2 Fig.). Therefore, a total of 1,032 (20.47%) out of the 5,040 possible trajectories are evolutionarily accessible.
Quantum chemistry of T52F
Interestingly, mouse S1 has a λmax of 359 nm and is UV-sensitive like AncBoreotheria S1 (Fig. 2B, in black spectrum), but its T52F mutant is functional (Fig. 2B, in red spectrum) [10]. At the chemical level, each visual pigment consists of a mixture of pigments with protonated Schiff base nitrogen-linked 11-cis-retinals (PSBR) and those with unprotonated Schiff base nitrogen-linked 11-cis-retinals (SBR) [24]. An SWS1 pigment is UV-sensitive when SBR is more stable than PSBR; otherwise it is blue-sensitive. Moreover, the relative stability of a pigment with SBR and PSBR depends strongly on the water molecules around the 11-cis-retinal [24]–[26]. The cause for the contrasting roles of T52F in AncBoreotheria S1 and mouse S1 can be seen in two steps.
First, when they are hydrated, AncBoreotheria S1, mouse S1, and their T52F mutants with SBR are all 7 kcal/mol more stable than their PSBR counterparts, which show that all of these pigments are UV-sensitive. In the dehydrated states, the pigments with PSBR achieve similar H-bond interactions; much to our surprise, however, the pigments with SBR become nonfunctional because E113 moves to the protein surface (Fig. 3A). To attain a functional pigment, therefore, water molecules that keep E113 near the 11-cis-retinal are required (Fig. 3B). Second, mouse S1 and AncBoreotheria S1 consist of different types of water channels that allow water molecules to flow from the surface to the interior of the pigments: mouse S1 has two surface openings at T52 and V79 (Figs. 3C, D), but AncBoreotheria S1 has basically one opening at site 52 because of bulky I79. When T52F is introduced into AncBoreotheria S1, the bulky F52 blocks its only water channel; however, in mouse S1 with T52F, the channel opening through V79 is still operational. Hence, the mouse S1 mutant can still be hydrated, but the AncBoreotheria S1 mutant becomes dehydrated and is nonfunctional. In general, such disruptions in water trafficking affecting the H-bond network [24] near the 11-cis-retinal seem to be a major cause for generating nonfunctional pigments.

The mode of phenotypic adaptation of human S1
It would be ideal if we could identify the evolutionary trajectory that actually took place in the evolution of human S1. At present, we can consider the SWS1 pigments of nine primate species for this purpose. A composite evolutionary tree of these pigments and those of six other mammalian species reveals that 1) T93P and A114G, 2) F86L, 3) F49L and S118T and 4) F46T and T52F occurred in that order. Hence, we can identify eight most likely trajectories for describing human S1 evolution (Fig. 4). Then, going back to our mutagenesis results and using the divergence times estimated by others [27], [28], we can see that the ancestral human S1 remained UV-sensitive until about 80 My ago and its λmax increased 20 nm in the next 5 My and another 20 nm in the next 30 My, thus reaching 400 nm by 45 My ago and, finally, the current λmax value was achieved by 30 My ago (Fig. 5, in black and broken trajectories).


When the seven critical amino acid replacements are started with T93P or A114G, the number of trajectories total 450. The eight most likely trajectories are clustered in the center of the 450 trajectories and are characterized by the gradual increase in their λmax values, each step consisting with |Δλmax|<25 nm. Further support for this conclusion comes from an analysis of the relatively smaller variance for the amount of change for pathways predicted by the phylogeny as compared with the distribution of all possible variances (S3 Fig.). The gradual λmax-shifts might have been necessary because our ancestors switched from their nocturnal life to a diurnal-life style by adjusting their vision slowly to various twilight conditions. The slowly evolving human S1 implies that the evolutionarily acceptable 1,032 trajectories can be subdivided further depending on whether they are characterized by |Δλmax|<25 nm at every evolutionary step (335 paths, 32.5%) or not (67.5%). In this sense, the evolutionary trajectory of human S1 might have been any one of the 335 evolutionary trajectories (6.65% of 5,040 possible trajectories).
The molecular basis of the phenotypic adaptation of human S1
Knowing the λmax of AncBoreotheria S1 and those of all 127 mutant pigments allows us to evaluate the Δλmax values caused by F46T (θ46)… S118T (θ118) as well as those of two-way (θ46×49, θ46×52… θ114×118)… and seven-way (θ46×49×52×86×93×114×118) interactions. To follow this method, it becomes necessary to infer the λmax values of 60 nonfunctional pigments. This is possible because when a new mutation prevents the formation of a functional pigment or when it actually does not shift the λmax, the highest level of an epistatic effect can be regarded as zero and the λmax of the mutant pigment can be estimated (see Statistical Analyses, Methods, S1 Table; unstable in bold italics). One special example of this is θ52 = 0, which was established using the mouse T52F mutant (Fig. 2B). This procedure is required if we want to obtain all 120 epistatic interaction terms; but, as we will see below, the λmax-shift of each evolutionary path can be recapitulated without obtaining all individual θ values.
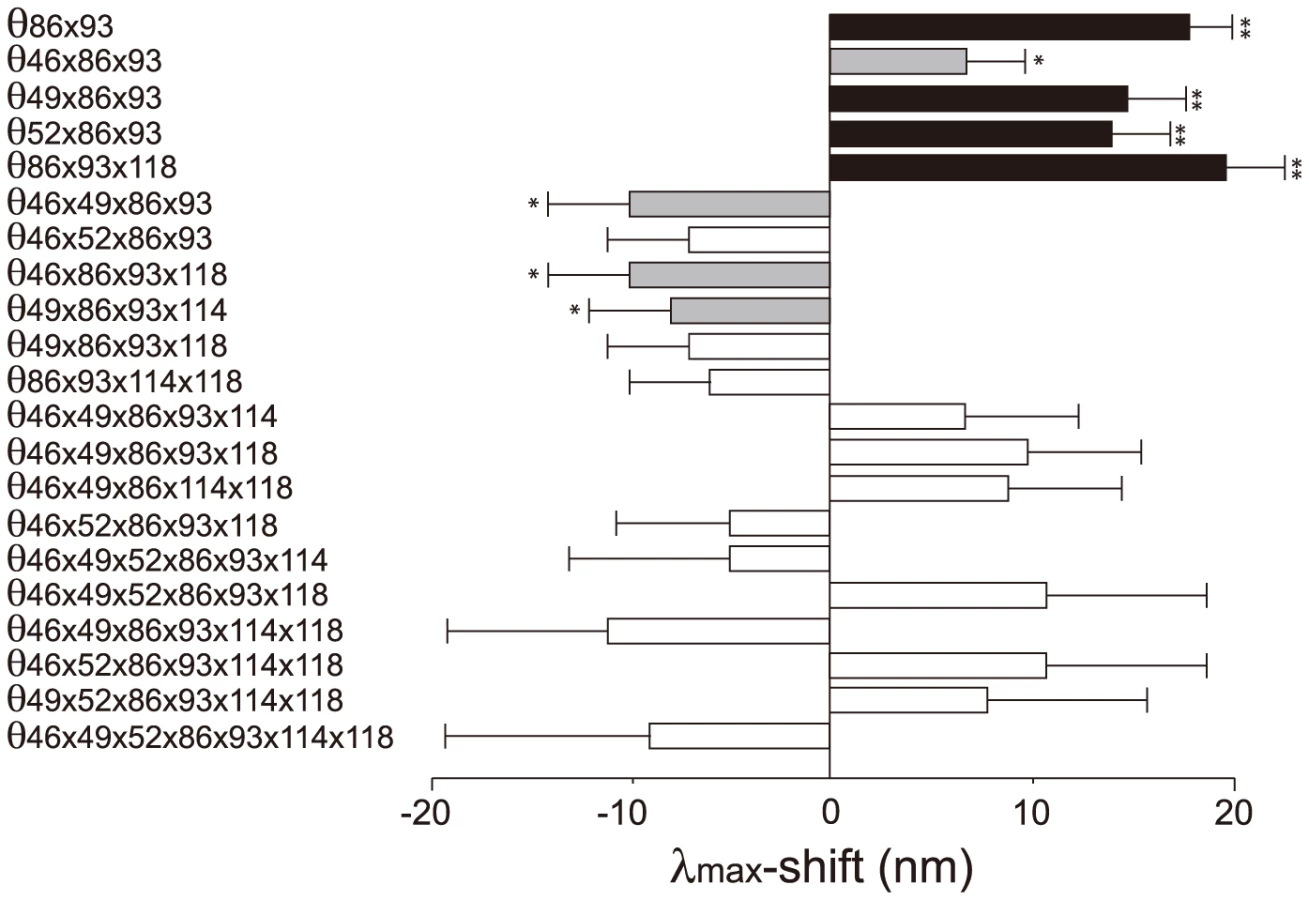
The 127 θ values determined from 127 linear equations show two things. First, the individual mutational effects on the Δλmax are very close to zero, i. e. θ46 = −2, θ49 = −3, θ52 = θ86 = 0, θ93 = 2, θ114 = θ118 = 1 (S2 Table). Second, 21 out of 120 interaction terms show that |θ| ≥5 nm, most of which (20 out of 21) reflect significant influences of the interaction between F86L and T93P; in particular, F86L is always involved in generating measurable epistatic interactions (Fig. 6). Consequently, the λmax values for the eight most likely trajectories are explained mostly by the epistatic interactions alone (Fig. 5, in red trajectories). As it was indicated earlier, the evolution of the λmax of human S1 during the last 90 My can be recapitulated without estimating all θ values individually. For example, when we consider the trajectory with the most conservative functional change, i. e. the smallest |Δλmax| values, each step of the observed phenotypic change can be explained solely by epistatic effects (S3 Table).
Discussion
Human S1 evolved gradually from AncBoreotheria S1. The blue-sensitive pigment in African clawed frog (Xenopus laevis) (frog S1, λmax = 425 nm) also evolved from the UV-sensitive pigment of the Amphibian ancestor (AncAmphibian S1, λmax = 359 nm; Fig. 1) by accumulating F86M, V91I, T93P, V109A, E113D, L116V and S118T [29]. Again, because of their small individual mutational effects on the λmax-shift [29], the phenotypic evolution of frog S1 occurred mostly by epistatic interactions. Living in shallow waters, the light environments of the frog ancestors must have been similar to those of human ancestors. Hence, it is likely that the transition from the λmax of AncAmphibian S1 to that of frog S1 occurred gradually.
SWS1 pigments can also take dramatically different modes of evolution. For example, the blue-sensitive pigment in scabbardfish (Lepidopus fitchi) (scabbardfish S1, λmax = 423 nm) evolved from the UV-sensitive pigment in the euteleost ancestor (AncEuteleost S1, Fig. 1) by the deletion of F86 [26]. Similarly, the blue-sensitive pigments in bovine (Bos taurus) and wallaby (Macropus eugenii) also evolved essentially in one step by single mutations F86Y [5], [30], [31]. In addition, C90S makes the UV-sensitive pigments of zebra finch (Taeniopygia guttata) and budgerigar (Melopsittacus undulates) blue-sensitive [32], [33], whereas S90C transforms the blue-sensitive pigments of chicken (Gallus gallus) and pigeon (Columba livia) into UV-sensitive pigment [32].
These observations seem to suggest that there are two distinct modes of evolution among SWS1 pigments. However, even when major λmax-shifts are caused by single mutations, epistatic interactions cannot be ignored. For example, the deletion of F86 in AncEuteleost S1 seems to increase the λmax by 59 nm, but the same mutation in the UV-sensitive pigment in a vertebrate ancestor (AncGnathostome S1, λmax = 360 nm; Fig. 1) increases the λmax only by 19 nm [26]. Hence, despite the same UV-sensitivity of the two ancestral pigments, their molecular backgrounds are critically different, causing different epistatic effects on the λmax-shift. Similarly, S90C causes a wide range of λmax-shifts, between -46 nm and 0 nm, depending on SWS1 pigments manipulated [10], [21], [31]–[34].
During the period between 45 and 30 My ago, the last two amino acid replacements (F46T and T52F) were in progress in the ancestral human S1 pigment (Fig. 5). This was the time when the LWS pigment in the Boreotherian ancestor (or AncBoreotheria L) achieved two critical changes. First, two AncBoreotheria L copies were generated by a gene duplication event and, second, one of them retained the ancestral λmax (560 nm) and became modern human L and the other decreased its λmax to 530 nm by accumulating three mutations (S180A, Y277F and T285A) and became the modern human M [35]–[37]. At present, the order of S180A, Y277F and T285A in AncBoreotheria L is not known. However, mutagenesis analyses of AncBoreotheria L show that θ180 = −5, θ277 = −10, θ285 = −17, θ180×277 = 0, θ180×285 = −2, θ277×285 = 1 and θ180×277×285 = 4 and the sum of these values is −29 nm, which fully explains the evolution of human M [36]. Hence, if S180A and Y277F occurred before T285A, the λmax of the mutant pigment was 545 nm; on the other hand, if T285A was included in the first two mutations, the λmax values of the mutants were 532–538 nm, much similar to that of human M.
Eventually, we are interested in another phenotype that is synthesized by human S1, human M and human L – color vision. Color vision may be best characterized by wavelength discrimination, which describes the minimum wavelength difference (Δλ) along a wide range of wavelengths that human, or any experimental animals, can discriminate [13], [17], [38]. A typical trichromat having the three cone pigments exhibits Δλ<3 nm, sometimes Δλ<1 nm, along the wavelength between 450 and 625 nm (Fig. 7, Δλwith white circles); in contrast, deuteranopes or protanopes, who are missing functional human M or human L, respectively, have Δλ<5 nm only at around 500 nm (Fig. 7, Δλ with black circles for a deuteranope) [17], [39]. Incorporating one or two of the three critical amino acids into AncBoreotheria L, our ancestors have achieved different levels of anomalous trichromatic color vision, conditions known as deuteranomaly, who achieve intermediate wavelength discrimination functions between those of deuteranopes and trichromats. That is, deuteranomalous people can discriminate the wavelength outsides of 500 nm, particularly at around 600 nm, much better than deuteranopes (e.g. [40]). Therefore, as the three critical mutations accumulate in one of the duplicated AncBoreotheria L pigments, the U-shaped discrimination function of the human ancestor started to become more flat and eventually reached the more flat discrimination function of modern trichromats (Fig. 7).

The evolution of human S1 could have taken any one of a small proportion of trajectories (335 out of 5,040 possible trajectories, or 6.65%). This observation is consistent with the results of epistatic adaptive evolutionary studies such as antibiotic resistance [2], drug resistance [41], coenzyme evolution [2], [42] and coevolution of two ecotypes [43] in microbial systems as well as the evolution of hormone receptors [7], visual pigments [44] and hemoglobins [45] in vertebrates. However, one important implication of epistasis, often neglected, is that forward and reverse mutations can depict dramatically different epistatic interactions, leading us to erroneous conclusions on the mechanisms of phenotypic adaptation [4], [5]. To obtain the correct molecular mechanism of phenotypic adaptation, therefore, it is critical not only to identify appropriate ancestral molecules, engineer and manipulate them but also to recapitulate the evolution of epistatic interactions.
Materials and Methods
Ethics statement
The project does not involve any live animals and has been approved by the Institutional Animal Care and Use Committee of the Emory University, in compliance with the USA Public Health Service Policy on Human Care and Use of Laboratory Animals.
Reconstruction of the ancestral SWS1 pigment
To infer the amino acid sequences at various ancestral pigments, we have constructed a composite phylogenetic tree of 33 representative SWS1 pigments (Fig. 1). Using these sequences and those of RH1 pigment of bovine (Bos Taurus; M21606), RH2 pigment of goldfish (Carassius auratus; L11865) and SWS2 pigment of zebrafish (Danio rerio; AB087809) as the outgroup, we inferred the amino acid sequences of SWS1 pigments at various nodes of the phylogenetic tree using PAML [23]. The SWS1 pigments of 33 vertebrate species have been considered were as follows: lamprey (Lamptera marinus; U67123), goldfish (C. auratus; D85863), zebrafish (D. rerio; AB087810), scabbardfish (Lepidopus fitchi; FJ443126), tilapia (Oreochromis niloticus; AF191221), cichlid-Mzeb (Maylandia zebra; AF191219), bluefin killifish (Lucania goodei; AY296735), medaka (Oryzias latipes; AB223058), Pacific saury (Cololabis saira; KP099197), toothfish (Dissostichus mawsoni; AY927651), lampfish (Stenobrachius leucepsarus; FJ443127), frog (Xenopus laevis; U23463), salamander (Ambystoma tigrinum; AF038948), zebra finch (Taeniopygia guttata; AF222331), canary (Serinus canaria; AJ277922), budgerigar (Melopsittacus undulatus; Y11787), pigeon (Columba livia; AF149234), chicken (Gallus gallus; M92039), anole (Anolis carolinensis; AF134192), gecko (Gekko gekko; AY024356), sunbeam (Xenopeltis unicolor; FJ497234), human (Homo sapiens; M13295), macaque (Macaca fascicularis; AF158977), squirrel monkey (Saimiri sciureus; U53875), marmoset (Callithrix jacchus; L76201), Bovine (Bos taurus; U92557), mouse (Mus musculus; U49720), rat (Rattus norvegicus; U63972), squirrel (Sciurus carolinensis; DQ302163), guinea pig (Cavia porcellus; AY552608), elephant (Loxodonta africana; AY686753), wallaby (Macropus eugenii; AY286017) and dunnart (Sminthopsis crassicaudata; AY442173).
AncBoreotheria S1 differs from human S1 and the previously engineered ancestral mammalian pigment (denoted as pigment g) considering a much smaller number of SWS1 pigments [21], at 25 (S4 Fig.) and 9 amino acid sites, respectively. Hence, we reconstructed AncBoreotheria S1 by introducing a total of 9 amino acid changes into pigment g. It should be noted that the N terminus (sites 1–30) and C terminus (sites 313–348) of pigment g and AncBoreotheria S1 are taken from those of the SWS1 pigment of Anolis carolinensis (anole S1). This is done to standardize the effects of variable amino acids at the N - and C-termini of SWS1 pigments on the λmax-shift. This procedure is justified because when the two segments of mouse S1 are replaced by those of human S1, anole S1 and the orthologous goldfish pigment, their λmax values are 359–360 nm, showing that the sequence variation in the N and C termini do not affect the spectral tuning in SWS1 pigments [21].
Mutant opsins were generated by using QuickChange site-directed mutagenesis kits (Stratagene, La Jolla, CA). To rule out spurious mutations, the DNA fragment was sequenced by cycle sequencing reactions using the Sequitherm Excel II long-read kits (Epicentre Technologies, Madison, WI) with dye-labeled M13 forward and reverse primers. Reactions were run on a LI-COR (Lincoln, NE) 4300LD automated DNA sequencer.
To consider the phylogeny of 15 mammalian species, the SWS1 pigments of six additional species have been included: chimpanzee (Pan troglodytes; AF039433), gorilla (Gorilla gorilla gorilla; XM_004046176), orangutan (Pongo abelii; XM_002818421), gibbon (Nomascus leucogenys; XM_003261297), tarsier (Tarsius bancanus; AB111463) and Aye-Aye (Daubentonia madagascariensis; EF667285). TimeTree of Life web server (www.timetree.org) shows that human diverged from macaque, marmoset, tarsier, Aye-Aye and mouse about 30, 45, 75, 80 and 90 My ago, respectively [27], [28]. Then, following the parsimony assumption that minimizes the number of amino acid replacements, the possible evolutionary pathways for the seven amino acid replacements have been determined.
The in vitro assay
The opsin cDNA clones were expressed in COS1 cells by transient transfection [46]. The pigments were regenerated by incubating the opsins with 11-cis-retinal (a gift from Dr. Rosalie K. Crouch at Storm Eye Institute, Medical University of South Carolina and National Eye Institutes) and were purified using immobilized 1D4 (The Culture Center, Minneapolis, MN) in buffer W1 (50 mM N-(2-hydroxyethyl) piperazine-N′-2-ethanesulfonic acid (HEPES) (pH 6.6), 140 mM NaCl, 3mM MgCl2, 20% (w/v) glycerol and 0.1% dodecyl maltoside). UV visible spectra were recorded at 20°C using a Hitachi U-3000 dual beam spectrophotometer. Visual pigments were bleached for 3 min using a 60 W standard light bulb equipped with a Kodak Wratten #3 filter at a distance of 20 cm. Data were analyzed using Sigmaplot software (Jandel Scientific, San Rafael, CA).
Statistical analyses
To evaluate all 127 θ values, it is necessary to obtain the λmax values of the 60 structurally unstable mutant pigments. Take AncBoreotheria S1 with a single mutation T52F as an example. The T52F mutant is nonfunctional and, consequently, “cannot” shift the λmax value of AncBoreotheria S1. In fact, when T52F is introduced into mouse S1, the mutant pigment is functional and does not cause any λmax-shift [10]. Therefore, nm and nm. AncBoreotheria S1 with F46T and A114G is another example. The single mutation analyses show that nm with nm and nm with nm; when the two mutations are combined, they “cannot” shift the λmax and, therefore, nm. This procedure and logic also can be justified by conducting the analysis on a data set that contained only the λmax values for structurally stable pigments. In this reduced analysis not all effects and interactions can be estimated, but the corresponding θ values obtained from the two methods are identical.
The λmax values of the 127 SWS1 mutant pigments were expressed as that of AncBoreotheria S1 (λ) plus the effects of the appropriate single and multiple amino acid changes on the λmax-shift (denoted by a sum of θ values). These θ values were estimated by solving a total of 128 simultaneous linear equations with the ancestral λ and 127 mutant values .
Estimation of effects and interactions of amino acid changes on the λmax values were conducted using matrix algebra and linear statistical models [47]. The rows of the coefficient matrix C represent the sequences and the columns represent the effects and interaction to be estimated. The coefficients in the first column of C are all 1s indicating the ancestral sequence is included in all derived sequences. The elements of the remaining columns have the coefficients (0 or 1) for the individual effects and interactions present in the sequence designated by the row.
The parameters are designated in the column vector X, while column vector Y contains the observed λmax values corresponding to the pigments. The simultaneous equations for the observed λmax values are expressed in matrix algebra as:

And the estimates of the effects and interactions are obtained by solving the equation for X, i.e.,
Since the estimates are linear functions of the observed λmax values then the variance of each estimate is a function of the variances of the λmax values and the coefficient associated with each parameter. For this analysis the variances for λmax are assumed to be 1 and covariance 0. Given the variance-covariance matrix for Y is V then the standard errors of the estimates are on the diagonal of Se.

Modeling of protein structures
The structures of AncBoreotheria S1 and mouse S1 pigments were obtained by 1) applying homology modeling (Modeller 9v7, www.salilab.org/modeller) to bovine rhodopsin (pdb code: 1U19), 2) adding the missing hydrogen atoms, water molecules, and 11-cis-retinal, and 3) optimizing them first at pure AMBER96 force field level (http://ambermd.org) and then using hybrid quantum mechanical/molecular mechanical (QM/MM) calculations in the ONIOM electronic embedding scheme (QM = B3LYP/6–31G*; MM = AMBER) [24]. The QM part of the calculations involves 11-cis-retinal with the covalently bound Schiff base (SB) nitrogen, or NH moiety, and E113 along with hydrogen link atoms, in which either the SB nitrogen or one of the carboxylic O atoms of the E113 is protonated, resulting retinal with protonated SB nitrogen (or PSBR) or retinal with unprotonated SB nitrogen (or SBR), respectively.
Supporting Information
Zdroje
1. WeinreichDM, WatsonRA, ChaoL (2005) Perspective: Sign epistasis and genetic constraint on evolutionary trajectories. Evolution 59 : 1165–1174.
2. WeinreichDM, DelaneyNF, DepristoMA, HartlDL (2006) Darwinian evolution can follow only very few mutational paths to fitter proteins. Science 312 : 111–114.
3. LunzerM, GoldingGB, DeanAM (2010) Pervasive cryptic epistasis in molecular evolution. PLoS Genet 6: e1001162.
4. YokoyamaS (2012) Synthesis of Experimental Molecular Biology and Evolutionary Biology: An Example from the World of Vision. Bioscience 62 : 939–948.
5. YokoyamaS (2013) Synthetic biology of phenotypic adaptation in vertebrates: the next frontier. Mol Biol Evol 30 : 1495–1499.
6. HarmsMJ, ThorntonJW (2010) Analyzing protein structure and function using ancestral gene reconstruction. Curr Opin Struct Biol 20 : 360–366.
7. HarmsMJ, ThorntonJW (2013) Evolutionary biochemistry: revealing the historical and physical causes of protein properties. Nat Rev Genet 14 : 559–571.
8. Hunt RWG, Pointer MR (2011) Measuring colour, Fourth Edition. New York: Wiley. 492 p.
9. BowmakerJK, DartnallHJ (1980) Visual pigments of rods and cones in a human retina. J Physiol 298 : 501–511.
10. ShiY, RadlwimmerFB, YokoyamaS (2001) Molecular genetics and the evolution of ultraviolet vision in vertebrates. Proc Natl Acad Sci U S A 98 : 11731–11736.
11. YokoyamaS, YokoyamaR (1996) Adaptive evolution of photoreceptors and visual pigments in vertebrates. Annu Rev Ecol Syst 27 : 543–567.
12. YokoyamaS (1997) Molecular genetic basis of adaptive selection: examples from color vision in vertebrates. Annu Rev Genet 31 : 315–336.
13. JacobsGH, WilliamsGA, CahillH, NathansJ (2007) Emergence of novel color vision in mice engineered to express a human cone photopigment. Science 315 : 1723–1725.
14. PalczewskiK, KumasakaT, HoriT, BehnkeCA, MotoshimaH, et al. (2000) Crystal structure of rhodopsin: A G protein-coupled receptor. Science 289 : 739–745.
15. OkadaT, SugiharaM, BondarAN, ElstnerM, EntelP, et al. (2004) The retinal conformation and its environment in rhodopsin in light of a new 2.2 Å crystal structure. J Mol Biol 342 : 571–583.
16. Walls GL (1942) The vertebrate eye and its adaptive radiation. Bloomfield Hills, MI: Cranbrook. 785 p.
17. Jacobs GH (1981) Comparative color vision. New York: Academic Press. 209p.
18. Lythgoe JN (1979) The ecology of vision. Oxford: Clarendon. 244p.
19. BoettnerEA, WolterJR (1962) Transmission of the ocular media. Invest Ophthalmol Vis Sci 1 (6): 776–783.
20. DouglasRH, JefferyG (2014) The spectral transmission of ocular media suggests ultraviolet sensitivity is widespread among mammals. Proc R Soc B Biol Sci 281 : 20132995.
21. ShiY, YokoyamaS (2003) Molecular analysis of the evolutionary significance of ultraviolet vision in vertebrates. Proc Natl Acad Sci U S A 100 : 8308–8313.
22. DillonJ, ZhengL, MerriamJC, GaillardER (2000) Transmission spectra of light to the mammalian retina. Photochem Photobiol 71 : 225–229.
23. YangZ (2007) PAML 4: phylogenetic analysis by maximum likelihood. Mol Biol Evol 24 : 1586–1591.
24. AltunA, MorokumaK, YokoyamaS (2011) H-bond network around retinal regulates the evolution of ultraviolet and violet vision. ACS Chem Biol 6 : 775–780.
25. AltunA, YokoyamaS, MorokumaK (2009) Color tuning in short wavelength-sensitive human and mouse visual pigments: Ab initio Quantum Mechanics/Molecular Mechnics studies. J Phys Chem A 113 : 11685–11692.
26. TadaT, AltunA, YokoyamaS (2009) Evolutionary replacement of UV vision by violet vision in fish. Proc Natl Acad Sci U S A 106 : 17457–17462.
27. PerelmanP, JohnsonWE, RoosC, SeuánezHN, HorvathJE, et al. (2011) A molecular phylogeny of living primates. PLoS Genet 7(3): e1001342.
28. Steiper ME, Young NM (2009) Primates (Primates). In: Hedges SB, Kumar S, editors. The Timetree of Life. New York: Oxford University Press. pp. 482–486.
29. TakahashiY, YokoyamaS (2005) Genetic basis of spectral tuning in the violet-sensitive visual pigment of African clawed frog, Xenopus laevis. Genetics 171 : 1153–1160.
30. CowingJA, PoopalasundaramS, WilkieSE, RobinsonPR, BowmakerJK, et al. (2002) The molecular mechanism for the spectral shifts between vertebrate ultraviolet - and violet-sensitive cone visual pigments. Biochem J 367 : 129–135.
31. FasickJI, AppleburyML, OprianDD (2002) Spectral tuning in the mammalian short-wavelength sensitive cone pigments. Biochemistry 41 : 6860–6865.
32. YokoyamaS, RadlwimmerFB, BlowNS (2000) Ultraviolet pigments in birds evolved from violet pigments by a single amino acid change. Proc Natl Acad Sci U S A 97 : 7366–7371.
33. WilkieSE, RobinsonPR, CroninTW, PoopalasundaramS, BowmakerJK, et al. (2000) Spectral tuning of avian violet - and ultraviolet-sensitive visual pigments. Biochemistry 39 : 7895–7901.
34. DukkipatiA, VoughtBW, SinghD, BirgeRR, KnoxBE (2001) Serine 85 in transmembrane helix 2 of short-wavelength visual pigments interacts with the retinylidene Schiff base counterion. Biochemistry 40 : 15098–15108.
35. YokoyamaS, RadlwimmerFB (2001) The molecular genetics and evolution of red and green color vision in vertebrates. Genetics 158 : 1697–1710.
36. YokoyamaS, YangH, StarmerWT (2008) Molecular basis of spectral tuning in the red - and green-sensitive (M/LWS) pigments in vertebrates. Genetics 179 : 2037–2043.
37. NeitzM, NeitzJ, JacobsGH (1991) Spectral tuning of pigments underlying red-green color vision. Science 252 : 971–974.
38. Kaiser PK, Boynton RM (1996) Human color vision, Second Edition. Washington, DC: Optical Society of America. 652 p.
39. Wright WD (1947) Researches on normal and defective colour vision. St. Louis, Missouri: Mosby. 652 p.
40. KrudyA, LadungaK (2001) Measuring wavelength discrimination threshold along the entire visible spectrum. Period Polytech Mech Eng 45 : 41–48.
41. LozovskyER, ChookajornT, BrownKM, ImwongM, ShawPJ, et al. (2009) Stepwise acquisition of pyrimethamine resistance in the malaria parasite. Proc Natl Acad Sci U S A 106 : 12025–12030.
42. LunzerM, MillerSP, FelsheimR, DeanAM (2005) The biochemical architecture of an ancient adaptive landscape. Science 310 : 499–501.
43. PlucainJ, HindréT, Le GacM, TenaillonO, CruveillerS, et al. (2014) Epistasis and allele specificity in the emergence of a stable polymorphism in Escherichia coli. Science 343 : 1366–1369.
44. YokoyamaS, TadaT, ZhangH, BrittL (2008) Elucidation of phenotypic adaptations: Molecular analyses of dim-light vision proteins in vertebrates. Proc Natl Acad Sci U S A 105 : 13480–13485.
45. NatarajanC, InoguchiN, WeberRE, FagoA, MoriyamaH, et al. (2013) Epistasis among adaptive mutations in deer mouse hemoglobin. Science 340 : 1324–1327.
46. Yokoyama S (2000) Phylogenetic analysis and experimental approaches to study color vision in vertebrates. In: Palczewski K, editor. Methods Enzymol. San Diego, CA: Academic Press pp. 312–325.
47. Graybill F (1961) An introduction to linear statistical models, vol. 1. New York: McGraw-Hill. 463 p.
48. HechtS, ShlaerS (1936) The color vision of dichromats. I. Wavelength discrimination, brightness distribution, and color mixture. J Gen Physiol 20 : 57–82.
49. WrightWD, PittFHG (1934) Hue-discrimination in normal colour-vision. Proc Phys Soc London 46 : 459–473.
Štítky
Genetika Reprodukční medicínaČlánek vyšel v časopise
PLOS Genetics
2014 Číslo 12
- Kazuistika – Perspektivy využití precizované medicíny v rámci personalizované specifické terapie onkologických pacientů
- Nobelova cena za chemii pro genetické nůžky: Objev, který změní naši budoucnost?
- Technologie na bázi RNA v klinické praxi: od přebarvených petúnií k terapii vzácných a dosud jen obtížně léčitelných chorob u lidí
- „Nepředstavovali jsme si, že náš výzkum povede přímo ke vzniku nových léků, dokonce ještě za našeho života“
- Bezplatné služby pro diagnostiku ATTRv amyloidózy pro kardiology
Nejčtenější v tomto čísle
- Tetraspanin (TSP-17) Protects Dopaminergic Neurons against 6-OHDA-Induced Neurodegeneration in
- Maf1 Is a Novel Target of PTEN and PI3K Signaling That Negatively Regulates Oncogenesis and Lipid Metabolism
- The IKAROS Interaction with a Complex Including Chromatin Remodeling and Transcription Elongation Activities Is Required for Hematopoiesis
- Echoes of the Past: Hereditarianism and
Zvyšte si kvalifikaci online z pohodlí domova
Mazová zátka a její řešení
nový kurzVšechny kurzy