-
Články
- Vzdělávání
- Časopisy
Top články
Nové číslo
- Témata
- Kongresy
- Videa
- Podcasty
Nové podcasty
Reklama- Kariéra
Doporučené pozice
Reklama- Praxe
Detection of Pleiotropy through a Phenome-Wide Association Study (PheWAS) of Epidemiologic Data as Part of the Environmental Architecture for Genes Linked to Environment (EAGLE) Study
The Epidemiological Architecture for Genes Linked to Environment (EAGLE) study performed a Phenome-Wide Association Study (PheWAS) to investigate comprehensive associations between a wide range of phenotypes and single-nucleotide polymorphisms using the diverse genotypic and phenotypic data that exists across multiple populations in the National Health and Nutrition Examination Surveys (NHANES), conducted by the Centers for Disease Control and Prevention (CDC). In this study, we replicated known genotype-phenotype associations, identified genotypes associated with phenotypes related to previously reported associations, and most importantly, identified a series of novel genotype-phenotype associations. We also identified potential pleiotropy; that is, SNPs associated with more than one phenotype. We explored the features of these PheWAS results, characterizing any potential functionality of the SNPs of this study, determining association results that were found in more than one racial/ethnic group for the same SNP and phenotype, identifying novel direction of effect relationships for SNPs demonstrating potential pleiotropy, and investigating the association results in the context of gene-based biological networks. Through considering the SNP associations on multiple phenotypic outcomes, as well as through exploring pleiotropy, we may be able to leverage the results of PheWAS to uncover more of the complex underlying genomic architecture of complex traits.
Published in the journal: . PLoS Genet 10(12): e32767. doi:10.1371/journal.pgen.1004678
Category: Research Article
doi: https://doi.org/10.1371/journal.pgen.1004678Summary
The Epidemiological Architecture for Genes Linked to Environment (EAGLE) study performed a Phenome-Wide Association Study (PheWAS) to investigate comprehensive associations between a wide range of phenotypes and single-nucleotide polymorphisms using the diverse genotypic and phenotypic data that exists across multiple populations in the National Health and Nutrition Examination Surveys (NHANES), conducted by the Centers for Disease Control and Prevention (CDC). In this study, we replicated known genotype-phenotype associations, identified genotypes associated with phenotypes related to previously reported associations, and most importantly, identified a series of novel genotype-phenotype associations. We also identified potential pleiotropy; that is, SNPs associated with more than one phenotype. We explored the features of these PheWAS results, characterizing any potential functionality of the SNPs of this study, determining association results that were found in more than one racial/ethnic group for the same SNP and phenotype, identifying novel direction of effect relationships for SNPs demonstrating potential pleiotropy, and investigating the association results in the context of gene-based biological networks. Through considering the SNP associations on multiple phenotypic outcomes, as well as through exploring pleiotropy, we may be able to leverage the results of PheWAS to uncover more of the complex underlying genomic architecture of complex traits.
Introduction
Genome-wide association studies (GWAS) have led to the discovery of thousands of variants associated with disease and phenotypic outcomes [1]. GWAS focus on investigating the association between hundreds of thousands to over a million single nucleotide polymorphisms (SNPs) and a single, or small set, of phenotypes and/or disease outcomes. While a wealth of information about the relationship between SNPs and phenotypes has been revealed, an extensive picture of the complex genetic architecture underlying common disease has yet to be elucidated. In addition, the relationship between SNPs and multiple phenotypes (pleiotropy) is only beginning to be explored.
A complementary approach to GWAS are phenome-wide association studies (PheWAS), an approach for investigating the complex networks that exist between human phenotypes and genetic variation, through testing a series of SNPs for association with a large and diverse set of phenotypes [2]–[5]. These analyses can be used to investigate the relationship between genetic variants and presence/absence of disease and phenotypic outcomes as well as the association between genetic variation and intermediate clinically measured variables such as cholesterol levels, blood pressure measurements, and total iron binding capacity. PheWAS can be used to replicate relationships found in GWAS as well as to discover novel associations and generate hypotheses for further research. This approach also allows for the detection of SNPs with pleiotropic effects, where one genetic variant is associated with multiple phenotypes [6], [7]. Investigating the interrelationships that exist between phenotypes as well as between genetic variation and phenotypic variation has the potential for uncovering the complex mechanisms underlying common human phenotypes.
Here we describe a PheWAS using epidemiologic data from the National Health and Nutrition Examination Surveys (NHANES) collected by the Centers for Disease Control and Prevention and accessed by the Epidemiological Architecture for Genes Linked to Environment (EAGLE) study as part of the Population Architecture using Genomics and Epidemiology (PAGE) network [8]. A major focus of the PAGE network is the replication and generalization of GWAS-identified variants in diverse populations, as the majority of published GWAS have been performed in populations of European-descent with little generalization across other racial/ethnic groups. Thus, the PAGE network has pursued investigating associations for genetic variants that have been well replicated in previous research across ancestry groups beyond European-descent.
As a part of PAGE, EAGLE genotyped 80 GWAS-identified variants in two NHANES datasets representing three surveys: NHANES III, collected between 1991 and 1994, and Continuous NHANES which was collected between 1999–2000 and 2001–2002 across three race-ethnicities. The majority of the SNPs within our study were chosen for genotyping based on published lipid trait genetic association studies (51 SNPs), but our study also included SNPs previously associated with phenotypes such as C-reactive protein levels, coronary heart disease, and age-related macular degeneration, with detailed information about these SNPs in S1 Table. Genotyping was performed in a total of 14,998 NHANES participants with DNA samples including 6,634 self-reported non-Hispanic whites, 3,458 self-reported non-Hispanic blacks, and 3,950 self-reported Mexican Americans. Similar to the PheWAS framework outlined by the PAGE study [3], we performed comprehensive unadjusted tests of association for 80 SNPs with 1,008 phenotypes, using linear or logistic regression, depending on the phenotype, stratified by race-ethnicity.
With this approach we replicated many previously reported associations and identified novel genotype-phenotype relationships. We have performed our analyses across multiple genetic ancestries. Most importantly, we have also found indications of pleiotropy for a number of the SNPs included in our investigation. Contrasting the association results for SNPs with multiple phenotypes, interesting direction of effect differences were identified. We further explored the relationship between SNPs, genes, and known biological relationships between the genes, identifying network relationships within these results. The findings in this paper demonstrate that PheWAS is a useful method for both validating findings from GWAS and discovering previously unknown genotype-phenotype relationships in diverse populations, enriching our understanding of the complex underpinnings of human phenotypes.
Results
The study population characteristics for the epidemiologic surveys accessed by EAGLE for this PheWAS are given in Table 1. Across the data collected for NHANES, there were 14,998 participants with DNA samples. More than half of the participants were female (54.12%), and the median age was 43. While ∼44% of the samples were from participants self-described as non-Hispanic white (n = 6,634), more than half of the samples were from participants self-described as either non-Hispanic black (n = 3,458) or Mexican American (n = 3,950). As expected, based on ascertainment and changes in consenting for genetic studies [9], NHANES III had more female and non-European participants with DNA samples compared with Continuous NHANES.
Tab. 1. Study population characteristics. 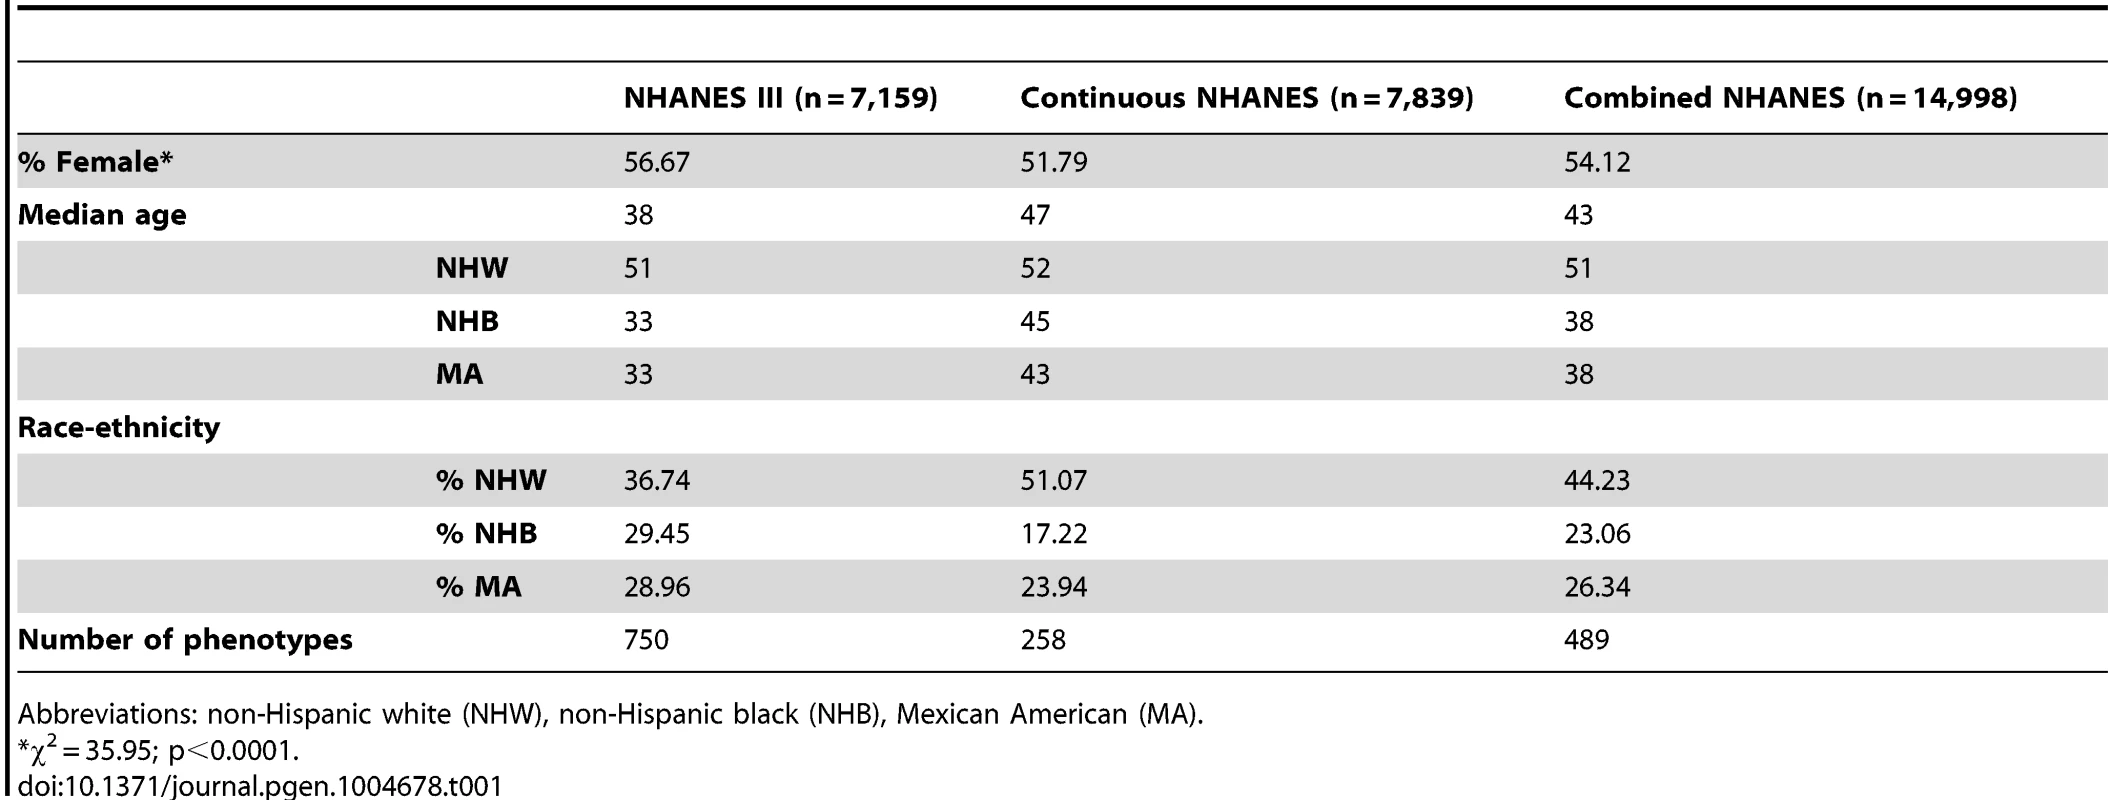
Abbreviations: non-Hispanic white (NHW), non-Hispanic black (NHB), Mexican American (MA). As detailed in the PheWAS workflow diagram shown in Fig. 1, we first identified 184 phenotype classes across NHANES from a total of 1,008 unique variables available for analysis in NHANES III and Continuous NHANES, respectively (Table 2). We then performed unadjusted single SNP tests of association assuming an additive genetic model for each SNP and phenotype (within each phenotype class) in NHANES III and Continuous NHANES. Our criteria for a significant PheWAS result was a SNP-phenotype association observed in both NHANES III and Continuous NHANES with p-value <0.01, for SNPs with an allele frequency >0.01, and a sample size >200, for the same race-ethnicity, phenotype-class, and direction of effect. We identified 69 PheWAS results meeting this significance threshold. Of these 69 PheWAS results, 39 replicated previously reported SNP-phenotype associations from the literature. Of the remaining results, 9 were related to previously reported associations in the literature, and 21 were novel SNP-phenotype associations. Moreover, 13 SNPs showed evidence of pleiotropy – where a particular SNP was associated with more than one phenotype. For the majority of results meeting our PheWAS criteria for replication, each SNP had multiple associations for each phenotype class; thus, in the text we report only the most statistically significant result. We detail all association results meeting our PheWAS criteria for replication in S2, S3, and S4 Tables and Table 3.
Fig. 1. Overview of the approach for this study. 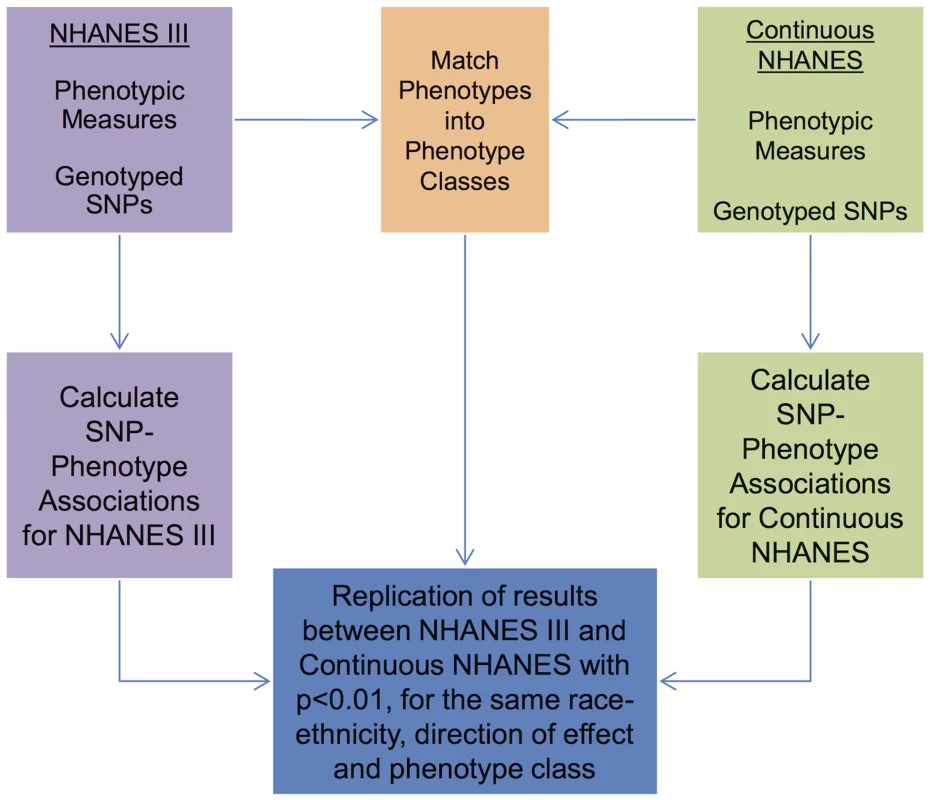
Genotypic and phenotypic data were collected in NHANES III and Continuous NHANES. The phenotypes for the two studies were matched into phenotype classes. Comprehensive associations were calculated for the genotypes and phenotypes for each survey independently. The results that were found in both surveys, with p<0.01, for the same phenotype-class, and race-ethnicity, and same direction of effect, were maintained for further inspection in this study. Tab. 2. Phenotype-classes. 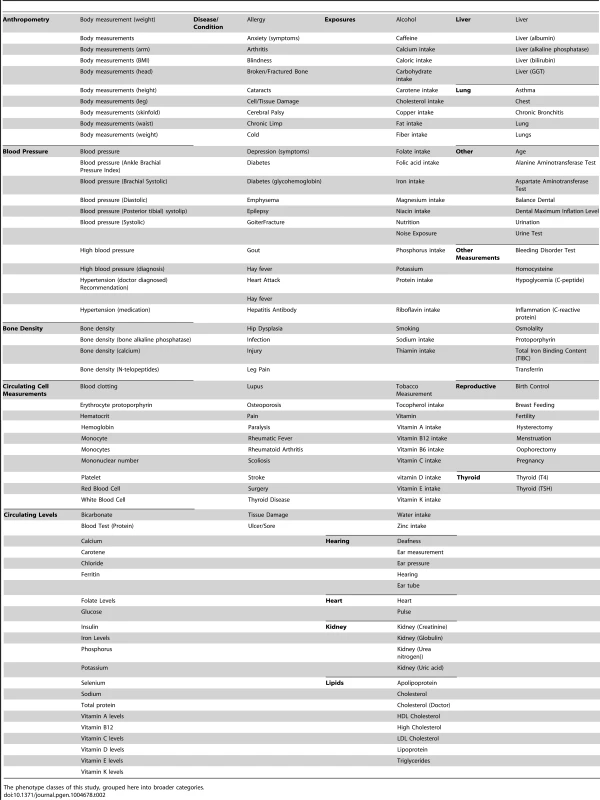
The phenotype classes of this study, grouped here into broader categories. Tab. 3. Novel results. 
Novel PheWAS results with the same SNP, phenotype class, and race-ethnicity across NHANES, ordered by these variables. Information on the closest gene and previously reported phenotypes from the PAGE network and GWAS Catalog (with PubMed ID) are included for each SNP. Long phenotype description, along with the corresponding p-value, beta (SE = standard error), coded allele frequency (CAF), and sample size for the association are also listed. Significant measures from NHANES III and Continuous NHANES are included, and NHANES Combined was also included when the phenotype was harmonized across both surveys. Replication of Known Results
As a positive control, we first sought evidence for associations that replicate findings from the literature. Replication of previously reported associations validates our PheWAS pipeline and data integrity. Thirty-nine out of the 69 (56.5%) of our PheWAS associations have previously been described in the literature with the same direction of effect, and our results for these associations are presented in S2 and S3 Tables as well as visualized in Fig. 2. A proportion of the phenotypes could have phenotypic harmonization such that we could explore the association result for the phenotype across both surveys, NHANES III and Continuous NHANES, which we refer to as NHANES Combined. A Combined NHANES result was not available for every phenotype, as not all phenotypes could be harmonized across both surveys even if phenotypes could be binned into phenotype classes across both surveys. Our result tables contain this NHANES Combined information when available.
Fig. 2. Replicating results for PheWAS. 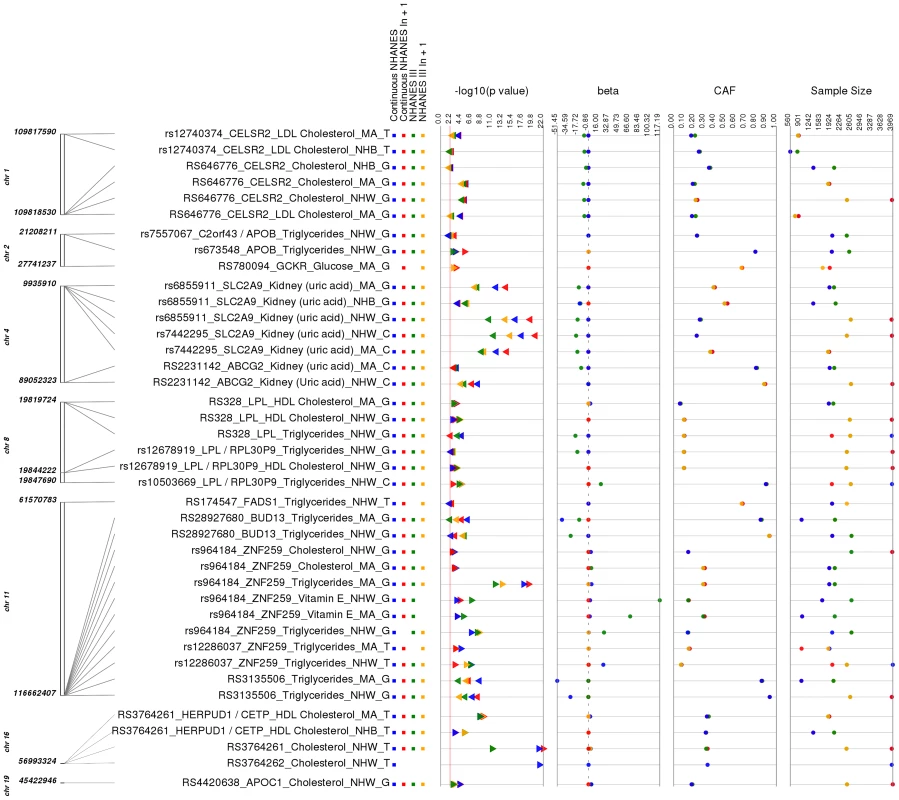
This is a plot of SNP-phenotype associations observed in both NHANES III and Continuous NHANES with p-value <0.01, for SNPs with an allele frequency >0.01, and a sample size >200, for the same race-ethnicity, phenotype-class, and direction of effect. Plotted are results where the significant SNP-phenotype association matches a previously reported SNP-Phenotype association. The first column indicates the chromosome and base pair location of the SNP. The second column indicates the SNP ID, the associated phenotype-class, the self-reported race-ethnicity (NHW = Non-Hispanic Whites, NHB = Non-Hispanic Blacks, or MA = Mexican Americans), and the coded-allele. The next column contains a colored box if association results were available for natural log transformed Continuous NHANES (Continuous NHANES ln+1), un-transformed Continuous NHANES phenotypes, NHANES III untransformed phenotypes (NHANES III), or transformed NHANES III phenotypes (NHANES III ln+1) (see methods for more details on phenotype transformation). The next column indicates the p-value for each association, and the triangle direction indicates whether the association had a positive (triangle pointed to the left) or negative direction of effect (triangle pointed to the right). The following columns indicate magnitude of the effect (beta), the coded allele frequency (CAF), and the sample size for the association. The majority of the SNPs within our study (51 out of 80), but not all of the SNPs, were chosen for genotyping based on published lipid trait genetic association studies (for example, [10]–[12]), and of these, 19/23 lipid-associated SNPs were associated with lipid traits in this PheWAS. For example, total cholesterol levels and LDL cholesterol levels have been previously associated with the SNP rs646776 near CELSR2 in European-descent populations [13]–[15]. In this PheWAS, we observed a significant association between rs646776 (coded allele G) and total cholesterol levels in NHANES III (p = 3.17×10⁻⁶, β = −7.66, n = 2,224) and Continuous NHANES (p = 9.15×10⁻⁷, β = −0.014, n = 3,943) for non-Hispanic whites with the same direction of effect as the association previously reported for this SNP and LDL cholesterol levels. The association between rs646776 and total cholesterol remained significant in Combined NHANES (p = 1.0×10⁻¹⁰, β = −0.029, n = 6,389).
Related Associations
After determining results where the phenotype of our association matched that of the same SNP-phenotype association in the GWA catalog, we evaluated whether any of our phenotypes were extremely similar to previously published SNP-phenotype associations. There were a total of 9/69 (∼13%) PheWAS results where the SNPs had been previously associated with lipid measurements not exactly matching the respective lipid measurements of our study (S4 Table and Fig. 3). For example, the SNP rs515135 near APOB/KLHL29 has been previously reported to be associated with LDL cholesterol (LDL-C) levels in European-descent populations [16], [17]. In this PheWAS, rs515135 (coded allele G) was associated with total cholesterol levels in non-Hispanic whites. For this SNP, the most significant results meeting our PheWAS replication criteria from NHANES III were: p = 0.0024, β = 4.85, n = 2,569 and Continuous NHANES were: p = 1.06×10⁻⁵, β = 0.026, n = 3959. This variant was also associated with total cholesterol levels in Combined NHANES (p = 1.39×10⁻⁷, β = 5.13, n = 6,528).
Fig. 3. Related results for PheWAS. 
This is a plot of SNP-phenotype associations observed in both NHANES III and Continuous NHANES with p-value <0.01, for SNPs with an allele frequency >0.01, and a sample size >200, for the same race-ethnicity, phenotype-class, and direction of effect. Plotted are results where the significant SNP-phenotype association is closely related to the phenotype of a previously reported SNP-Phenotype association. The first column indicates the chromosome and bp location of the SNP. The second column indicates the SNP ID, the associated phenotype-class, the self-reported race-ethnicity (NHW = Non-Hispanic Whites, NHB = Non-Hispanic Blacks, or MA = Mexican Americans), and the coded-allele. The next column contains a colored box if association results were available for natural log transformed Continuous NHANES phenotypes (Continuous NHANES ln+1), un-transformed Continuous NHANES phenotypes, NHANES III untransformed phenotypes (NHANES III), or transformed NHANES III phenotypes (NHANES III ln+1) (see methods for more details on phenotype transformation). The next column indicates the p-value for each association, and the triangle direction indicates whether the association had a positive (triangle pointed to the left) or negative direction of effect (triangle pointed to the right). The following columns indicate magnitude of the effect (beta), the coded allele frequency (CAF), and the sample size for the association. Another example of a closely related association was for SNP rs7557067 near APOB, previously found to be associated with triglyceride levels in European-descent populations [17]. In this PheWAS, rs7557067 (coded allele G) was associated with total cholesterol levels in non-Hispanic whites from NHANES III (p = 0.0050, β = −0.012, n = 2,436) and Continuous NHANES (p = 0.0053, β = −0.015, n = 3,966). In the larger sample size of Combined NHANES, this association with total cholesterol levels was maintained (p = 1.1×10⁻⁴, β = −0.014, n = 6,404). Given that total cholesterol includes HDL-C and that HDL-C is inversely correlated with triglycerides [18], [19], this PheWAS finding was also expected.
Novel Associations
The remainder of the PheWAS results with phenotypes that did not match previously reported SNP-phenotype associations had phenotypes very distinct from previously reported phenotypes. A total of 21/69 (∼30%) PheWAS results are potentially novel findings. These are associations with a greater divergence between the previously associated phenotype for a given SNP and the associated phenotype found in this study (Table 3). We found novel results for all three racial/ethnic groups. However, only one novel result meeting our PheWAS significance criteria generalized across two or more populations showing the same direction of effect: protoporphyrin levels in both non-Hispanic whites and Mexican Americans for the ABCG2 SNP rs2231142 (coded allele C). Of the replicating measures for protoporphyrin levels, the most significant results for this association in Mexican Americans for NHANES III was: p = 2.61×10⁻⁷, β = −0.075, n = 2,029, for Continuous NHANES was: p = 2.0×10⁻⁴, β = −0.079, n = 968, and for Combined NHANES: p = 9.41×10⁻⁸, β = −5.21, n = 3,897. The most significant result for this association in non-Hispanic whites was for NHANES III: p = 6.0×10⁻⁶, β = −0.062, n = 2,587 and for Continuous NHANES was: p = 6.6×10⁻⁴, β = −0.06, n = 1,667. This SNP was previously associated with uric acid [20]–[23]. We also found this SNP to be associated with uric acid in non-Hispanic whites and Mexican Americans with the same direction of effect as previously reported associations, as well as an additional novel result for blood pressure measurements only in Mexican Americans with an opposite direction of effect. The number of novel results was similar across race-ethnicities, even with the difference in sample size across non-Hispanic whites, non-Hispanic blacks, and Mexican Americans that could affect power for detection of novel associations.
An example novel result showing a very unique divergence from previously reported associations was for the SNP rs11206510 (coded allele T) near the gene PCSK9. This SNP has been previously associated with coronary heart disease [24], LDL-C [16], [17], [25], and myocardial infarction [26] in European-descent populations, but we did not replicate any of those previously reported associations. In this study we found this SNP was associated with serum globulin levels in Mexican Americans from NHANES III (p = 0.0095, β = 0.0120, n = 2,023), Continuous NHANES (p = 0.0042, β = 0.012, n = 1871), and Combined NHANES (p = 8.7×10⁻⁴, β = 0.015, n = 3,894). We contrasted the direction of effect of this SNP with the previously reported associations for this SNP and the direction of effect was the same.
Another example of novel divergence from previously reported results involved two SNPs we found to be associated with white blood cell count in non-Hispanic blacks. The SNP rs1800795 (coded allele G) near IL6 previously was associated with C-reactive protein levels [27]–[29]. In our study, this SNP was associated with white blood cell counts in non-Hispanic blacks from NHANES III (p = 0.0047, β = −0.34, n = 2038) and Continuous NHANES (p = 0.0048, β = −0.071, n = 1,316). We also found that rs4355801 in TNFRSF11B was associated with white blood cell counts in non-Hispanic blacks from NHANES III (p = 0.0036, β = 0.30, n = 6,991), Continuous NHANES (p = 0.0079, β = 0.378, n = 3,728), and Combined NHANES (p = 5.77×10⁻⁵, β = 0.042, n = 3,411). Previously, TNFRSF11B rs4355801 (coded allele G) was associated with bone mineral density in women of European-descent [30]. We did not observe a significant PheWAS association with C-reactive protein or bone mineral density in our study for these two SNPs, respectively.
We found a total of six novel PheWAS-significant results associated with circulating vitamin levels (vitamin E, vitamin A, and folate). For example, a PheWAS-significant association for the missense SNP rs1260326 (coded allele T) in the gene GCKR was found with vitamin A levels in non-Hispanic whites from NHANES III (p = 6.1×10⁻³, β = 1.30, n = 2,250), Continuous NHANES (p = 1.11×10⁻⁴, β = 2.34, n = 1,639), and Combined NHANES (p = 1.06×10⁻⁵, β = 1.65, n = 4,189). This SNP was previously associated with serum albumin levels and serum total protein levels in European - and Japanese-descent individuals [31], non-albumin protein levels in Japanese-descent individuals [32], platelet counts [33], cardiovascular disease risk factors [34], C-reactive protein levels [35], urate levels [20], total cholesterol and triglyceride levels [36], and chronic kidney disease [37] in individuals of European ancestry, and liver enzyme levels in European - and Asian-descent populations [38]. None of these previously reported associations replicated in our study. We compared the positive direction of effect of this SNP rs1260326, associated with vitamin levels, with previously reported associations. Associations with the same coded allele (T) with urate levels [20], serum albumin levels [31], serum total protein levels [31], platelet counts [33], liver enzyme levels[38], cardiovascular disease risk factors [34], C-reactive protein levels [35], total cholesterol and triglyceride levels [36], chronic kidney disease [37] all had a positive direction of effect. This SNP was associated with non-albumin protein levels [32] with a negative direction of effect.
Identification of Pleiotropy
While any of the novel PheWAS associations indicate potential pleiotropy as all of the SNPs of this study have previously reported genome-wide associations, within our study, we found 13 SNPs with more than one significant PheWAS phenotype class (Table 4 and Fig. 4). While the majority of these were SNPs were associated with more than one lipid phenotype, there were nine SNPs associated with other phenotypes.
Fig. 4. Potentially pleiotropic results. 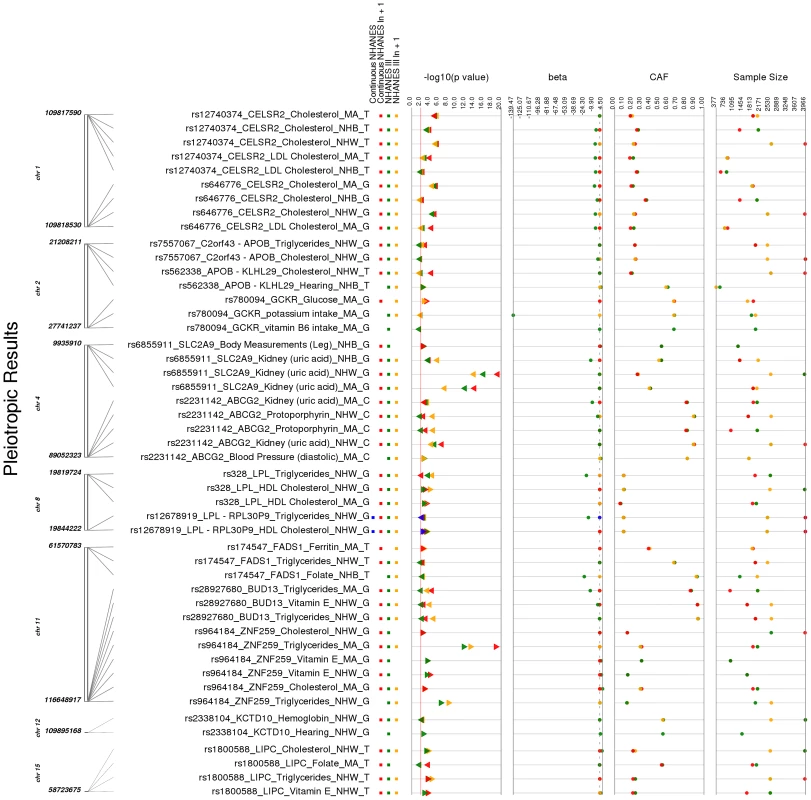
These are the PheWAS-significant results of this study with more than one distinct phenotype-class associated with the same SNP. This is a plot of SNP-phenotype associations observed in both NHANES III and Continuous NHANES with p-value <0.01, for SNPs with an allele frequency >0.01, and a sample size >200, for the same race-ethnicity, phenotype-class, and direction of effect. Plotted are results where the significant SNP-phenotype association matches a previously reported SNP-Phenotype association. The first column indicates the chromosome and bp location of the SNP. The second column indicates the SNP ID, the associated phenotype-class, the self-reported race-ethnicity (NHW = Non-Hispanic Whites, NHB = Non-Hispanic Blacks, or MA = Mexican Americans), and the coded-allele. The next column contains a colored box if association results were available for natural log transformed NHANES III phenotypes (NHANES III ln+1), un-transformed NHANES III phenotypes (NHANES III), or natural log transformed Continuous NHANES phenotypes (Continuous NHANES ln+1) (see methods for more details on phenotype transformation), or untransformed Continuous NHANES phenotypes. The next column indicates the p-value for each association, and the triangle direction indicates whether the association had a positive (triangle pointed to the left) or negative direction of effect (triangle pointed to the right). The following columns indicate magnitude of the effect (beta), the coded allele frequency (CAF), and the sample size for the association. Tab. 4. Pleiotropic results. 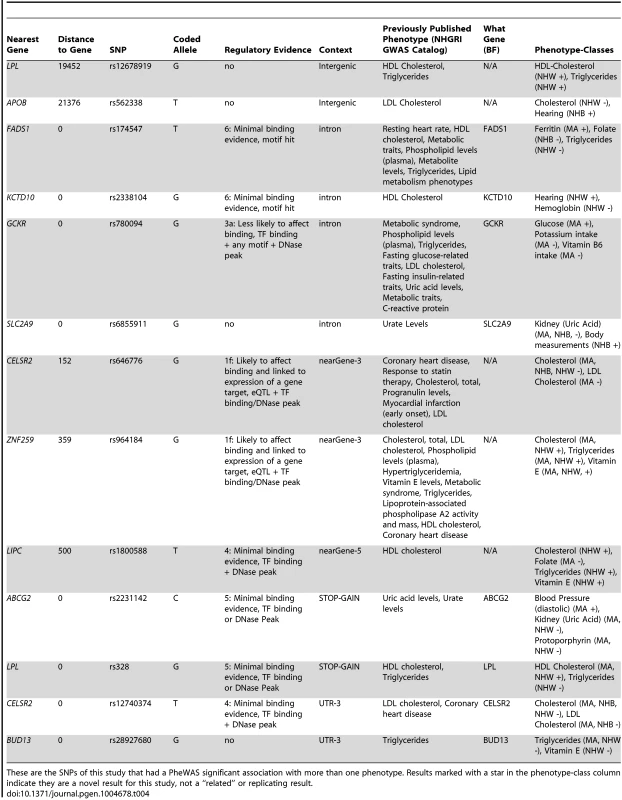
These are the SNPs of this study that had a PheWAS significant association with more than one phenotype. Results marked with a star in the phenotype-class column indicate they are a novel result for this study, not a “related” or replicating result. For example, the missense SNP in ABCG2 rs2231142, also described in novel results, was found to have two novel associations, protoporhyrin (in non-Hispanic whites and Mexican Americans) and blood pressure levels (Mexican Americans), and one replication of a previously known association with uric acid levels (non-Hispanic whites and Mexican Americans). The results for this SNP are plotted in Fig. 5.
Fig. 5. Sun plot of (p<0.01) results for ABCG rs2231142, coded allele C. 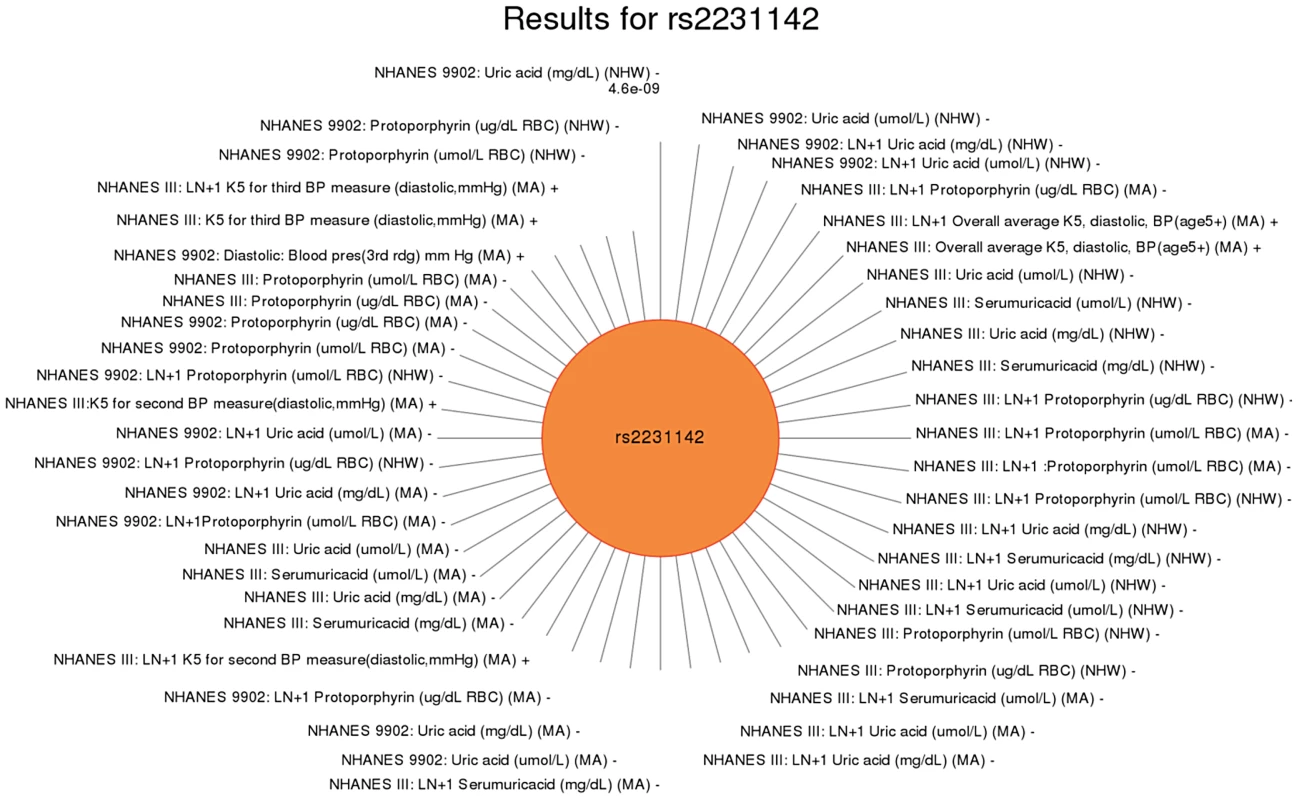
This SNP has been previously reported to be associated with uric acid levels. Significant SNP-phenotype associations (p<0.01) are plotted clockwise with the smallest p-value result at the top. The length of the each line corresponds to the –log(p-value) of each result, with the longest line representing the most significant result for this SNP, meeting our PheWAS replication criteria for inclusion. Study, transformed (LN +1) or untransformed (none) phenotype description, self-reported race-ethnicity, and direction of effect are listed for each association. This SNP was associated with a number of phenotypes in this study including uric acid levels (as previously published) in non-Hispanic whites (NHW) and Mexican Americans (MA), protoporphyrin levels in non-Hispanic whites and Mexican Americans, and diastolic blood pressure in Mexican Americans. For another example, rs2338104, an intronic SNP in KCTD10, which was previously associated with HDL cholesterol (HDL-C) in European-descent populations [17], [25], was associated here with hemoglobin and hearing levels, both novel results in non-Hispanic whites (Fig. 6). Another example of potential pleiotropy was for SNP rs1800588 near LIPC, previously associated HDL-C in European-descent populations [15]. We observed significant associations between this SNP and the novel phenotypes of folate (in Mexican Americans) and vitamin E levels (in non-Hispanic whites), as well as replication for cholesterol and the related phenotype of triglycerides (both in non-Hispanic whites; Fig. 7). The intronic SNP rs174547 of FADS1 provides another example. This SNP was previously associated with phospholipid levels [39], resting heart rate [40], phosphatidylcholine levels [41], HDL-C and triglyceride levels [17] in individuals of European ancestry. Here, this SNP is associated with ferritin levels in Mexican Americans and with folate levels in non-Hispanic blacks.
Fig. 6. Sun plot of (p<0.01) results for KCTD10 rs2338104, coded allele G. 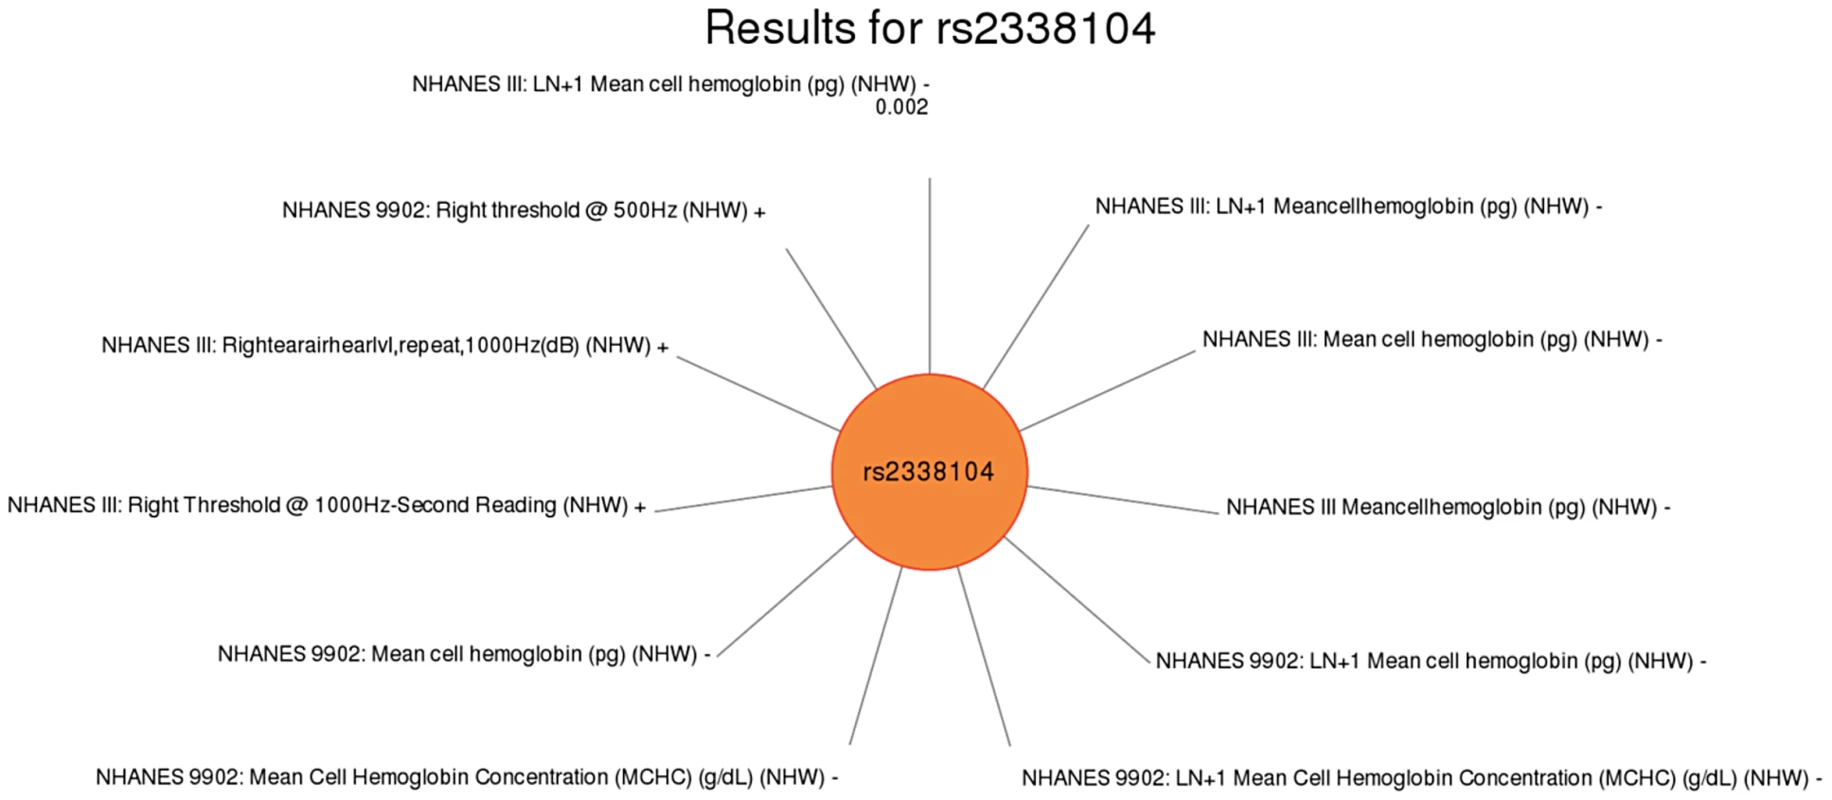
This SNP was previously associated with HDL-C levels. Significant SNP-phenotype associations (p<0.01) for this study are plotted clockwise with the smallest p-value result at the top. The length of the each line corresponds to the –log(p-value) of each result, with the longest line representing the most significant result for this SNP, meeting our PheWAS replication criteria for inclusion. Study, transformed (LN +1) or untransformed (none) phenotype description, self-reported race-ethnicity, and direction of effect are listed for each association. This SNP was associated with mean cell hemoglobin levels, as well as right ear hearing levels in non-Hispanic whites (NHW). Fig. 7. Sun plot of (p<0.01) results for LIPC rs1800588, coded allele T. 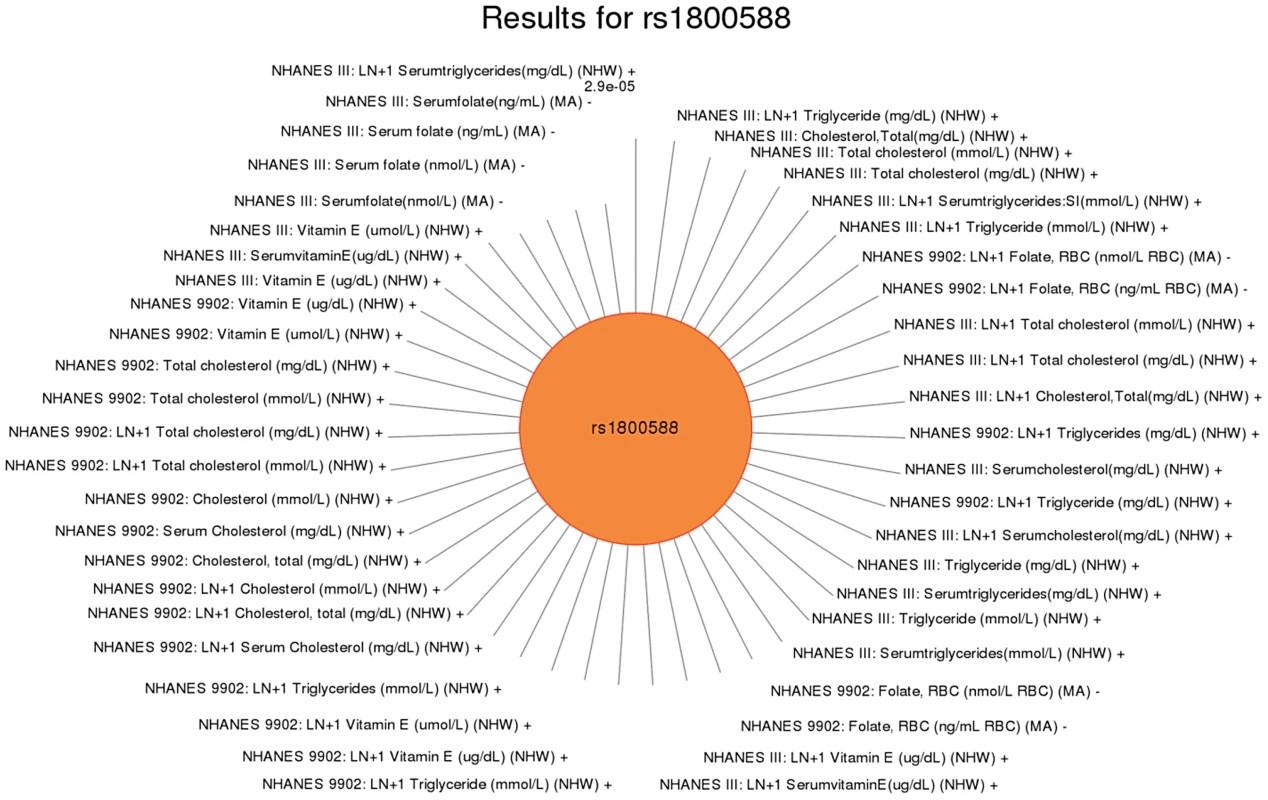
This SNP was previously associated HDL-C in European-descent populations. Significant associations (p<0.01) are plotted clockwise with the most significant value result at the top. The length of the each line corresponds to the –log(p-value) of each result, with the longest line representing the most significant result for this SNP, meeting our PheWAS replication criteria for inclusion. Study, transformed (LN +1) or untransformed (none) phenotype description, self-reported race-ethnicity, and direction of effect are listed for each association. This SNP was associated with a number of phenotypes including folate in Mexican Americans (MA), total cholesterol in non-Hispanic whites (NHW), triglyceride levels in non-Hispanic whites, and vitamin E levels in non-Hispanic whites. To further characterize these putative pleiotropic relationships, we compared and contrasted direction of effect for each association (Table 4). We found variants related to potentially protective effects for certain traits, and a potential risk effects for other traits. For example, intergenic SNP rs12678919 near LPL was associated with HDL cholesterol levels in non-Hispanic whites with a positive direction of effect and hearing in non-Hispanic blacks with a negative direction of effect (coded allele G). Intronic SNP rs174547 in FADS1 was associated with ferritin levels in Mexican Americans with a positive direction of effect and folate (in non-Hispanic blacks) and triglycerides (in non-Hispanic whites) with a negative direction of effect (coded allele T). The intronic SNP rs6855911 in SLC2A9 was associated with uric acid (in both non-Hispanic blacks and Mexican Americans) with a negative direction of effect and thigh circumference measurements (non-Hispanic blacks) with a positive direction of effect (coded allele G).
Investigating Interrelationships within PheWAS Results
PheWAS-significant results provide an opportunity to explore the relationships between SNPs, genes, traits/outcomes, and pathways or other known relationships between genes and gene-products. We used the software tool Biofilter to identify the genes the PheWAS-significant SNPs were within or closest to. We then used Biofilter to annotate the resultant genes using the Kyoto Encyclopedia of Genes and Genomes (KEGG) [42], Gene-Ontology (GO) [43], and NetPath [44] which allowed us to identify any known connections between genes due to shared biological pathways or other known biological connections. After stratifying the results by race-ethnicity, we used Cytoscape [45] to visualize the connections between genes based on their annotation. We present here the networks where there were two or more SNPs significant in our PheWAS connected via genes and those two or more genes were connected by a pathway or other gene-gene connection.
For example, Fig. 8 shows one example for PheWAS results in Mexican Americans, where LPL SNP rs328 had a significant association with HDL-C levels, and the FADS1 SNP rs17547 had an association with ferritin levels. Both genes are found in the TGF-β receptor regulated NetPath pathway. Fig. 9 shows another example in Mexican Americans in which three SNPs were associated with uric acid levels: rs2231142, rs7442295, rs685911. One of the SNPs is located within the gene ABCG2, and the other two SNPs are located within SLC2A9 (blue boxes). Both ABCG2 and SLC2A9 are found within the GO biological process “urate metabolic process”, a collection of the gene products involved in the chemical reactions and pathways involving urate. These same connections were also found for non-Hispanic whites, as this group had a PheWAS-significant association between these SNPs and uric acid levels. One of the SNPs, rs2231142, was also associated with diastolic blood pressure and protoporphyrin levels.
Fig. 8. Using PheWAS results, Biofilter, and Cytoscape to explore gene-gene connections with NetPath. 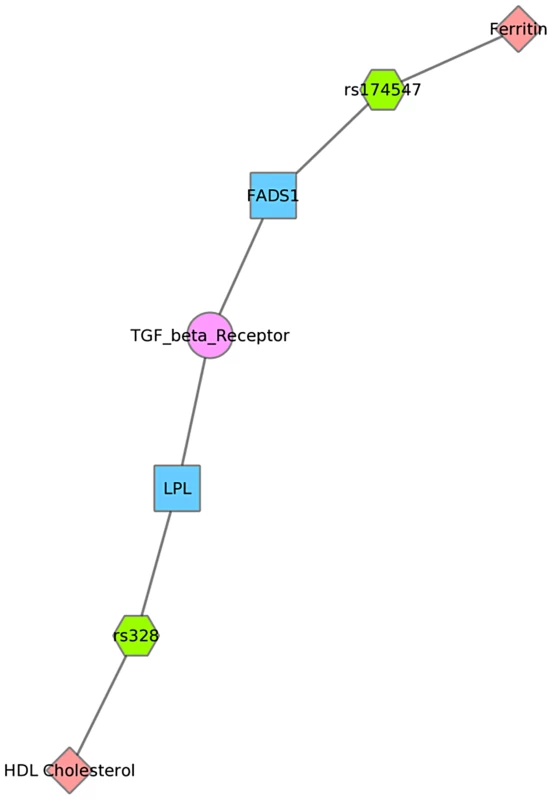
We used Biofilter to annotate the SNPs of this PheWAS with gene information. We then mapped the genes to concomitant pathways or other gene groupings through GO, KEGG, and NetPath. This is one example for the results for Mexican Americans and annotation with NetPath. The pink diamonds are associated phenotypes of this PheWAS, the green hexagons are SNPs, blue boxes are genes, and circles are biological connections that link genes together, in this case the two genes are in the same TGF NetPath biological pathway. Thus, we see that in the PheWAS results, the LPL SNP rs328 had a significant association with HDL cholesterol levels, and FADS1 rs17547 association with Ferritin levels, and both genes are found in the TGF beta receptor pathway. Fig. 9. Using PheWAS results, Biofilter, and Cytoscape to explore gene-gene connections with GO biological processes. 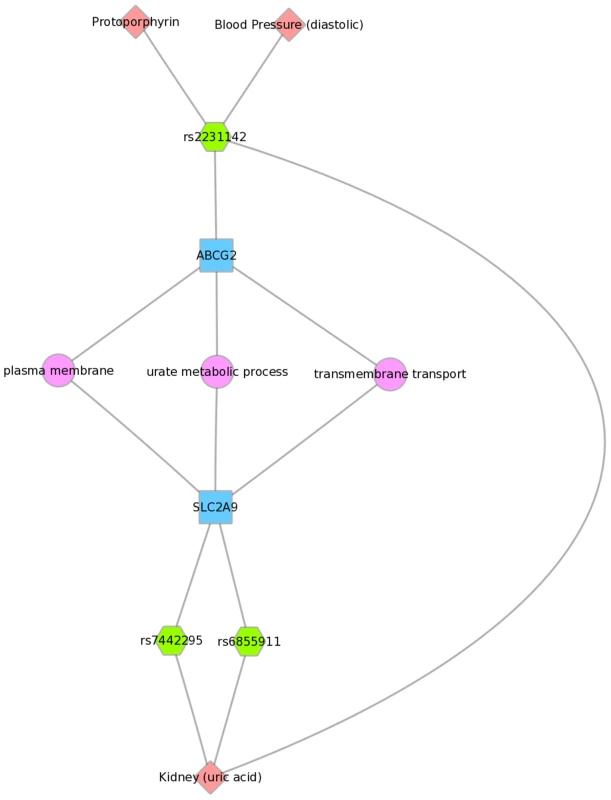
Three SNPs were associated with uric acid levels in Mexican Americans: rs2231142, rs7442295, rs685911 (green hexagons). One of the SNPs is within the gene ABCG2, and the other two SNPs are within SLC2A9 (blue boxes). Both ABCG2 and SLC2A9 are found within the GO biological process “urate metabolic process”, a collection of the gene products involved in the chemical reactions and pathways involving urate. This was also found for non-Hispanic whites. Fig. 10 displays an example using KEGG and the Mexican American PheWAS results. LPL and LIPC both are involved in the KEGG biological process “glycerolipid metabolism”. LPL SNP rs328 was associated in this study with HDL-C, while LIPC SNP rs1800588 was associated with folate levels. LPL was also involved in the KEGG pathway “Peroxisome Proliferator-Activated Receptor (PPAR) signaling pathway”, along with APOA5, which was associated with triglyceride levels through its SNP rs3135506. PPARs are transcription factors activated by lipids.
Fig. 10. Using PheWAS results, Biofilter, and Cytoscape to explore gene-gene connections with KEGG connections. 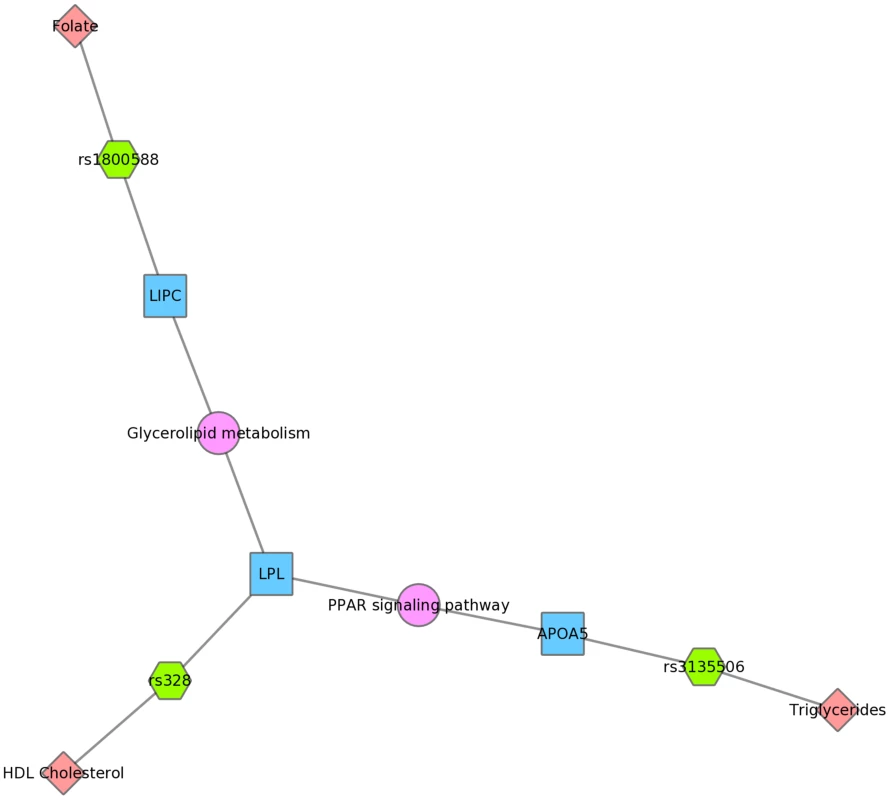
The LIPC SNP rs1800588 was associated with folate levels, the LPL SNP rs328 was associated with HDL cholesterol, and both of these genes are in the glycerolipid metabolism KEGG pathway in Mexican Americans. The APOA5 SNP rs135506, associated with triglyceride levels in our study, shares the PPAR signaling pathway along with LPL. Discussion
For this PheWAS, performed using the data of NHANES, we have replicated a number of previously published results and have found novel and pleiotropic associations. For example, for rs2231142, a missense SNP in ATP-binding cassette subfamily G member 2 (ABCG2), we replicated previous associations with uric acid levels observed in European-descent populations and in Mexican Americans with the same direction of effect. Additionally, we identified a novel association for this SNP with protoporphyrin in both the European-descent population and Mexican Americans, where the coded allele (C) was associated with increased uric acid levels as well as increased protoporphyrin. This PheWAS finding is intriguing in light of some of the known connections that link protoporhyrin with uric acid levels, suggesting the potential for this SNP to have an impact on the levels of one or both resulting in the associations identified here. Protoporhyrin combines with heme to form iron-containing proteins. This gene is in the bile secretion pathway [42], and bile consists of substances including bilirubin, which is converted from heme/porphyrin [43]. Thus, the observed association is consistent with a known biological process. There is also a known correlation between ferritin levels and uric acid levels, and urate forms a coordination complex with iron to diminish electron transport, acting as an iron chelator and antioxidant [46]. This correlation implies an expected link between protoporphyrin and uric acid association results; however, we did not observe an association with ferritin levels in this study for this SNP.
The PheWAS significant association between rs2231142 and blood pressure levels was only observed in Mexican Americans. However, the direction of effect is opposite as seen for uric acid levels and protoporphyrin. There is a demonstrated positive correlation between high blood pressure and high serum uric acid levels [44], [45], but the relationships between rs2231142 and diastolic blood pressure compared with serum uric acid levels in our study were inconsistent, suggesting an independent relationship between this SNP and the two phenotypes. Thus, this is an example of the novel discoveries that can occur with the PheWAS approach that would not be found through only investigating the association between multiple SNPs and a single trait outcome or phenotype.
Another intriguing result was for rs2338104, an intronic SNP in the potassium channel tetramerisation domain containing 10 (KCTD10) gene, which is a member of the polymerase delta-interacting protein 1 gene family. KCTD10 has been previously associated with DNA synthesis/cell proliferation [46], HDL cholesterol levels [13], [21], and interaction with an ubiquitin ligase [47]. In this study, KCDT10 rs2338104 was associated with right ear hearing levels and mean cell hemoglobin levels in non-Hispanic whites. The biological function of KCDT10 has not been extensively studied; consequently, biological explanations for the relationship between this variant and hearing or mean cell hemoglobin do not yet exist.
Novel associations for hematologic traits were found in this PheWAS. The SNP rs1800795 near gene interleukin 6 (IL6) and rs4355801 in tumor necrosis factor receptor superfamily, member 11b (TNFRSF11B) had significant association with white blood cell counts in non-Hispanic blacks. There are known associations between hematologic traits and genetic variants on chromosome 1 in African Americans, spanning a wide region of chromosome 1 [47]. This region of association is due to the presence of the African-derived Duffy Null polymorphism, a genetic variant protective against Plasmodium vivax malaria. Presence of this variant explains the lower white blood cell and neutrophil counts in African Americans [48]. However, neither rs1800795 nor rs4355801 are located on chromosome 1 and therefore represent potentially unique associations with hematologic traits.
Further novel associations with circulating vitamin levels were found. The SNP rs1260326 was associated with vitamin A in non-Hispanic whites. Vitamin E was associated with rs13266634, rs28927680, and rs1800588 in non-Hispanic whites and rs964184 in non-Hispanic whites and Mexican Americans. Additionally, folate levels were associated with rs174547 in non-Hispanic blacks and rs1800588 in Mexican Americans. When considering the direction of effect for the vitamin levels, we found that rs174547, an intronic SNP in fatty acid desaturase 1 (FADS1), was associated with ferritin and iron levels with different direction of effect in Mexican Americans. Conversely, vitamin E showed the same direction of effect as triglycerides. Recent findings indicate a potential relationship between vitamin E intake and triglyceride levels for certain SNPs [49]. Thus, these results may be reflective of an interaction between variability in vitamin E intake and genetic variance.
Other SNPs with pleiotropic effects showed associations with different directions of effect. For example, rs780094 in the intron of glucokinase regulator (GCKR) was associated with serum glucose levels with a positive direction of effect (0.67) and potassium and vitamin B6 intake levels with a negative direction of effect (β = −0.05 and −0.11, respectively) in Mexican Americans. This result is consistent with the demonstrated inverse relationship between potassium intake and glucose intolerance [50]. Likewise, glucose tolerance has been found to increase upon vitamin B6 supplement intake in women with gestational diabetes mellitus [51], [52]. One possibility, requiring further investigation, is that this SNP modulates the effect of vitamin B6 and potassium on glucose levels.
Fourteen of our results showed both a significant PheWAS association and the same direction of effect for a different race-ethnicity. We did not investigate non-significant results with a similar direction of effect for this study. We evaluated the differences in allele frequency across the two surveys, across race-ethnicity, for the SNPs that met our criteria for PheWAS replication (S5 Table). There were not consistent trends between similar or markedly different allele frequencies and whether we did or did not see the same SNP-phenotype associations across more than one race-ethnicity. The reason for differences in association may lie in the variation between linkage disequilibrium patterns across populations. Additionally, as genetic architecture can vary across different race-ethnicities, there is the potential for finding novel associations that exist in only one population. Low power due to sample size could have also contributed to fewer significant associations in non-Hispanic black and Mexican American populations, when compared to non-Hispanic whites, as the sample sizes were generally smaller. Further, phenotypic outcome is impacted by both genetic variation and environmental exposure variation, and thus some associations may not replicate across race-ethnicity in part due to potentially different environmental exposure across racial/ethnic groups. Also, there are differences in the median age across race-ethnicity for the two surveys that could contribute to being unable to detect SNP-phenotype associations across different race-ethnicities.
We found examples of gene-gene connections that link our PheWAS results from the SNP to gene to pathway level. These examples show the utility of applying known information about genes to provide biological context for individual PheWAS results through visually linking the information together. Multiple connections not readily apparent when exploring tabular results can be highlighted with this approach. For example, Fig. 9 shows three SNPs within two different genes that are within the GO biological process of “urate metabolic process”, a group of gene products involved in the chemical reactions and pathways involving urate. These SNPs are all associated with uric acid levels in our PheWAS. These SNPs have previously reported associations with uric acid levels, and these genes are known to be involved with pathways that contain urate. However, through connecting phenotypes, SNPs, genes, and pathways, and visualizing the results, we can more clearly show how single genetic variants are likely biologically linked to outcome variation. Further, this example shows the SNP rs2231142 associated with two other phenotypes, as described earlier in this discussion.
We also presented network results in Figs. 8, 9 and 10. The results presented in Fig. 8 show two SNPs in different genes that both are found in the TGF-β receptor regulated NetPath pathway. This would not have been evident in the PheWAS without applying annotation from known pathways. Fig. 10 shows one example of two genes involved in the KEGG biological process “glycerolipid metabolism”. Here, one SNP is associated with HDL-C levels, and, interestingly, a separate SNP in the network is associated with folate levels. Plasma folate levels have been associated with lipoprotein profiles [49]. Further, the LPL SNP rs328 was associated in this study with HDL-C and is also involved in the KEGG pathway “Peroxisome Proliferator-Activated Receptor (PPAR) signaling pathway”, along with a SNP in APOA5, which was associated with triglyceride levels. PPARs are transcription factors activated by lipids. In the future we will continue to use this network approach, to highlight both the biological context that supports results found in PheWAS and the biological annotation that may identify relationships that forge new hypotheses about the connection between genetic variation and complex outcomes.
One limitation to the current PheWAS approach is the risk of false-positive associations due to the large number of tests for association between SNPs and phenotypes. For this analysis, we required replication of association results across NHANES to reduce the type-1 error rate. Correcting for multiple hypothesis testing to account for the comprehensive associations in PheWAS, and thus potentially inflated Type I error, based on the number of tests/studies/groups can be problematic for multiple reasons. Most multiple testing calculations assume independent tests, which we do not have here as phenotypes are correlated across our PheWAS studies. Also, our power from one result to another can vary in part due to variations in sample size for the specific phenotype. In addition we used phenotype-class binning of results which results in different numbers of sub-phenotypes in each bin for potential replication. Future work includes research into identifying additional methods for multiple testing burden in PheWAS, such as permutation testing. Another limitation to the PheWAS approach is the high-throughput nature of the analysis. For instance, adjustments were not made for participants on medication that could modify or lower measurements such as lipids. The results are considered preliminary and bear further inquiry. However, it is notable that we observed replication of a number of previously published results with the same direction of effect indicating that our high-throughput approach is functional for a number of measures. Because we chose to seek replication across NHANES surveys, we did not explore results unique to any one survey.
A major strength of the PheWAS approach is the potential for novel discoveries about genetic variants and their relation to phenotypes for future investigation as well as to replicate results found in GWAS. Phenome-wide associations provide the opportunity to uncover complex networks of phenotypes involved in disease through tests of association between genetic variants and a broad range of phenotypes. Utilizing existing epidemiologic collections such as the diverse NHANES allows for potential generalization of variant-phenotype relationships across race-ethnicities.
We have found novel associations for phenotypes such as white blood cell count and vitamin levels for SNPs with different previously known associations. We also have found indications of pleiotropy. Further, because this approach investigates single SNPs with multiple phenotypes, results with contrasting direction of effect can be investigated. We explored the results of this PheWAS within the context of additional biological information including the use of network diagrams. In addition, we were able to pursue this across multiple race-ethnicities, whereas much of the approach in GWAS has been within European Americans. The results described here demonstrate the utility of the PheWAS approach to expose relevant results that contrast what is known about the relationships between multiple phenotypes and between genotype and phenotype to uncover the complex nature of human traits.
Materials and Methods
Study Design and Populations
Two NHANES surveys [53] were included in the PheWAS analyses. The epidemiological survey data and DNA samples of NHANES III were collected between 1991–1994 and Continuous NHANES was collected between 1999–2000 and 2001–2002. For some of the phenotypes, harmonization across NHANES III and Continuous NHANES was possible. Thus, for a subset of phenotypes, we were able to use the two surveys combined in analyses we refer to as NHANES Combined. NHANES measures the health and nutritional habits of U.S. participants regardless of health status across race-ethnicity, by collecting medical, dietary, demographic, laboratory, lifestyle, and environmental exposure data via questionnaire, direct laboratory measures, and a physical exam. In NHANES, specific age groups (such as the young elderly) and racial/ethnic groups are oversampled. The epidemiological data of NHANES and the associated DNA samples were collected by the National Center on Health Statistics (NCHS) at the Centers for Disease Control and Prevention (CDC). All procedures were approved by the CDC Ethics Review Board and written informed consent was obtained from all participants. Because no identifying information is available to the investigators, Vanderbilt University's Institutional Review Board determined that this study met the criteria of “non-human subjects.”
Genotyping and SNP Selection
For this study, EAGLE genotyped 80 GWAS-identified variants in two NHANES datasets representing three surveys: NHANES III, collected between 1991 and 1994, and Continuous NHANES, collected between 1999–2000 and 2001–2002. The majority of the SNPs within our study were chosen for genotyping based on published lipid trait genetic association studies. Also included in this study are SNPs previously associated with a range of other phenotypes, and we detail information about these SNPs in S1 Table, including the genotyping method for each SNP (unless the SNP was already available within NHANES before EAGLE genotyping, and there we cite the lab that provided the genotypic data to NHANES). Genotyping was performed in a total of 14,998 NHANES participants with DNA samples including 6,634 self-reported non-Hispanic whites, 3,458 self-reported non-Hispanic blacks, and 3,950 self-reported Mexican Americans. Genotypes included in this study were accessed from (1) genotyping performed using Sequenom by the Vanderbilt DNA Resources Core, or (2) existing data in the Genetic NHANES database. In addition to genotyping experimental NHANES samples, blinded duplicates provided by CDC and HapMap controls (n = 360) as part of the PAGE study were also genotyped. Quality control, which included concordance and Hardy Weinberg Equilibrium, was performed on all SNPs by the CDC. All SNPs that passed quality control are available for secondary analyses through NCHS/CDC.
Statistical Methods
Single SNP unadjusted tests of association were performed for 80 SNPs available in NHANES III and Continuous NHANES and 1,008 phenotypes. When the exact phenotype was measured in NHANES III and Continuous NHANES, the unadjusted tests of association were also performed for all samples as part of Combined NHANES. As outlined in the PAGE Study [7] tests of association between all SNPs and phenotypes were performed using linear or logistic regression, depending on whether the phenotype was binary or continuous. For categorical phenotypes, binning was used to create new variables of the form “A versus not A” for each category, and logistic regression was used to model the new binary variables. All continuous phenotypes were natural log transformed, following a y to log (y+1) transformation of the response variable with +1 added to all continuous measurements before transformation to prevent variables recorded as zero from being omitted from analysis. All analyses were stratified by self-reported race-ethnicity. Analyses were performed remotely in SAS v9.2 (SAS Institute, Cary, NC) using the Analytic Data Research by Email (ANDRE) portal of the CDC Research Data Center in Hyattsville, MD.
NHANES Phenotypes
A wide range of phenotypic variables was available for both NHANES III and Continuous NHANES. We used only phenotypes for this study that could be binned into phenotype classes across more than one NHANES (see phenotype classes section for more details), so that we could seek replication for association results across surveys. The phenotypes of this study are listed in S6 Table. Detailed information on the collection of each of the phenotypes is available through the CDC, for NHANES III (http://www.cdc.gov/nchs/nhanes/nh3data.htm) and for Continuous NHANES (http://wwwn.cdc.gov/nchs/nhanes/search/nhanes_continuous.aspx)
Phenotype Classes
To facilitate comparisons across NHANES, similar phenotypes from each of the NHANES were binned into 184 “phenotype-classes” (Table 2) via manual inspection of one person and reviewed by a second individual, similar to the phenotype binning of [4]. The development of phenotype-classes was necessary for several reasons. First, not all phenotypes and exposures were surveyed or collected in the same way for each iteration of NHANES, and thus could not be completely harmonized. However, some of these phenotypes were similar enough across surveys and to be binned into the same phenotype-class (for example, “Arm Circumference” and “Upper Arm Length” were both binned in the “Body Measurements (Arm)” phenotype-class). Second, when matching phenotypes and exposures, the labels across and within NHANES vary even for the same phenotypes. For example “Vitamin A” and “Serum Vitamin A” both measured the same phenotype and thus were both classified in the “Vitamin A” phenotype-class. For the majority of PheWAS results, there were multiple significant NHANES measures for each phenotype class, and we reported the lowest p-value in descriptions of the PheWAS results within the figures and the results. Our list of the phenotypes of this study also includes their respective phenotype class, listed in S6 Table.
Threshold of Significance
A significant PheWAS result met all of the following criteria: 1) a SNP-phenotype association was observed in both NHANES III and Continuous NHANES, 2) with p-value <0.01, 3) allele frequency >0.01, 4) sample size >200, 5) for the same race-ethnicity, 6) phenotype class, and 7) direction of effect. For each of these consistent associations, we examined tests of association results for Combined NHANES. Significant PheWAS results were then plotted using Phenogram [50] and PheWAS-View[51], software specifically developed for visualization of PheWAS results (http://ritchielab.psu.edu/ritchielab/software/). The expanded results for all 69 results meeting our PheWAS significance criteria are presented in S2 Table.
Correlations between Phenotypes
We calculated pairwise Pearson correlations between all phenotypes that had a significant PheWAS result, for NHANES III and Continuous NHANES, stratified by race-ethnicity. For any significant PheWAS phenotype, we listed correlations for any phenotypes with a correlation >0.6 with the significant PheWAS phenotype list.
We took the absolute value of the correlations and used the statistical package R [52] to create a clustered heat map of the correlations with color ranging from light yellow to dark blue. We present our correlation matrices in S1–S6 Figures. The most correlated phenotypes are shown in a light yellow color, the less correlated a phenotype pair, the more blue on the heatmap.
Biofilter
Biofilter [53], [54] is a software package that allows the user to download and automatically integrate several different knowledge databases into a single accessible database called the Library of Knowledge Integration, and then run queries via Biofilter with the resultant integrated data (https://ritchielab.psu.edu/ritchielab/software/). We used Biofilter to annotate the SNPs of this study with the location and identification of the nearest genes to each of our SNPs, from NCBI dbSNP and NCBI Gene (Entrez) (http://www.ncbi.nlm.nih.gov/). We also applied information from the Kyoto Encyclopedia of Genes and Genomes (KEGG) [42], Gene Ontology (GO) [43], and NetPath [44]. This allowed us to highlight known connections between genes. Thus, we were able to identify any biological pathway or grouping connections between the genes SNPs were in or near in our study.
Cytoscape
After we used Biofilter to annotate the genes as described above, we stratified the results by race-ethnicity. We used Cytoscape [45] to visualize the connections between genes based on their annotation. Using this visualization tool, we explored networks where one or more SNPs were connected, via genes, to mutual pathways or genes, and we did not further investigate any resultant networks comprised of single SNPs.
RegulomeDB
RegulomeDB [55] was used to annotate PheWAS-significant SNPs in this study with functional and regulatory information for our analyses. The results of this analysis are included in Table 4.
Supporting Information
Zdroje
1. HindorffLA, SethupathyP, JunkinsHA, RamosEM, MehtaJP, et al. (2009) Potential etiologic and functional implications of genome-wide association loci for human diseases and traits. Proc Natl Acad Sci 106 : 9362–9367 doi:10.1073/pnas.0903103106
2. DennyJC, RitchieMD, BasfordMA, PulleyJM, BastaracheL, et al. (2010) PheWAS: demonstrating the feasibility of a phenome-wide scan to discover gene-disease associations. Bioinforma Oxf Engl 26 : 1205–1210 doi:10.1093/bioinformatics/btq126
3. PendergrassSA, Brown-GentryK, DudekSM, TorstensonES, AmbiteJL, et al. (2011) The use of phenome-wide association studies (PheWAS) for exploration of novel genotype-phenotype relationships and pleiotropy discovery. Genet Epidemiol 35 : 410–422 doi:10.1002/gepi.20589
4. PendergrassSA, Brown-GentryK, DudekS, FraseA, TorstensonES, et al. (2013) Phenome-wide association study (PheWAS) for detection of pleiotropy within the Population Architecture using Genomics and Epidemiology (PAGE) Network. PLoS Genet 9: e1003087 doi:10.1371/journal.pgen.1003087
5. DennyJC, BastaracheL, RitchieMD, CarrollRJ, ZinkR, et al. (2013) Systematic comparison of phenome-wide association study of electronic medical record data and genome-wide association study data. Nat Biotechnol 31 : 1102–1110 doi:10.1038/nbt.2749
6. SolovieffN, CotsapasC, LeePH, PurcellSM, SmollerJW (2013) Pleiotropy in complex traits: challenges and strategies. Nat Rev Genet 14 : 483–495 doi:10.1038/nrg3461
7. SivakumaranS, AgakovF, TheodoratouE, PrendergastJG, ZgagaL, et al. (2011) Abundant pleiotropy in human complex diseases and traits. Am J Hum Genet 89 : 607–618 doi:10.1016/j.ajhg.2011.10.004
8. MatiseTC, AmbiteJL, BuyskeS, CarlsonCS, ColeSA, et al. (2011) The Next PAGE in understanding complex traits: design for the analysis of Population Architecture Using Genetics and Epidemiology (PAGE) Study. Am J Epidemiol 174 : 849–859 doi:10.1093/aje/kwr160
9. McQuillanGM, PanQ, PorterKS (2006) Consent for genetic research in a general population: an update on the National Health and Nutrition Examination Survey experience. Genet Med Off J Am Coll Med Genet 8 : 354–360 doi:10.109701.gim.0000223552.70393.08
10. DumitrescuL, CartyCL, TaylorK, SchumacherFR, HindorffLA, et al. (2011) Genetic determinants of lipid traits in diverse populations from the population architecture using genomics and epidemiology (PAGE) study. PLoS Genet 7: e1002138 doi:10.1371/journal.pgen.1002138
11. DumitrescuL, GlennK, Brown-GentryK, ShephardC, WongM, et al. (2011) Variation in LPA Is Associated with Lp(a) Levels in Three Populations from the Third National Health and Nutrition Examination Survey. PLoS ONE 6: e16604 doi:10.1371/journal.pone.0016604
12. KeeblerME, SandersCL, SurtiA, GuiducciC, BurttNP, et al. (2009) Association of blood lipids with common DNA sequence variants at 19 genetic loci in the multiethnic United States National Health and Nutrition Examination Survey III. Circ Cardiovasc Genet 2 : 238–243 doi:10.1161/CIRCGENETICS.108.829473
13. AulchenkoYS, RipattiS, LindqvistI, BoomsmaD, HeidIM, et al. (2009) Loci influencing lipid levels and coronary heart disease risk in 16 European population cohorts. Nat Genet 41 : 47–55 doi:10.1038/ng.269
14. SabattiC, ServiceSK, HartikainenA-L, PoutaA, RipattiS, et al. (2009) Genome-wide association analysis of metabolic traits in a birth cohort from a founder population. Nat Genet 41 : 35–46 doi:10.1038/ng.271
15. KathiresanS, MelanderO, GuiducciC, SurtiA, BurttNP, et al. (2008) Six new loci associated with blood low-density lipoprotein cholesterol, high-density lipoprotein cholesterol or triglycerides in humans. Nat Genet 40 : 189–197 doi:10.1038/ng.75
16. WaterworthDM, RickettsSL, SongK, ChenL, ZhaoJH, et al. (2010) Genetic variants influencing circulating lipid levels and risk of coronary artery disease. Arterioscler Thromb Vasc Biol 30 : 2264–2276 doi:10.1161/ATVBAHA.109.201020
17. KathiresanS, WillerCJ, PelosoGM, DemissieS, MusunuruK, et al. (2009) Common variants at 30 loci contribute to polygenic dyslipidemia. Nat Genet 41 : 56–65 doi:10.1038/ng.291
18. BolibarI, von EckardsteinA, AssmannG, ThompsonS (2000) ECAT Angina Pectoris Study Group. European Concerted Action on Thrombosis and Disabilities (2000) Short-term prognostic value of lipid measurements in patients with angina pectoris. The ECAT Angina Pectoris Study Group: European Concerted Action on Thrombosis and Disabilities. Thromb Haemost 84 : 955–960.
19. CastelliWP, GarrisonRJ, WilsonPW, AbbottRD, KalousdianS, et al. (1986) Incidence of coronary heart disease and lipoprotein cholesterol levels. The Framingham Study. JAMA J Am Med Assoc 256 : 2835–2838.
20. KöttgenA, AlbrechtE, TeumerA, VitartV, KrumsiekJ, et al. (2013) Genome-wide association analyses identify 18 new loci associated with serum urate concentrations. Nat Genet 45 : 145–154 doi:10.1038/ng.2500
21. KarnsR, ZhangG, SunG, Rao IndugulaS, ChengH, et al. (2012) Genome-wide association of serum uric acid concentration: replication of sequence variants in an island population of the Adriatic coast of Croatia. Ann Hum Genet 76 : 121–127 doi:10.1111/j.1469-1809.2011.00698.x
22. KolzM, JohnsonT, SannaS, TeumerA, VitartV, et al. (2009) Meta-analysis of 28,141 individuals identifies common variants within five new loci that influence uric acid concentrations. PLoS Genet 5: e1000504 doi:10.1371/journal.pgen.1000504
23. DehghanA, KöttgenA, YangQ, HwangS-J, KaoWL, et al. (2008) Association of three genetic loci with uric acid concentration and risk of gout: a genome-wide association study. Lancet 372 : 1953–1961 doi:10.1016/S0140-6736(08)61343-4
24. SchunkertH, KönigIR, KathiresanS, ReillyMP, AssimesTL, et al. (2011) Large-scale association analysis identifies 13 new susceptibility loci for coronary artery disease. Nat Genet 43 : 333–338 doi:10.1038/ng.784
25. WillerCJ, SannaS, JacksonAU, ScuteriA, BonnycastleLL, et al. (2008) Newly identified loci that influence lipid concentrations and risk of coronary artery disease. Nat Genet 40 : 161–169 doi:10.1038/ng.76
26. Myocardial Infarction Genetics Consortium (2009) KathiresanS, VoightBF, PurcellS, MusunuruK, et al. (2009) Genome-wide association of early-onset myocardial infarction with single nucleotide polymorphisms and copy number variants. Nat Genet 41 : 334–341 doi:10.1038/ng.327
27. PierceBL, BiggsML, DeCambreM, ReinerAP, LiC, et al. (2009) C-reactive protein, interleukin-6, and prostate cancer risk in men aged 65 years and older. Cancer Causes Control CCC 20 : 1193–1203 doi:10.1007/s10552-009-9320-4
28. WalstonJD, FallinMD, CushmanM, LangeL, PsatyB, et al. (2007) IL-6 gene variation is associated with IL-6 and C-reactive protein levels but not cardiovascular outcomes in the Cardiovascular Health Study. Hum Genet 122 : 485–494 doi:10.1007/s00439-007-0428-x
29. VickersMA, GreenFR, TerryC, MayosiBM, JulierC, et al. (2002) Genotype at a promoter polymorphism of the interleukin-6 gene is associated with baseline levels of plasma C-reactive protein. Cardiovasc Res 53 : 1029–1034.
30. RichardsJB, RivadeneiraF, InouyeM, PastinenTM, SoranzoN, et al. (2008) Bone mineral density, osteoporosis, and osteoporotic fractures: a genome-wide association study. Lancet 371 : 1505–1512 doi:10.1016/S0140-6736(08)60599-1
31. FranceschiniN, van RooijFJA, PrinsBP, FeitosaMF, KarakasM, et al. (2012) Discovery and fine mapping of serum protein loci through transethnic meta-analysis. Am J Hum Genet 91 : 744–753 doi:10.1016/j.ajhg.2012.08.021
32. OsmanW, OkadaY, KamataniY, KuboM, MatsudaK, et al. (2012) Association of common variants in TNFRSF13B, TNFSF13, and ANXA3 with serum levels of non-albumin protein and immunoglobulin isotypes in Japanese. PloS One 7: e32683 doi:10.1371/journal.pone.0032683
33. GiegerC, RadhakrishnanA, CvejicA, TangW, PorcuE, et al. (2011) New gene functions in megakaryopoiesis and platelet formation. Nature 480 : 201–208 doi:10.1038/nature10659
34. MiddelbergRPS, FerreiraMAR, HendersAK, HeathAC, MaddenPAF, et al. (2011) Genetic variants in LPL, OASL and TOMM40/APOE-C1-C2-C4 genes are associated with multiple cardiovascular-related traits. BMC Med Genet 12 : 123 doi:10.1186/1471-2350-12-123
35. DehghanA, DupuisJ, BarbalicM, BisJC, EiriksdottirG, et al. (2011) Meta-analysis of genome-wide association studies in >80 000 subjects identifies multiple loci for C-reactive protein levels. Circulation 123 : 731–738 doi:10.1161/CIRCULATIONAHA.110.948570
36. TeslovichTM, MusunuruK, SmithAV, EdmondsonAC, StylianouIM, et al. (2010) Biological, clinical and population relevance of 95 loci for blood lipids. Nature 466 : 707–713 doi:10.1038/nature09270
37. KöttgenA, PattaroC, BögerCA, FuchsbergerC, OldenM, et al. (2010) New loci associated with kidney function and chronic kidney disease. Nat Genet 42 : 376–384 doi:10.1038/ng.568
38. ChambersJC, ZhangW, SehmiJ, LiX, WassMN, et al. (2011) Genome-wide association study identifies loci influencing concentrations of liver enzymes in plasma. Nat Genet 43 : 1131–1138 doi:10.1038/ng.970
39. LemaitreRN, TanakaT, TangW, ManichaikulA, FoyM, et al. (2011) Genetic loci associated with plasma phospholipid n-3 fatty acids: a meta-analysis of genome-wide association studies from the CHARGE Consortium. PLoS Genet 7: e1002193 doi:10.1371/journal.pgen.1002193
40. EijgelsheimM, Newton-ChehC, SotoodehniaN, de BakkerPIW, MüllerM, et al. (2010) Genome-wide association analysis identifies multiple loci related to resting heart rate. Hum Mol Genet 19 : 3885–3894 doi:10.1093/hmg/ddq303
41. IlligT, GiegerC, ZhaiG, Römisch-MarglW, Wang-SattlerR, et al. (2010) A genome-wide perspective of genetic variation in human metabolism. Nat Genet 42 : 137–141 doi:10.1038/ng.507
42. KanehisaM, GotoS (2000) KEGG: kyoto encyclopedia of genes and genomes. Nucleic Acids Res 28 : 27–30.
43. AshburnerM, BallCA, BlakeJA, BotsteinD, ButlerH, et al. (2000) Gene ontology: tool for the unification of biology. The Gene Ontology Consortium. Nat Genet 25 : 25–29 doi:10.1038/75556
44. KandasamyK, MohanSS, RajuR, KeerthikumarS, KumarGSS, et al. (2010) NetPath: a public resource of curated signal transduction pathways. Genome Biol 11: R3 doi:10.1186/gb-2010-11-1-r3
45. SmootME, OnoK, RuscheinskiJ, WangPL, IdekerT (2011) Cytoscape 2.8: new features for data integration and network visualization. Bioinformatics 27 : 431–432 doi:10.1093/bioinformatics/btq675
46. GhioAJ, FordES, KennedyTP, HoidalJR (2005) The association between serum ferritin and uric acid in humans. Free Radic Res 39 : 337–342 doi:10.1080/10715760400026088
47. ReinerAP, LettreG, NallsMA, GaneshSK, MathiasR, et al. (2011) Genome-wide association study of white blood cell count in 16,388 African Americans: the continental origins and genetic epidemiology network (COGENT). PLoS Genet 7: e1002108 doi:10.1371/journal.pgen.1002108
48. ReichD, NallsMA, KaoWHL, AkylbekovaEL, TandonA, et al. (2009) Reduced neutrophil count in people of African descent is due to a regulatory variant in the Duffy antigen receptor for chemokines gene. PLoS Genet 5: e1000360 doi:10.1371/journal.pgen.1000360
49. SemmlerA, MoskauS, GrigullA, FarmandS, KlockgetherT, et al. (2010) Plasma folate levels are associated with the lipoprotein profile: a retrospective database analysis. Nutr J 9 : 31 doi:10.1186/1475-2891-9-31
50. WolfeD, DudekS, RitchieMD, PendergrassSA (2013) Visualizing genomic information across chromosomes with PhenoGram. BioData Min 6 : 18 doi:10.1186/1756-0381-6-18
51. PendergrassSA, DudekSM, CrawfordDC, RitchieMD (2012) Visually integrating and exploring high throughput Phenome-Wide Association Study (PheWAS) results using PheWAS-View. BioData Min 5 : 5 doi:10.1186/1756-0381-5-5
52. TRDC T (2009) R: A Language and Environment for Statistical Computing.
53. PendergrassSA, FraseA, WallaceJ, WolfeD, KatiyarN, et al. (2013) Genomic analyses with biofilter 2.0: knowledge driven filtering, annotation, and model development. BioData Min 6 : 25 doi:10.1186/1756-0381-6-25
54. Bush WS, Dudek SM, Ritchie MD (2009) Biofilter: a knowledge-integration system for the multi-locus analysis of genome-wide association studies. Pac Symp Biocomput Pac Symp Biocomput: 368–379.
55. BoyleAP, HongEL, HariharanM, ChengY, SchaubMA, et al. (2012) Annotation of functional variation in personal genomes using RegulomeDB. Genome Res 22 : 1790–1797 doi:10.1101/gr.137323.112
Štítky
Genetika Reprodukční medicína
Článek Large-scale Metabolomic Profiling Identifies Novel Biomarkers for Incident Coronary Heart DiseaseČlánek Notch Signaling Mediates the Age-Associated Decrease in Adhesion of Germline Stem Cells to the NicheČlánek Phosphorylation of Mitochondrial Polyubiquitin by PINK1 Promotes Parkin Mitochondrial TetheringČlánek Natural Variation Is Associated With Genome-Wide Methylation Changes and Temperature SeasonalityČlánek Overlapping and Non-overlapping Functions of Condensins I and II in Neural Stem Cell DivisionsČlánek Unisexual Reproduction Drives Meiotic Recombination and Phenotypic and Karyotypic Plasticity inČlánek Tetraspanin (TSP-17) Protects Dopaminergic Neurons against 6-OHDA-Induced Neurodegeneration inČlánek ABA-Mediated ROS in Mitochondria Regulate Root Meristem Activity by Controlling Expression inČlánek Mutations in Global Regulators Lead to Metabolic Selection during Adaptation to Complex EnvironmentsČlánek The Evolution of Sex Ratio Distorter Suppression Affects a 25 cM Genomic Region in the Butterfly
Článek vyšel v časopisePLOS Genetics
Nejčtenější tento týden
2014 Číslo 12- Akutní intermitentní porfyrie
- Růst a vývoj dětí narozených pomocí IVF
- Vliv melatoninu a cirkadiálního rytmu na ženskou reprodukci
- Délka menstruačního cyklu jako marker ženské plodnosti
- Farmakogenetické testování pomáhá předcházet nežádoucím efektům léčiv
-
Všechny články tohoto čísla
- Stratification by Smoking Status Reveals an Association of Genotype with Body Mass Index in Never Smokers
- Genome Wide Meta-analysis Highlights the Role of Genetic Variation in in the Regulation of Circulating Serum Chemerin
- Occupancy of Mitochondrial Single-Stranded DNA Binding Protein Supports the Strand Displacement Mode of DNA Replication
- Distinct Genealogies for Plasmids and Chromosome
- Large-scale Metabolomic Profiling Identifies Novel Biomarkers for Incident Coronary Heart Disease
- Non-coding RNAs Prevent the Binding of the MSL-complex to Heterochromatic Regions
- Plasmid Flux in ST131 Sublineages, Analyzed by Plasmid Constellation Network (PLACNET), a New Method for Plasmid Reconstruction from Whole Genome Sequences
- Epigenome-Guided Analysis of the Transcriptome of Plaque Macrophages during Atherosclerosis Regression Reveals Activation of the Wnt Signaling Pathway
- The Inventiveness of Nature: An Interview with Werner Arber
- Mediation Analysis Demonstrates That -eQTLs Are Often Explained by -Mediation: A Genome-Wide Analysis among 1,800 South Asians
- Generation of Antigenic Diversity in by Structured Rearrangement of Genes During Mitosis
- A Massively Parallel Pipeline to Clone DNA Variants and Examine Molecular Phenotypes of Human Disease Mutations
- Genetic Analysis of the Cardiac Methylome at Single Nucleotide Resolution in a Model of Human Cardiovascular Disease
- Genetic Analysis of Circadian Responses to Low Frequency Electromagnetic Fields in
- The Dissection of Meiotic Chromosome Movement in Mice Using an Electroporation Technique
- Altered Chromatin Occupancy of Master Regulators Underlies Evolutionary Divergence in the Transcriptional Landscape of Erythroid Differentiation
- Syd/JIP3 and JNK Signaling Are Required for Myonuclear Positioning and Muscle Function
- Notch Signaling Mediates the Age-Associated Decrease in Adhesion of Germline Stem Cells to the Niche
- Mutation of Leads to Blurred Tonotopic Organization of Central Auditory Circuits in Mice
- The IKAROS Interaction with a Complex Including Chromatin Remodeling and Transcription Elongation Activities Is Required for Hematopoiesis
- RAN-Binding Protein 9 is Involved in Alternative Splicing and is Critical for Male Germ Cell Development and Male Fertility
- Enhanced Longevity by Ibuprofen, Conserved in Multiple Species, Occurs in Yeast through Inhibition of Tryptophan Import
- Phosphorylation of Mitochondrial Polyubiquitin by PINK1 Promotes Parkin Mitochondrial Tethering
- Recurrent Loss of Specific Introns during Angiosperm Evolution
- Natural Variation Is Associated With Genome-Wide Methylation Changes and Temperature Seasonality
- SEEDSTICK is a Master Regulator of Development and Metabolism in the Arabidopsis Seed Coat
- Overlapping and Non-overlapping Functions of Condensins I and II in Neural Stem Cell Divisions
- Unisexual Reproduction Drives Meiotic Recombination and Phenotypic and Karyotypic Plasticity in
- Tetraspanin (TSP-17) Protects Dopaminergic Neurons against 6-OHDA-Induced Neurodegeneration in
- ABA-Mediated ROS in Mitochondria Regulate Root Meristem Activity by Controlling Expression in
- Mutations in Global Regulators Lead to Metabolic Selection during Adaptation to Complex Environments
- Global Analysis of Photosynthesis Transcriptional Regulatory Networks
- Mucolipin Co-deficiency Causes Accelerated Endolysosomal Vacuolation of Enterocytes and Failure-to-Thrive from Birth to Weaning
- Controlling Pre-leukemic Thymocyte Self-Renewal
- How Malaria Parasites Avoid Running Out of Ammo
- Echoes of the Past: Hereditarianism and
- Deep Reads: Strands in the History of Molecular Genetics
- Keep on Laying Eggs Mama, RNAi My Reproductive Aging Blues Away
- Analysis of a Plant Complex Resistance Gene Locus Underlying Immune-Related Hybrid Incompatibility and Its Occurrence in Nature
- Epistatic Adaptive Evolution of Human Color Vision
- Increased and Imbalanced dNTP Pools Symmetrically Promote Both Leading and Lagging Strand Replication Infidelity
- Genetic Basis of Haloperidol Resistance in Is Complex and Dose Dependent
- Genome-Wide Analysis of DNA Methylation Dynamics during Early Human Development
- Interaction between Conjugative and Retrotransposable Elements in Horizontal Gene Transfer
- The Evolution of Sex Ratio Distorter Suppression Affects a 25 cM Genomic Region in the Butterfly
- is Required for Adult Maintenance of Dopaminergic Neurons in the Ventral Substantia Nigra
- PRL1, an RNA-Binding Protein, Positively Regulates the Accumulation of miRNAs and siRNAs in Arabidopsis
- Genetic Control of Contagious Asexuality in the Pea Aphid
- Early Mesozoic Coexistence of Amniotes and Hepadnaviridae
- Local and Systemic Regulation of Plant Root System Architecture and Symbiotic Nodulation by a Receptor-Like Kinase
- Gene Pathways That Delay Reproductive Senescence
- The Evolution of Fungal Metabolic Pathways
- Maf1 Is a Novel Target of PTEN and PI3K Signaling That Negatively Regulates Oncogenesis and Lipid Metabolism
- Formation of Linear Amplicons with Inverted Duplications in Requires the MRE11 Nuclease
- Identification of Rare Causal Variants in Sequence-Based Studies: Methods and Applications to , a Gene Involved in Cohen Syndrome and Autism
- Rrp12 and the Exportin Crm1 Participate in Late Assembly Events in the Nucleolus during 40S Ribosomal Subunit Biogenesis
- The Mutations in the ATP-Binding Groove of the Rad3/XPD Helicase Lead to -Cockayne Syndrome-Like Phenotypes
- Topoisomerase I Plays a Critical Role in Suppressing Genome Instability at a Highly Transcribed G-Quadruplex-Forming Sequence
- A Cbx8-Containing Polycomb Complex Facilitates the Transition to Gene Activation during ES Cell Differentiation
- Transcriptional Frameshifting Rescues Type VI Secretion by the Production of Two Length Variants from the Prematurely Interrupted Gene
- Association Mapping across Numerous Traits Reveals Patterns of Functional Variation in Maize
- Genome-Wide Analysis of -Regulated and Phased Small RNAs Underscores the Importance of the ta-siRNA Pathway to Maize Development
- Dissemination of Cephalosporin Resistance Genes between Strains from Farm Animals and Humans by Specific Plasmid Lineages
- The Tau Tubulin Kinases TTBK1/2 Promote Accumulation of Pathological TDP-43
- Germline Signals Deploy NHR-49 to Modulate Fatty-Acid β-Oxidation and Desaturation in Somatic Tissues of
- Microevolution of in Macrophages Restores Filamentation in a Nonfilamentous Mutant
- Vangl2-Regulated Polarisation of Second Heart Field-Derived Cells Is Required for Outflow Tract Lengthening during Cardiac Development
- Chondrocytes Transdifferentiate into Osteoblasts in Endochondral Bone during Development, Postnatal Growth and Fracture Healing in Mice
- A ABC Transporter Regulates Lifespan
- RA and FGF Signalling Are Required in the Zebrafish Otic Vesicle to Pattern and Maintain Ventral Otic Identities
- , and Reprogram Thymocytes into Self-Renewing Cells
- The miR9863 Family Regulates Distinct Alleles in Barley to Attenuate NLR Receptor-Triggered Disease Resistance and Cell-Death Signaling
- Detection of Pleiotropy through a Phenome-Wide Association Study (PheWAS) of Epidemiologic Data as Part of the Environmental Architecture for Genes Linked to Environment (EAGLE) Study
- Extensive Copy-Number Variation of Young Genes across Stickleback Populations
- The and Genetic Modules Interact to Regulate Ciliogenesis and Ciliary Microtubule Patterning in
- Analysis of the Genome, Transcriptome and Secretome Provides Insight into Its Pioneer Colonization Strategies of Wood
- PLOS Genetics
- Archiv čísel
- Aktuální číslo
- Informace o časopisu
Nejčtenější v tomto čísle- Tetraspanin (TSP-17) Protects Dopaminergic Neurons against 6-OHDA-Induced Neurodegeneration in
- Maf1 Is a Novel Target of PTEN and PI3K Signaling That Negatively Regulates Oncogenesis and Lipid Metabolism
- The IKAROS Interaction with a Complex Including Chromatin Remodeling and Transcription Elongation Activities Is Required for Hematopoiesis
- Echoes of the Past: Hereditarianism and
Kurzy
Zvyšte si kvalifikaci online z pohodlí domova
Autoři: prof. MUDr. Vladimír Palička, CSc., Dr.h.c., doc. MUDr. Václav Vyskočil, Ph.D., MUDr. Petr Kasalický, CSc., MUDr. Jan Rosa, Ing. Pavel Havlík, Ing. Jan Adam, Hana Hejnová, DiS., Jana Křenková
Autoři: MUDr. Irena Krčmová, CSc.
Autoři: MDDr. Eleonóra Ivančová, PhD., MHA
Autoři: prof. MUDr. Eva Kubala Havrdová, DrSc.
Všechny kurzyPřihlášení#ADS_BOTTOM_SCRIPTS#Zapomenuté hesloZadejte e-mailovou adresu, se kterou jste vytvářel(a) účet, budou Vám na ni zaslány informace k nastavení nového hesla.
- Vzdělávání


