
ARTIST: High-Resolution Genome-Wide Assessment of Fitness Using Transposon-Insertion Sequencing
Transposon insertion sequencing (TIS) is a powerful method that couples high-density transposon mutagenesis with next-generation sequencing to comprehensively assess the fitness of thousands of transposon mutants across a genome. TIS is an extremely flexible technique that has been used to define genomic loci required for bacterial growth and survival in a variety of species and in many different growth conditions, including during host infection. However, there remain several important limitations to current TIS analysis methods. First, TIS data are not routinely normalized for the impact of experimental variability; second, most analyses are restricted to annotated loci and do not completely exploit the richness of TIS datasets; finally, TIS analysis methods are not easily accessible to most biologists. Here we present a pipeline—ARTIST—that addresses these issues and will transform TIS-based studies. We used ARTIST to conduct robust analyses of Mycobacterium tuberculosis and Vibrio cholerae in vivo TIS datasets and comprehensively defined the genetic requirements of these pathogens for host infection. The ARTIST pipeline will make TIS analysis accessible to many researchers and greatly enhance the rigor of and insights gained from TIS studies in a wide range of microorganisms.
Published in the journal:
. PLoS Genet 10(11): e32767. doi:10.1371/journal.pgen.1004782
Category:
Research Article
doi:
https://doi.org/10.1371/journal.pgen.1004782
Summary
Transposon insertion sequencing (TIS) is a powerful method that couples high-density transposon mutagenesis with next-generation sequencing to comprehensively assess the fitness of thousands of transposon mutants across a genome. TIS is an extremely flexible technique that has been used to define genomic loci required for bacterial growth and survival in a variety of species and in many different growth conditions, including during host infection. However, there remain several important limitations to current TIS analysis methods. First, TIS data are not routinely normalized for the impact of experimental variability; second, most analyses are restricted to annotated loci and do not completely exploit the richness of TIS datasets; finally, TIS analysis methods are not easily accessible to most biologists. Here we present a pipeline—ARTIST—that addresses these issues and will transform TIS-based studies. We used ARTIST to conduct robust analyses of Mycobacterium tuberculosis and Vibrio cholerae in vivo TIS datasets and comprehensively defined the genetic requirements of these pathogens for host infection. The ARTIST pipeline will make TIS analysis accessible to many researchers and greatly enhance the rigor of and insights gained from TIS studies in a wide range of microorganisms.
Introduction
Transposon-insertion sequencing (TIS) [1]–[4] is a powerful approach that enables rapid and comprehensive definition of an organism's genetic requirements for survival under a variety of different conditions (reviewed in [5], [6]). In TIS, a high-density transposon insertion library is grown under a condition of interest, and then subjected to high-throughput sequencing to map the transposon insertion site for each mutant in the library. The number of reads detected from each insertion mutant is proportional to the fitness of that mutant under the selected growth condition. Thus, strains carrying transposon insertions in loci required for survival will produce few or no reads, while reads from insertions that do not affect growth will be well-represented.
Genomic regions that are dispensable for growth in optimal laboratory conditions (e.g., rich media) but are required for survival in more stringent growth conditions are termed conditionally essential loci, whereas essential loci are thought to be required under all conditions. Because TIS is limited by sequencing capacity, here we use the terms ‘essential’ and ‘conditionally essential’ to define regions that are consistently underrepresented in reads in a given condition; the terms encompass both loci that are absolutely necessary for growth and those that can be disrupted, but are required for optimal growth. Identification of such regions, which can include non-coding sequences in addition to open reading frames, can yield considerable insight into the means by which an organism adapts to different environments. To date, comparative TIS-based studies have been carried out in diverse bacterial species and have defined genes required for survival in the presence of various nutrients and stresses as well as in experimental models of infection (reviewed in [5]).
While recent studies have firmly established the power and value of TIS, there are several shortcomings in current approaches used for TIS analysis that limit the optimal and widespread application of this technique for conditional essentiality screens. First, read counts between TIS libraries must be normalized to minimize the differences between libraries to be compared; however, current normalization protocols, which generally rely on scaling the frequency of all insertion mutants by a single factor to equalize the total number of reads per library [1], [7], do not take into account differences in library complexity that arise from stochastic processes encountered during the experiment such as biologic bottlenecks and sequence sampling error. Second, current methods for analysis of conditional essentiality are largely limited to annotated genomic features (e.g., ORFs, ncRNAs), which prevents de novo discovery of novel conditionally essential sequences. Finally, current TIS analysis methods usually rely on largely ad-hoc cutoffs (e.g., a minimum fold change in reads required for analytic consideration), and routinely utilize custom computational tools that are inaccessible to most biologists.
Here, we propose approaches to overcome these limitations of current conditional essentiality analysis. Our solutions include: 1) explicitly modeling changes in sequence abundance between libraries to simulate the systematic differences that can exist between TIS datasets; 2) a novel adaptation of a hidden Markov model, which enables annotation-independent prediction of functional importance across the entire genome; and 3) implementation of this pipeline on a single platform [8] using well-documented tools in order to offer biologists a standardized method of TIS analysis.
Our new analytic approaches are combined in a pipeline termed ARTIST (Analysis of high-Resolution Transposon-Insertion Sequences Technique), which includes both a previously characterized workflow for the definition of essential loci in a single TIS library [9] and a new pipeline for identification of conditionally essential loci. We validate the ARTIST pipeline by reanalyzing a TIS dataset from a recent study of Mycobacterium tuberculosis requirements for growth in a mouse model of infection [7]. Furthermore, we demonstrate ARTIST's versatility by carrying out a new analysis of Vibrio cholerae genomic requirements for infection in a rabbit model using a high-density transposon library created here. In both instances, ARTIST improves the detection of likely conditionally essential genes, while limiting false positive assignments. We believe the ARTIST pipeline will greatly facilitate and enhance the effectiveness of future TIS studies in a variety of organisms and conditions.
Results and Discussion
Overview of the ARTIST pipeline
The ARTIST pipeline is Matlab-based [8] and contains two different analysis tools (Figure 1). One arm, termed EL-ARTIST (for Essential Loci analysis), defines all loci that are required for growth (i.e., regions with few or no associated transposon insertions) in a TIS library generated under a single growth condition—commonly, standard laboratory conditions. While the key features of the EL-ARTIST analysis method were previously described [9], until now this approach was not publicly available as a standalone tool.

The second arm, Con-ARTIST (for Conditionally essential loci analysis) is a new tool that compares transposon libraries that have been grown under different conditions, in order to define conditionally essential loci that are only required for survival under a subset of growth conditions. The Con-ARTIST workflow includes two novel modules that improve upon current TIS analysis methods. First, simulation-based resampling aids normalization between libraries that have different frequencies of mutants due to stochastic experimental variation. Second, a hidden Markov model (HMM) dissects the genome in an annotation-independent manner, allowing the definition of both annotated and uncharacterized genomic regions according to their contribution towards growth.
In the first step of the Con-ARTIST workflow (Figure 1), mapped read counts from all transposon insertions are normalized between TIS datasets using simulation-based resampling of the control library. This creates independently simulated control libraries that reflect how mutant frequencies can change in an experiment simply due to chance events. For each of these simulated libraries, the number of reads within every annotated genomic feature (e.g., ORFs, ncRNAs, etc.) is compared to that of the same feature in the experimental dataset using a Mann-Whitney U (MWU) statistical test. Non-parametric statistical tests such as the MWU are preferred, as they make no assumptions about the distribution of reads in each dataset and thus may be less sensitive to biases in the experiment (e.g., PCR amplification jackpot events). These MWU tests identify annotated regions that contain significantly different numbers of reads in the control versus the experimental library. When MWU tests are performed on all simulated control datasets, they provide the user with an estimate of how significance values can change due to chance in the experiment.
The results from the MWU analyses can be used directly for hypothesis generation or to train an annotation-independent hidden Markov model. The HMM is a statistical model that decodes whether genomic regions belong to a particular biological category (e.g., required for growth in vivo) given the fold changes in read counts at every insertion site in the genome. The HMM output is a map of every potential transposon insertion site in the genome and each site's likelihood of being required or dispensable for growth under the experimental condition tested. As the HMM is annotation-independent, this allows the user to scan the genome at fine resolution (i.e., down to individual insertions) and discover novel loci that regulate growth, such as upstream regulatory elements in intergenic regions and domain-coding regions within annotated genes (see Text S1 for more details). Probabilities within annotated loci can also be combined and a general prediction of essentiality reported for every gene or genomic feature. The final output will be a table of all genomic loci and their predicted biologic states (e.g., no change in growth between experimental conditions, required for growth under the control condition, conditionally underrepresented or conditionally overrepresented). All ARTIST scripts and example files (Dataset S1) as well as a comprehensive user manual (see Text S1) are provided in the supplementary materials.
Genetic drift and sampling error limit the accuracy of conditional essentiality TIS analysis
Deriving meaningful results from conditional TIS experiments relies on understanding whether differences in mutant frequencies between libraries arise from selection or chance. There are two principal processes that can cause stochastic differences in mutant abundance and interfere with downstream analytical accuracy in TIS-based genetic screens: genetic drift and sampling error. In the context of a population of transposon mutants, genetic drift can be thought of as change in mutant frequencies due to random events, such as population bottlenecks and expansions [10], [11]. A stringent bottleneck will markedly alter the complexity of a library independent of the fitness of its constituent mutants (Figure S1A,B) while sampling error occurs when low abundance mutants in a mixed population are missed solely due to low sequencing saturation (Figure S1C,D).
Comparative analyses of Himar transposon libraries created in M. tuberculosis (previously described by Zhang et al. [7]) and V. cholerae (constructed for this study) grown in vitro and in animal hosts provide clear evidence for the existence of host bottlenecks and for stochastic variability in library recovery (see below). For example, we created a V. cholerae library that was used to inoculate infant rabbits, a model host for the study of cholera [12]. This library contained transposon insertions in>60% of all possible insertion sites (i.e., TA dinucleotides), while mutant recovery was highly variable between individual animals, ranging from 4–48% of possible sites disrupted (Figure S2A,B). In contrast, the libraries recovered from all rabbits collectively contained insertions in 57% of TA sites when a saturating number of reads (>3×10⁶) was sequenced, indicating that not all loss of V. cholerae library complexity in the host was due to selection. Similarly, the in vitro M. tuberculosis library contained insertions in ∼62% of potential insertion sites (Figure S2C), but libraries recovered from individual infected animals only had insertions in 26–41% of potential sites (Figure S2D).
When a relatively small proportion of the input V. cholerae library was lost during in vivo growth, the number of reads per locus was extremely reproducible among output libraries (e.g., rabbits 2 and 4; R = 0.95), whereas inter-animal correlation was less robust when the recovered libraries were less complex, presumably due to stochastic bottleneck-dependent processes (Figure S2E). Thus, host bottlenecks, which are present in most experimental TIS infection models [10], [11], [13], can present a major challenge for accurately discerning conditionally essential loci, and represent a stringent test of our method's ability to normalize TIS data.
Multinomial distribution-based simulations model stochastic drift in TIS libraries
Routinely, TIS datasets with differing library complexity are multiplicatively scaled to the same number of total reads using a single factor [1], [7], which presumes that there will be proportional retention of all neutral mutations in the library, when in fact stochastic events can cause these proportions to change markedly. To address this issue, we used a multinomial distribution to resample reads from the control data and simulate the effect that stochastic processes may exert on the experimental dataset. This simulation relies on the assumption that the observed frequencies of insertion mutants in the deeply sequenced control library approximate their true proportions in the population, such that we can use the control frequencies to define the probabilities of a multinomial distribution. Specifically, the multinomial distribution is scaled by a factor derived from the proportional difference in library complexity (i.e., number of unique sites disrupted) between the control and experimental datasets; this difference approximates the extent of genetic drift and sampling error in the experiment. Next, we use this multinomial distribution to simulate control datasets that have the same number of total reads as the experimental dataset, but have been subjected to a stochastic loss of library complexity that is similar to that experienced by the experimental library. The simulation is repeated to create independently simulated control libraries, and the variance between these libraries reflects the extent that noise from chance events can influence the validity of downstream statistical tests.
To assess whether simulation-based resampling enables more accurate downstream statistical analysis, we first tested the robustness of multinomial-based normalization when the in vitro grown V. cholerae library was subjected to increasingly severe simulated bottlenecks. Bottleneck-passaged libraries and the original TIS library were normalized either by multinomial-based resampling or simple multiplicative scaling of reads. The normalized libraries were then compared against the original in vitro TIS dataset using a Mann-Whitney U statistical test. In this test, no genes should appear significant since all libraries are derived from the same original source. In Figure S3A, we found that multinomial-based normalization (Resampling) produced dramatically (3–5 fold) fewer false positive gene assignments when compared to multiplicatively scaling (MS) at all bottleneck stringencies. Thus, a multinomial-based normalization approach is more robust at mitigating the effects of population constrictions (i.e., bottlenecks) than the standard approach of multiplicative scaling.
Since we observed lower false positive rates in simulated data, we tested the merits of our multinomial normalization using animal infection data, which derives from a more complex and relevant biological system and thus offers a stringent test of our modeling approach. We re-analyzed previously published in vitro and mouse-grown M. tuberculosis datasets [7], and identified genes that were differentially represented in vivo (p-value<0.01) by MWU test after multiplicative scaling of libraries to the same total reads (as was performed by Zhang et al. but without applying their secondary read count threshold for defining significance). We also performed 100 simulations and MWU tests in the Con-ARTIST pipeline using the same data to model the effect of stochastic population changes in the experiment. Finally, we determined how reproducibly significant (p-value<0.01) the read count changes in all genes were across all 100 simulations, and compared these data to the multiplicatively scaled result above. While multiplicative scaling produced 340 genes with significant p-values, nearly 100 of those genes failed to reach the same level of significance in the majority of our simulations (Figure 2A, blue shaded area), suggesting that modeling stochastic mutant loss due to genetic drift may limit false positive assignments. Furthermore, only 121 genes were found to have significantly different read abundance (p<0.01) in over 90% of the simulation-based statistical tests (Figure 2A,B; green shaded areas). Importantly, all 121 genes would have also been predicted by multiplicative scaling, suggesting that we have not misidentified previously non-significant genes.

In-depth analyses of two of the strongest examples of irreproducibility—rv3710 and rv3343c (Figure 2A, red dots)—illustrate how the discrepancy between genes with low reproducibility in our analyses but significant p-values by multiplicative scaling can arise. Despite a relative paucity of transposon insertions in rv3710 in the in vitro library, when compared to the mouse-passaged library, which lacks reads in the entire locus, the gene is found to be conditionally essential by MWU testing when the control library is normalized solely by multiplicative scaling (Figure 2C). However, rare insertions often disappear in resampled controls, which makes the locus appear far less significantly different in the majority of 100 MWU tests (Figure 2E). Discrepancies between results from the two normalization approaches can also occur for loci that are well represented by insertions in both in vitro and in vivo libraries, as is the case for rv3343c (Figure 2D). This gene is deemed significantly underrepresented in vivo when using multiplicative scaling, despite a relatively minor difference in reads between conditions (∼2 fold), likely because the rank sum-based MWU test is prone toward significance with large numbers of datapoints. Since rv3343c contains over 160 potential insertion sites and is well disrupted, the locus may appear statistically different due to the large number of datapoints on which the MWU test is run. In contrast, when rv3343c is subjected to simulation-based normalization, the range in reads from the control library becomes narrower, and significant differences are only observed for a small subset of the MWU comparisons (Figure 2E). The observations with rv3710 and rv3343c indicate that noise introduced by genetic drift can account for apparently significant differences in read abundance for loci that are both under-disrupted or well-disrupted in the control dataset.
Simulation can also enhance the significance value and improve identification of genes that are conditionally overrepresented. For example, rv3696c, an enriched gene (i.e., more reads in vivo than in vitro; Figure S3B), has a p-value of ∼6×10⁻⁴ in multiplicative scaling-based analyses (Figure 2A, orange dot), while simulation-based normalization yields an average p-value of ∼1.2×10⁻⁴, and yields a significant result in all 100 simulation-based MWU tests (Figure 2E).
These observations suggest that modeling the effects of genetic drift and sampling error biases inherent in TIS datasets can enhance the robustness of statistical analyses. In particular, simulation-based normalization appears to enable detection of reproducibly significant genes while avoiding many likely false positives. Importantly, we could not compensate for these biases by simply increasing the p-value stringency when using multiplicatively scaled data, as many moderately significant, but highly reproducible genes such as rv3696c would be lost alongside the potential false positives with broad variances in p-values (Figure S3C).
Novel adaptation of a hidden Markov model for conditional TIS analysis
Most current statistical analyses of TIS data [1], [7] only analyze insertions within annotated genes and therefore yield relatively low genomic resolution while also omitting intergenic regions. To circumvent these limitations, we incorporated a hidden Markov model-based module into Con-ARTIST, which seeks to predict ‘hidden states’ (i.e., regions that belong to particular biological categories) by analyzing observed ‘emissions’ (i.e., reads from transposon insertions). In TIS analysis, the HMM utilizes read counts from each insertion and those of the immediately preceding insertion to assign hidden states, and thus leverages the information inherent in bacterial genome architecture without aggregating insertions or restricting analysis to previously annotated genomic features. Recently, HMM-based approaches were independently used by us and another group [9], [14] to analyze TIS data for the identification of genomic regions required for in vitro growth of V. cholerae and M. tuberculosis, respectively. However, these approaches were limited to analyzing a single TIS dataset, and a new HMM framework is required to assign additional biological categories in the context of comparative TIS studies.
In Con-ARTIST, after simulation-based normalization, we compare the reads and calculate the fold change at every potential insertion site between the in vitro (control) simulations and in vivo (experimental) dataset. Next, MWU tests are conducted as described above for all annotated loci, and the results (i.e., the genes having been defined as significantly under - and overrepresented in vivo) are used to train both the emission probabilities of fold changes at individual transposon sites and the transition probabilities between biological states. Emission and transition probabilities along with the observed fold changes are then used by the Viterbi algorithm to predict—in an annotation independent manner—whether each insertion site in the genome most likely belongs to one of 4 biological categories: 1) sites that are fully dispensable during both in vitro and in vivo growth; 2) regions that are essential in both conditions; 3) regions that are conditionally enriched (overrepresented) in the experimental library; or 4) regions that are conditionally essential (underrepresented) in vivo.
Con-ARTIST analysis is resistant to false positive assignments
To demonstrate that our conditional HMM approach (Con-ARTIST) robustly assigns biological significance to different loci, we simulated several in vitro libraries of the Zhang et al. M. tuberculosis dataset [7] and then compared each of the simulated libraries against each other using either MWU analysis or Con-ARTIST (MWU followed by HMM). Because the simulated libraries are derived from the same dataset, a robust analysis method should not detect any significant differences between them. We used a range of p-value thresholds to define when loci were significantly different in reads, and determined the fraction of insertions that were thus false positively assigned. As expected from earlier simulations, both MWU and Con-ARTIST performed very well at low p-value cutoffs with virtually no insertions being called as significantly different in reads between simulations. However, Con-ARTIST had a more stable false positive rate across a wider dynamic range of p-values (>10% false positives at a p-value cutoff of 0.8) than the MWU method alone (>10% false positives at a p-value cutoff of 0.5), suggesting that the inclusion of the HMM is more resistant to false positive assignments than the MWU tests that it is trained upon (Figure 3A).
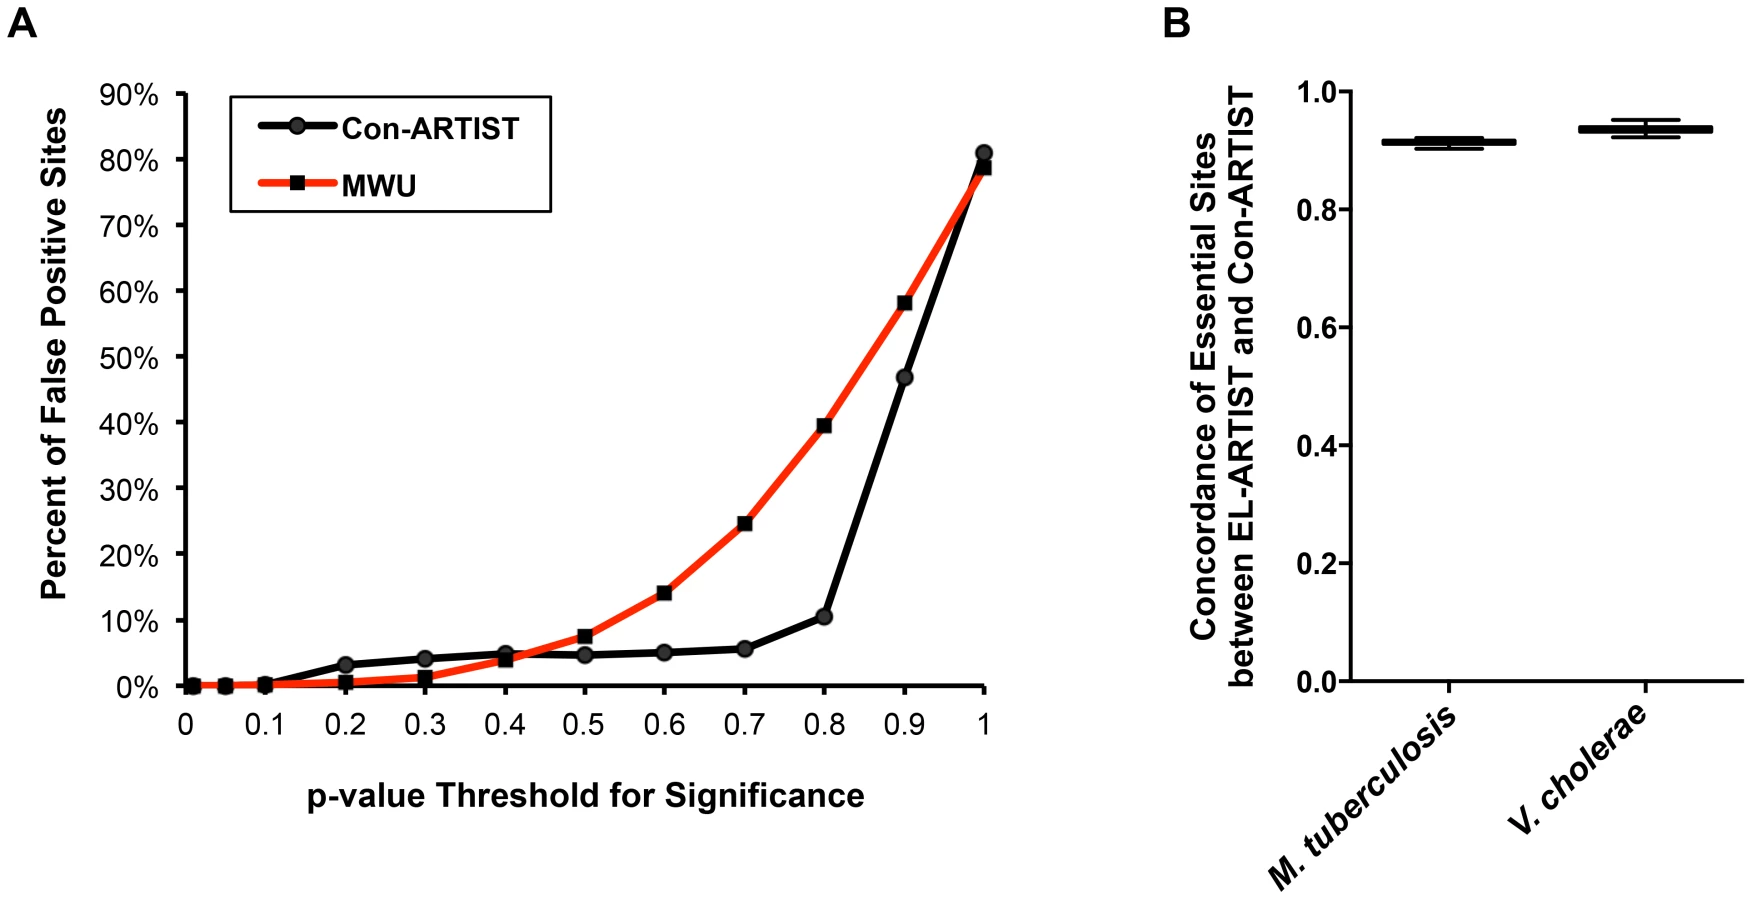
We further characterized the potential for false positives by comparing the in vitro essentiality assignments of each insertion site in M. tuberculosis and V. cholerae when the data are analyzed either by EL-ARTIST or Con-ARTIST. In vitro grown libraries of each organism were analyzed by EL-ARTIST and the essential and non-essential loci were defined, while Con-ARTIST was run on both the in vitro and in vivo grown libraries to define conditionally essential and enriched regions, in addition to essential and non-essential loci. Loci that are found to be required for in vitro growth should be highly concordant between EL-ARTIST and Con-ARTIST. Indeed, the agreement between essentiality assignments in M. tuberculosis and V. cholerae was approximately 91% and 95%, respectively, with little variation in 100 independent tests (Figure 3B), demonstrating that the inclusion of two additional biological categories (conditionally essential and enriched) to the Con-ARTIST HMM framework does not impact our ability to accurately define essential loci. Thus, Con-ARTIST appears robust relative to a HMM previously used for identification of essential loci [9].
Con-ARTIST is more selective than previous analyses of conditionally essential loci
To further assess Con-ARTIST's utility, we compared M. tuberculosis and V. cholerae genes classified by Con-ARTIST as required for optimal in vivo growth to those identified in previously published TIS or microarray-based studies [7], [11], [15], [16]. For M. tuberculosis, the Con-ARTIST pipeline classified 118 genes (Table S1) as conditionally essential for mouse infection with high likelihood (all insertion sites within these genes have>90% probability of being conditionally essential. Most of these genes (84 or 71%) overlap with those identified in previous studies by Zhang et al. [7] or Sassetti et al. [15] (Figure 4A). This overlap is significantly greater (p-value<0.05 by one-sided Fisher's exact test) than the overlaps for the Sassetti et al. and Zhang et al. datasets, which were 36% and 28%, respectively. Additionally, in all three mice, the p-values for Con-ARTIST's conditionally essential genes that overlap with those of Zhang et al. had significantly lower standard deviations across the simulation-based MWU tests than did the p-values for genes that were identified only in Zhang et al. (Figure 4B), which includes a much larger set of conditionally essential genes (371), the majority of which were not found either by our analysis or the Sassetti et al. microarray study.

Importantly, Con-ARTIST also identified genes known to be critical for M. tuberculosis virulence, such as members of the ESX-1 locus (rv3865-rv3877, Figure S4A), which encodes a virulence factor secretion system that is critical for pathogenesis and survival in vivo [17]. Notably, two conditionally essential (CE) genes known to be required for ESX-1 function, rv3869 and rv3871, which encode a translocon subunit [18] and an ATPase [17], [19], respectively, were found to be required for infection by Con-ARTIST and Sassetti et al. [15], but not by Zhang et al. [7], indicating that Con-ARTIST is more sensitive than MWU tests alone in identifying conditionally essential genes when using the same raw data. Con-ARTIST also classified 34 genes as conditionally essential that were not identified in previous studies; many of these genes have consistently fewer read counts in vivo than in vitro (Figure S4B, Table S1), suggesting they may genuinely be important for infection.
In addition to re-analyzing published M. tuberculosis data, we constructed a new high-density transposon library in V. cholerae, and assessed which genomic regions were required for infection in an infant rabbit model of disease that closely mimics human cholera [12]. This model was recently used in two additional TIS–based studies [11], [16], and we compared those results to the output of Con-ARTIST. Con-ARTIST classified 201 genes as conditionally essential in vivo (Table S3); however, this list included genes whose disruption results in mild growth defects in vitro in a previous study [16]. Because such genes were treated separately by Kamp et al., we removed them from our output list and that of Fu et al. in order to facilitate accurate comparisons. Following this filtering step, 104 genes (Figure 4C) remained in Con-ARTIST's set of genes predicted (using probability cutoffs of 85%, 90%, or 95% produced the same results) to contribute specifically to growth in vivo (Figure S5A). The majority of the conditionally essential genes (72%) were also identified in at least one of the other two studies; in comparison, the overlaps for Kamp et al. and Fu et al. were 62% and 22%, respectively. Con-ARTIST's overlap with Kamp et al. is significantly higher (p-value<0.005 by one-sided Fisher's exact test) than the overlap between Kamp et al. and Fu et al. All three studies classified numerous genes known to be critical virulence factors as conditionally essential in vivo (Table S3), including proteins involved in the production of the type IV pilus, TCP, which mediates cell-to-cell adhesion [20] and is required for human infection [21]. Universally detected genes also included those encoding enzymes that mediate synthesis of various amino acids, suggesting that the host does not provide a sufficient supply of these nutrients to support V. cholerae growth in the small intestine (Figure S6).
Con-ARTIST did not identify 19 genes classed as conditionally essential by both previous analyses (Figure 4C). In our control library, these genes on average were disrupted at <50% of their TA sites, whereas almost all of the 104 conditionally essential genes that were identified by Con-ARTIST contained a significantly higher percentage of insertions (Figure S5B), suggesting that some conditionally essential genes may have been missed by our analysis because of low insertion frequencies in the control library rather than due to computational issues. We also constructed in-frame deletions for 8 genes that were defined as conditionally essential by Kamp et al. but were not found to be required by Con-ARTIST and tested the ability of these strains to colonize the rabbit host. None of the deletion strains had any apparent growth defect in vitro (Figure S5C) or significant attenuation in the host (Figure 4D). This result is consistent with our expectation that Con-ARTIST should reduce false positive assignments.
Con-ARTIST defined 29 V. cholerae conditionally essential genes that were not identified in either of the two previous studies. Many of these genes belong to pathways that have been previously implicated in V. cholerae growth in vivo [11], [16], suggesting that the Con-ARTIST classification is correct. For example, Con-ARTIST significantly (p-values<0.05 by one-sided Fisher's exact tests) defines more genes linked to oxidative phosphorylation and respiration as important for growth in vivo than found by Kamp et al. and Fu et al. (Figure S5D). We created deletions in 5 conditionally essential candidates that were defined solely by Con-ARTIST, and assessed the ability of these strains to colonize the rabbit. These mutants grew normally in vitro (Figure S5C), but two of the five mutants, Δvc0432 and Δvc2055, were significantly attenuated (p-value≤0.01) approximately 30-fold attenuated in vivo (Figure 4D). Thus, Con-ARTIST has the capacity to identify legitimate conditionally essential loci that were not found using other analysis methods, while apparently minimizing false positive calls, suggesting that the analysis pipeline is robust.
Con-ARTIST enables high-resolution genomic interrogation of conditional essentiality
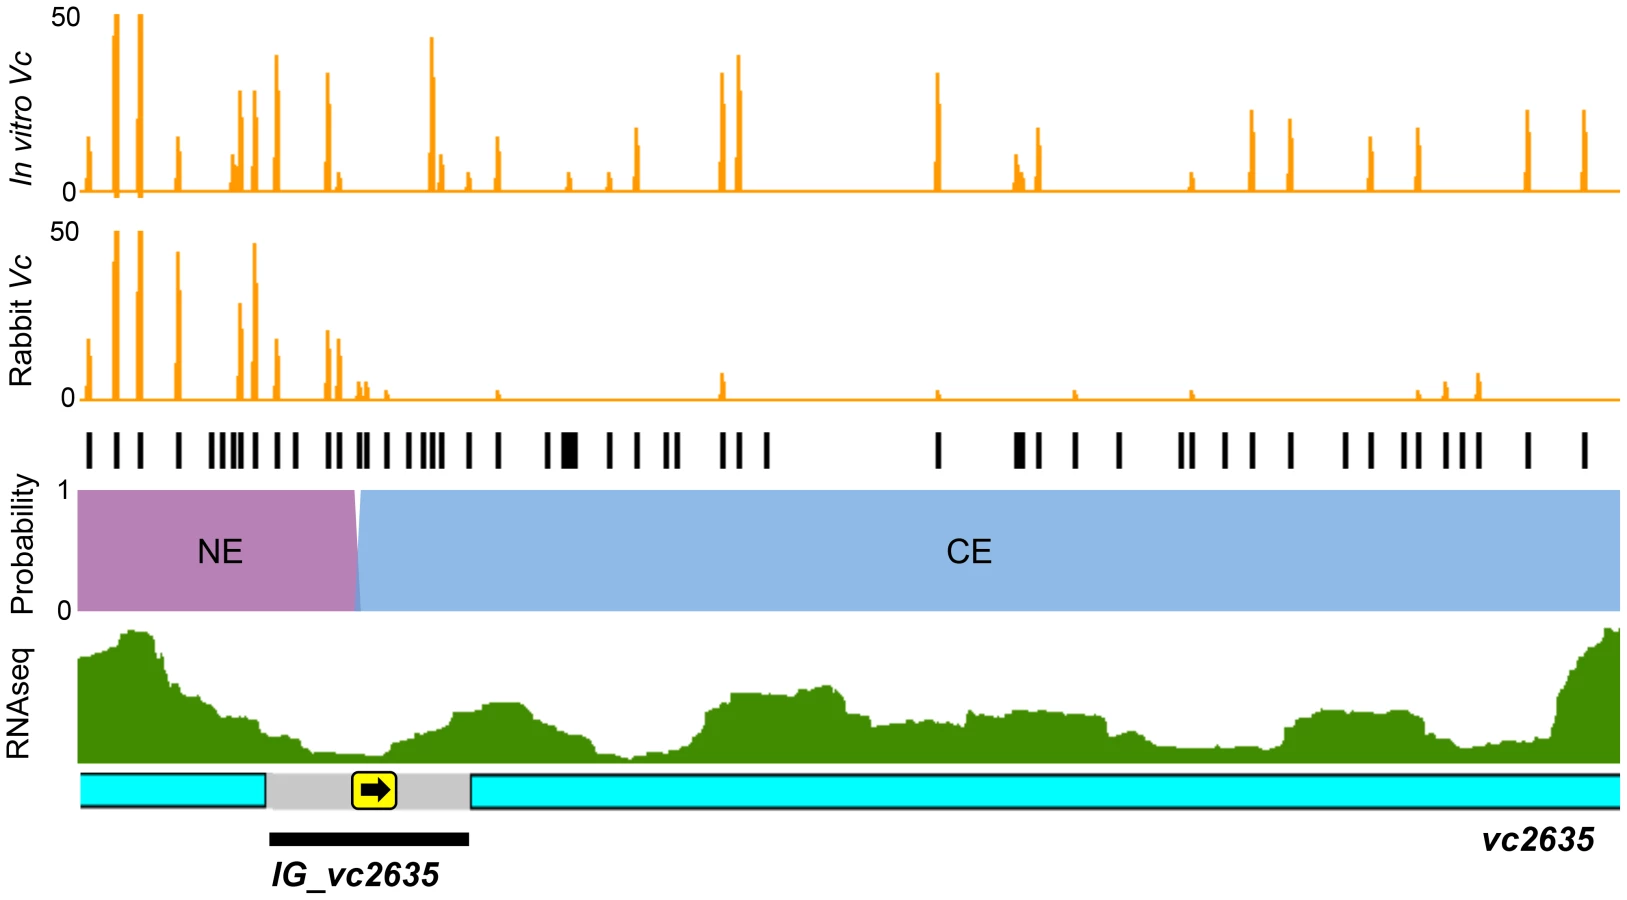
Con-ARTIST enables annotation-independent identification of genomic regions of conditional essentiality, thereby facilitating definition of unannotated intergenic features, including non-coding RNAs (ncRNAs) and cis-acting regions. Con-ARTIST consistently classified 51 V. cholerae intergenic loci (Table S4) and 20 M. tuberculosis intergenic loci (Table S2) as conditionally essential or domain conditionally essential (i.e., containing both regions of conditional essentiality and regions that do not significantly vary in reads) in vivo. Over 90% of the V. cholerae intergenic regions were upstream of genes found to be required for host infection, suggesting they may identify promoters or 5′ UTRs that control the expression of downstream conditionally essential genes. An illustration of one such region—the intergenic region upstream of vc2635—is shown in Figure 5. vc2635 encodes penicillin-binding protein 1A, a cell wall synthesis enzyme that was recently shown to be required for optimal V. cholerae growth in vivo [22]. Con-ARTIST defines the upstream intergenic region, IG_vc2635, as domain conditionally essential, and assigns the boundary between non-essential and conditionally essential sequence adjacent to the predicted −35 and −10 promoter sequences (Figure 5). Conditionally essential sequence extends uninterrupted from this site into the vc2635 open read frame, which may suggest a polar effect of the transposon (e.g., disruption of a 5′ UTR or other regulatory region). Transcriptomic analysis of V. cholerae [23] detected transcripts that overlap well with the predicted conditionally essential region of IG_vc2635 (Figure 5). This example highlights Con-ARTIST's utility in defining conditionally essential features within unannotated intergenic regions.
Con-ARTIST can also define sub-genic regions of conditional essentiality, which can provide insight into gene domains that are important in particular environments. We identified 16 genes in M. tuberculosis and 22 genes in V. cholerae that appear to contain domains that are dispensable in vitro but required for in vivo growth (Table S1, S3). For example, rv0018c, which encodes the phosphatase PstP, tolerates insertions in its C-terminus-coding region in vitro, but these mutants were not recovered from infected mice (Figure 6A), suggesting that the product of this region is essential in vivo. In contrast, insertions within the N-terminus appear to prevent M. tuberculosis survival both in vitro and in vivo. Interestingly, the essential and conditionally essential regions correspond closely with predicted protein domains within the gene and their likely subcellular localizations: the essential serine/threonine phosphatase domain (PP2Cc) appears to be cytosolic, whereas the conditionally essential proline-rich region (PRR) is largely periplasmic (Figure 6C). Similarly, the uncharacterized V. cholerae gene vc2041 is predicted by Con-ARTIST to consist of an N-terminal domain required for growth in vitro and a C-terminal region that is conditionally essential for survival in the rabbit (Figure 6B). The essential region covers a domain of unknown function (DUF3413) that contains several putative transmembrane passes, while the in vivo essential region overlaps a predicted sulfatase domain that is likely periplasmic (Figure 6D). Thus, Con-ARTIST appears capable of defining sequence encoding protein domains that likely have functionally distinct roles. The ability of Con-ARTIST to interrogate both intergenic and sub-genic regions in an annotation-independent manner across the entire genome is a novel and compelling aspect of this approach, as these features are typically omitted or missed by the aggregative statistical methods routinely used for conditional TIS analyses.

Conclusions and perspectives
The ARTIST pipeline should be extremely useful for future genome-wide analyses of essential and conditionally essential loci in a variety of organisms. Users should note that while ARTIST takes certain TIS limitations into account, the analysis is most powerful when several TIS parameters are optimal: high starting library diversity, near sequencing saturation of every mutant and minimal impact from experimental bottlenecks. These metrics, however, are unique to different libraries, organisms and experimental setups. Consequently, we have provided scripts in the ARTIST package (Dataset S1) to assess these experimental parameters and enable users to determine whether ARTIST can provide an appropriate analysis for custom TIS data (see Text S1 for instructions and more in-depth discussion). We can report specifically from studies in V. cholerae and M. tuberculosis that we were able to generate accurate TIS analysis using Con-ARTIST when the starting TIS library contained insertions at>60% of all potential insertion sites, and that ∼50% of these insertions were retained after selection in the host. Also, unique mutant discovery in control and experimental libraries began to plateau at around 500,000 reads, and sequencing depths of 2–4 million reads typically produced 10–100 reads per neutral insertion, which was sufficient for Con-ARTIST analysis.
In addition, the HMM module of Con-ARTIST is designed for the analysis of sequentially derived interrelated libraries (i.e., all mutants recovered from one growth condition are a subset of the control library), and HMM analysis of libraries derived in parallel (i.e., libraries that may contain a different complement of insertion mutants) may be problematic. Nonetheless, analyses of individually derived libraries can still be conducted using Con-ARTIST without invoking the HMM module (see Text S1), albeit these analyses will be restricted to annotated loci rather than providing high-resolution insight at single insertion level.
Finally, although ARTIST was developed to analyze TIS datasets generated using Mariner-based transposons, which insert specifically at TA dinucleotides [24], [25], it should be adaptable to analysis of TIS data generated using Tn5 transposons, which have no absolute sequence specificity [4], [16], [26] (see Text S1 for details). We expect that with such modifications ARTIST will allow for annotation independent analysis of Tn5 data; however, its utility with Tn5-based TIS data has not yet been tested.
Despite these caveats, ARTIST represents a major step forward in making high-throughput TIS analysis publically available to biologists. ARTIST's novel normalization and high-resolution methodologies enable statistically rigorous annotation-independent identification of loci that are required for growth in one condition (EL-ARTIST) or loci that are conditionally essential or enriched in different conditions (Con-ARTIST), and will enhance the power of TIS-based studies in variety of organisms and experimental conditions.
Materials and Methods
Strains, media, and culture conditions
Wildtype Vibrio cholerae C6706 was grown on LB Miller (1% NaCl) supplemented with 200 ug/mL streptomycin (Sm), while the V. cholerae transposon mutant library was selected on LB+Sm+50 ug/mL kanamycin (Km). Escherichia coli SM10 lambda pir carrying the conjugative suicide transposon vector pSC189 [24] was grown in LB Miller supplemented with 100 ug/mL ampicillin. All V. cholerae and E. coli strains were grown overnight at 37°C unless otherwise indicated.
M. tuberculosis TIS datasets
The M. tuberculosis data used in this study was taken from day 45, wildtype infected mice raw data from the Zhang et al. dataset [7].
Construction of a high-density Vibrio cholerae transposon library
A single high-density transposon library was created in V. cholerae C6706 for rabbit infection studies. Briefly, pSC189 was conjugated into V. cholerae C6706 in 25 independent reactions. For each conjugation reaction, 200 ul of overnight stationary phase E. coli SM10 lambda pir carrying pSC189 and 200 ul of overnight stationary V. cholerae were washed in LB, mixed, pelleted, and finally resuspended in 100 ul of LB. The final resuspension was then spotted onto a 0.45 mm HA filter (Millipore, Billerica, MA, USA) on an LB plate and incubated at 37°C for 2 hours to allow conjugation (this typically yields ∼10000–30000 transposon mutants per conjugation). After conjugation, cells from the filter were resuspended in 1 mL LB by pipetting and vortexing in a conical tube. Resuspended cells from all filters were pooled and the final volume brought up to 30 mL with LB. Cells were then equally plated (3 mL) onto ten square 245×245 mm2 (Corning, Corning, NY, USA) LB+Sm+Km agar plates and grown at 30°C for 24 hours. In total, a single transposon library of ∼650000 colonies (containing insertions at 118683 TA dinucleotides, ∼62% of all potential insertion sites) was generated and used for downstream infection studies.
Infection of infant rabbits with the V. cholerae transposon library
The animal protocols used for the studies described here were reviewed and approved by the Harvard Medical Area Standing Committee on Animals (Institutional Animal Care and Use Committee protocol number 04308, Animal Welfare Assurance of Compliance number A3431-01). All animal studies were carried out in accordance with the recommendations in the Guide for the Care and Use of Laboratory Animals of the National Institutes of Health (8th edition) and the Animal Welfare Act of the United States Department of Agriculture.
All transposon mutant colonies were resuspended on the selection plate with 10 mL of LB. The scraped cells were then pooled from all plates to create the final high-density V. cholerae transposon library. From this library, 3 mL of cells were pelleted, media removed, and stored at −80°C; this is the control transposon library. 1 mL of library cells was also pelleted, washed in sodium bicarbonate (2.5 g in 100 mL; pH 9) buffer and then further diluted in buffer to an OD600 of 1.4, which corresponds to ∼2×10⁹ CFU/mL. This is the inoculum for each rabbit. Infant rabbit infections were essentially performed as described previously [12]. In brief, 2–3 day old New Zealand White infant rabbits (Pine Acre Rabbitry, Norton, MA, USA) were treated with Zantac (ranitidine-hydrochloride; GlaxoSmithKline, Brentford, UK) by intraperitoneal injection (2 ug/g body weight). After 3 hours, each rabbit was intragastrically inoculated with 109 CFU (500 ul) of the V. cholerae transposon library using a size 5 French catheter (Arrow International, Reading, PA, USA). The rabbits were housed with their mother and littermates for the duration of the experiment and euthanized at about 20 hours post-infection, or when severe watery diarrhea was observed.
At necropsy, the entire intestinal tract from the duodenum to the rectum was removed. A ∼5 cm long sample from the distal small intestine was collected, and homogenized in 1 mL sterile phosphate-buffered saline (PBS) using a mini-beadbeater-16 and two 3.2 mm stainless steel beads (BioSpec Products Inc., Bartlesville, OK, USA) for 2 minutes. The entire tissue homogenate was spread on a single 245×245 mm2 LB+Sm+Km plate. After growth for 18 hours at 30°C, the lawn of bacteria was washed off the plate with PBS, pelleted and stored at -80°C. Additionally, 1∶10 serial dilutions of the homogenates in PBS were plated for CFUs on LB+Sm+Km plates. The rabbits analyzed with the ARTIST pipeline (Rabbit 1, Rabbit 2 and Rabbit 4) had similar V. cholerae colonization (7.8×10⁹, 5×10⁹, 1.5×10⁹ CFUs/g tissue, respectively) to what was previously reported with this infection model [12].
TIS library generation and sequencing
Genomic DNA extraction was performed on the in vitro and in vivo grown bacteria as previously described [9]. Briefly, each frozen pellet of bacteria was thawed, resuspended in 1 mL of dH20 and then genomic DNA extracted using the Wizard Genomic DNA extraction kit (Promega, Madison, WI, USA). At least 10 volumes of all reagents were used for the lysis, protein removal and DNA precipitation steps for each pellet. Genomic DNA was spooled out of the final isopropanol DNA precipitation mixture using a blunted glass Pasteur pipette, successively washed in 70% and 100% ethanol and then air-dried at RT. The DNA was finally resuspended in ∼1–2 mL nuclease-free water at 65°C for at least 1 hour with frequent pipetting.
20 ug of genomic DNA was resuspended in 100 ul to a final concentration of 200 ng/ul, and then sheared to ∼200–600 bp fragments by sonication (Qsonica, Newtown, CT, USA) at 80% intensity, 30 s on, 30 s off for 40 minutes total at 4°C. After shearing, library preparation proceeded as previously described [7]. The frayed ends of 10 ug sheared DNA were repaired (Quick Blunt kit, NEB, Massachusetts, USA), adaptors ligated (sequences previously published [9]) and subjected to two rounds of PCR amplification to enrich for transposon insertion adjacent sequence and then to attach Illumina P5 and P7 hybridization sequence and barcodes for multiplexing. The final DNA libraries were gel purified on a 2% agarose gel and DNA fragments ranging from 300–500 bp extracted.
Sequencing of the libraries was conducted on a MiSeq (Illumina, San Diego, CA, USA) for 65 cycles, with a single read protocol. The resulting reads were trimmed for transposon and adaptor sequences using CLC Genomics Workbench (CLCbio, Aarhus, Denmark), and then mapped to the reference V. cholerae N16961 genome using the Bowtie aligner [27]. The total mapped reads for the in vitro input and three rabbit libraries were approximately 3×10⁶, 4×10⁵, 8×10⁵, and 1×10⁶, covering 118683, 50501, 85380, and 98546 insertion sites, respectively. This corresponds to disruption of 62%, 26%, 44% and 51% of all potential TA sites in these libraries. After mapping, the reads per TA site were tallied and assigned to annotated genes or intergenic regions using custom scripts (Dataset S1, Text S1). The raw read count data for all libraries can be found in Table S5.
Construction and in vivo growth of V. cholerae deletion strains
Deletion plasmids for V. cholerae genes were constructed by ligating PCR products generated from the primers in Table S6 to the allelic exchange vector, pCVD442 [28] using Gibson assembly [29]. Sucrose-based counter-selection was performed as described previously [28], and the junctions of each in-frame deletion were confirmed using DNA sequencing. For vc1799, two internal deletions were created: an N terminal deletion of amino acids 5–299 (Δvc1799N) and a C terminal deletion of amino acids 300–557 (Δvc1799C). The deletion strains, along with WT and lacZ - V. cholerae were then barcoded at the intergenic region between vc0610 and vc0611 with unique 30 bp random sequence tags. The barcoding does not impact bacteria fitness in vitro or in vivo (Figure S5C), and each strain was independently tagged with distinct sequences. Tagged strains were grown and used for rabbit infections as described above. The total number of barcoded WT cells was approximately equal to the total number of mutant V. cholerae in the inoculum.
Rabbit tissue was harvested and V. cholerae gDNA isolated as described above. The sequence tags of all strains were amplified from the inoculum and rabbit samples using flanking primers and the PCR products subjected to Illumina sequencing (approximately 300,000 reads per sample). Low quality reads were discarded and extraneous sequences surrounding the barcode were trimmed using reaper-12-340 [30]. Sequences for each strain were clustered and read counts enumerated using uclust [31] from the QIIME 1.6.0 package [32] with a similarity threshold of 0.7. The frequency of each mutant in the rabbit samples relative to WT cells was then compared to the ratio of the mutants in the inoculum to generate a competitive index for each strain.
The Con-ARTIST workflow
All ARTIST analyses were performed using custom scripts that are included as a single package in the supplementary materials alongside example data (Dataset S1). Detailed instructions on the system requirements and use of the ARTIST scripts are provided in the user manual, also in the supplementary materials (see Text S1).
Multinomial distribution-based random samplings were performed in Matlab using the mnrnd.m function. Raw read counts were then transformed to proportions by dividing raw reads by the total number of reads. The difference in TA sites disrupted between libraries is used to adjust the probabilities for the reads at each insertion site, and another state of TA loss is added to the multinomial probability vector. The number of samplings is proportional to the number of reads sequenced, and rescaled to match the reads of the experimental library. This resampling is packaged in the custom simulateequalsaturation.m function.
Mann Whitney U tests were performed in Matlab using the ranksum.m function. Custom code is included to rapidly run the ranksum function across annotated genomic features (runmwuallboots.m function). Following the creation of simulated control datasets, each simulation is compared to the experimental dataset using a MWU test, where significant results are set at a user-specified p-value cutoff. The MWU results are used to train a hidden Markov model using the Baum-Welch algorithm. Emissions are discretized fold change ratios, as well as separate emission flags for a number divided by zero. The Baum-Welch algorithm is implemented in Matlab to estimate the transition and emission probabilities for 4 biological states (enriched, conditionally essential, essential in vitro, and non-essential). After independently training the HMM for each simulation, we run the Viterbi algorithm to decode the identity of the 4 hidden states for every insertion site in the genome. Finally, following the running of the HMM on each of the simulations, we calculate the proportion of simulations predicting a particular hidden state at every single insertion site. Con-ARTIST analysis was performed between a single in vitro grown V. cholerae or M. tuberculosis dataset against each individual rabbit or mouse-passaged library. The final conditional essentiality assignment for each locus in V. cholerae and M. tuberculosis was the consensus assignment between the three independent in vivo Con-ARTIST comparisons.
False positive simulations
To assess the stability of our adaptation of the HMM in Con-ARTIST, we compared control libraries of M. tuberculosis input data using either the MWU or Con-ARTIST analysis method. At each p-value cutoff, 10 different simulations were compared in a pairwise fashion, and the average proportion of insertion sites that were called significantly different was assessed.
Additionally, using a previously published method [9], we assessed the essential gene set in the control library of M. tuberculosis and V. cholerae in the EL-ARTIST pipeline. We ran the same data in the Con-ARTIST pipeline, which also includes an essential category. We then compared the essential or nonessential identity of each insertion site as defined by EL-ARTIST or Con-ARTIST, and assessed false positive assignments by counting TA sites that disagree in essentiality between the two methods.
Data visualization
Transposon insertion read counts, Con-ARTIST probabilities and transcriptomic transcripts were overlaid on the M. tuberculosis and V. cholerae genomes and visualized using the Artemis genome browser [33].
Supporting Information
Zdroje
1. van OpijnenT, BodiKL, CamilliA (2009) Tn-seq: high-throughput parallel sequencing for fitness and genetic interaction studies in microorganisms. Nat Methods 6 : 767–772.
2. GawronskiJD, WongSM, GiannoukosG, WardDV, AkerleyBJ (2009) Tracking insertion mutants within libraries by deep sequencing and a genome-wide screen for Haemophilus genes required in the lung. Proc Natl Acad Sci U S A 106 : 16422–16427.
3. GoodmanAL, McNultyNP, ZhaoY, LeipD, MitraRD, et al. (2009) Identifying genetic determinants needed to establish a human gut symbiont in its habitat. Cell Host Microbe 6 : 279–289.
4. LangridgeGC, PhanMD, TurnerDJ, PerkinsTT, PartsL, et al. (2009) Simultaneous assay of every Salmonella Typhi gene using one million transposon mutants. Genome Res 19 : 2308–2316.
5. BarquistL, BoinettCJ, CainAK (2013) Approaches to querying bacterial genomes with transposon-insertion sequencing. RNA Biol 10 : 1161–1169.
6. van OpijnenT, CamilliA (2013) Transposon insertion sequencing: a new tool for systems-level analysis of microorganisms. Nat Rev Microbiol 11 : 435–442.
7. ZhangYJ, ReddyMC, IoergerTR, RothchildAC, DartoisV, et al. (2013) Tryptophan biosynthesis protects mycobacteria from CD4 T-cell-mediated killing. Cell 155 : 1296–1308.
8. (2013) MATLAB and Statistics Toolbox Release, R2013b. Natick, Massachusetts, United States: The MathWorks, Inc.
9. ChaoMC, PritchardJR, ZhangYJ, RubinEJ, LivnyJ, et al. (2013) High-resolution definition of the Vibrio cholerae essential gene set with hidden Markov model-based analyses of transposon-insertion sequencing data. Nucleic Acids Res 41 : 9033–9048.
10. TroyEB, LinT, GaoL, LazinskiDW, CamilliA, et al. (2013) Understanding barriers to Borrelia burgdorferi dissemination during infection using massively parallel sequencing. Infect Immun 81 : 2347–2357.
11. FuY, WaldorMK, MekalanosJJ (2013) Tn-Seq analysis of vibrio cholerae intestinal colonization reveals a role for T6SS-mediated antibacterial activity in the host. Cell Host Microbe 14 : 652–663.
12. RitchieJM, RuiH, BronsonRT, WaldorMK (2010) Back to the future: studying cholera pathogenesis using infant rabbits. MBio 1 1(1): e00047–10.
13. SkurnikD, RouxD, AschardH, CattoirV, Yoder-HimesD, et al. (2013) A comprehensive analysis of in vitro and in vivo genetic fitness of Pseudomonas aeruginosa using high-throughput sequencing of transposon libraries. PLoS Pathog 9: e1003582.
14. DeJesusMA, IoergerTR (2013) A Hidden Markov Model for identifying essential and growth-defect regions in bacterial genomes from transposon insertion sequencing data. BMC Bioinformatics 14 : 303.
15. SassettiCM, RubinEJ (2003) Genetic requirements for mycobacterial survival during infection. Proc Natl Acad Sci U S A 100 : 12989–12994.
16. KampHD, Patimalla-DipaliB, LazinskiDW, Wallace-GadsdenF, CamilliA (2013) Gene fitness landscapes of Vibrio cholerae at important stages of its life cycle. PLoS Pathog 9: e1003800.
17. HsuT, Hingley-WilsonSM, ChenB, ChenM, DaiAZ, et al. (2003) The primary mechanism of attenuation of bacillus Calmette-Guerin is a loss of secreted lytic function required for invasion of lung interstitial tissue. Proc Natl Acad Sci U S A 100 : 12420–12425.
18. BrodinP, MajlessiL, MarsollierL, de JongeMI, BottaiD, et al. (2006) Dissection of ESAT-6 system 1 of Mycobacterium tuberculosis and impact on immunogenicity and virulence. Infect Immun 74 : 88–98.
19. GuinnKM, HickeyMJ, MathurSK, ZakelKL, GrotzkeJE, et al. (2004) Individual RD1-region genes are required for export of ESAT-6/CFP-10 and for virulence of Mycobacterium tuberculosis. Mol Microbiol 51 : 359–370.
20. KirnTJ, LaffertyMJ, SandoeCM, TaylorRK (2000) Delineation of pilin domains required for bacterial association into microcolonies and intestinal colonization by Vibrio cholerae. Mol Microbiol 35 : 896–910.
21. HerringtonDA, HallRH, LosonskyG, MekalanosJJ, TaylorRK, et al. (1988) Toxin, toxin-coregulated pili, and the toxR regulon are essential for Vibrio cholerae pathogenesis in humans. J Exp Med 168 : 1487–1492.
22. DorrT, MollA, ChaoMC, CavaF, LamH, et al. (2014) Differential Requirement for PBP1a and PBP1b in In Vivo and In Vitro Fitness of Vibrio cholerae. Infect Immun 82 : 2115–2124.
23. MandlikA, LivnyJ, RobinsWP, RitchieJM, MekalanosJJ, et al. (2011) RNA-Seq-based monitoring of infection-linked changes in Vibrio cholerae gene expression. Cell Host Microbe 10 : 165–174.
24. ChiangSL, RubinEJ (2002) Construction of a mariner-based transposon for epitope-tagging and genomic targeting. Gene 296 : 179–185.
25. RubinEJ, AkerleyBJ, NovikVN, LampeDJ, HussonRN, et al. (1999) In vivo transposition of mariner-based elements in enteric bacteria and mycobacteria. Proc Natl Acad Sci U S A 96 : 1645–1650.
26. BarquistL, LangridgeGC, TurnerDJ, PhanMD, TurnerAK, et al. (2013) A comparison of dense transposon insertion libraries in the Salmonella serovars Typhi and Typhimurium. Nucleic Acids Res 41 : 4549–4564.
27. LangmeadB, SalzbergSL (2012) Fast gapped-read alignment with Bowtie 2. Nat Methods 9 : 357–359.
28. DonnenbergMS, KaperJB (1991) Construction of an eae deletion mutant of enteropathogenic Escherichia coli by using a positive-selection suicide vector. Infect Immun 59 : 4310–4317.
29. GibsonDG, YoungL, ChuangRY, VenterJC, HutchisonCA3rd, et al. (2009) Enzymatic assembly of DNA molecules up to several hundred kilobases. Nat Methods 6 : 343–345.
30. DavisMP, van DongenS, Abreu-GoodgerC, BartonicekN, EnrightAJ (2013) Kraken: a set of tools for quality control and analysis of high-throughput sequence data. Methods 63 : 41–49.
31. EdgarRC (2010) Search and clustering orders of magnitude faster than BLAST. Bioinformatics 26 : 2460–2461.
32. CaporasoJG, KuczynskiJ, StombaughJ, BittingerK, BushmanFD, et al. (2010) QIIME allows analysis of high-throughput community sequencing data. Nat Methods 7 : 335–336.
33. RutherfordK, ParkhillJ, CrookJ, HorsnellT, RiceP, et al. (2000) Artemis: sequence visualization and annotation. Bioinformatics 16 : 944–945.
34. GallagherLA, ShendureJ, ManoilC (2011) Genome-scale identification of resistance functions in Pseudomonas aeruginosa using Tn-seq. MBio 2: e00315–00310.
35. ZhangYJ, IoergerTR, HuttenhowerC, LongJE, SassettiCM, et al. (2012) Global assessment of genomic regions required for growth in Mycobacterium tuberculosis. PLoS Pathog 8: e1002946.
36. OmasitsU, AhrensCH, MullerS, WollscheidB (2014) Protter: interactive protein feature visualization and integration with experimental proteomic data. Bioinformatics 30 : 884–886.
Štítky
Genetika Reprodukční medicínaČlánek vyšel v časopise
PLOS Genetics
2014 Číslo 11
- Kazuistika – Perspektivy využití precizované medicíny v rámci personalizované specifické terapie onkologických pacientů
- Nobelova cena za chemii pro genetické nůžky: Objev, který změní naši budoucnost?
- Technologie na bázi RNA v klinické praxi: od přebarvených petúnií k terapii vzácných a dosud jen obtížně léčitelných chorob u lidí
- „Nepředstavovali jsme si, že náš výzkum povede přímo ke vzniku nových léků, dokonce ještě za našeho života“
- Bezplatné služby pro diagnostiku ATTRv amyloidózy pro kardiology
Nejčtenější v tomto čísle
- An RNA-Seq Screen of the Antenna Identifies a Transporter Necessary for Ammonia Detection
- Systematic Comparison of the Effects of Alpha-synuclein Mutations on Its Oligomerization and Aggregation
- Functional Diversity of Carbohydrate-Active Enzymes Enabling a Bacterium to Ferment Plant Biomass
- Regularized Machine Learning in the Genetic Prediction of Complex Traits
Zvyšte si kvalifikaci online z pohodlí domova
Mazová zátka a její řešení
nový kurzVšechny kurzy