
Stress Granule-Defective Mutants Deregulate Stress Responsive Transcripts
When cells encounter harsh conditions, they face an energy crisis since the stress will reduce their energy production, and at the same time cause extra demands on energy expenditure. To tackle this dilemma, cells under stress form giant agglomerates of RNA and protein, called stress granules. In these, mRNA molecules are kept silent, preventing waste of energy on producing proteins not needed under these conditions. A few mRNAs, encoding proteins required for the cell to survive, stay outside of stress granules and escape this silencing. This mechanism can protect plants and microbes against cold spells or heat shocks, and human cells exposed to oxidative damage or toxic drugs. We have investigated which genes are necessary to form stress granules, and their impact on the stress response. We discovered that mutant cells unable to form stress granules overreacted to stress, in that they produced much higher levels of the induced mRNAs. We think this means that gene regulatory proteins are sequestered inside stress granules, inhibiting their action. Stress granules may thus function as moderators that dampen the stress response, safeguarding the cell against excessive reactions.
Published in the journal:
. PLoS Genet 10(11): e32767. doi:10.1371/journal.pgen.1004763
Category:
Research Article
doi:
https://doi.org/10.1371/journal.pgen.1004763
Summary
When cells encounter harsh conditions, they face an energy crisis since the stress will reduce their energy production, and at the same time cause extra demands on energy expenditure. To tackle this dilemma, cells under stress form giant agglomerates of RNA and protein, called stress granules. In these, mRNA molecules are kept silent, preventing waste of energy on producing proteins not needed under these conditions. A few mRNAs, encoding proteins required for the cell to survive, stay outside of stress granules and escape this silencing. This mechanism can protect plants and microbes against cold spells or heat shocks, and human cells exposed to oxidative damage or toxic drugs. We have investigated which genes are necessary to form stress granules, and their impact on the stress response. We discovered that mutant cells unable to form stress granules overreacted to stress, in that they produced much higher levels of the induced mRNAs. We think this means that gene regulatory proteins are sequestered inside stress granules, inhibiting their action. Stress granules may thus function as moderators that dampen the stress response, safeguarding the cell against excessive reactions.
Introduction
Eukaryotic cells exposed to physical, chemical, or nutritional stress, activate a variety of responses. For short-term survival, rapid events mainly regulated at the post-translational level, such as phosphorylation, protein binding and relocalization, dominate. For optimization of medium-term survival and recovery, the expression program needs to change rapidly towards proteins needed for survival during the stress phase, at the expense of products linked to proliferation. Although transcriptional initiation is a major regulatory level, in particular during chronic stress, a substantial fraction of the expression change occurs on the post-transcriptional level. This is because protein synthesis consumes a major fraction of the cell's total energy production. Hence, translation needs to be tightly regulated under stress conditions, which invariably confer an energy drain on the cell. Consequently, following an increase in stress level, S. cerevisiae cells decrease the stability [1]–[3] and translation rate [4]–[6] of most mRNAs. Under such conditions, transcripts encoding proteins needed for stress survival are instead stabilized and their translation enhanced. This transition can be mediated through a shift in translation initiation factors [7]. As part of the post-transcriptional stress response program, eukaryotic cells form two types of large cytoplasmic granules containing RNA and proteins. Processing bodies (PBs) are present constitutively, but increase in number upon stress. They contain components of the mRNA degradation and silencing machineries. Stress granules (SGs) only form under conditions of severe stress. They are considered to consist of stalled translation initiation complexes, and contain initiation factors and 40S subunit components, as well as other mRNAs binding proteins; however 40S components are absent from budding yeast SGs formed after glucose deprivation [8]. Although certain proteins are found in PBs but not in SGs and vice versa, there is also a number of proteins common to PBs and SGs [9], [10], indicating the possibility of dynamic exchange of material between the two types of granules. Mutants deficient in PB formation most often also have SG deficiencies, whereas the opposite does not hold: a mutant deficient in SG formation does not necessarily have reduced PB numbers [11]. Upon stress, the number of PBs increases before the appearance of SGs; the latter are frequently observed physically close to or overlapping with PBs. These observations have led to a model where the formation of SGs is contingent on the prior formation of PBs in their immediate vicinity [11]. However, this model has recently been challenged. In yeast, SGs have been observed to be regulated by different signaling pathways than PBs [12], and individual SGs can be observed microscopically to arise independently of pre-existing PBs [13]. In mammalian cells, knockdown of specific mRNAs suppressed formation of PBs but not SGs [14].
More recently, several indications have appeared that SGs not only sequester transcripts and translation components, but also signaling and catalytic proteins. Members of the yeast TORC1 signaling complex, Tor1 (mTOR in mammalian cells) and Kog1 (Raptor), are found in SGs after heat stress [15]. In mammalian cells, SGs sequester RACK, a MAPKKK modulator under certain stress conditions, suppressing activation of p38 signaling that would otherwise promote apoptosis [16]. The G3BP1 (S. cerevisiae Bre5) and USP10 (S. cerevisiae Ubp3) proteins are both SG components. Under normal conditions, G3BP1 binds to and inhibits USP10, but in stress, when both proteins become incorporated into SGs, their interaction changes and this unleashes the activity of USP10 [17]. The homologous proteins in fission yeast, Nxt3 and Ubp3, are also SG components [18], providing an example of evolutionary conservation of function. A possible connection between SGs and neurological disorders has attracted interest, as several neuronal proteins with roles in RNA binding and/or protein aggregation have been localized to SGs [19]. For instance, FRMP, a translational regulator implicated in fragile X syndrome, localizes to SGs under stress [20]. These findings have extended the view of SGs from being sites for mRNA storage, sorting, silencing, and reactivation, into centers for modulation of a variety of cellular stress responses.
There are several notable species-specific differences in how signaling pathways affect SG formation. Phosphorylation of the translation initiation factor eIF2α is both necessary and sufficient in mammalian cells [21], whereas eIF2α phosphorylation is not required for SG formation after heat shock in budding yeast [22], nor under any condition tested in fission yeast [23], [24]. Also, mounting evidence indicates that the signaling pathways needed for SG formation are stress-specific. In fission yeast, protein kinase A (PKA) is required for SG formation after glucose starvation, but not after hyperosmotic shock [24]. In S. cerevisiae, different stress conditions lead to formation of SGs of different composition, and with different assembly requirements. Thus, SGs can form after azide treatment independently of PB formation ability or of the mRNA-binding proteins Pbp1 (Ataxin-2 homolog) and Pub1 (TIA-1 homolog), but not after glucose deprivation [25]. Further evidence for a determined assembly order of SGs comes from the observation that in budding yeast cells upon mild heat shock, translation factors form foci at sites where SGs will later form when the temperature is raised further [26].
Previously, only few studies of the global requirements for formation and disassembly of SGs in mammalian cells and in yeast have been performed. An RNAi screen for genes necessary for normal SG formation in human cultured cells yielded an overrepresentation of functions related to O-linked glycosylation [14]. Recently, a global screen in S. cerevisiae for mutants defective in SG disassembly identified autophagy involving the yeast homolog of valosin-containing protein (VCP) as the pathway for clearance of SGs from the cell [27].
In this work, we have screened a genomic library of haploid deletion mutants, representing all non-essential genes of S. cerevisiae, for their ability to form SGs under nutrient stress induced by 2-deoxyglucose (2-DG). Mutants identified in the primary screen as deficient or hyperproficient in SG formation were also tested for SG formation under other stress agents. Most of these mutants display a general defect in SG formation, whereas the defect in others is specific for certain stress types. The protein products of the genes that we identify as required for SG formation are enriched for low-complexity regions (LCRs). SG defects are associated with enhanced mutability upon heat stress. We find functions related to the RanGTP/RanGDP system, driving nucleocytoplasmic transport, to be necessary for regulated formation of SG under stress. Importantly, we observe here that mutants unable to form SGs are also deficient in their ability to modulate changes gene expression associated with the stress response; stress-activated transcripts are hyperinduced, whereas those down-regulated by stress are repressed even further than in the wild-type. This strongly suggests that not only is SG formation regulated by stress-activated signaling pathways, but SGs actively moderate the stress response at the transcript level.
Results
Genome-wide high-content gene deletion mutant screen for deficient SG formation
To be able to perform a genome-wide screen, we defined the stress conditions under which to perform it, applying specific criteria. First, we wanted a robust induction of SGs. Second, for the purposes of a high-throughput genome-wide screen, with robotic handling in microtiter plate format, stress induction needed to be quick and synchronized between many samples. This consideration ruled out any scheme that included centrifugation and aspiration of medium during the induction procedure. Third, in order to minimize a potential influence from proteins and pathways regulating formation of cytoplasmic aggregates of damaged proteins, we wanted conditions where there was a clear physical separation between SGs and such other protein foci. To this end, we used RFP-labeled Pab1 (poly A-binding protein) as a marker for SGs, and GFP-labeled Hsp104 as a marker for aggregates of damaged proteins (Fig. 1 A). We evaluated treatments established to induce SG formation in S, cerevisiae or other organisms, including glucose deprivation, arsenite, hyperosmotic shock by elevated Na+ or K+ concentration, heat, oxidative stress through H2O2, ethanol, stationary phase, and combinations of these (Fig. S1). The most reproducible and stable appearance of SGs was found to occur after glucose deprivation, or after a combination of 8% ethanol and heat shock. However, only after glucose deprivation was a clear physical separation observed between Pab1-RFP and Hsp104-GFP foci (Fig. 1 A and Fig. S1). We selected glucose starvation as the stress agent, but needed to modify the procedure further to eliminate washing and centrifugation steps. Therefore, we substituted removal of glucose for addition of the glucose competitor, 2-DG, to a final concentration of 400 mM, into the medium. This treatment was found to induce SGs in about 35% of wt cells, and this number was relatively stable over a period of 60 min. (Fig. 1 E).
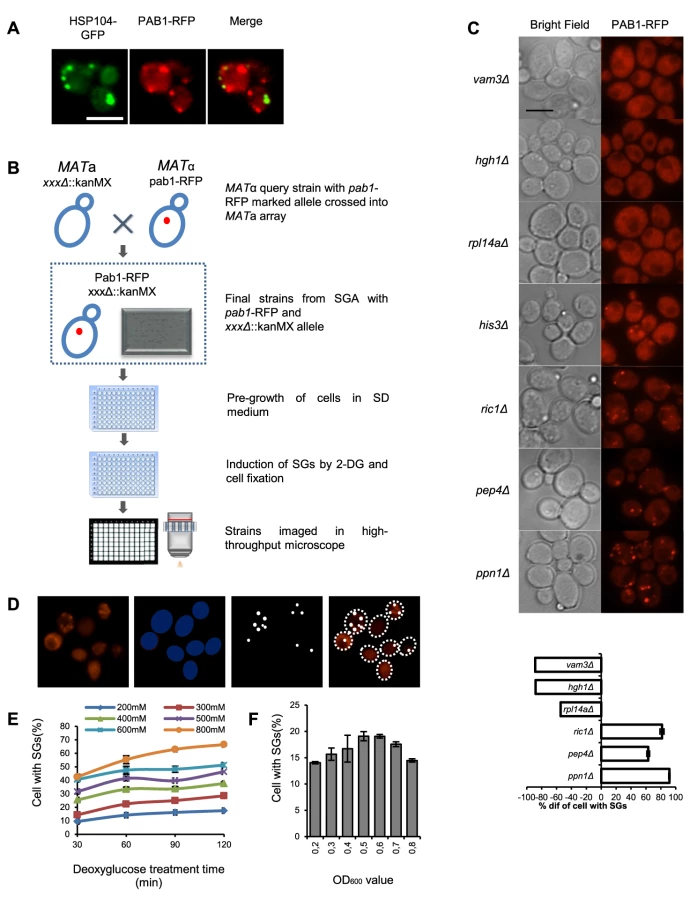
For the screening purposes, we constructed a genome-wide set of S. cerevisiae haploid genomic deletion mutant strains expressing Pab1 carboxy-terminally tagged with RFP from the PAB1 chromosomal locus in the BY4741 background as described in Materials and Methods (Fig. 1 B). All resultant strains were screened, as described in Materials and Methods, for the fraction of cells foci positive for Pab1-RFP after 2-DG exposure, using automated image analysis (Fig. 1 D,E). The result was quantitated as the deviation from the level in wt cells, which was set to ±0% (Fig. 1 C).
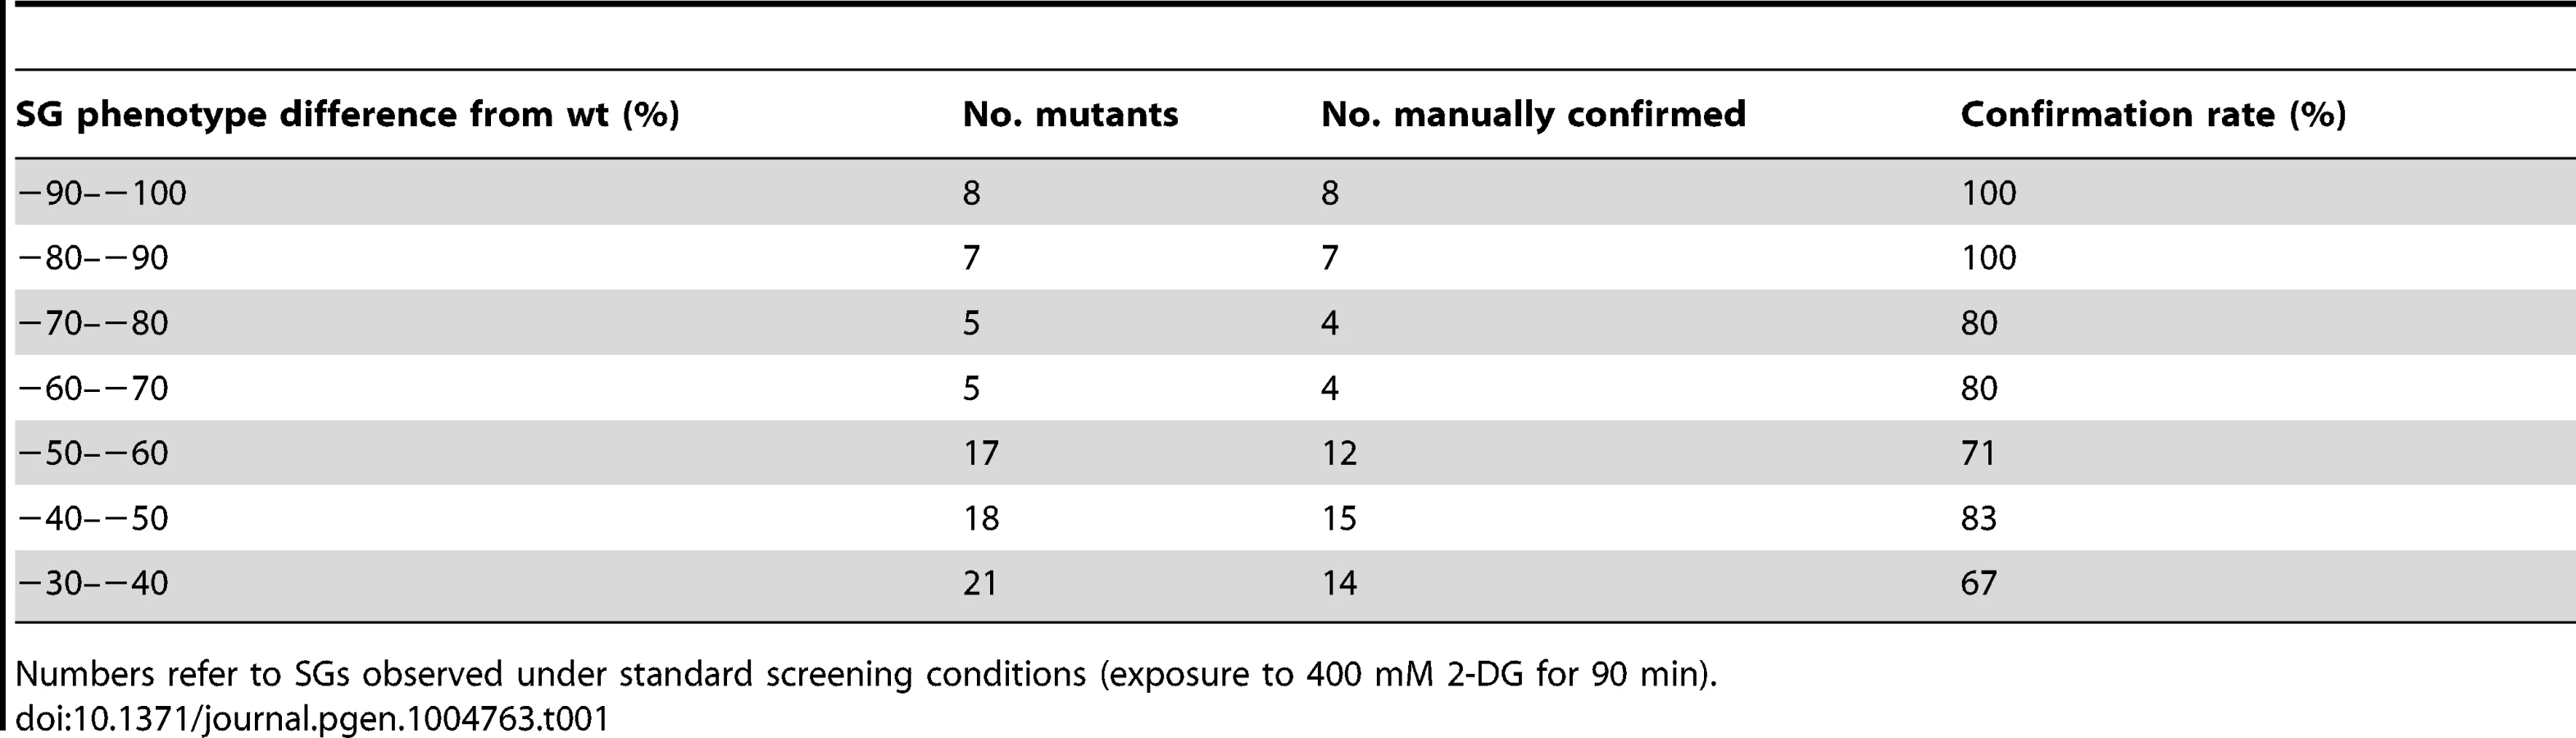
We selected 194 mutants (Table S1) which fulfilled the following two criteria: a) the absolute value of the SG phenotype in 2-DG, decreased or increased, exceeded 20%; b) the difference to the level in wt cells under the same conditions was statistically significant (P<0.05). Out of this set, a total of 73 null mutants (Table S2 A) with strongly decreased SG phenotypes were verified by manual microscopy. The confirmation rate (a statistically decreased SG phenotype was also observed by visual inspection) was high, with increasing rates up to 100% for the most extreme phenotypes (Table 1). This verifies that the image analysis algorithm efficiently and selectively identifies SGs. Our screening approach could potentially score mutants expressing lower levels of Pab1 as SG negative. To test how much this was a concern, we measured Pab1 levels in nine mutants identified as SG-defective by western blotting. All these mutants (except one, arc1Δ) have normal Pab1 levels, showing that deficient Pab1 expression was not the explanation why these mutants scored as SG-defective (Fig. S2). We further used another established SG marker, Pbp1, to verify that the phenotypes scored for Pab1-positive SGs also applied to other SG components. For the tested mutants, the relative changes in Pbp1-positive SGs upon glucose starvation largely paralleled those for Pab1-positive SGs (Fig. S3), with the exception of top3Δ.
It is known that defects in a particular stress signaling pathway can affect SG formation ability specifically for that stress condition [24] whereas other mutations cause a general SG deficiency. We investigated the SG phenotype of the 194 mutants using other stress conditions: heat shock (44°C for 45 min) or hyperosmosis (1.5 M KCl or 1.5 M NaCl for 90 min). As seen in Fig. 2 and Fig. S4, some of the mutants display a strong phenotype uniformly across all the investigated stress conditions (e.g. tif4632Δ, arc1Δ, set3Δ, top3Δ, mft1Δ, ypr172wΔ, and ski3Δ). For tif4632Δ (lacking the gene encoding eIF4G2, one of two isoforms of the translation initiation factor eIF4G in yeast), a defect has previously been observed in glucose starvation [11]. However, a substantial fraction were specific to either 2-DG or to various combinations of the stress conditions (e.g. gtr2Δ, ncs6Δ, and hgh1Δ) (Fig. 2, Fig. S4). Among the set of 73 mutants with verified phenotypes in 2-DG, 10 showed defects under all four stress conditions, and a further 10 under at least three of the four conditions. Mutants with a strong phenotype in 2-DG were more likely to display phenotypes also in other stress conditions (Table S1). Over half of the mutants, 40, were unique to 2-DG. The greatest degree of overlap with the 2-DG SG phenotype was found with NaCl stress (24 mutants); all the mutants that displayed a defect in KCl were also defective in NaCl (Fig. S4).

Mutants with defective SG formation represent dissimilar functional classes, with enrichment of functions in translation and RNA metabolism
A survey of this group of mutants with a verified decrease in SG number reveals a heterogeneous composition of biochemical and cellular functions, a reflection of the complexity of the functions required to assemble SGs, and to regulate their formation under different stress conditions. The network overview of functional clusters in this group (Fig. 3 A) displays large groups related to protein translation and endosomal vesicles, and the interrelated groups of the EGO/GSE complex and the Ran GTPase (Gsp1) with regulators.

GO Term analysis showed that there was a considerable enrichment for gene products involved in cytoplasmic protein translation (12/73, 16.4% vs. 2.4% in the background; P = 2.8×10⁻⁵). Among these, there is a moderate enrichment of mutants lacking cytoplasmic ribosomal proteins (cRPs). The distribution of relative SG scores of all cRP mutants (Fig. 3 C) contains both increased and negative values; the average value being slightly negative. A few cRP mutants are outliers with strong SG defects, notably rpl20bΔ, rps10aΔ, and rps28bΔ. Mapping the physical position of the corresponding proteins in the ribosome, we observe that these three are scattered in the 40S and 60S subunits (Fig. S5). The location thus does not immediately explain why they are so strongly required for SG formation. Further, the tif4632Δ mutant is almost completely devoid of SGs, in line with previous observations [11]. Another strongly SG-defective mutant implicated in translation is arc1Δ (human AIMP1), lacking a tRNA synthetase-binding protein.
Mutants representing members of the overlapping EGO/GSE complexes were also notable in this group (gtr1Δ, gtr2Δ, slm4Δ, ltv1Δ; 4/73, 5.5% vs. 0.1% in the background; P = 5.4×10⁻⁶). The members of the EGO complex were found in a genetic screen for failure to resume growth after rapamycin treatment [28]. Finally, we noted that gene products involved in endosomal transport were enriched in this mutant set (8/73, 11.0% vs. 1.2% in the background; P = 6.6×10⁻⁴).
Gene products absent in mutants with increased SG formation are enriched for microautophagy and are located in intracellular vesicles
In the screen, we also observed a large number of mutants with an increased fraction of SG-positive cells (≥20% higher than wt), indicating either a deregulation in SG formation or a defect in SG breakdown. To verify that the increased number of Pab1-positive aggregates seen in these mutants really represent bona fide SGs, we pretreated six of them with cycloheximide (Chx) before, as well as during, exposure to 2-DG, a scheme previously shown to prevent SG induction by stress [29]. As expected if they are actually SGs, the Chx pretreatment did completely block formation of aggregates in these mutants (Fig. S6). GO term analysis of the 56 mutants in this group that were confirmed by manual analysis (Table S2 B) revealed that several of them are linked to autophagy/microautophagy (Atg15, Vam6, Vam7, Vtc4, Meh1, Ypt7, Pep4; 7/56, 12.5% vs. 0.6% in the background; P = 1.4×10⁻⁵). Many of the mutations are in genes encoding proteins located in internal membranes; the vacuolar membrane (8/56, 14.3% vs. 2.4% in the background; P = 4.9×10⁻³) or the ER (5/56, 8.9% vs. 0.8% in the background; P = 5.2×10⁻³). The ontology of this mutant group is thus largely compatible with defects in breakdown of SGs using vesicular transport and autophagy/microautophagy. We did not consider this mutant group further in this report.
PB formation is intact in most SG-defective mutants
The functional interplay between SGs and PBs is not fully characterized; one model is that formation of SGs is secondary to formation of PBs [11]. If so, we should not necessarily expect all SG-defective mutants to have defective PB formation as well.
To examine whether this holds true for the mutants with impaired SG formation found in our genome-wide screen, we transformed selected mutant strains with a plasmid [30] expressing the PB marker Dcp2-GFP. After glucose deprivation, the localization of Dcp2-GFP was in one to five spots per cell, in some cases in the immediate vicinity of Pab1-RFP, as expected (Fig. 3 D). For gtr1Δ, gtr2Δ, and top3Δ mutants, PB formation was essentially normal, except for a slight depression in gtr1Δ mutants (Fig. 3 E). Thus, our observations do not contradict the view that SG formation is contingent on PB formation, but not vice versa.
Low-complexity regions are enriched in the proteins required for SG formation
The question whether there are common sequence motifs and other structural features of proteins contained in SGs or essential for formation of SGs has attracted interest since the realization that TIA-1 and TIA-R, both containing prion-like aggregation-driving domains, are critical for assembly of mammalian SGs [21]. Low-complexity regions (LCRs) in RNA-binding proteins (RBPs) make them prone to aggregation in vitro [31].
We wanted to test these suppositions in our large set of SG defective null mutants obtained from an unbiased genome-wide screen. Analysis of the number of LCRs [32] in the proteins deleted in the 60 mutants with the strongest SG-defective phenotype shows that 100% of those contain at least one LCR, vs. 70% of all yeast proteins. This protein group contains on average 4.1 LCRs per molecule, vs. 2.1 for all yeast proteins, and LCRs are thus strongly enriched among these proteins (Table 2). It has also been proposed that intrinsically disordered domains (IDRs) are essential to drive the aggregation process in SG formation [33]. We examined the S. cerevisiae genes predicted by Malinovska et al. [33] to encode proteins disordered in their entire length, but did not find them to be enriched among our SG-defective mutants (Table 2). However, a moderate overrepresentation of proteins containing IDRs longer than 30 amino acid residues [34] was observed (Table 2). Only one of the SG-defective proteins (Bem2) was found to carry a prion-like domain [35]. Thus, our data gives support for a possible role of LCRs in SG formation, but not for the other putative aggregation-driving protein domains.

Low SG formation ability confers high mutability, but only in specific mutants
Heat stress increases mutation frequency in budding yeast, which has been suggested to result from increased ROS production in mitochondria [36]. This mutation peak can be suppressed by overexpression of Pbp1 or Dhh1, both of which cause increased SG formation [15]. The authors concluded that SGs formed under stress serve as a dampening factor of some aspects of the heat-induced stress response, which attenuate the mutagenic effects of the heat shock. We were interested to see if the converse was true, that the absence of SGs under stress per se would enhance the mutation rate. We also wanted to investigate the generality of this phenomenon, and so recorded the frequency of inactivating mutations in the CAN1 gene, after heat shock (60 min at 44°C, as applied by Takahara, 2012 [15]) for 12 mutants with strongly negative SG phenotypes upon heat shock (Fig. 2, Fig. S4) but otherwise without any obvious functional bias. As seen in Fig. 4 A, indeed a marked increase in canavanine resistant (canR) clones (3–15 fold) was observed for four of the mutants; top3Δ, set3Δ, ski3Δ and gtr1Δ. However, for the remaining 8 mutants, no significant increased mutation frequency was found; thus, an increased heat-induced mutation rate does not occur in all SG-defective mutants. We wanted to see if other stress types normally causing SG formation would similarly lead to an elevated mutation frequency in SG defective mutants. Thus, we examined top3Δ and vta1Δ mutants for the frequency of canR clones after hyperosmotic shock (1.5 M NaCl). Both mutants are unable to form SGs under these conditions (Fig. 2). However, no increased mutation frequency was observed neither in the wt nor in either mutant (Fig. 4 B), indicating that the stress-induced mutability may be specific to heat shock.

Mutants affected in regulation of nucleocytoplasmic RNA transport through the Ran GTPase are defective in SG formation
Gtr1 and Gtr2 have been implicated both in activation of TORC1 as members of the GSE complex [37], and as regulators of the budding yeast Ran homolog, Gsp1, required for a large fraction of all nucleocytoplasmic transport of protein and RNA in the cell. We wanted to examine if the SG defects of gtr1Δ and gtr2Δ mutants were due to interactions with the TOR pathway, with Ran functions, or both. As many of the Ran function genes are essential (GSP1, RNA1, SRM1), we resorted to temperature-sensitive (ts) alleles of those [38]. Cells carrying the gsp1-P162I allele are highly defective in SG formation in glucose starvation at the restrictive temperature (36°C) (Fig. 5 B). RNA1 encodes the GTPase-activating protein for Gsp1 (RanGAP). The rna1-1 allele likewise confers decreased SG numbers; the rna1-S116P only moderately so (Fig. 5 B). Srm1 (Prp20) encodes the guanine nucleotide exchange factor (GEF) of Gsp1 (RCC1 in human cells). In glucose starvation, the srm1-G282S allele instead causes a marked increase of the SG-positive fraction, to 90% of all cells, whereas the srm1-ts allele gives lower SG numbers (Fig. 5 D). These results show that those mutants with a functional connection both with Gtr1 and Gtr2 and with the Ran nucleocytoplasmic transport system, are also affected in their SG forming ability. The other EGO/GSE mutants, slm4Δ and ltv1Δ, also did display reduced SG numbers, though with weaker phenotypes (Fig. 5 H,I).

Strains with gtr1 and gtr2 mutations recover growth slowly and lose viability faster after glucose starvation
It was previously shown that gtr2 mutants recover slowly from rapamycin-induced arrest, mimicking a state of amino acid starvation [28]. More recently, the mammalian Gtr1 homolog RagA was also implicated in glucose homeostasis [39]. Since SGs are presumed to play a regulatory role in the transitions between stress and favorable conditions, and given the defects in glucose starvation-induced SG formation that we observed in the gtr1 and gtr2 mutants, we wanted to see if this defect would affect growth and survival after glucose starvation in these single mutants and also in the double mutant, gtr1Δ gtr2Δ. First, we examined the gtr1Δ gtr2Δ mutant SG phenotype in glucose starvation (Fig. 2 A, B) which was found to be more exacerbated than in the single mutants. To analyze the growth behavior, cells in log phase (wt, gtr1Δ, gtr2Δ, or gtr1Δ gtr2Δ) were glucose-starved for 48 h by addition of 2-DG, and the rate of recovery of growth in medium without 2-DG was recorded. We found that both the gtr2Δ and the gtr1Δ gtr2Δ mutants recover appreciably slower than the wt (Fig. 6 E). We also investigated loss of viability of the same strains in medium containing 2-DG. As seen in Fig. 6 F, loss of viability occurs fastest in the gtr2Δ and the gtr1Δ gtr2Δ mutants. We conclude that Gtr1 and Gtr2 affect growth recovery and maintenance of viability in glucose starvation, with Gtr2 having the bigger effect.

SG formation defects exaggerate stress-induce gene expression changes
It has also been shown that SGs physically incorporate, and potentially dampen the activation of, signaling proteins [15], [16], [40]. Now having access to mutants deficient in SG formation from an unbiased genome-wide screen, we wanted to test the possibility that the SG-forming ability under stress is mechanistically linked to the ability to raise and regulate various aspects of the cellular stress response. To do this, we investigated the expression pattern of stress-responsive genes in mutant backgrounds which we had shown to be unable to form SGs under different stresses (heat shock, hyperosmotic shock, and glucose deprivation) (Fig. 2, Fig. S4).
Hsp12 changes its conformation and associates with the plasma membrane to stabilize it under stress. Hsp12 is strongly upregulated under several stresses, including heat shock, hyperosmotic shock and glucose deprivation, and is regulated through the RAS-PKA pathway [41]. We measured induction of HSP12 expression in mft1Δ, arc1Δ, rpl20Δ, rps28Δ, and top3Δ mutants after two different stress conditions: 2-DG (400 mM) and heat stress (44°C). In four out of these five mutants (mft1Δ, arc1Δ, rpl20Δ, and rps28Δ), we observed a dramatic hyperinduction of HSP12. At 60 min. after addition of 2-DG, the level of HSP12 mRNA was between 10 and 40 times higher than in the wt (Fig. 7 A). Similar results were obtained by heat shock: after 45 min at 44°C, the HSP12 mRNA was upregulated in the same four SG-defective mutants to levels 10 to 16 times higher than in the wt (Fig. 7 B). The HSP104 transcript in the same mutant set followed a related pattern in glucose starvation and heat shock as HSP12 (Fig. 7 A,B).

PWP1, UTP13, and DIP2 all encode proteins involved in rRNA processing, and form part of the RiBi regulon [42]. They are under positive control by the TOR pathway via protein kinase Sch9 [43]; under stress conditions their expression decreases concomitant with diminished TOR signaling. When challenged by heat stress, the expression response in these mutants (same set as in Fig. 7 A) is similar for all three reporter genes (Fig. 7 C). Thus, for PWP1, UTP13, and DIP2 alike, the mRNA levels decreased to 65–80% of their pre-stress levels at 45 min. at 44°C in the wt. In contrast, the expression of PWP1 and UTP13 in mft1Δ, arc1Δ, rps28Δ, and top3Δ mutants in heat stress decreased to between 10 and 60% of the level in undisturbed wt cells. The expression of DIP2 was more reduced than in wt in all the mutants, including rpl20Δ. In summary, gene expression response to heat stress resulting from reduced TOR signaling in these SG-defective mutants (mft1Δ, arc1Δ, rps28Δ, top3Δ) is hyperactivated, with the change in expression level between different mutants highly correlated between the three reporter genes.
Having observed deregulation of the stress response in heat shock and glucose starvation, we wanted to also address hyperosmotic shock. STL1 encodes a plasma membrane-bound glycerol transporter, is strongly induced after hyperosmotic shock, and is controlled by the HOG pathway [44]. After severe hyperosmotic shock (1.5 M NaCl), where SGs are clearly visible, the expression level of STL1 in wt cells was quite low for an extended time after application of stress (Fig. S7 D). This made it difficult to assess to what extent an induction had taken place, and so we therefore chose to investigate STL1 mRNA levels after moderate hyperosmotic shock (0.4 M NaCl). Under these conditions, mft1Δ and arc1Δ mutants demonstrated somewhat elevated levels after stress (Fig. S7 A). We then wanted to see if maybe differences similar to what we observed after heat or glucose starvation stress could be seen at the protein level after hyperosmotic shock.
As the role of SGs in the stress response is generally perceived to be in cytoplasmic silencing and storage of mRNA, it appeared reasonable to also consider the impact on the post-transcriptional level. We tested the induction of β–galactosidase protein from a STL1-LacZ promoter fusion construct after moderate (0.4 M NaCl) hyperosmotic shock in the same SG-defective mutant backgrounds as above. As seen in Fig. S7 C, the induction of STL1-lacZ upon hyperosmosis is further (1.5–4 fold) elevated in all mutants compared to the wt in the time interval 30–180 min after hyperosmotic shock. The exception is mft1Δ, where instead STL1-lacZ fails to induce upon hyperosmosis (Fig. S7 B). The levels of STL1-driven lacZ transcript, however, were not appreciably altered in the mutants (except again in mft1Δ). We infer that in the case of STL1-lacZ, the deranged regulation is likely to be on the translational level.
As negative controls, we examined in the same fashion mutants with no observed SG phenotype, ybl059wΔ and ybl060wΔ, as well as mutants with increased numbers of SG, ccw12Δ and ynl198cΔ. No abnormal STL1-lacZ induction was seen in ybl059wΔ and ybl060wΔ, whereas slightly elevated induction was observed in ccw12Δ and ynl198cΔ (Fig. S7 C).
We had thus demonstrated that most mutants which show a strongly reduced ability to form SGs upon stress, either induce stress response genes excessively, or in exceptional cases (STL1-lacZ induction in mft1Δ) are unable to mount a stress-activated gene expression response at all. It also appears that this deregulation occurs both at the transcriptional and post-transcriptional levels. We then wanted to determine if these defects were caused by altered activity in the stress-activated signaling pathway upstream of the gene expression response. We examined activation of the HOG pathway, measured as Hog1 phosphorylation, under moderate (0.4 NaCl) or severe (1.5 M NaCl) hyperosmotic shock, in wt and SG-defective mutant cells. We also measured regulation of the TOR pathway through phosphorylation of eIF2α (Sui2) after heat shock in SG-defective mutants. Reduced Tor1 activity leads to increased phosphorylation of Gcn2, the protein kinase targeting eIF2α [45]. No differences in phosphorylation level after stress of either Hog1 or eIF2α between wt and mutants were observed, however (Fig. S8). We conclude that the cause of the deregulated stress-induced gene expression in SG-defective mutants is not alterations in signal transduction per se, but must instead lie at the levels of transcription or stability of target mRNAs.
Discussion
The study of SGs has proceeded mainly through characterization of single proteins that are SG components, or required for SG formation. Our genome-wide screen for mutants defective in SG formation provides an in essence unbiased global view, and has identified proteins of unexpected cellular functionalities. We acknowledge, however, that the screen has technical limitations, and that some mutants could have been scored as SG defective e.g. because of low Pab1 expression levels. Conceptually, we can divide the proteins involved in SG formation into at least three classes: (a) structural SG components with properties that facilitate assembly of the entire SG (“drivers” of SG formation). Examples are the mammalian TIA-1 and TIA-R proteins, which carry prion-like domains that promote aggregation [21]. Defective expression of those confers decreased SG formation. (b) “Passenger” proteins that are found in SGs but whose absence does not confer overall SG defects. The fission yeast multi-KH domain protein Vgl1 is found in SGs, but deletion of the corresponding gene does not abolish SG formation [23], providing an example of this second class. (c) Members of signaling pathways required for SG formation under specific stress conditions. Subunits of both PKA [40] and TOR kinase [15] have been localized to S. cerevisiae SGs. By definition, then, only members of groups (a) and (c) could score in our screen as deficient in SG formation. Using cross-linking to mRNA and mass spectroscopy, Mitchell et al. [46] recently identified 120 RNA-binding proteins in yeast, of which 36 were localized to SGs and/or PBs. Out of these 36, three (Psp2, Bre5, and Tif4632) also turned up in our mutant screen as SG defective (Table S1). They are thus candidate members of group (a) as their absence from SGs prevents SGs from forming at all.
It is further interesting to compare our mutant set with the human genes previously identified in an RNAi screen for reduced SG formation [14] (Tables S1 and S2). Direct gene-to-gene ortholog searches revealed knockdown of G3BP1 (ortholog BRE5) or PDCD6IP (programmed cell death 6 interacting protein; ortholog RIM20) and mutation in the respective yeast orthologs to cause reduced SG formation in both organisms. In addition, the human genes RPL37A (yeast homolog RPL43A), RPL21 (yeast RPS21A), and SMDP3 (yeast PPN1) were identified by Ohn et al. (2008) [14]; here however we show mutation of the corresponding yeast orthologs to cause increased SG numbers in 2-DG. In some cases, functionally closely related genes were found to affect SGs in the two organisms: human CTSC (cathepsin C) vs. yeast PEP4 (cathepsin D), human PPP2R1A (protein phosphatase 2 regulatory subunit A) vs. yeast RTS1 (phosphatase 2A regulatory subunit type B′). There are also parallels in functional groups; e.g. several different cRPs are found to affect SG formation in both organisms.
In addition, we scored SG hyperproficient mutants. Such mutants could experience a higher general stress level because of an underlying general cellular defect, or could be defective in SG breakdown and turnover. In neurodegenerative disorders, RNA-protein aggregates, assumed to be related to SGs, accumulate in neurons and contribute to pathogenesis [47], [48]. This suggests that also the SG removal process may have implications for health. Recently, it was shown that disassembly of SGs in S. cerevisiae occurs through autophagy in a Cdc48-dependent way [27]. In their study, Buchan et al. [27] found an enrichment of mutants deficient in autophagy, vacuolar fusion and related processes among those with increased numbers of spontaneous SGs resulting from defective turnover. We find only two individual mutants in our screen with increased SG numbers after glucose stress to overlap with Buchan et al., namely ice2Δ and meh1Δ (member of the EGO/GSE complex). However, in our screen we find several representatives of pathways connected to granule disassembly, such as endosomal transport, microautophagy and protein degradation, broadly along the same line as the findings of Buchan et al. [27].
Are there protein domains driving aggregation and SG formation?
Proteins with an ability to drive SG formation based on their content of aggregation-prone domains could be suspected to act as assembly factors. An examination of the requirements for formation of RNA granules in cell-free systems has identified proteins with low-complexity regions as capable of holding such large structures together [31]. Our finding that LCRs are highly enriched in the proteins affected in SG-defective mutants lends support to this notion that multiple weak interactions between LCRs are a driving force behind aggregation of SGs [31], [49]. On the other hand, only a minority of these SG-defective mutants encode proteins that have been shown to actually reside in SGs. Thus, many could be indirectly acting (class “c”), making the interpretation of this finding less clear.
Mammalian TIA-1 and TIA-R, carrying prion-like domains, have been shown to have a key role in SG formation [21]. Recently, the presence of intrinsically disordered regions (IDRs) in proteins from genetic model organisms has been mapped and proposed as a determining factor for assembly of SGs [33]. We did find a moderate enrichment of IDRs, but not of prion-like domains among the SG-deficient mutants identified here (Table 2). For instance, the translation initiation factor eIF4G has been found to be an SG component in all species studied. We discovered the tif4632Δ mutant, lacking the eIF4G2 isoform, to have a strong SG defect. The Tif4632 protein contains IDRs, and it is conceivable that they serve as drivers for nucleation of SGs [8], given this strong requirement of eIF4G2 for SG formation.
Stress conditions and SG formation
We have found gene products common to all stresses applied, as well as others that are specific to one or few stress agents. Earlier work investigating individual SG components has yielded results in line with this: thus, eIF3 components are found in budding and fission yeast SGs after hyperosmotic shock or heat stress, but not after glucose deprivation [11], [22], [24]. On the other hand, in a directed study in budding yeast of preselected mutant alleles, alterations in the TOR or PKA pathways were reported not to affect formation of SGs under several different stress conditions [12], demonstrating that not every pathway component is necessarily required for SG induction.
SGs formed in budding yeast after NaN3 treatment contain translation initiation factor components not found after glucose starvation, including components of eIF3 (Rpg1 and Prt1), eIF4 (eIF1A, eIF4B, eIF5B), and eIF5B [25]. The sets of proteins required for SG formation (assembly factors) under diverse stresses are likewise non-identical. After glucose deprivation, pbp1Δ and pub1Δ mutants are defective in SG formation, but not after NaN3 treatment [25]. In line with this, the majority of the mutants identified in this screen are SG defective in response to some, but not all, stress conditions. However, SG defects common to all stress conditions tested was most frequent among the mutants with the most severe SG defect in 2-DG, suggesting that such mutants lack components fundamental to all SG assembly.
Elevated stress-induced mutation frequency only in some SG-defective mutants
In four of the tested SG-defective mutants (top3Δ, set3Δ, ski3Δ, and gtr1Δ), the induced mutability upon heat stress was substantially increased compared to the wt (Fig. 4). In some cases the change was even higher than what was earlier observed when the SG amount was artificially manipulated by other means (Chx, overexpression of PBP1 or DHH1) [15]. However, we observed no altered induced mutation frequency for the remaining SG-defective mutants. Desequestration of TOR pathway signaling components by the lack of SGs under heat stress does lead to more rapid reactivation of TOR signaling in the recovery phase [15]. Mutants lacking SGs are predicted by the model proposed by Takahara and Maeda [15] to have more TOR signaling components active, and to display an increased mutation rate upon heat stress. However, in view of our present study which extends to more SG-defective mutants, most of which are affected in functions unrelated to the TOR pathway, this does not necessarily confer an elevated heat-induced mutation rate. While our results therefore give some support to the notion that SGs moderate heat-induced hypermutability, it is clear that the mechanism, remains ambiguous, and additional yet unidentified factors are required for this to occur.
Nucleocytoplasmic transport functions are linked to SG formation
The gtr1 and gtr2 mutants both appeared in our screen. The corresponding proteins are closely related unconventional G proteins with metazoan homologs; RagA and RagB (Gtr1-like), RagC and RagD (Gtr2-like) [50]. Gtr1 and Gtr2 are established in at least two plausible roles to affect SG formation. On one hand, they regulate the S. cerevisiae Ran homolog Gsp1, and its paralog Gsp2, which are required for the bulk of RNA processing and nucleocytoplasmic transport. GTR1 was originally identified as a suppressor of a mutant allele of SRM1 [51]. On the other hand, Gtr1 and Gtr2 are part of the EGO/GSE complex, which is required for microautophagy [28], [37], [52]. EGO/GSE members are Gtr1, Gtr2, Meh1, Slm4, and Ltv1 [28], [37], [52]. EGO/GSE is implicated as a TOR signaling activator. Thus, the mammalian Gtr1/Gtr2 homologs RagA – D bind Raptor (S. cerevisiae homolog Kog1) and so mediate signaling from growth-promoting amino acid levels to mTOR [53]. In yeast, Gtr1 in its GTP-loaded state binds Tco89 and this interaction is required for activation of TORC1 [37].
The explanation for the observed SG defect in gtr1 and gtr2 mutants could thus lie in their involvement in nucleocytoplasmic RNA transport, activation of the TOR pathway and microautophagy, or both. Mutations along the RanGDP/GTP axis (gsp1-P162I, rna1-1, rna1-S116P, srm1-ts, srm1-G282S) invariably affected SG formation (Fig. 5). As haploid null alleles are not available for these genes, it is difficult to judge from the phenotype strength of the different point mutants with various expressivities the exact degree of involvement in SG formation of the corresponding gene product. However, it does appear to be significant, as at least one allele of each of these genes gives a strong SG phenotype, gsp1 itself strongest among them. On the other hand, mutations in remaining EGO/GSE components (slm4Δ, ltv1Δ) also affected SG levels, albeit moderately. Recently, the mammalian Gtr1/Gtr2 homologs, RagA – D, were shown to play a role in glucose sensing through the mTOR pathway, as newborn mice expressing the constitutively active form RagAGTP become hypoglycemic [39]. It therefore appears plausible that the effects we observed under glucose starvation in gtr1 and gtr2 mutations on SG formation, as well as recovery rate and survival (Fig. 6) are mediated through defective TOR signaling.
There is some support for a nuclear role of EGO/GSE. Thus, Gtr1, Gtr2, Prp20 and Gsp1 co-fractionate with chromatin. The gtr1 and gtr2 mutants display derepression at telomeres. Gtr2 physically interacts with Rvb1 and Rvb2, members of the Ino80 chromatin remodeling complex, and gtr1 is synthetically lethal with ino80 [54]. Further, Ltv1 has been implicated in nucleocytoplasmic export of the ribosomal 40S subunit [55]. Gtr1 also physically associates with Rpc19, a subunit of RNApolI and RNApolIII, and with Nop8, an rRNA processing enzyme [56]. Gtr1 could thus link ribosome biogenesis with signals for cell growth. In keeping with this interpretation, rRNA synthesis, as well as RNApolIII activity, are reduced in gtr1Δ mutants [56]. Gtr1 and Gtr2 could be the focal point of both the TOR signaling and nuclear functions. In line with this, the gtr1 gtr2 double mutant displayed quite a strong SG defect (Fig. 6 A).
Intriguingly, a majority, 30 out of the 54 genes deleted in the verified SG-defective mutants encode nuclear proteins, whereas only 8 are reported as predominantly cytoplasmic. This points at a role for nucleocytoplasmic communication in regulation of SGs. Previous observations also hint at an essential role for nucleocytoplasmic transport in regulated SG formation. Importins α1, α4, α5, and β1 are located in mammalian SGs [57]. The ubiquitin-like protein Mdy2 (homologous to human Rad23) localizes to heat-induced budding yeast SGs, and is required for the heat-induced stress response. Interestingly, removing the nuclear localization signal from Mdy2 prevents its association with Pab1 in SGs [58], indicating that nucleocytoplasmic transport of Mdy2 is essential for its role in the heat-induced SGs and stress response.
SG formation and stress-induced gene expression are linked processes
Recent data indicate that the fate of a transcript is determined by RBPs associating with the nascent mRNA molecule, a process dubbed co-transcriptional mRNA imprinting. Cytoplasmic mRNA degradation factors shuttle into the nucleus to bind to chromatin, thereby enhancing the synthesis rate of novel transcripts [59]. In this view, nucleocytoplasmic transport of RNA and proteins is central to control of gene expression. As stated above, we have implicated the Ran-based system for nucleocytoplasmic transport in SG formation (SG phenotypes found in gtr1, gtr2, gsp1, rna1, and srm1 mutants). It likely that formation of SGs, which sequester many RBPs including mRNA degradation factors, will dampen their cycling back into the nucleus. Thus, in the absence of SGs, more degradation factors and other RBPs will be free to move into the nucleus. If this cycling of RBPs into the nucleus is required to mount a transcriptional response upon stress, then this may be the explanation why we observe a hyperinduction of stress-activated mRNAs in SG-defective mutants (Fig. 7 A, B). Conversely, in the case of stress-repressed mRNAs that are hyperrepressed in SG-defective mutants (Fig. 7 C), RBPs with a role in repression may accompany the transcript.
This model then predicts that every SG-defective mutant should display deregulation of stress-regulated genes. The number of mutants investigated here is insufficient to establish this as a general principle but the model appears viable for a large fraction of SG-defective mutants. The top3Δ mutant did not conform fully to this pattern however; while it did display hyperrepression (Fig. 7 C), as well as hyperinduction of STL1-lacZ in severe hyperosmosis (Fig. S7 D), it induced the HSP12 and HSP104 genes similar to wt (Fig. 7 A,B). It remains a possibility that certain SG-defective mutants, where the fundamental role of the cognate protein is in other cellular functions than RNA-related processes (topoisomerase III is primarily implicated in DNA recombination), are not affected in stress-related transcription.
We therefore propose a view where, not only do stress-responsive signaling pathways affect SG formation, but SGs themselves can also influence the outcome of the stress response. In support of this, it was recently shown that in mammalian cells, formation of large SGs by overexpression of G3BP takes place before eIF2α phosphorylation through protein kinase R. In this setting, formation of SGs can be the cause, but not the effect, of eIF2α phosphorylation [60]. Sequestration of signaling components in SGs has previously been proposed to affect cytoplasmic signaling events from the TOR pathway in budding yeast [15], or MTK1-SAPK in mammalian cells [16]. Our data indicate that such effects also can influence the levels of stress-related transcripts. This could occur through increased transcription rates or increased mRNA half-lives; both mechanisms are compatible with our data. Given the requirement for nucleocytoplasmic traffic for SG formation evident from previous and our present data as discussed in the above section, it is natural to speculate that nuclear events are also involved, through the action of RBPs shuttling into the nucleus.
Our global genetic screen has unraveled several unforeseen components required for regulated SG accumulation. We found arc1Δ mutants to be almost completely unable to form SGs under any stress condition tested (Fig. 2). ARC1 encodes a tRNA and aminoacyl-tRNA synthetase binding protein [61], and is the only gene with a specific role in tRNA metabolism to appear in our screen with a strong SG-defective phenotype. This finding is intriguing, as the mammalian stress-activated ribonuclease angiogenin cuts tRNAs, generating small RNA fragments that inhibit initiation of translation, and are essential for angiogenin-dependent SG accumulation [62]. Arc1 has no sequence similarity to angiogenin and has no recognizable RNase domains. However, it is conceivable that it performs another function in an analogous process in yeast. Elucidation of the role of Arc1 and the other ostensibly diverse proteins identified here by genetics as required for stress-induced SG formation, will lead to a broader appreciation of the function in stress response modulation of these large cellular aggregates, which have so long defied exhaustive biochemical characterization.
Materials and Methods
S. cerevisiae strains and growth conditions
Strains were from the BY4741 background and were grown at 30°C or at the indicated temperatures. Cells were grown in synthetic defined (SD): 0.14% yeast nitrogen base (YNB; Difco) without amino acids; 0.5% ammonium sulphate; 1% succinic acid; 2% D-glucose; 20 mg/l each of histidine, methionine, lysine, and uracil; 100 mg/l of leucine (pH 5.8), or in synthetic complete (SC); SD plus 0.079% synthetic complete drop out mix (Difco).
Construction of a genome-wide collection of S. cerevisiae haploid deletion mutants expressing Pab1-RFP
To efficiently incorporate the SG marker (Pab1-RFP) into the yeast single deletion collection (SGA-V2), we applied the yeast synthetic genetic array (SGA) methodology, which allows the Pab1-RFP marker to be combined into a single haploid cell through standard mating and meiotic recombination via a robotic SGA procedure [63], [64] using the Singer RoToR HDA system (Singer Instruments).
Increased gene dosage
Wt cells were transformed with the centromeric vector p5586 [65] carrying the gene of interest including its native promoter and terminator sequences, and compared with wt cells carrying empty p5586.
Genome-wide high content screening with quantitation of SG numbers
Gene deletion strains expressing Pab1-RFP were transferred to 96-well microtiter plates and frozen at −80°C. Prior to screening for SG formation, one 10 µl sample per strain was allowed to grow in 200 µl of SD at 30°C for 2–3 days without shaking. Then, each preculture was diluted 75-fold into a final volume of 215 µl of SD medium and grown with shaking at 30°C. After 16 h, when the OD600 of most wells had reached 0.5, 2-deoxyglucose (2-DG) was added to a final concentration of 400 mM. After 2 h of incubation with continued shaking, cells were fixed for 30 min. at room temperature by adding formaldehyde to a final concentration of 3.7%. Cells were then washed twice with PBS and stored at room temperature in 200 µl PBS. For quantification of SGs, fixed cells were imaged in ImageXpress MICRO (MDC), automated cellular imaging and analysis system. After image acquisition, images were quantified by MetaXpress (Version 3.1) software. A MetaXpress sub-program was designed for the quantification of SG phenotypes, which has the ability to automatically query images from our database, extract key SG morphology features and export the measurements as a separate output. For manual quantification, cells were grown in logarithmic phase in 15 ml Falcon tubes to an OD600 nm of 0.5 before application of stress, formaldehyde-fixed and washed as described above before microscopy.
Functional enrichment and interaction network analysis
The functional enrichment analysis was based on the result from Gene Ontology Term Finder [66], and P-values were calculated using a hypergeometric distribution with multiple hypothesis correction. Manually confirmed hits were analyzed for enrichment of Gene Ontology (GO) biological processes, molecular function, and cellular component categories by comparing with a background set list representing SGA-V2 plus an array of slow-growing mutants (4691 genes). A cut-off of P<0.05 was used. The interaction network diagram of SG-defective mutants was extracted from the interaction analysis using Osprey 1.2.0 [67] and the physical interactions between confirmed hits were added according to the BioGRID interaction database [68].
Bioinformatic analyses
To identify domains implicated in protein aggregation several bioinformatics algorithms was used: GBA [32] for low-complexity regions (LCRs), IUPRED and ANCHOR [33], [34] for intrinsically disordered domains (IDRs) and PAPA [35] for prion-like domains.
Visualization of the position of cytoplasmic ribosomal proteins in the ribosome was done in UCSF Chimera [69]. Ribosome structures (40S subunit; PDB ID: 3U5G; 60S subunit PDB ID: 3U5I) [70] were downloaded from the RCSB Protein Data Bank (http://www.rcsb.org/pdb/home/home.do).
Determination of growth rate and lag phase after recovery from glucose deprivation
Determination of growth parameters was performed in a Bioscreen Analyzer V as described [71] after recovery from treatment with 400 mM 2-DG. Strains were run in 5 duplicates on separate plates, with five wild-type (wt) strains on each plate as controls.
Mutability assay
Induced mutation frequencies were estimated as the forward mutation frequency of the CAN1 gene [72]. Wt or mutant cells were grown in SC until late log phase (OD600 = 1.0) and exposed to stress as indicated. Cells were washed with sterile water and plated on SC lacking arginine (SC-Arg) with or without L-canavanine sulfate (60 µg/ml). Canavanine-resistant colonies were counted after 7 days at 30°C and normalized for total viable cells on SC without canavanine.
Quantification of stress-induced gene expression and signaling
Wt or mutant cells were treated as specified for different time periods, and subsequently flash-frozen on dry ice/ethanol and harvested. mRNA levels of the indicated stress-responsive genes were determined using real-time quantitative PCR (qPCR). Total RNA was obtained from cell pellets using phenol-chloroform extraction and ethanol precipitation. RNA was treated for 15 min at 25°C with DNase I RNase-free (Roche) according to the manufacturer's protocol. Then cDNA was synthesized in 20 µl reactions containing 25 ng/µl of DNase I treated RNA, 5 µM of Oligo d(T) (Thermo Scientific), 10 units/µl of SuperScript II Reverse Transcriptase (Invitrogen), 1× First Strand Buffer, 10 mM DTT, and 0.8 mM dNTPs. Afterwards, qPCR was performed in a reaction final volume of 10 µl using the Eva Green (Solis) for fluorescent labeling, 2.5 µl cDNA and 0.2 µM of the corresponding oligonucleotides. Real-time PCR reactions were performed under the following conditions: 95°C for 15 min to activate the polymerase, followed by 40 cycles of 10 s at 95°C, 20 s at 60°C and 10 s at 72°C. At the end of the amplification cycles, a melting curve analysis was conducted to verify the specificity of the reaction. For each analyzed primer pair, a negative control was included and a standard curve was made with serial dilutions of cDNA samples pool (1/2, 1/5, 1/10, 1/25, 1/50, 1/100 and 1/500).
Alternatively, the protein product level was determined using a lacZ assay, where β-galactosidase activity was determined and normalized for cell number as described [73].
Hog1 Tyr176 phosphorylation was assayed by western blot using α-phospho-p38 antibodies (Cell Signaling Technologies). eIF2α (Sui2) Ser51 phosphorylation was determined using α-phospho-eIF2α antibodies (Biosource).
Supporting Information
Zdroje
1. GrigullJ, MnaimnehS, PootoolalJ, RobinsonMD, HughesTR (2004) Genome-wide analysis of mRNA stability using transcription inhibitors and microarrays reveals posttranscriptional control of ribosome biogenesis factors. Mol Cell Biol 24 : 5534–5547.
2. MolinC, JauhiainenA, WarringerJ, NermanO, SunnerhagenP (2009) mRNA stability changes precede changes in steady-state mRNA amounts during hyperosmotic stress. RNA 15 : 600–614.
3. Romero-SantacreuL, MorenoJ, Pérez-OrtínJE, AlepuzP (2009) Specific and global regulation of mRNA stability during osmotic stress in Saccharomyces cerevisiae. RNA 15 : 1110–1120.
4. WarringerJ, HultM, RegotS, PosasF, SunnerhagenP (2010) The HOG pathway dictates the short-term translational response after hyperosmotic shock. Mol Biol Cell 21 : 3080–3092.
5. MelamedD, PnueliL, AravaY (2008) Yeast translational response to high salinity: Global analysis reveals regulation at multiple levels. RNA 14 : 1337–1351.
6. ShentonD, SmirnovaJB, SelleyJN, CarrollK, HubbardSJ, et al. (2006) Global translational responses to oxidative stress impact upon multiple levels of protein synthesis. J Biol Chem 281 : 29011–29021.
7. GarreE, Romero-SantacreuL, De ClercqN, BlascoN, SunnerhagenP, et al. (2012) The yeast mRNA cap-binding protein Cbc1/Sto1 is necessary for rapid reprogramming of translation after hyperosmotic shock. Mol Biol Cell 23 : 137–150.
8. KedershaN, IvanovP, AndersonP (2013) Stress granules and cell signaling: more than just a passing phase? Trends Biochem Sci 38 : 494–506.
9. BuchanJR, ParkerR (2009) Eukaryotic stress granules: the ins and outs of translation. Mol Cell 36 : 932–941.
10. AndersonP, KedershaN (2008) Stress granules: the Tao of RNA triage. Trends Biochem Sci 33 : 141–150.
11. BuchanJR, MuhlradD, ParkerR (2008) P bodies promote stress granule assembly in Saccharomyces cerevisiae. J Cell Biol 183 : 441–455.
12. ShahKH, ZhangB, RamachandranV, HermanPK (2013) Processing body and stress granule assembly occur by independent and differentially regulated pathways in Saccharomyces cerevisiae. Genetics 193 : 109–123.
13. HoyleNP, CastelliLM, CampbellSG, HolmesLE, AsheMP (2007) Stress-dependent relocalization of translationally primed mRNPs to cytoplasmic granules that are kinetically and spatially distinct from P-bodies. J Cell Biol 179 : 65–74.
14. OhnT, KedershaN, HickmanT, TisdaleS, AndersonP (2008) A functional RNAi screen links O-GlcNAc modification of ribosomal proteins to stress granule and processing body assembly. Nat Cell Biol 10 : 1224–1231.
15. TakaharaT, MaedaT (2012) Transient sequestration of TORC1 into stress granules during heat stress. Mol Cell 47 : 242–252.
16. ArimotoK, FukudaH, Imajoh-OhmiS, SaitoH, TakekawaM (2008) Formation of stress granules inhibits apoptosis by suppressing stress-responsive MAPK pathways. Nat Cell Biol 10 : 1324–1332.
17. TakahashiM, HiguchiM, MatsukiH, YoshitaM, OhsawaT, et al. (2012) Stress granules inhibit apoptosis by reducing reactive oxygen species production. Mol Cell Biol 33 : 815–829.
18. WangC-Y, WenW-L, NilssonD, SunnerhagenP, ChangT-H, et al. (2012) Analysis of stress granule assembly in Schizosaccharomyces pombe. RNA 18 : 694–703.
19. RamaswamiM, TaylorJP, ParkerR (2013) Altered ribostasis: RNA-protein granules in degenerative disorders. Cell 154 : 727–736.
20. DidiotMC, SubramanianM, FlatterE, MandelJL, MoineH (2009) Cells lacking the fragile X mental retardation protein (FMRP) have normal RISC activity but exhibit altered stress granule assembly. Mol Biol Cell 20 : 428–437.
21. KedershaNL, GuptaM, LiW, MillerI, AndersonP (1999) RNA-binding proteins TIA-1 and TIAR link the phosphorylation of eIF-2 alpha to the assembly of mammalian stress granules. J Cell Biol 147 : 1431–1442.
22. GrouslT, IvanovP, FrydlovaI, VasicovaP, JandaF, et al. (2009) Robust heat shock induces eIF2alpha-phosphorylation-independent assembly of stress granules containing eIF3 and 40S ribosomal subunits in budding yeast, Saccharomyces cerevisiae. J Cell Sci 122 : 2078–2088.
23. WenWL, StevensonAL, WangCY, ChenHJ, KearseySE, et al. (2010) Vgl1, a multi-KH domain protein, is a novel component of the fission yeast stress granules required for cell survival under thermal stress. Nucleic Acids Res 38 : 6555–6566.
24. NilssonD, SunnerhagenP (2011) Cellular stress induces cytoplasmic RNA granules in fission yeast. RNA 17 : 120–133.
25. BuchanJR, YoonJH, ParkerR (2011) Stress-specific composition, assembly and kinetics of stress granules in Saccharomyces cerevisiae. J Cell Sci 124 : 228–239.
26. GrouslT, IvanovP, MalcovaI, PompachP, FrydlovaI, et al. (2013) Heat shock-induced accumulation of translation elongation and termination factors precedes assembly of stress granules in S. cerevisiae. PLoS One 8: e57083.
27. BuchanJR, KolaitisRM, TaylorJP, ParkerR (2013) Eukaryotic stress granules are cleared by autophagy and Cdc48/VCP function. Cell 153 : 1461–1474.
28. DuboulozF, DelocheO, WankeV, CameroniE, De VirgilioC (2005) The TOR and EGO protein complexes orchestrate microautophagy in yeast. Mol Cell 19 : 15–26.
29. KedershaN, ChoMR, LiW, YaconoPW, ChenS, et al. (2000) Dynamic shuttling of TIA-1 accompanies the recruitment of mRNA to mammalian stress granules. J Cell Biol 151 : 1257–1268.
30. ShethU, ParkerR (2003) Decapping and decay of messenger RNA occur in cytoplasmic processing bodies. Science 300 : 805–808.
31. KatoM, HanTW, XieS, ShiK, DuX, et al. (2012) Cell-free formation of RNA granules: low complexity sequence domains form dynamic fibers within hydrogels. Cell 149 : 753–767.
32. LiX, KahveciT (2006) A novel algorithm for identifying low-complexity regions in a protein sequence. Bioinformatics 22 : 2980–2987.
33. MalinovskaL, KroschwaldS, AlbertiS (2013) Protein disorder, prion propensities, and self-organizing macromolecular collectives. Biochim Biophys Acta 1834 : 918–31.
34. MeszarosB, SimonI, DosztanyiZ (2009) Prediction of protein binding regions in disordered proteins. PLoS Comput Biol 5: e1000376.
35. ToombsJA, PetriM, PaulKR, KanGY, Ben-HurA, et al. (2012) De novo design of synthetic prion domains. Proc Natl Acad Sci U S A 109 : 6519–6524.
36. DavidsonJF, SchiestlRH (2001) Cytotoxic and genotoxic consequences of heat stress are dependent on the presence of oxygen in Saccharomyces cerevisiae. J Bacteriol 183 : 4580–4587.
37. BindaM, Peli-GulliMP, BonfilsG, PanchaudN, UrbanJ, et al. (2009) The Vam6 GEF controls TORC1 by activating the EGO complex. Mol Cell 35 : 563–573.
38. LiZ, VizeacoumarFJ, BahrS, LiJ, WarringerJ, et al. (2011) Systematic exploration of essential yeast gene function with temperature-sensitive mutants. Nat Biotechnol 29 : 361–367.
39. EfeyanA, ZoncuR, ChangS, GumperI, SnitkinH, et al. (2013) Regulation of mTORC1 by the Rag GTPases is necessary for neonatal autophagy and survival. Nature 493 : 679–683.
40. TudiscaV, RecouvreuxV, MorenoS, Boy-MarcotteE, JacquetM, et al. (2010) Differential localization to cytoplasm, nucleus or P-bodies of yeast PKA subunits under different growth conditions. Eur J Cell Biol 89 : 339–348.
41. WelkerS, RudolphB, FrenzelE, HagnF, LiebischG, et al. (2010) Hsp12 is an intrinsically unstructured stress protein that folds upon membrane association and modulates membrane function. Mol Cell 39 : 507–520.
42. JorgensenP, RupesI, SharomJR, SchneperL, BroachJR, et al. (2004) A dynamic transcriptional network communicates growth potential to ribosome synthesis and critical cell size. Genes Dev 18 : 2491–2505.
43. UrbanJ, SoulardA, HuberA, LippmanS, MukhopadhyayD, et al. (2007) Sch9 is a major target of TORC1 in Saccharomyces cerevisiae. Mol Cell 26 : 663–674.
44. HohmannS (2002) Osmotic stress signaling and osmoadaptation in yeasts. Microbiol Mol Biol Rev 66 : 300–372.
45. CherkasovaVA, HinnebuschAG (2003) Translational control by TOR and TAP42 through dephosphorylation of eIF2alpha kinase GCN2. Genes Dev 17 : 859–872.
46. MitchellSF, JainS, SheM, ParkerR (2013) Global analysis of yeast mRNPs. Nat Struct Mol Biol 20 : 127–133.
47. BoscoDA, LemayN, KoHK, ZhouH, BurkeC, et al. (2010) Mutant FUS proteins that cause amyotrophic lateral sclerosis incorporate into stress granules. Hum Mol Genet 19 : 4160–4175.
48. CastellaniRJ, GuptaY, ShengB, SiedlakSL, HarrisPL, et al. (2011) A novel origin for granulovacuolar degeneration in aging and Alzheimer's disease: parallels to stress granules. Lab Invest 91 : 1777–1786.
49. HanTW, KatoM, XieS, WuLC, MirzaeiH, et al. (2012) Cell-free formation of RNA granules: bound RNAs identify features and components of cellular assemblies. Cell 149 : 768–779.
50. SchürmannA, BrauersA, MassmannS, BeckerW, JoostHG (1995) Cloning of a novel family of mammalian GTP-binding proteins (RagA, RagBs, RagB1) with remote similarity to the Ras-related GTPases. J Biol Chem 270 : 28982–28988.
51. NakashimaN, HayashiN, NoguchiE, NishimotoT (1996) Putative GTPase Gtr1p genetically interacts with the RanGTPase cycle in Saccharomyces cerevisiae. J Cell Sci 109 : 2311–2318.
52. GaoM, KaiserCA (2006) A conserved GTPase-containing complex is required for intracellular sorting of the general amino-acid permease in yeast. Nat Cell Biol 8 : 657–667.
53. SancakY, PetersonTR, ShaulYD, LindquistRA, ThoreenCC, et al. (2008) The Rag GTPases bind raptor and mediate amino acid signaling to mTORC1. Science 320 : 1496–1501.
54. SekiguchiT, HayashiN, WangY, KobayashiH (2008) Genetic evidence that Ras-like GTPases, Gtr1p, and Gtr2p, are involved in epigenetic control of gene expression in Saccharomyces cerevisiae. Biochem Biophys Res Commun 368 : 748–754.
55. SeiserRM, SundbergAE, WollamBJ, Zobel-ThroppP, BaldwinK, et al. (2006) Ltv1 is required for efficient nuclear export of the ribosomal small subunit in Saccharomyces cerevisiae. Genetics 174 : 679–691.
56. TodakaY, WangY, TashiroK, NakashimaN, NishimotoT, et al. (2005) Association of the GTP-binding protein Gtr1p with Rpc19p, a shared subunit of RNA polymerase I and III in yeast Saccharomyces cerevisiae. Genetics 170 : 1515–1524.
57. MahboubiH, SeganathyE, KongD, StochajU (2013) Identification of novel stress granule components that are involved in nuclear transport. PLoS One 8: e68356.
58. ArhzaouyK, Ramezani-RadM (2012) Nuclear import of UBL-domain protein Mdy2 is required for heat-induced stress response in Saccharomyces cerevisiae. PLoS One 7: e52956.
59. HaimovichG, MedinaDA, CausseSZ, GarberM, Millan-ZambranoG, et al. (2013) Gene expression is circular: factors for mRNA degradation also foster mRNA synthesis. Cell 153 : 1000–1011.
60. ReinekeLC, DoughertyJD, PierreP, LloydRE (2012) Large G3BP-induced granules trigger eIF2alpha phosphorylation. Mol Biol Cell 23 : 3499–3510.
61. DeinertK, FasioloF, HurtEC, SimosG (2001) Arc1p organizes the yeast aminoacyl-tRNA synthetase complex and stabilizes its interaction with the cognate tRNAs. J Biol Chem 276 : 6000–6008.
62. YamasakiS, IvanovP, HuGF, AndersonP (2009) Angiogenin cleaves tRNA and promotes stress-induced translational repression. J Cell Biol 185 : 35–42.
63. TongAH, EvangelistaM, ParsonsAB, XuH, BaderGD, et al. (2001) Systematic genetic analysis with ordered arrays of yeast deletion mutants. Science 294 : 2364–2368.
64. TongAH, LesageG, BaderGD, DingH, XuH, et al. (2004) Global mapping of the yeast genetic interaction network. Science 303 : 808–813.
65. HoCH, MagtanongL, BarkerSL, GreshamD, NishimuraS, et al. (2009) A molecular barcoded yeast ORF library enables mode-of-action analysis of bioactive compounds. Nat Biotechnol 27 : 369–377.
66. BoyleEI, WengS, GollubJ, JinH, BotsteinD, et al. (2004) GO Term Finder - open source software for accessing Gene Ontology information and finding significantly enriched Gene Ontology terms associated with a list of genes. Bioinformatics 20 : 3710–3715.
67. BreitkreutzBJ, StarkC, TyersM (2003) Osprey: a network visualization system. Genome Biol 4: R22.
68. BreitkreutzBJ, StarkC, RegulyT, BoucherL, BreitkreutzA, et al. (2008) The BioGRID Interaction Database: 2008 update. Nucleic Acids Res 36: D637–640.
69. PettersenEF, GoddardTD, HuangCC, CouchGS, GreenblattDM, et al. (2004) UCSF Chimera - a visualization system for exploratory research and analysis. J Comput Chem 25 : 1605–1612.
70. Ben-ShemA, Garreau de LoubresseN, MelnikovS, JennerL, YusupovaG, et al. (2011) The structure of the eukaryotic ribosome at 3.0 Å resolution. Science 334 : 1524–1529.
71. WarringerJ, BlombergA (2003) Automated screening in environmental arrays allows analysis of quantitative phenotypic profiles in Saccharomyces cerevisiae. Yeast 20 : 53–67.
72. GockeE, ManneyTR (1979) Expression of radiation-induced mutations at the arginine permease (CAN1) locus in Saccharomyces cerevisiae. Genetics 91 : 53–66.
73. Miller JH (1972) Experiments in molecular genetics. Cold Spring Harbor, N.Y.: Cold Spring Harbor Laboratory Press. pp. 352–355.
74. TompaP, DosztanyiZ, SimonI (2006) Prevalent structural disorder in E. coli and S. cerevisiae proteomes. J Proteome Res 5 : 1996–2000.
Štítky
Genetika Reprodukční medicínaČlánek vyšel v časopise
PLOS Genetics
2014 Číslo 11
- Kazuistika – Perspektivy využití precizované medicíny v rámci personalizované specifické terapie onkologických pacientů
- Nobelova cena za chemii pro genetické nůžky: Objev, který změní naši budoucnost?
- Technologie na bázi RNA v klinické praxi: od přebarvených petúnií k terapii vzácných a dosud jen obtížně léčitelných chorob u lidí
- „Nepředstavovali jsme si, že náš výzkum povede přímo ke vzniku nových léků, dokonce ještě za našeho života“
- Bezplatné služby pro diagnostiku ATTRv amyloidózy pro kardiology
Nejčtenější v tomto čísle
- An RNA-Seq Screen of the Antenna Identifies a Transporter Necessary for Ammonia Detection
- Systematic Comparison of the Effects of Alpha-synuclein Mutations on Its Oligomerization and Aggregation
- Functional Diversity of Carbohydrate-Active Enzymes Enabling a Bacterium to Ferment Plant Biomass
- Regularized Machine Learning in the Genetic Prediction of Complex Traits
Zvyšte si kvalifikaci online z pohodlí domova
Mazová zátka a její řešení
nový kurzVšechny kurzy