
An RNA-Seq Screen of the Antenna Identifies a Transporter Necessary for Ammonia Detection
Olfaction underlies the attraction of insect pests and vectors of disease to their plant and human hosts. In the genetic model insect Drosophila, the neuronal basis of odor coding has been extensively analyzed in the antenna, its major olfactory organ, but the molecular basis of odor coding has not. Additionally, there has been little analysis of any olfactory cells other than neurons. We have undertaken a comprehensive and quantitative analysis of gene expression in the Drosophila antenna. This analysis revealed a surprisingly broad dynamic range of odor receptor and odor binding protein expression, and unexpected expression of taste receptor genes. Further analysis identified 250 genes that are expressed at reduced levels in a mutant lacking an evolutionarily ancient class of sensilla, antennal hairs housing neurons that respond to human odors. One of these genes, a transporter, is expressed in non-neuronal cells but is essential to the response of a neuron to ammonia, a key cue for insect vectors of disease. A mutation in this transporter can be rescued by its mosquito homolog. While many studies of sensory coding consider the neural circuit in isolation, our analysis reveals an essential role for an auxiliary cell.
Published in the journal:
. PLoS Genet 10(11): e32767. doi:10.1371/journal.pgen.1004810
Category:
Research Article
doi:
https://doi.org/10.1371/journal.pgen.1004810
Summary
Olfaction underlies the attraction of insect pests and vectors of disease to their plant and human hosts. In the genetic model insect Drosophila, the neuronal basis of odor coding has been extensively analyzed in the antenna, its major olfactory organ, but the molecular basis of odor coding has not. Additionally, there has been little analysis of any olfactory cells other than neurons. We have undertaken a comprehensive and quantitative analysis of gene expression in the Drosophila antenna. This analysis revealed a surprisingly broad dynamic range of odor receptor and odor binding protein expression, and unexpected expression of taste receptor genes. Further analysis identified 250 genes that are expressed at reduced levels in a mutant lacking an evolutionarily ancient class of sensilla, antennal hairs housing neurons that respond to human odors. One of these genes, a transporter, is expressed in non-neuronal cells but is essential to the response of a neuron to ammonia, a key cue for insect vectors of disease. A mutation in this transporter can be rescued by its mosquito homolog. While many studies of sensory coding consider the neural circuit in isolation, our analysis reveals an essential role for an auxiliary cell.
Introduction
Olfaction is a critical sensory modality for insects, as it acts in the identification of food and mates. Insect olfaction is of global significance in that many insects that transmit disease, and many agricultural pests that ravage the world's food supply, find their human or plant hosts through olfactory cues [1], [2].
The most extensively studied insect olfactory system is that of Drosophila. The third antennal segment of the fly is covered with three main morphological classes of olfactory sensilla: basiconic, trichoid, and coeloconic sensilla (Figure 1A, B) [3], [4]. Each sensillum contains the dendrites of up to four olfactory receptor neurons (ORNs) with different odorant response profiles. ORNs of basiconic sensilla respond to food odors, including many esters and alcohols; ORNs of trichoid sensilla respond to fly odors; ORNs of coeloconic sensilla respond to many amines and carboxylic acids [5]–[8]. Additional olfactory sensilla are located in the sacculus, a three-chambered pit under the antennal surface, and on the maxillary palp, an organ that extends from the proboscis [4].

Odor receptors of the Or family underlie the responses of basiconic and trichoid sensilla [7], [9]. Most individual ORNs in these sensilla express one of ∼60 Ors as well as Orco, a related co-receptor [10]–[12]. ORNs of coeloconic sensilla express members of the IR family of ionotropic receptors, an evolutionarily ancient class of ∼60 receptors, of which some are co-receptors [13]–[15].
The Drosophila olfactory organs have been the subjects of detailed systematic anatomical and physiological studies, but their molecular biology has not been extensively characterized. For example, remarkably little is known about how the molecular underpinnings of olfaction differ among different classes of sensilla, other than that they express different receptors. The molecular basis of olfaction in coeloconic sensilla is of particular interest in that these sensilla – and their morphological counterparts in mosquitoes - respond to many human volatiles, including carboxylic acids and ammonia [5], [6], [16]–[18]. Molecular targets specific to sensilla could be particularly useful in designing novel approaches to the control of insect vectors and the diseases they carry.
Although ORNs have received a great deal of attention, the non-neuronal cells in olfactory sensilla are largely unexplored. Olfactory sensilla contain three or four auxiliary cells (Figure 1C) [19]. These cells express odorant binding proteins (OBPs) and odorant-degrading enzymes (ODEs), which bind and degrade odorants, respectively [20]–[22]. However, the contributions of these cells to odor coding in vivo are poorly understood.
Here we have addressed these major gaps in our knowledge. We began by carrying out a molecular screen for genes whose expression is highly enriched in coeloconic sensilla, including genes of both neurons and auxiliary cells. Specifically, we carried out an RNA-Seq analysis of antennae from both wild type flies and ato mutants, which lack coeloconic sensilla but which retain basiconic and trichoid sensilla [23]. The screen identified 250 genes severely depleted in atonal antennae. The proteins encoded by these genes are highly enriched in receptors, ion channels, and transporters. One of these genes encodes a member of a highly conserved ammonium transporter family found in bacteria, yeast, and plants. We have named the gene Amt (Ammonium transporter) and have found that on the antennal surface it is exclusively expressed in auxiliary cells of one kind of coeloconic sensillum. Genetic and electrophysiological analysis revealed that despite its non-neuronal expression, Amt is required for the ammonia response of an olfactory neuron in this sensillum. These results illustrate in vivo an essential contribution of a non-neuronal auxiliary cell to an olfactory circuit.
Results
The olfactory receptor repertoire of the antenna
We profiled the transcriptome of the third segment of the Drosophila antenna by mRNA sequencing (RNA-Seq). Dissected third segments from Canton-S (CS) flies were divided into three biological replicates and analyzed independently. Of ∼24 million reads, 85% could be aligned to the Drosophila genome, and 90% of the aligned reads mapped to unique genes in the FlyBase annotation set (Table S1 and Dataset S1). Of 14,078 genes in the FlyBase set, 8,646 (61%) were detected at ≥1 read per million mapped reads (RPM) in all three samples, and we designated these as the set of third antennal segment genes (Dataset S1).
We found expression of 39 Or genes (Figures 1D and S1). These results are in good agreement with earlier in situ hybridization, GAL4, and RT-PCR analysis of Or expression in the antenna [10], [11], [24], [25]. We did not observe expression of Or33b or Or49a, which had been detected by in situ hybridization in some but not all previous studies [10], [11], [24], [25]. Expression of these genes may be sensitive to the genetic background. Transcripts of two of the detected Or genes, Or46a and Or33c, had not previously been identified in the antenna by in situ hybridization, although they had been found by RT-PCR [10], [11], [24], [25].
We detected expression of 19 IR genes, 17 of which have previously been observed in the antenna (Figures 1E and S1) [5], [14], [15]. Our analysis confirmed expression of IR60a, which had been identified by RT-PCR but not by in situ hybridization analysis [14]. We also identified reads representing IR51b and IR62a, which have not previously been found in the antenna. Both of these genes are expressed at low levels, and reside in introns of more highly-expressed antennal genes; these reads could derive from unspliced transcripts of the surrounding genes rather than independent IR transcripts.
We considered the purity of our antennal preparations. There was little if any contamination with maxillary palps: most Or genes expressed in the maxillary palp [10], [11], [26] were not detected in our analysis of the antenna. Moreover, there was little contamination with second antennal segments: many highly abundant transcripts in the second segment were not found in our third segment dataset (Figure S2) [27].
Large dynamic range of olfactory receptor expression
The dynamic range of Or expression is striking (Figure 1D). Orco, which encodes the co-receptor of canonical Ors, was detected at a level 43-fold higher than the mean level of the 38 detected canonical Or genes: 1875 reads per kilobase per million mapped reads (RPKM) vs. 44 RPKM, respectively. This expression ratio supports a 1∶1 stoichiometry of Orco and canonical Ors. Among the canonical Or genes, expression ranged from 242 RPKM in the case of Or59b down to 1.4 RPKM in the case of Or33c. Thus the levels of canonical Ors varied over a 170-fold range.
Does the Or expression level correlate with sensillum or neuron type? Ors of large basiconic sensilla are expressed at higher levels (94±26 RPKM; n = 8 genes, SEM) than those of small basiconic sensilla (30±6 RPKM; n = 15 genes) or trichoid sensilla (34±10 RPKM; n = 12 genes) (p<0.005 and p<0.05, respectively, ANOVA) (Figure S3). We note with interest that in eight of nine basiconic sensillum types in which the receptor-to-neuron map is established [9]–[11], [28]–[30], the Or that is expressed at the highest level maps to the A neuron, which yields the action potential with the greatest amplitude (Figure S3).
IR genes also showed a wide dynamic range of expression (Figure 1E). The IRs believed to function as co-receptors (IR76b, IR25a, and IR8a) [13] are expressed at levels that are substantially higher than the mean level of the other IRs. Among the other IRs, the highest expression level was 101 RPKM (IR75a), and several were expressed at less than 3 RPKM.
Unexpected gustatory receptor expression in the antenna
We were surprised to detect expression of 12–14 Gustatory Receptor (Gr) genes in the antenna (Figures 1F and S4). Many of these Grs are sugar receptors, such as Gr43a, implicated in fructose detection, and Gr61a, implicated in the detection of multiple sugars [31]–[33]. These antennal Gr genes also include Gr64f, Gr64c, Gr64b, Gr64a, all of which lie in a cluster of genes and all of which have been implicated in sugar reception [32], [34]–[37]. Two additional genes of the cluster, Gr64e and Gr64d, were detected at ∼2 RPKM, but quantitative analysis of their expression is made difficult by complications in their annotation and technically they do not meet our formal criteria for antennal expression. Gr64f is expressed at 36 RPKM, a level higher than 22 of the antennal Or genes. We verified the antennal expression of the 12 Grs expressed in the RNA-Seq dataset, as well as Gr64e and Gr64d, using qRT-PCR on additional sets of CS antennal cDNA (Figure S5A). The relative expression levels of these Grs as measured by qRT-PCR were similar to those observed by RNA-Seq (Figures 1F and S5A).
The Gr gene that is most abundantly expressed in the antenna is Gr10a (86 RPKM), which is of unknown function and has been previously mapped to the ab1D olfactory neuron [9], [10]. Also detected are Gr63a and Gr21a, which are believed to form a heteromeric receptor that mediates response to CO2 and certain odorants in ab1C neurons [38]–[40], Gr28b, which has recently been shown to act as a thermosensor in the antenna [41], and Gr66a and Gr93a, both implicated in the detection of bitter compounds in the taste system [42]–[44].
OBP and Trp expression in the antenna
The two most highly expressed antennal genes are OBPs (Odorant Binding Proteins). Moreover, five of the 10 most highly expressed genes of the third antennal segment are OBPs (Figure S6). OBPs are small, secreted proteins of 13–28 kDa that are highly divergent in sequence and are found in the fluid that bathes the dendrites of chemosensory neurons. Their function is unclear, but some have been found to bind odorants and may carry them to receptors in the dendrites of ORNs [20]–[22]. One OBP has been shown to contribute to ORN signaling in Drosophila [45].
RNA-Seq revealed antennal expression of 27 of the 52 members of the OBP family. Their expressions levels varied over a remarkable range, spanning four orders of magnitude (Figures 1G (note the logarithmic scale) and S4). Most OBPs fall into two groups: 10 are expressed at levels exceeding 1,000 RPKM, while 16 are at levels less than 70 RPKM. Abundance may correlate with tissue-specificity of expression: most of the OBPs expressed at lower levels have also been found to be expressed in taste tissue, while most of the abundantly expressed OBPs have not been detected outside the antenna [46]–[49].
We detected expression of 11 of 16 members of the Transient receptor potential (Trp) family of ion channel genes (Figures 1H and S4). Trp channels have been implicated in sensory functions, including chemosensation, in both mammals and insects [50]–[53]. Some Trp channels in Drosophila have been localized to small subsets of antennal neurons [52]–[56], consistent with the low levels of expression we observe in RNA-Seq.
A screen for genes highly enriched in coeloconic sensilla reveals 250 candidates
We carried out a screen for genes specifically expressed in coeloconic sensilla. Genes expressed in coeloconic sensilla, but not in other olfactory sensilla or elsewhere in the antenna, seem more likely to contribute directly to olfactory signaling than to represent general housekeeping functions. Accordingly, we performed an RNA-Seq analysis of the third antennal segments of flies lacking Atonal (Ato), a transcription factor that specifies coeloconic sensilla (Table S1) [23]. ato antennae lack coeloconic sensilla on the antennal surface, while maintaining normal numbers of basiconic and trichoid sensilla (Figure 2A) [23]. ato mutants also lack the sacculus, a three-chambered sensory cavity that houses additional coeloconic sensilla as well as a few sensilla that may have hygroreceptor or thermoreceptor function [23]. A small number of neurons in the arista, a feather-like appendage of the antenna, and a number of glial cells are also missing [23], [57].

The transcriptional profiles of third antennal segments of ato and wild type were distinct: the profiles of three independent ato samples were much more similar to each other than to the three samples of wild type (Figure 2B). However, 95% of genes detected in the CS wild type antennae were also found in all three samples of ato antennae (Dataset S1). Moreover, most antennal genes are expressed at comparable levels in the two genotypes, as revealed by calculating the ratio of expression in the two genotypes, and plotting this ratio against the expression level of each antennal gene (Figure 2C). The great majority of genes clustered around a ratio of 1.
As a positive control to test the efficacy of the screen, we examined the expression of IRs, which are expressed in coeloconic sensilla. Of the 17 previously identified antennal IRs, levels of 15 were reduced in ato antennae by a factor greater than ∼4, and some were not detected in ato antennae (Figures 2D and S1). These results validate the efficacy of the screen. We note, however, a surprising exception to the general pattern of reduction in IR gene expression: IR25a, which encodes an IR co-receptor, showed only a small reduction, to a level ∼1/3rd lower than in wild type. We confirmed that substantial IR25a expression remains in ato, using RT-PCR with three additional independent sets of CS and atonal antennae, whereas expression of a more typical IR gene, IR8a, is lost (Figure S5B). These results suggest that IR25a is expressed in either basiconic or trichoid sensilla, in addition to coeloconic sensilla. Likewise, low expression levels of IR76b and a few other IRs in ato mutants (Figure S1) suggest some degree of expression in non-coeloconic sensilla, in addition to their expression in coeloconic sensilla. We note that IR60a expression, which had not been found previously by in situ hybridization, was reduced by more than 10-fold in ato, consistent with its identification as a bona fide antennal IR in wild type. By contrast, levels of IR51b and IR62a, which reside in introns, were nearly unchanged.
As a negative control to test the reliability of the screen, we examined the expression of Or genes, nearly all of which are expressed in basiconic and trichoid sensilla, but not coeloconic sensilla. In ato mutants there was little if any reduction in expression of any of the 39 Or genes, with two exceptions (Figures 2E and S1). Or35a levels were reduced by 70-fold, which is fully consistent with the loss of coeloconic sensilla, since Or35a is the one Or gene that is expressed in coeloconic sensilla [6], [11]. Levels of Or85a also declined, which may be related to its location in the genomic region removed by the ato deficiency, Df(3R)p13 (see Materials and Methods) [58].
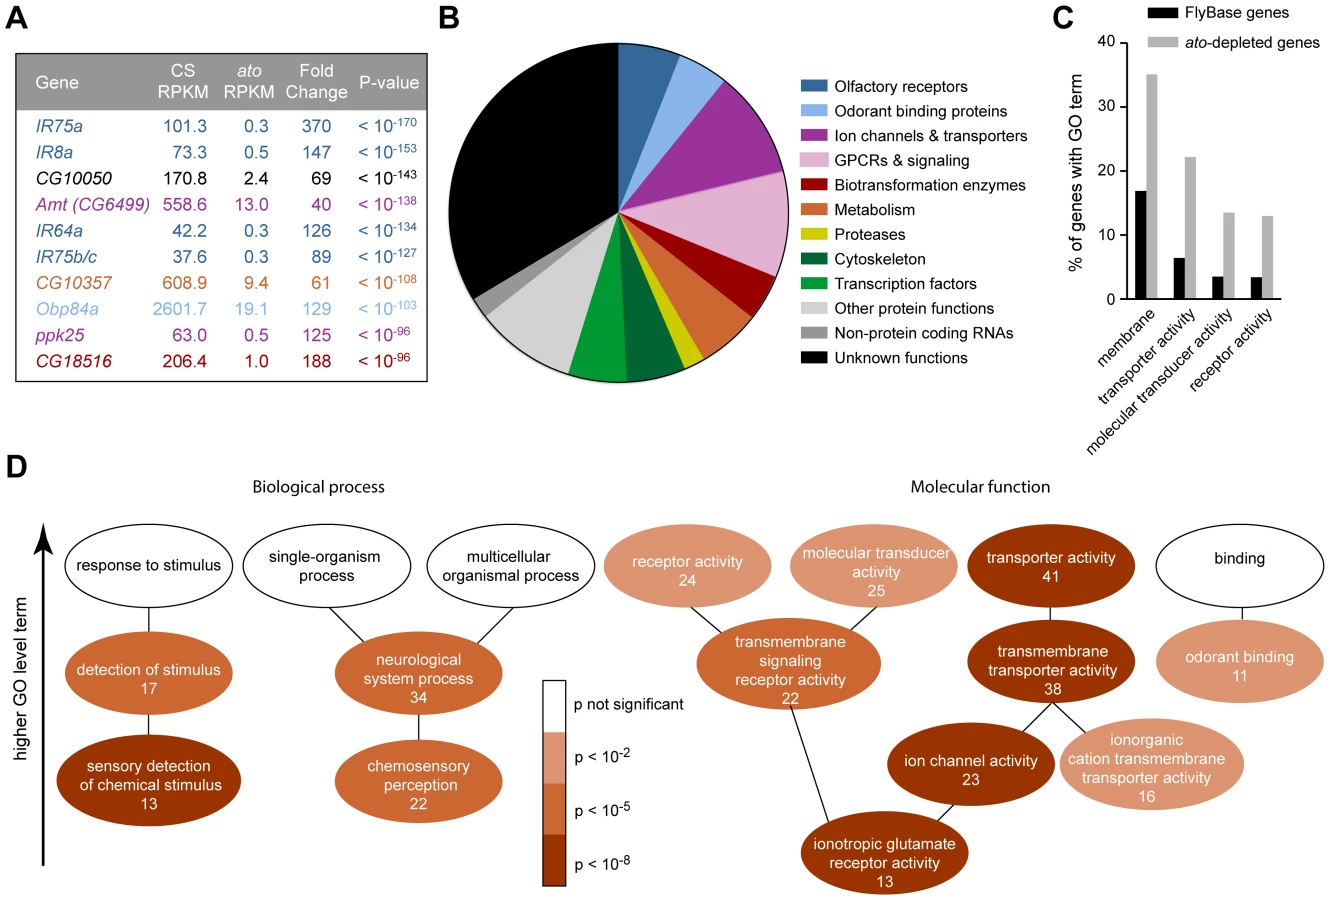
Having thus validated the screen, we carried out a statistical analysis to identify the set of genes that are differentially expressed in the two genotypes. We identified 1,490 differentially expressed genes (red dots in Figure 2C, Dataset S1) when the false discovery rate (FDR) was set at 1%. Levels of 803 of these genes were reduced in ato, as reflected by their negative log2(ato/CS) values. The 10 genes that were reduced with the greatest statistical significance include four IRs, Obp84a, and ppk25, all of which are specifically expressed in coeloconic sensilla (Figure 3A)[5], [15], [59], [60]. Given that levels of nearly all of the 17 known antennal IRs are reduced at least 4-fold, we analyzed further the subset of 250 genes that were at least 4-fold reduced in ato antennae (Dataset S1).
Many of the enriched genes are associated with transduction and transport
Most of the 250 genes that were at least 4-fold reduced in ato antennae have not been well characterized in Drosophila. We carried out BLAST searches with each of them to gain information with which to perform an initial classification. Functions could be predicted for two-thirds of the genes. Functional categories included olfactory receptors, ion channels, transporters and transcription factors, among others; the categories are not necessarily mutually exclusive and were chosen to illustrate the functional diversity of the 250 genes (Figure 3B). One-third of the genes could not be classified with confidence. They had no known function and had little or no similarity to genes with known function in other organisms.
Are the genes identified by the screen enriched for genes of any functional classes, or do they represent a random sample of all possible classes? To address this issue quantitatively, we examined their annotations with Gene Ontology (GO) terms. GO terms refer to a cellular component, biological process, or molecular function with which a protein is associated. Moreover, GO terms are arranged in a hierarchy, in which more specific terms occupy lower levels of the hierarchy. Of 250 genes, 185 had previously been assigned GO terms. When this subset of genes was compared to all FlyBase genes with GO annotations, we found that some high level GO terms were significantly enriched, for example the cellular component “membrane” (p<10−5), and the molecular functions “transporter activity” (p<10−8), “molecular transducer activity” (p<10−4) and “receptor activity” (p<10−4) (Figures 3C and S7), as detailed below.
Among terms describing biological processes, there was enrichment for genes annotated for roles in the “sensory detection of chemical stimulus” (7.0% of ato-depleted genes vs. 0.5% of FlyBase genes, p<10−8), “chemosensory perception” (11.9% of ato-depleted genes vs. 1.9% of FlyBase genes, p<10−7), and “neurological system process” (18.4% of ato-depleted genes vs. 5.9% of FlyBase genes, p<10−5)(Figure 3D). This enrichment is consistent with the loss of olfactory structures in ato antennae.
With respect to molecular function, there was particularly strong enrichment for genes described by the term “ionotropic glutamate receptor activity” (7.0% of ato-depleted genes vs. 0.3% of FlyBase genes, p<10−11), which is consistent with the loss of IRs in ato antennae (Figures 2D and 3D). These IR genes were a subset of the 22 genes described by “transmembrane signaling receptor activity” (11.9% of ato-depleted genes vs. 2.6% of FlyBase genes, p<10−5), which also included six GPCRs. Additionally, there was strong enrichment for genes described by the term “ion channel activity” (12.4% of ato-depleted genes vs. 1.7% of FlyBase genes, p<10−10). In addition to the IRs, this term included 10 ion channels that were expressed at reduced levels in ato, including two members of the pickpocket (ppk) family, two members of the Trp family, and four potassium channels. The ion channels were in turn a subset of 38 genes described by “transmembrane transporter activity” (20.5% of ato-depleted genes vs. 5.6% of FlyBase genes, p<10−8). This subset also contained twelve members of the solute carrier (SLC) family of transporters. One transporter is considered in detail below.
We also examined the genes that were expressed at higher, rather than lower, levels in ato than wild type, with an interest in understanding what other changes in antennal gene expression occur in the absence of coeloconic sensilla. Among 155 genes expressed at levels that were at least 4-fold higher in ato flies, 130 had been assigned GO terms. Many of these genes are associated with the immune system and defense responses, such as extracellular antimicrobial peptides (Dataset S1 and Figure S7). The increased expression of these genes may reflect a general debilitation of ato mutants, which exhibit a variety of developmental defects and which could conceivably suffer an increased susceptibility to microbial infections [58], [61].
Amt is expressed at extremely high levels in auxiliary cells in a subset of coeloconic sensilla
One gene identified in the screen offered a particularly interesting opportunity to test whether an individual gene whose expression is depleted in ato in fact functions in coeloconic sensilla. This gene, CG6499, is expressed at extremely high levels in the wild type antenna and is severely depleted in ato (559 RPKM vs. 13 RPKM, Figure 3A). Its function in Drosophila is unexplored, but an additional virtue of this gene is that its sequence identifies it as an ammonium transporter. It encodes a predicted protein of 562 amino acids, of which an internal region of ∼410 amino acids exhibits ∼30% identity to well-characterized ammonium transporters from bacteria, yeast, and plants [62]–[64]. Ammonia is a critical olfactory cue for many insects, and is an attractive component of human odor for certain insect vectors of human disease, including mosquitoes [65]–[68]. Ammonia is primarily detected by coeloconic sensilla in Drosophila [5], [6], [69], and morphologically similar sensilla respond to ammonia and amines in other insect species [16]–[18], [65], [70], [71]. Based on the high sequence similarity of CG6499 to other members of the ammonium transporter family, we renamed it Ammonium transporter (Amt).
We examined the localization of Amt expression. As an initial step we carried out RT-PCR analysis of heads with and without antennae, legs, bodies depleted of heads and appendages, and third-instar larvae (Figure 4A). This analysis confirmed the strong expression in the antennae and revealed evidence for weak expression in legs.

Next we examined Amt expression in the antenna. We generated an Amt-GAL4 line and found that it drove expression of a UAS-mCD8::GFP reporter in a subset of sensilla on the antennal surface and in a subset of sensilla in the sacculus (Figure 4B). Expression was localized to auxiliary cells of sensilla, rather than neurons, as determined by the morphology and large size of the labeled cells and the absence of labeled dendrites or axons. The fidelity of the Amt-GAL4 driver was tested in double-label in situ hybridization experiments with probes against GFP and Amt. The two probes showed a high degree of co-localization (Figure 4C).
We then tested whether the sensilla that express Amt are in fact coeloconic sensilla. Specifically, we generated GAL4 drivers for two IR co-receptors: IR76b, which is expressed in each of the four coeloconic sensilla subtypes of the antennal surface, and IR8b, which is expressed in all four subtypes and in coeloconic sensilla of the third chamber of the sacculus [15]. We carried out double-label experiments with a probe for Amt and an antibody against GFP, which was driven by the IR-GAL4 constructs (Figure 4D, E). Double-label experiments indicated that Amt is expressed in a subset of coeloconic sensilla on the antennal surface and in the sacculus (Figure 4D, E). These results agree with our finding that Amt is depleted in ato antennae. The Amt probe and GFP antibody did not label the same cells within sensilla, however. This result is consistent with our finding that Amt expression is non-neuronal, because most coeloconic neurons express either IR76b or IR8b.
Given that Amt is expressed in auxiliary cells of sensilla, we wondered whether it is expressed in the same auxiliary cells that synthesize and secrete OBPs. Our screen had identified Obp84a as one of the most highly enriched genes in coeloconic sensilla (Figure 3A). We carried out a double-label experiment and found that Obp84a and Amt are expressed in different auxiliary cells (Figure 4F, I).
Finally, we wanted to determine which subset of coeloconic sensilla expresses Amt. Previous electrophysiological analysis had indicated that only the ac1 class of coeloconic sensilla yields large responses to ammonia [5], [6]. IR92a is expressed in ac1 sensilla and responds to ammonia, whereas IR76a is expressed in ac4 sensilla [5], [15], [69]. We found that Amt is expressed in the same sensilla as IR92a-GAL4, and not in the same sensilla as IR76a-GAL4 (Figure 4G, H). Furthermore, neurons labeled by IR92a-GAL4 were consistently in close proximity to Amt-labeled auxiliary cells (Figure 4G, J). In summary, we conclude that Amt is specifically expressed in all or most ac1 sensilla, in good agreement with previous physiological results.
Amt plays a critical role in ammonia response of ac1 sensilla
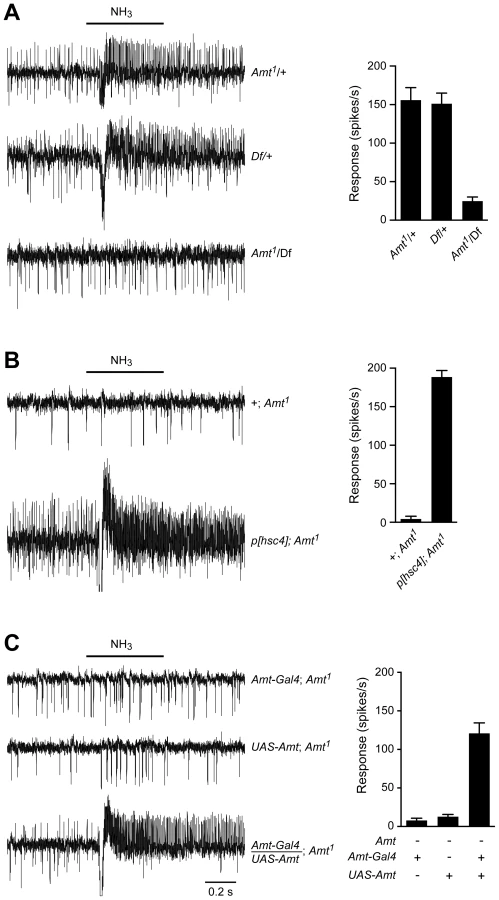
A key goal of our screen was to identify genes required for olfactory signaling in coeloconic sensilla. To ask whether Amt has a functional role in ammonia detection in ac1 sensilla, we tested an available mutant in which a transposon is inserted into the coding region of Amt [72]. We used single-unit electrophysiological recordings to test ammonia response at a wide range of doses. We quantified the number of spikes generated during a 500 ms odor stimulus period, and we subtracted the response to the odor diluent alone. Due to the difficulty of sorting spikes in ac1 sensilla, we quantified the total number of spikes from the three neurons in the sensillum, rather than the number of spikes generated by the ammonia-sensitive ORN alone. Control flies responded to increasing doses of ammonia with increasing numbers of action potentials, yielding spike frequencies similar to those observed previously (Figure 5A, B) [5], [6].

The Amt mutant (Amt1) showed a dramatically reduced response to ammonia (Figure 5A, B). Little or no response was seen in ac1 sensilla at most doses, and only very weak responses were seen at the highest dose. A second phenotype was also observed: mutant ac1 sensilla showed reduced spontaneous activity levels (p<0.0001) (Figure 5A, C). Moreover, the mutant ac1 sensilla appeared to lack the upward-directed spikes observed in control ac1 sensilla (Figure 5A). Close examination of the responses of ac1 sensilla to low concentrations of ammonia in control flies suggested that the upward-spiking neuron is the neuron that responds to ammonia, although this could not be determined conclusively.
We were surprised that a non-neuronal gene had such a dramatic effect on a neuronal response and sought to verify that the loss of ammonia response was in fact due to disruption of the Amt gene. The Amt mutant used in Figure 5B had been outcrossed for 10 generations to the control line so as to minimize genetic background effects, but we carried out additional tests. We sequenced the linked IR92a gene in both control and outcrossed mutant lines and confirmed they were the same. We then obtained a genetic deficiency (Df) that removed the Amt gene [73] and found that Df/Amt1 heterozygotes showed a defective ammonia response (Figure 6A). Next we found that an available 14 kb genomic fragment including the entire coding region of Amt, as well as the neighboring gene Hsc70-4 [74], rescued the defective ammonia response of Amt1 (Figure 6B). Finally, we generated an Amt cDNA and showed that when driven by Amt-GAL4, the UAS-Amt cDNA construct rescued the Amt phenotype as well (Figure 6C).
The Amt olfactory defect is specific to ac1 ammonia-sensitive ORNs
Given the unexpected severity of the Amt defect and the expression of Amt in auxiliary cells, we wondered whether Amt had a general effect on the function of the ac1 sensillum. For example, in addition to producing OBPs and ODEs, auxiliary cells generate the transepithelial potential, which is the electrical potential that underlies odor-induced ORN spiking [75]. To ask whether the Amt mutation affects the transepithelial potential or other general properties of ac1, we measured the responses of the other two ORNs in the ac1 sensillum.
We tested pyrrolidine, which in wild type activates one of the other ORNs in ac1, and 2-oxovaleric acid, which activates the other ORN [5]. Both of these odorants elicited normal responses in Amt1 (Figure 7A). These results suggest that there is neither a defect in the transepithelial potential of ac1 sensilla nor another general sensillar impairment, but rather a specific defect in ammonia response. In this experiment we also tested propanal and phenethylamine, odorants that in wild type distinguish ac1 from ac2, ac3, and ac4 [5], [6], and the responses to these odorants were characteristic of ac1.

We next asked whether Amt1 affected olfactory signaling in the other three classes of coeloconic sensilla on the antennal surface, ac2–4. We tested odorants that activate different ORNs within each sensillum type, as well as negative control odorants selected to confirm the identity of each type. All responses were normal, consistent with the lack of Amt expression in these other sensilla (Figure 7B–D). These results indicate that the role of Amt is specific to ac1, which is particularly intriguing since ac1 is not the only sensillum that detects ammonia: ac4, for example, gives a weak ammonia response that does not depend on Amt (Figure 7D).
An ortholog of Amt from an ammonia-seeking mosquito rescues the fly defect
Given the importance of ammonia detection in the process by which mosquitoes locate their human hosts, we cloned an Amt ortholog from the malaria mosquito Anopheles gambiae and generated a UAS-AgAmt fly line. We asked whether the mosquito construct could rescue the Amt defect in Drosophila. We found that the construct produced a robust rescue of the ammonia response (Figure 8), comparable in magnitude to that produced by the corresponding fly construct, UAS-Amt (Figure 6C). These results suggest that the two proteins have conserved function, consistent with their similar sequences.

Discussion
This study has: i) provided a quantitative and comprehensive analysis of gene expression in the principal olfactory organ of Drosophila; ii) identified 250 genes in a screen for components of an evolutionarily ancient class of sensilla that are poorly understood but critical to insect olfaction; iii) shown that a transporter, despite its expression in non-neuronal cells, is essential for the response of a neuron to ammonia, a key cue for insect vectors of disease.
Unanticipated expression of chemosensory receptors in the antenna
We detected expression of ∼8–10 Gr taste receptor genes that had not been previously found to be expressed in the antenna by RT-PCR or in situ hybridization. One, Gr64f, is expressed at particularly high levels. For nearly all of these genes we found spliced reads, confirming that the reads represent bona fide transcripts as opposed to genomic DNA. Moreover, the expression of all of these Grs in the antenna has been confirmed by qRT-PCR. They are unlikely to be expressed primarily in coeloconic sensilla, since their expression levels are not reduced in ato mutants. Further studies will be needed to localize the expression of these genes at higher resolution.
What roles might Gr genes play in the antenna? Most of these Grs are believed to act as receptors for sugars or bitter compounds, which have low volatility and are unlikely to reach the antenna via airborne transmission. In principle these antennal Grs could sense liquid or solid substances that make contact with the antenna, and perhaps then activate a grooming reflex that would clear foreign material. Alternatively, they could act as odorant receptors. Supporting this possibility, ab1D ORNs, which express Or10a and Gr10a, retain weak responses to some odorants in an Or10a mutant [76], and these responses could be mediated by Gr10a. As a third possibility, we note that the cytological localization of these Grs has not been determined, and these Grs might monitor internal metabolite levels, perhaps in compartments other than the sensillum lymph, as has been found for Gr43a in the brain [31]. Finally we note the possibility that these Grs may form heterodimers with Ors and modulate their ligand sensitivities or responses.
The RNA-Seq analysis detected transcripts of three olfactory receptors, Or46a, Or33c, and IR60a, whose expression in the antenna has not been observed with in situ hybridization. Our results are consistent with prior RT-PCR results [14], [25] and invite mapping of these receptors to sensilla and neurons of the antenna. Given that IR60a expression is reduced in ato flies, it is most likely expressed in either coeloconic sensilla or sensilla of the sacculus. In contrast, Or46a and Or33c expression is retained in ato mutants, and thus they are likely to be expressed in either basiconic or trichoid sensilla. Interestingly, both of these genes are expressed in the maxillary palp in an atypical manner. Or46a is alternatively spliced in the maxillary palp to encode three predicted receptors [77]. In the antenna we find sequences corresponding to only one receptor, Or46aB (Dataset S1). Or33c is unusual in that it is coexpressed in a maxillary palp ORN with another Or gene, Or85e, and this coexpression has been conserved for >25 million years [26]. It will be interesting to determine if the Or46a transcript maps to the ab6B neuron, whose response profile bears similarity to that of pb2B, a neuron that expresses another splice form of Or46a [8], [9], [77].
Our RNA-seq analysis of wild type antennae is consistent with a recently published transcriptional profiling analysis of the antenna by Shiao et al. [78], in the sense that chemoreceptors with relatively high expression levels in our analysis were also found at relatively high levels by Shiao et al. Furthermore, the unexpected chemosensory receptors that we identified were also detected by Shiao et al. However, the analysis by Shiao et al. detected the expression of a much greater number of chemoreceptors in the antenna than we did: 50 Ors and 35 Grs. These greater numbers may result at least in part from the use of relatively relaxed criteria for expression and a lack of biological replicates. We note that the 50 Ors include a substantial number that were previously found to be expressed only in the maxillary palp or in larvae in studies based on in situ hybridization or reporter gene expression analysis [10], [11], [14], [15], [24], [25].
We were surprised by the wide dynamic range of expression within gene families. Levels of OBP transcripts, for example, varied over several orders of magnitude. It is possible that these RNA levels do not faithfully represent protein levels. However, we note that most of the OBP transcripts that were most abundant in our RNA-Seq analysis correspond to OBP proteins that were among the most abundant in a proteomics analysis [79]. Canonical Or transcripts varied over a 170-fold range, and it would be of special interest to examine the levels and localization of tagged Or proteins representing Or genes expressed at both high and low levels.
Genes that distinguish coeloconic sensilla
Other than Or and IR genes, few genes had previously been found to distinguish coeloconic sensilla from other sensillar classes, despite their ancient evolutionary origins, different odor response spectra, and distinct morphology. Our screen identified 250 antennal genes that are reduced in expression levels by at least 4-fold in ato antennae, which lack coeloconic sensilla.
Of the 10 most significantly reduced genes, four have been implicated in odor coding in coeloconic sensilla, and another is an OBP. None of the 10 most highly ranked genes are expressed broadly or at high levels outside of the head, and none have been associated with gross abnormalities in mutant screens. It thus seems likely that many of the genes identified in our differential screen contribute specifically to the function of coeloconic sensilla.
Of these 250 genes, many may act to direct or modulate neuronal activity: the set of candidate genes is highly enriched in ion channels, receptors, and transporters. The set also contains many biotransformation enzymes, which detoxify xenobiotic molecules and are of special interest because they contribute to insecticide resistance [80]. The olfactory organs of both vertebrates and insects, including Drosophila, express biotransformation enzymes at high levels [21], [81]–[85], perhaps because these organs are directly exposed to xenobiotic molecules in their environment. Some of these enzymes have been shown to degrade odorants in vitro [21], [81], [86]. Our results suggest that some biotransformation enzymes may be specialized for the degradation of odorants in coeloconic sensilla. Although airborne odorants presumably have access to all sensilla of the antenna, the concentration of certain odorants may be tightly regulated in some sensilla, particularly in the sensilla that contain responding ORNs.
Other members of the set of 250 genes encode transcription factors, cytoskeletal proteins, and proteases that may contribute to the establishment and maintenance of the signaling environment in these sensilla. A large fraction of genes, one-third, are of unknown function. Taken together, our results suggest that coeloconic sensilla contain many diverse components that are distinct from those of other sensillar classes, likely reflecting their different evolutionary origin and their distinct olfactory function.
An ammonium transporter critical for ammonia responses of ac1 coeloconic ORNs
We found that a transporter, Amt, is essential to olfactory signaling. Ammonia transport across biological membranes is a critical feature of nitrogen metabolism across phylogeny. Members of the conserved Amt family [87], [88] transport ammonia in bacteria, archaea, fungi, plants, and invertebrates, but not vertebrates [64]. Many microorganisms and plants use Amt transporters to acquire ammonia from their environment [87], [88]; they then metabolize the ammonia into amino acids and other molecules. The related Rh ammonium transporters, members of the SLC42 solute transporter family, act in the excretion of ammonia in vertebrate kidneys [89], [90] and may play a similar role in the orthologous Malpighian tubules of insects [91], [92]. Ours is the first report of a role in olfactory signaling for an ammonium transporter.
We found that the Anopheles gambiae homolog AgAmt can substitute for Drosophila Amt in an Amt mutant background. The vast majority of insect genomes examined contain a single Amt gene [93], and Amt transcripts are found not only in mosquito antennae [83], [94] but also in EST collections from a variety of insect pests, including the cotton leafworm, the emerald ash borer, and the Old World bollworm [82], [95], [96]. Taken together, these results suggest a conserved role in insect olfaction. AgAmt could be a useful target for disrupting ammonia-based chemoattraction of mosquitoes to humans, especially since Amt homologs are not present in humans or other vertebrates.
In Drosophila, the only Amt expression we detected in the antenna outside of ac1 sensilla was in the third chamber of the sacculus. The sensilla of this chamber are not accessible to electrophysiological recordings, but GCaMP imaging has indicated that ammonia in fact elicits a response from some of these sensilla, although interestingly the response was an inhibitory one [97].
Interestingly, Amt is not required for the weak ammonia responses of ORNs in ac3 and ac4 sensilla. It is possible that ammonia is transported in these sensilla by Rh50, a member of the family of Rh ammonium transporters. Rh50 is found at low levels (∼21 RPKM) in the antenna of wild type flies, and its expression is ∼7-fold reduced in ato, suggesting that it is expressed in coeloconic sensilla (Dataset S1). We note that when the ac1 ammonia receptor IR92a was ectopically expressed in ac4 ORNs, it did not confer the strong ammonia response characteristic of ac1 [15] (but see [69]). It was proposed that the lack of a strong ammonia response was due to the lack of a factor that is present in ac1 but not ac4. Amt could be such a factor.
The simplest mechanistic explanation for how Amt acts is that it plays a role in clearing ammonia from the sensillar lymph (Figure S8). Drosophila larval haemolymph contains ∼1 mM ammonia [98], derived from the animal's internal metabolism. Sensillar lymph may also contain ammonia from the fly's metabolism, and in addition is exposed to volatile ammonia from the fly's environment. Ammonium levels in Drosophila culture vials have been measured at ∼20–30 mM [98], [99], primarily from the microbial ammonification of waste products. Although a low concentration of ammonia in sensillar lymph may be inconsequential to the function of most sensilla, it may interfere with the sensitive detection of ammonia by the IR92a-expressing ORN in ac1 sensilla. Amt may be necessary, in non-cell autonomous fashion, to lower basal concentrations of ammonia in ac1 to allow this ORN to detect transient volatile ammonia stimuli in the fly's environment (Figure S8A). In an Amt mutant, the ammonia concentration in the lymph would be higher than in wild type and could lead to tonic adaptation of IR92a or the ORNs that express it (Figure S8B). There is precedent for such adaptation. Low micromolar concentrations of agonist desensitize some types of ionotropic receptors, including vertebrate glutamate receptors that are related to the IRs [100], and inhibition of a GABA transporter leads to reduced GABA-mediated currents at a vertebrate synapse due to such desensitization [101]. Thus, tonic adaptation could explain the inability of the Amt mutant to respond to ammonia, except at the highest concentration tested, and may also explain the low spontaneous firing rate observed in sensilla of the AMT mutant.
Auxiliary cells and their contributions to an olfactory circuit
Many studies of sensory coding consider the neural circuit in isolation. In olfaction, most research has focused on the responses of ORNs and how the odor representations produced by ORNs are successively transformed at higher levels of the olfactory circuit. However, sensory neurons function in complex tissues that can influence their activity profoundly.
Auxiliary cells surrounding insect ORNs produce two classes of proteins that are thought to contribute to olfactory coding: OBPs and ODEs. These proteins have been identified in many insects, their expression has been studied, and in many cases they have been shown to bind or degrade odorants in vitro [20], [21]. Genetic demonstrations of their roles in olfaction in vivo have been sparse; however, in Drosophila, mutants of the OBP Lush show reduced responses of trichoid sensilla to the pheromone 11-cis-vaccenyl acetate [45], and mutants of the ODE Est-6 show prolonged decay kinetics in response to this pheromone [102].
Our study demonstrates in vivo a role for a third class of protein in auxiliary cells: transporters. We have shown through genetic analysis that a transporter, Amt, makes a profound contribution to ammonia sensing by ac1 ORNs. Our transcriptional profile of the antenna identified many genes that are described by the term “transporter activity”, many of which were reduced more than 4-fold in ato mutants. The Drosophila olfactory system encodes a remarkable number of structurally diverse odorants. It will be interesting to determine whether perception of this rich diversity of odorants depends on a wide diversity of transporters.
Materials and Methods
Drosophila stocks
Canton-S and atonal (ato1/Df(3R)p13) [58] flies were used for RNA sequencing experiments, and Canton-S flies were used for RT-PCR and qRT-PCR. GAL4 drivers, either generated as described below or gifts from R. Benton [5], [15], were crossed to a UAS-mCD8::GFP line [103]. The Amt1 transposon insertion line, P{EPgy2}CG6499[EY21789] (Bloomington Drosophila Stock Center) [72], was outcrossed for ten generations to an isogenized w1118 line [104]; this outcrossing removed a nearby lethal mutation. The outcrossed Amt1 line and the isogenic control line were used for electrophysiology experiments. As indicated in the text, the outcrossed Amt1 line was also crossed to a deficiency line, Df(3R)BSC471 (Bloomington Drosophila Stock Center) [73], a genomic rescue line p[hsc4] (Spyros Artavanis-Tsakonas) [74], or to GAL4 and UAS lines generated as described below.
Transgenic fly generation
To generate GAL4 transgenes, 5′ and 3′ flanking regions were amplified using PfuUltra II Fusion HS DNA Polymerase (Agilent Technologies) from tiling bacterial artificial chromosomes (BACs) corresponding to the reference Drosophila melanogaster genome. 5′ and 3′ flanking regions and GAL4 were cloned in pDONR vectors, and then assembled into the pBGRY destination vector via MultiSite Gateway Pro 3-fragment recombination (Invitrogen). pBGRY, derived from pBPGUw [105], contains a phiC31 attB site, the mini-white gene, and a pair of Su(Hw) insulator elements [106].
Amt-GAL4: The 5′ fragment extended from 11077118 to 11074858 and the 3′ fragment from 11072987 to 11072168 on chromosome 3R.
IR76b-GAL4: The 5′ fragment included 20105430 to 20104538 and the 3′ fragment included 20101957 to 20096450 of chromosome 3L.
IR8a-GAL4: The 5′ fragment spanned from 9131297 to 9130620 and the 3′ fragment from 9126786 to 9126175 of chromosome X.
Antennal cDNA from Canton-S flies and Anopheles gambiae mosquitoes was used to generate UAS-Amt and UAS-AgAmt transgenes respectively. The full-length open reading frames (ORFs) of Drosophila CG6499/Amt (accession number NM_001104330.3) and Anopheles AGAP003989 (accession number XM_318439.3) were amplified with a CAAC Kozak consensus sequence upstream of the start codon and cloned into pDONR vectors. These vectors were recombined into the pBID-UASC-G destination vector [107] using Gateway Cloning (Invitrogen).
Assembled GAL4 and UAS vectors were used to generate Drosophila strains through PhiC31 integration into either attP40 (second chromosome, Amt-Gal4, UAS-Amt, and UAS-AgAmt) or attP2 (third chromosome, IR76b-Gal4 and IR8a-Gal4) landing sites (BestGene Inc.) [108], [109].
RNA isolation and sequencing
The third antennal segments from ∼300 adult Canton-S and ato flies aged 5–12 days after eclosion were carefully hand-dissected from the head, and fell immediately into 1.5 ml microfuge tubes kept cold in liquid nitrogen. Three independent biological replicates were collected per genotype, ∼900 total flies. Antennae were mechanically crushed with disposable RNAse-free plastic pestles and a QIAshredder column (QIAGEN), and total RNA was harvested using an RNeasy Mini Kit (QIAGEN). Total RNA (∼0.5 µg/sample) was provided to the Yale Keck Biotechnology Resource Laboratory. There, polyA+ RNA was selected and fragmented, and samples were prepared for single-end mRNA sequencing (RNA-Seq) with standard protocols, and cDNA libraries from each sample were sequenced with an Illumina Genome Analyzer II running pipeline version 1.3.2 to generate 37 bp reads. Total reads reported were those that passed the associated quality controls.
RNA-Seq data processing and analysis
Illumina's ELAND program was used to align trimmed 35 bp reads to the Drosophila reference genome (BDGP Release 5), omitting ArmUextra as this consists of degenerate sequences not incorporated into the genome assembly [110]. The program was configured to allow up to two mismatches per read. Reads that did not align to the genome were also aligned to an mRNA splice junction set (see below, Dataset S1, “by splice”). Per sample, 84–92% of total reads were uniquely aligned to either the genome or the splice junction set, for a total of ∼4.3 to 7.6 million aligned reads per sample (Table S1).
The 14,078 non-redundant annotated genes in FlyBase Genes release 5.12 (Oct. 2008) were used for gene expression analysis using Illumina's CASAVA program (version 1.0). This gene annotation dataset was also used to generate the splice junction set used for read alignment. Aligned reads were mapped to gene exons based on their genomic positions (Dataset S1, “by exon”). Genome positions associated with multiple genes in the annotation set were considered ambiguous and not analyzed. The exon and splice junction reads mapped to a given gene were summed to determine its expression (Dataset S1, “by gene”). Each gene's expression was then normalized by the total mapped reads in that lane to generate the reads per million reads mapped (RPM) value. Gene expression similarity between samples was visualized with hierarchical cluster analysis of all 14,078 genes using Ward's method using a function in R (version 3.0.1) [111]. Genes were defined as “CS-expressed” or “ato-expressed” if they were detected at >1 RPM in all three samples from the same genotype. Gene expression was further normalized by its gene length to generate the Reads Per Kilobase per Million reads mapped (RPKM) value and averaged by genotype (n = 3 each, CS and ato, Dataset S1, “by gene”).
We note that the standard gene symbols for some genes changed after our initial data collection and analysis. Thus the original symbols for the mapped genes are found in Dataset S1, but we have also included the current gene symbols and FBgn numbers in the “by gene” and “differential expression” worksheets. For some genes, exon structures have been reannotated and some exons reassigned since our original data collection and analysis, and thus there are likely to be some small discrepancies between the annotations used in Dataset S1 and current annotations. Additionally, some genes have been withdrawn from the current annotation set, but are still listed in Dataset S1. The current gene names are used in the main text and figures.
Differential expression analysis
Statistical analysis of differential gene expression was carried out with the EdgeR package (3.2.3) [112]. Differential expression analysis was performed on the 9,034 genes detected at >1 RPM in at least 3 of the 6 total samples. EdgeR uses the raw read counts for each gene and normalizes each sample for differences in sequencing depth and compositional bias. Dispersion is estimated using the quantile-adjusted conditional maximum likelihood method, and differential gene expression between groups (here, CS versus ato) is tested using an exact test, based on read counts obeying a negative binomial distribution [112]. See the EdgeR User's Guide for further details (www.bioconductor.org). The p-value and false discovery rate (FDR) for each gene are reported in Dataset S1, “differential expression”. We considered genes to be differentially expressed if they had a FDR <0.01. The average expression across all six samples, log2(RPM), and the fold-change, log2(RPMato-avg/RPMCS-avg), both based on the EdgeR normalized samples, is also reported in Dataset S1, “differential expression”.
We note that EdgeR moderates each of the raw read counts by adding a very small value (prior.count) to each one, thereby avoiding undefined fold-changes such as when one group has zero reads (for example log2(0/RPMCS-avg)). This process creates the diagonal “line” of red dots seen in Figure 2C, a plot of log2(RPM) versus log2(RPMato-avg/RPMCS-avg). An explanation of why this occurs can be seen in the following example for genes with zero reads in all three ato fly samples and at least a moderate number of reads in CS flies:
-
The average expression across all samples, RPM is equal to (RPMCS-avg + RPMato-avg)/2. After addition of prior.count to each sample, RPMato-avg is still approximately 0 and much less than RPMCS-avg. Therefore RPM is close to (RPMCS-avg)/2.
-
The x-value in Figure 2C for these genes is thus log2(RPMCS-avg/2) = log2(RPMCS-avg) - 1
-
The log fold-change log2(RPMato-avg/RPMCS-avg) = log2(RPMato-avg) - log2(RPMCS-avg). For all genes with zero reads in ato samples, RPMato-avg will be a fixed constant c based on the prior.count added to each sample.
-
The y-value in Figure 2C, log fold-change, for these genes is thus c - log2(RPMCS-avg).
-
For these genes, their x-values are thus log2(RPMCS-avg)-1 and their y-values are c - log2(RPMCS-avg). Through substitution, the y-values can also be expressed as y = c-1-x, and thus the dots in Figure 2C will fall along the line as a function of their x-value.
Functional annotation of genes
Protein sequences were manually curated using FlyBase (http://www.flybase.org), BLAST (http://www.ncbi.nlm.nih.gov/BLAST), and SMART (http://smart.embl-heidelberg.de). The percentage of level 2 Gene Ontology (GO) terms in each dataset and significantly enriched GO terms were identified using AmiGO version 1.8, GO database release 2013.08.17 [113]. Some gene symbols in the ato-depleted and ato-enriched datasets were renamed according to current gene annotations in order for AmiGO to recognize the gene symbols. Accordingly, the ato-depleted gene CG14586 was divided into IR75b and IR75c, and CG34372 and CG5357 were combined into CG43795.
RT-PCR and quantitative real-time PCR (qRT-PCR)
Tissues from male and female flies aged 5–14 days and 3rd instar larvae were collected for RNA extraction. Heads (∼25), heads with antennae removed (∼25), bodies with legs and heads removed (∼25), antennae (∼200), legs (∼600–900) or whole larvae (∼25) were dissected using forceps and placed immediately into 1.5 ml microfuge tubes kept cold in liquid nitrogen. Tissues were crushed with plastic pestles and a QIAshredder column (QIAGEN), and RNA was harvested using an RNeasy Mini Kit (QIAGEN). An iScript cDNA Synthesis Kit (Bio-Rad) was used to generate cDNA. To control for contamination by genomic DNA, each RNA sample also underwent a parallel mock reverse transcription step in which the reverse transcriptase was omitted.
RT-PCR expression analysis was carried out with GoTaq Flexi (Promega) and a 30 cycle PCR. Amt expression was assayed with primers: CGGTGTTCAGGAAGGAGAAC and TTCCCGGTCTGTATGACCTC. To control for cDNA quality, the presence of synaptotagmin I in each sample was assayed with the primers CGGATCCCTATGTCAAGGTG and TCTGGTCGTGCTTCGAGAAG. IR25a expression was assayed with the primers CAATCCACTCAGCCATTCAA and AGTGGACAATTGCGGCTATC. IR8a expression was assayed with the primers GCTGGAGTGGCATTTCGTAT and GGTAGATGGCCAACGGATAA. All primer sets spanned an intron to distinguish cDNA from genomic DNA.
CS cDNA obtained as described above was used for qRT-PCR in a BioRad iQ5 machine. Each 18 µl reaction containing cDNA generated from 2.5 ng RNA, 1× SsoFast EvaGreen Supermix (Bio-Rad) and 400 nM primers was run in triplicate according to the Supermix protocol. Expression of each gene was normalized to eIF-1A. Transcript-specific Gr primers were designed with Primer-BLAST (NCBI) such that they spanned an exon and amplified 150-250 bp fragments. Negative controls without reverse transcriptase and without RNA were run to exclude genomic contamination and primer-dimer formation. Each reaction was run on 3–4 independent sets of CS antennae.
Primers used were:
eIF-1A: ATCAGCTCCGAGGATGACGC and GCCGAGACAGACGTTCCAGA
Gr64a: AGCCAAGAATTTTGTGGGATTGG and GCATGTTCGCCTAAGGACAAG
Gr64b: CTGGAGCACCTCTTCTTCTGG and ACAGTGTTCCACCAAAGCTG
Gr64c: AATGCAGATGCGATTCCAGC and GTTGCCCTTGGATTGAAAGC
Gr64d: ACCATAGTTTTCAGGTCAAAGGA and AAACGACCCAGTTCATCGCA
Gr64e: AAGCCATCAAGCCTGTCCTC and CAGGGTCTCCACCGAATCAA
Gr64f: GGCGGTTTCACTGTACTCCTC and ATGGTTCCAGCCACACTCAG
Gr43a: CCCGAGAGTCCCGTAAAACG and GCGGATGCAAACGATGTCAG
Gr66a: AATTCTGCCACAGGATCTCG and CGAAAGTCAAGGTGCTCTGC
Gr61a: CTGGAGGGTCGTCATGTTCC and GGTGAAAATAGCCAACGCCTG
Gr93a: CGATGGGATAAGAGTGTTGAAAC and CCACCTGTAATGCCGAACTG
Gr10a: GGCTGACCAGGGAGATAGAAC and AGAGATCGAACTGCACCAGAG
Gr63a: AAGCCGAGTGTTTTCTACCG and CCTACATAGCACGCCAGG
Gr21a: TCTACCCACTCACCTGGTCG and TTGCAGTTGATGTACCACAAGC
Gr28b: ACATTGTATTTCACGATCAGCG and CCTTCGATTTCCATCCCCCAT
Whole-mount imaging
7 day old male and female attP40{Amt-Gal4}; UAS-mCD8::GFP flies were frozen with liquid nitrogen and their antennae dissected into a solution of 0.5× PBS, 0.1% Tween-20, and 50% glycerol. After soaking for at least 5 minutes, antennae were transferred to glass slides and imaged within a few hours. Confocal stacks were acquired at 40× on a Zeiss LSM510 confocal microscope and processed using NIH ImageJ (version 1.44o).
RNA probe synthesis for in situ hybridization
The Amt coding region was amplified from CS antennal cDNA and cloned into the pGEM-T Easy vector (Invitrogen) for transcription. Digoxigenin (DIG) labeled probes for Amt were created using the DIG RNA Labeling Kit (SP6/T7) (Roche) and hydrolyzed for 1 hour in 30 mM Na2CO3, 20 mM NaHCO3 (pH 10.2). The reaction was stopped with 3 M NaOAc, 1% acetic acid (pH6), and then the probe was purified via ethanol precipitation, solubilized in DEPC H2O, and stored at -80°C. The mCD8::GFP probe was created similarly but from the pBS mCD8::GFP plasmid [103] using T3 polymerase and Fluorescein (FITC) labeled UTP (Roche). The Obp84a FITC probe was created similarly, but was not hydrolyzed, and was instead purified with the RNEasy Cleanup Kit (QIAGEN).
In situ hybridization and immunohistochemistry
7 day old flies were anesthetized, placed in a collar, covered with OCT (Tissue-Tek), and frozen on dry ice. 14 µm antennal sections were collected on slides and fixed for 10 minutes in 4% formaldehyde in PBS. All steps were performed at room temperature unless otherwise noted. Sections were washed 3×3 minutes in PBS, acetylated for 10 minutes (0.925 g triethanolamine HCl, 112 µl NaOH, and 125 µl acetic anhydride in 50 ml DEPC H2O), washed 3×5 minutes in PBS, and prehybridized for 1 hour at 65°C in Hybridization Buffer (HB) (50% formamide, 5× SSC, 50 µg/ml heparin, and 0.1% Tween-20). DIG and/or FITC labeled probes were diluted to 500 ng/ml in HB and applied to sections, which were then covered with hybrislips (Sigma-Aldrich) and incubated in a humidified chamber for 18–20 hours at 65°C. Hybrislips were removed by soaking slides in 5× SSC at 65°C, then sections were washed 3×20 minutes in 0.2× SSC at 65°C. Sections were incubated for 10 minutes in TN (100 mM Tris-HCl, pH 7.5, 150 mM NaCl), then for 30 min in TNB (TN plus 1% Blocking Reagent (Roche)). Anti-DIG-POD (Roche) was diluted 1∶500 in TNB and applied to slides for 30 minutes. After washing with agitation 3×5 minutes in TNT (TN plus 0.05% Tween-20), sections were incubated with Cy3-tyramide diluted 1∶50 in amplification reagent (TSA kit, Perkin Elmer) for 10 minutes. For double-label in situ hybridizations, sections were then washed with agitation 3×5 minutes in TNT, incubated for 30 minutes in 3% H2O2-TNT, washed with agitation 3×5 minutes in TNT, blocked for 30 minutes in TNB, incubated for 30 min with anti-FITC-POD (Roche) at 1∶500 in TNB, washed with agitation 3×5 minutes in TNT, and incubated with 1∶50 Cy5-tyramide in amplification reagent (TSA kit, Perkin Elmer). All sections were washed with agitation 3×5 minutes in PBST (PBS plus 0.1% Tween-20), blocked for 30 minutes in 1% BSA-PBST, then incubated overnight at 4°C with mouse anti-GFP (Roche) diluted 1∶500 in 1% BSA-PBST. Sections were washed 3×5 minutes in PBST, then incubated for 2 hours with Alexa Fluor 488 donkey anti-mouse antibody (Invitrogen) diluted 1∶500 in 1% BSA-PBST. Sections were washed 2×10 minutes in PBST and mounted in Vectashield. All microscopy was performed using a Zeiss LSM 510 Laser Scanning Confocal Microscope, and images were processed with ImageJ software.
Electrophysiology
Female flies, 5 days after eclosion, were used for single-sensillum recordings essentially as described [114]. The stabilized antennae and heads of mounted flies were visualized with an Olympus BX51WI microscope. A glass capillary electrode filled with sensillum lymph ringer solution [115] was inserted into the base of a coeloconic sensillum, and a reference electrode filled with the same solution was placed in the eye. An Iso-DAM amplifier (World Precision Instruments) was used for extracellular recordings. Filtered AC signals (300–2,000 Hz) were collected and digitized at 5 kHz with a Digidata 1322A digitizer and Axoscope 9.2 software (Molecular Devices).
Action potentials were detected and counted offline in a 500 ms response period using AxoGraph × (version 1.31) software. Responses started ∼100 ms after the onset of the stimulus, presumably due to the time odors took to travel to the antennae, and the response period was therefore defined as beginning 100 ms after the beginning of the stimulus period. We summed all spikes from the 2–3 neurons in a given sensillum because of difficulties in sorting spikes in coeloconic sensilla [5], [15]. Responses of an individual sensillum to an odorant were calculated as the change in spike rate relative to its response to the relevant solvent (paraffin oil or water). Responses to solvents alone were generally negligible. Each sensillum was tested with multiple odorants, and no more than three sensilla were analyzed per fly. Spontaneous spikes were counted in the 500 ms prior to the stimulation period of the first odor. Coeloconic sensillar subtypes were found in characteristic regions on the antenna, and were definitively distinguished by their responses to a small set of diagnostic odors [5], [6], [15]. Although Amt1 ac1 sensilla lacked a strong, characteristic response for positive identification, they could be reliably identified by their location, absence of responses to either propanal, which strongly activates ac2 and ac3, or phenethylamine, which strongly activates ac4, and their relatively low spontaneous firing rates.
Statistical significance was assessed with either a Student's t-test, one-way ANOVA, followed by Tukey's post-hoc test, or two-way repeated measures ANOVA followed by Bonferroni's post-hoc test, as appropriate. Values shown are the mean ± SEM.
Odor stimuli
Ammonium hydroxide (28–30%, Sigma) was diluted in molecular biology grade water (Sigma) 1∶3 to generate 10% ammonia. Further serial dilutions were used to generate lower concentrations. Unless indicated otherwise, 0.1% ammonia was used for electrophysiology experiments. Other odorants were of the highest grade available (97% to >99%) and were used at the following dilutions (v/v) in either water: 0.1% 1,4-diaminobutane (Aldrich), 1% pyrrolidine (Fluka), or parrafin oil (Fluka): 1% propanal (Aldrich), 1% phenethylamine (Sigma), 0.001% 1-hexanol (Fluka), and 1% 2-oxovaleric acid (Fluka).
Odorant stimuli were prepared and delivered essentially as described previously [9], [114]. Odor stimuli cartridges were prepared by inserting a 0.5 inch diameter filter disk containing 50 µl of diluted odorant into a Pasteur pipette and capping the end with a 1 ml pipette tip. Cartridges were allowed to equilibrate for at least 20 minutes before use and were used no more than four times. Stimuli were presented by placing the tip of the cartridge through a hole in a glass tube carrying a humidified air stream (2,000 ml/min) directed at the fly and administering a 500 ms pulse of air (∼600 ml/min) through the cartridge.
Supporting Information
Zdroje
1. CareyAF, CarlsonJR (2011) Insect olfaction from model systems to disease control. Proc Natl Acad Sci U S A 108 : 12987–12995.
2. van der Goes van NatersW, CarlsonJR (2006) Insects as chemosensors of humans and crops. Nature 444 : 302–307.
3. ShanbhagS, MullerB, SteinbrechtA (1999) Atlas of olfactory organs of Drosophila melanogaster. 1. Types, external organization, innervation and distribution of olfactory sensilla. Int J Insect Morphol Embryol 28 : 377–397.
4. StockerRF (1994) The organization of the chemosensory system in Drosophila melanogaster: a review. Cell Tissue Res 275 : 3–26.
5. SilberingAF, RytzR, GrosjeanY, AbuinL, RamdyaP, et al. (2011) Complementary function and integrated wiring of the evolutionarily distinct Drosophila olfactory subsystems. J Neurosci 31 : 13357–13375.
6. YaoCA, IgnellR, CarlsonJR (2005) Chemosensory coding by neurons in the coeloconic sensilla of the Drosophila antenna. J Neurosci 25 : 8359–8367.
7. van der Goes van NatersW, CarlsonJR (2007) Receptors and neurons for fly odors in Drosophila. Curr Biol 17 : 606–612.
8. de BruyneM, FosterK, CarlsonJR (2001) Odor coding in the Drosophila antenna. Neuron 30 : 537–552.
9. HallemEA, HoMG, CarlsonJR (2004) The molecular basis of odor coding in the Drosophila antenna. Cell 117 : 965–979.
10. FishilevichE, VosshallLB (2005) Genetic and functional subdivision of the Drosophila antennal lobe. Curr Biol 15 : 1548–1553.
11. CoutoA, AleniusM, DicksonBJ (2005) Molecular, anatomical, and functional organization of the Drosophila olfactory system. Curr Biol 15 : 1535–1547.
12. LarssonMC, DomingosAI, JonesWD, ChiappeME, AmreinH, et al. (2004) Or83b encodes a broadly expressed odorant receptor essential for Drosophila olfaction. Neuron 43 : 703–714.
13. AbuinL, BargetonB, UlbrichMH, IsacoffEY, KellenbergerS, et al. (2011) Functional architecture of olfactory ionotropic glutamate receptors. Neuron 69 : 44–60.
14. CrosetV, RytzR, CumminsSF, BuddA, BrawandD, et al. (2010) Ancient protostome origin of chemosensory ionotropic glutamate receptors and the evolution of insect taste and olfaction. PLoS Genet 6: e1001064.
15. BentonR, VanniceKS, Gomez-DiazC, VosshallLB (2009) Variant Ionotropic Glutamate Receptors as Chemosensory Receptors in Drosophila. Cell 136 : 149–162.
16. QiuYT, van LoonJJA, TakkenW, MeijerinkJ, SmidHM (2006) Olfactory coding in antennal neurons of the malaria mosquito, Anopheles gambiae. Chemical Senses 31 : 845–863.
17. MeijerinkJ, BraksMA, Van LoonJJ (2001) Olfactory receptors on the antennae of the malaria mosquito Anopheles gambiae are sensitive to ammonia and other sweat-borne components. J Insect Physiol 47 : 455–464.
18. SyedZ, LealWS (2009) Acute olfactory response of Culex mosquitoes to a human - and bird-derived attractant. Proc Natl Acad Sci U S A 106 : 18803–18808.
19. ShanbhagSR, MullerB, SteinbrechtRA (2000) Atlas of olfactory organs of Drosophila melanogaster 2. Internal organization and cellular architecture of olfactory sensilla. Arthropod Struct Dev 29 : 211–229.
20. LealWS (2013) Odorant reception in insects: roles of receptors, binding proteins, and degrading enzymes. Annu Rev Entomol 58 : 373–391.
21. Vogt RG (2003) Biochemical diversity of odor detection: OBPs, ODEs, and SNMPs. In: Blomquist GJ, Vogt RG, editors. Insect pheromone biochemistry and molecular biology: the biosynthesis and detection of pheromones and plant volatiles. Amsterdam: Elsevier. pp. 391-445.
22. RutzlerM, ZwiebelLJ (2005) Molecular biology of insect olfaction: recent progress and conceptual models. J Comp Physiol A Neuroethol Sens Neural Behav Physiol 191 : 777–790.
23. GuptaBP, RodriguesV (1997) Atonal is a proneural gene for a subset of olfactory sense organs in Drosophila. Genes Cells 2 : 225–233.
24. VosshallLB, WongAM, AxelR (2000) An olfactory sensory map in the fly brain. Cell 102 : 147–159.
25. ClynePJ, WarrCG, FreemanMR, LessingD, KimJ, et al. (1999) A novel family of divergent seven-transmembrane proteins: candidate odorant receptors in Drosophila. Neuron 22 : 327–338.
26. GoldmanAL, Van der Goes van NatersW, LessingD, WarrCG, CarlsonJR (2005) Coexpression of two functional odor receptors in one neuron. Neuron 45 : 661–666.
27. SenthilanPR, PiepenbrockD, OvezmyradovG, NadrowskiB, BechstedtS, et al. (2012) Drosophila auditory organ genes and genetic hearing defects. Cell 150 : 1042–1054.
28. GaliziaCG, MunchD, StrauchM, NisslerA, MaS (2010) Integrating heterogeneous odor response data into a common response model: A DoOR to the complete olfactome. Chem Senses 35 : 551–563.
29. MarshallB, WarrCG, de BruyneM (2010) Detection of volatile indicators of illicit substances by the olfactory receptors of Drosophila melanogaster. Chem Senses 35 : 613–625.
30. RootCM, SemmelhackJL, WongAM, FloresJ, WangJW (2007) Propagation of olfactory information in Drosophila. Proc Natl Acad Sci U S A 104 : 11826–11831.
31. MiyamotoT, SloneJ, SongX, AmreinH (2012) A fructose receptor functions as a nutrient sensor in the Drosophila brain. Cell 151 : 1113–1125.
32. FreemanEG, WisotskyZ, DahanukarA (2014) Detection of sweet tastants by a conserved group of insect gustatory receptors. Proc Natl Acad Sci U S A 111 : 1598–1603.
33. SatoK, TanakaK, TouharaK (2011) Sugar-regulated cation channel formed by an insect gustatory receptor. Proc Natl Acad Sci U S A 108 : 11680–11685.
34. DahanukarA, LeiYT, KwonJY, CarlsonJR (2007) Two Gr genes underlie sugar reception in Drosophila. Neuron 56 : 503–516.
35. JiaoY, MoonSJ, MontellC (2007) A Drosophila gustatory receptor required for the responses to sucrose, glucose, and maltose identified by mRNA tagging. Proc Natl Acad Sci U S A 104 : 14110–14115.
36. SloneJ, DanielsJ, AmreinH (2007) Sugar receptors in Drosophila. Curr Biol 17 : 1809–1816.
37. JiaoY, MoonSJ, WangX, RenQ, MontellC (2008) Gr64f is required in combination with other gustatory receptors for sugar detection in Drosophila. Curr Biol 18 : 1797–1801.
38. JonesWD, CayirliogluP, KadowIG, VosshallLB (2007) Two chemosensory receptors together mediate carbon dioxide detection in Drosophila. Nature 445 : 86–90.
39. KwonJY, DahanukarA, WeissLA, CarlsonJR (2007) The molecular basis of CO2 reception in Drosophila. Proc Natl Acad Sci U S A 104 : 3574–3578.
40. TauxeGM, MacWilliamD, BoyleSM, GudaT, RayA (2013) Targeting a dual detector of skin and CO2 to modify mosquito host seeking. Cell 155 : 1365–1379.
41. NiL, BronkP, ChangEC, LowellAM, FlamJO, et al. (2013) A gustatory receptor paralogue controls rapid warmth avoidance in Drosophila. Nature 500 : 580–584.
42. LeeY, MoonSJ, MontellC (2009) Multiple gustatory receptors required for the caffeine response in Drosophila. Proc Natl Acad Sci U S A 106 : 4495–4500.
43. MoonSJ, KottgenM, JiaoY, XuH, MontellC (2006) A taste receptor required for the caffeine response in vivo. Curr Biol 16 : 1812–1817.
44. LeeY, KimSH, MontellC (2010) Avoiding DEET through insect gustatory receptors. Neuron 67 : 555–561.
45. XuP, AtkinsonR, JonesDN, SmithDP (2005) Drosophila OBP LUSH is required for activity of pheromone-sensitive neurons. Neuron 45 : 193–200.
46. Hekmat-ScafeDS, ScafeCR, McKinneyAJ, TanouyeMA (2002) Genome-wide analysis of the odorant-binding protein gene family in Drosophila melanogaster. Genome Res 12 : 1357–1369.
47. GalindoK, SmithDP (2001) A large family of divergent Drosophila odorant-binding proteins expressed in gustatory and olfactory sensilla. Genetics 159 : 1059–1072.
48. ZhouJJ, HuangW, ZhangGA, PickettJA, FieldLM (2004) "Plus-C" odorant-binding protein genes in two Drosophila species and the malaria mosquito Anopheles gambiae. Gene 327 : 117–129.
49. CameronP, HiroiM, NgaiJ, ScottK (2010) The molecular basis for water taste in Drosophila. Nature 465 : 91–95.
50. DamannN, VoetsT, NiliusB (2008) TRPs in our senses. Curr Biol 18: R880–889.
51. Al-AnziB, TraceyWDJr, BenzerS (2006) Response of Drosophila to wasabi is mediated by painless, the fly homolog of mammalian TRPA1/ANKTM1. Curr Biol 16 : 1034–1040.
52. KwonY, KimSH, RonderosDS, LeeY, AkitakeB, et al. (2010) Drosophila TRPA1 channel is required to avoid the naturally occurring insect repellent citronellal. Curr Biol 20 : 1672–1678.
53. BadshaF, KainP, PrabhakarS, SundaramS, PadinjatR, et al. (2012) Mutants in Drosophila TRPC channels reduce olfactory sensitivity to carbon dioxide. PLoS One 7: e49848.
54. SunY, LiuL, Ben-ShaharY, JacobsJS, EberlDF, et al. (2009) TRPA channels distinguish gravity sensing from hearing in Johnston's organ. Proc Natl Acad Sci U S A 106 : 13606–13611.
55. GallioM, OfstadTA, MacphersonLJ, WangJW, ZukerCS (2011) The coding of temperature in the Drosophila brain. Cell 144 : 614–624.
56. LiuL, LiY, WangR, YinC, DongQ, et al. (2007) Drosophila hygrosensation requires the TRP channels water witch and nanchung. Nature 450 : 294–298.
57. JhaveriD, SenA, RodriguesV (2000) Mechanisms underlying olfactory neuronal connectivity in Drosophila-the atonal lineage organizes the periphery while sensory neurons and glia pattern the olfactory lobe. Dev Biol 226 : 73–87.
58. JarmanAP, GrellEH, AckermanL, JanLY, JanYN (1994) Atonal is the proneural gene for Drosophila photoreceptors. Nature 369 : 398–400.
59. PikielnyCW, HasanG, RouyerF, RosbashM (1994) Members of a family of Drosophila putative odorant-binding proteins are expressed in different subsets of olfactory hairs. Neuron 12 : 35–49.
60. StarostinaE, LiuT, VijayanV, ZhengZ, SiwickiKK, et al. (2012) A Drosophila DEG/ENaC subunit functions specifically in gustatory neurons required for male courtship behavior. J Neurosci 32 : 4665–4674.
61. JarmanA, GrauY, JanL, JanY (1993) atonal is a proneural gene that directs chordotonal organ formation in the Drosophila peripheral nervous system. Cell 73 : 1307–1321.
62. MariniAM, VissersS, UrrestarazuA, AndreB (1994) Cloning and expression of the MEP1 gene encoding an ammonium transporter in Saccharomyces cerevisiae. EMBO J 13 : 3456–3463.
63. NinnemannO, JauniauxJC, FrommerWB (1994) Identification of a high affinity NH4+ transporter from plants. EMBO J 13 : 3464–3471.
64. PengJ, HuangCH (2006) Rh proteins vs Amt proteins: an organismal and phylogenetic perspective on CO2 and NH3 gas channels. Transfus Clin Biol 13 : 85–94.
65. TanejaJG (1997) P.M (1997) Ammonia attracts the haematophagous bug Triatoma infestans: behavioural and neurophysiological data on nymphs. J Comp Physiol A 181 : 21–34.
66. GeierM, BoschOJ, BoeckhJ (1999) Ammonia as an attractive component of host odour for the yellow fever mosquito, Aedes aegypti. Chem Senses 24 : 647–653.
67. BraksMAH, MeijerinkJ, TakkenW (2001) The response of the malaria mosquito, Anopheles gambiae, to two components of human sweat, ammonia and L-lactic acid, in an olfactometer. Physiol Entomol 26 : 142–148.
68. HaggartDA, DavisEE (1980) Ammonia-sensitive neurones on the first tarsi of the tick, Rhipicephalus Sanguineus. J Insect Physiol 26 : 517–523.
69. MinS, AiM, ShinSA, SuhGS (2013) Dedicated olfactory neurons mediating attraction behavior to ammonia and amines in Drosophila. Proc Natl Acad Sci U S A 110: E1321–1329.
70. AltnerH, SassH, AltnerI (1977) Relationship between structure and function of antennal chemo-, hygro-, and thermoreceptive sensilla in Periplaneta americana. Cell Tissue Res 176 : 389–405.
71. HarracaV, IgnellR, LofstedtC, RyneC (2010) Characterization of the antennal olfactory system of the bed bug (Cimex lectularius). Chem Senses 35 : 195–204.
72. BellenHJ, LevisRW, LiaoG, HeY, CarlsonJW, et al. (2004) The BDGP gene disruption project: single transposon insertions associated with 40% of Drosophila genes. Genetics 167 : 761–781.
73. CookRK, ChristensenSJ, DealJA, CoburnRA, DealME, et al. (2012) The generation of chromosomal deletions to provide extensive coverage and subdivision of the Drosophila melanogaster genome. Genome Biol 13: R21.
74. HingHK, BangaloreL, SunX, Artavanis-TsakonasS (1999) Mutations in the heatshock cognate 70 protein (hsc4) modulate Notch signaling. Eur J Cell Biol 78 : 690–697.
75. KaisslingKE (1986) Chemo-electrical transduction in insect olfactory receptors. Ann Rev Neurosci 9 : 121–145.
76. OlsenSR, BhandawatV, WilsonRI (2007) Excitatory interactions between olfactory processing channels in the Drosophila antennal lobe. Neuron 54 : 89–103.
77. RayA, van NatersWG, ShiraiwaT, CarlsonJR (2007) Mechanisms of odor receptor gene choice in Drosophila. Neuron 53 : 353–369.
78. ShiaoM-S, FanW-L, FangS, LuM-YJ, KondoR, et al. (2013) Transcriptional profiling of adult Drosophila antennae by high-throughput sequencing. Zoological Studies 52 : 1–10.
79. SwarupS, WilliamsTI, AnholtRR (2011) Functional dissection of Odorant binding protein genes in Drosophila melanogaster. Genes Brain Behav 10 : 648–657.
80. LiX, SchulerMA, BerenbaumMR (2007) Molecular mechanisms of metabolic resistance to synthetic and natural xenobiotics. Annu Rev Entomol 52 : 231–253.
81. HeydelJM, CoelhoA, ThiebaudN, LegendreA, Le BonAM, et al. (2013) Odorant-binding proteins and xenobiotic metabolizing enzymes: implications in olfactory perireceptor events. Anat Rec (Hoboken) 296 : 1333–1345.
82. LegeaiF, MalpelS, MontagneN, MonsempesC, CousseransF, et al. (2011) An Expressed Sequence Tag collection from the male antennae of the Noctuid moth Spodoptera littoralis: a resource for olfactory and pheromone detection research. BMC Genomics 12 : 86.
83. PittsRJ, RinkerDC, JonesPL, RokasA, ZwiebelLJ (2011) Transcriptome profiling of chemosensory appendages in the malaria vector Anopheles gambiae reveals tissue - and sex-specific signatures of odor coding. BMC Genomics 12 : 271.
84. HovemannBT, SehlmeyerF, MalzJ (1997) Drosophila melanogaster NADPH-cytochrome P450 oxidoreductase: pronounced expression in antennae may be related to odorant clearance. Gene 189 : 213–219.
85. WangQ, HasanG, PikielnyCW (1999) Preferential expression of biotransformation enzymes in the olfactory organs of Drosophila melanogaster, the antennae. J Biol Chem 274 : 10309–10315.
86. Maibeche-CoisneM, NikonovAA, IshidaY, Jacquin-JolyE, LealWS (2004) Pheromone anosmia in a scarab beetle induced by in vivo inhibition of a pheromone-degrading enzyme. Proc Natl Acad Sci U S A 101 : 11459–11464.
87. von Wiren N, Merrick M (2004) Regulation and function of ammonium carriers in bacteria, fungi, and plants. In: Boles E, Kramer R, editors. Molecular Mechanisms Controlling Transmembrane Transport. Berlin: Springer. pp. 95-120.
88. TsayYF, HoCH, ChenHY, LinSH (2011) Integration of nitrogen and potassium signaling. Annu Rev Plant Biol 62 : 207–226.
89. NakhoulNL, Lee HammL (2013) Characteristics of mammalian Rh glycoproteins (SLC42 transporters) and their role in acid-base transport. Mol Aspects Med 34 : 629–637.
90. WeinerID, VerlanderJW (2014) Ammonia transport in the kidney by Rhesus glycoproteins. Am J Physiol Renal Physiol 306: F1107–F1120.
91. WeihrauchD, DoniniA, O'DonnellMJ (2012) Ammonia transport by terrestrial and aquatic insects. J Insect Physiol 58 : 473–487.
92. WuY, ZhengX, ZhangM, HeA, LiZ, et al. (2010) Cloning and functional expression of Rh50-like glycoprotein, a putative ammonia channel, in Aedes albopictus mosquitoes. J Insect Physiol 56 : 1599–1610.
93. WaterhouseRM, TegenfeldtF, LiJ, ZdobnovEM, KriventsevaEV (2013) OrthoDB: a hierarchical catalog of animal, fungal and bacterial orthologs. Nucleic Acids Res 41: D358–365.
94. LealWS, ChooYM, XuP, da SilvaCS, Ueira-VieiraC (2013) Differential expression of olfactory genes in the southern house mosquito and insights into unique odorant receptor gene isoforms. Proc Natl Acad Sci U S A 110 : 18704–18709.
95. MamidalaP, WijeratneAJ, WijeratneS, PolandT, QaziSS, et al. (2013) Identification of odor-processing genes in the emerald ash borer, Agrilus planipennis. PLoS One 8: e56555.
96. LiuY, GuS, ZhangY, GuoY, WangG (2012) Candidate olfaction genes identified within the Helicoverpa armigera Antennal Transcriptome. PLoS One 7: e48260.
97. AiM, BlaisS, ParkJY, MinS, NeubertTA, et al. (2013) Ionotropic glutamate receptors IR64a and IR8a form a functional odorant receptor complex in vivo in Drosophila. J Neurosci 33 : 10741–10749.
98. BrowneA, O'DonnellMJ (2013) Ammonium secretion by Malpighian tubules of Drosophila melanogaster: application of a novel ammonium-selective microelectrode. J Exp Biol 216 : 3818–3827.
99. BorashDJ, GibbsAG, JoshiA, MuellerLD (1998) A genetic polymorphism maintained by natural selection in a temporally varying environment. Am Nat 151 : 148–156.
100. TrussellLO, FischbachGD (1989) Glutamate receptor desensitization and its role in synaptic transmission. Neuron 3 : 209–218.
101. OverstreetLS, JonesMV, WestbrookGL (2000) Slow desensitization regulates the availability of synaptic GABA(A) receptors. J Neurosci 20 : 7914–7921.
102. ChertempsT, FrancoisA, DurandN, RosellG, DekkerT, et al. (2012) A carboxylesterase, Esterase-6, modulates sensory physiological and behavioral response dynamics to pheromone in Drosophila. BMC Biol 10 : 56.
103. LeeT, LuoL (1999) Mosaic analysis with a repressible cell marker for studies of gene function in neuronal morphogenesis. Neuron 22 : 451–461.
104. ThibaultST, SingerMA, MiyazakiWY, MilashB, DompeNA, et al. (2004) A complementary transposon tool kit for Drosophila melanogaster using P and piggyBac. Nat Genet 36 : 283–287.
105. PfeifferBD, JenettA, HammondsAS, NgoTT, MisraS, et al. (2008) Tools for neuroanatomy and neurogenetics in Drosophila. Proc Natl Acad Sci U S A 105 : 9715–9720.
106. KohTW, HeZ, Gorur-ShandilyaS, MenuzK, LarterNK, et al. (2014) The Drosophila IR20a Clade of Ionotropic Receptors Are Candidate Taste and Pheromone Receptors. Neuron 83 : 850–865.
107. WangJW, BeckES, McCabeBD (2012) A modular toolset for recombination transgenesis and neurogenetic analysis of Drosophila. PLoS One 7: e42102.
108. GrothAC, FishM, NusseR, CalosMP (2004) Construction of transgenic Drosophila by using the site-specific integrase from phage phiC31. Genetics 166 : 1775–1782.
109. MarksteinM, PitsouliC, VillaltaC, CelnikerSE, PerrimonN (2008) Exploiting position effects and the gypsy retrovirus insulator to engineer precisely expressed transgenes. Nat Genet 40 : 476–483.
110. SmithCD, ShuS, MungallCJ, KarpenGH (2007) The Release 5.1 annotation of Drosophila melanogaster heterochromatin. Science 316 : 1586–1591.
111. R Core Team (2012) R: A Language and Environment for Statistical Computing. Vienna: R Foundation for Statistical Computing.
112. RobinsonMD, McCarthyDJ, SmythGK (2010) edgeR: a Bioconductor package for differential expression analysis of digital gene expression data. Bioinformatics 26 : 139–140.
113. CarbonS, IrelandA, MungallCJ, ShuS, MarshallB, et al. (2009) AmiGO: online access to ontology and annotation data. Bioinformatics 25 : 288–289.
114. DobritsaAA, van der Goes van NatersW, WarrCG, SteinbrechtRA, CarlsonJR (2003) Integrating the molecular and cellular basis of odor coding in the Drosophila antenna. Neuron 37 : 827–841.
115. Kaissling KE, Thorson J (1980) Insect olfactory sensilla: Structural, chemical and electrical aspects of the functional organization. In: Sattelle DB, Hall LM, Hildebrand JG, editors. Receptors for neurotransmitters, hormones, and pheromones in insects. Amsterdam: Elsevier/North-Holland pp. 261-282.
116. GuY, LucasP, RosparsJP (2009) Computational model of the insect pheromone transduction cascade. PLoS Comput Biol 5: e1000321.
117. DweckHK, EbrahimSA, KromannS, BownD, HillburY, et al. (2013) Olfactory preference for egg laying on citrus substrates in Drosophila. Curr Biol 23 : 2472–2480.
118. RonderosDS, LinCC, PotterCJ, SmithDP (2014) Farnesol-detecting olfactory neurons in Drosophila. J Neurosci 34 : 3959–3968.
Štítky
Genetika Reprodukční medicínaČlánek vyšel v časopise
PLOS Genetics
2014 Číslo 11
- Kazuistika – Perspektivy využití precizované medicíny v rámci personalizované specifické terapie onkologických pacientů
- Nobelova cena za chemii pro genetické nůžky: Objev, který změní naši budoucnost?
- Technologie na bázi RNA v klinické praxi: od přebarvených petúnií k terapii vzácných a dosud jen obtížně léčitelných chorob u lidí
- „Nepředstavovali jsme si, že náš výzkum povede přímo ke vzniku nových léků, dokonce ještě za našeho života“
- Bezplatné služby pro diagnostiku ATTRv amyloidózy pro kardiology
Nejčtenější v tomto čísle
- An RNA-Seq Screen of the Antenna Identifies a Transporter Necessary for Ammonia Detection
- Systematic Comparison of the Effects of Alpha-synuclein Mutations on Its Oligomerization and Aggregation
- Functional Diversity of Carbohydrate-Active Enzymes Enabling a Bacterium to Ferment Plant Biomass
- Regularized Machine Learning in the Genetic Prediction of Complex Traits
Zvyšte si kvalifikaci online z pohodlí domova
Mazová zátka a její řešení
nový kurzVšechny kurzy