
The Role of Regulatory Evolution in Maize Domestication
Modification of cis regulatory elements to produce differences in gene expression level, localization, and timing is an important mechanism by which organisms evolve divergent adaptations. To examine gene regulatory change during the domestication of maize from its wild progenitor, teosinte, we assessed allele-specific expression in a collection of maize and teosinte inbreds and their F1 hybrids using three tissues from different developmental stages. Our use of F1 hybrids represents the first study in a domesticated crop and wild progenitor that dissects cis and trans regulatory effects to examine characteristics of genes under various cis and trans regulatory regimes. We find evidence for consistent cis regulatory divergence that differentiates maize from teosinte in approximately 4% of genes. These genes are significantly correlated with genes under selection during domestication and crop improvement, suggesting an important role for cis regulatory elements in maize evolution. This work provides valuable insight into the evolution of gene regulatory elements during the domestication of an important crop plant.
Published in the journal:
. PLoS Genet 10(11): e32767. doi:10.1371/journal.pgen.1004745
Category:
Research Article
doi:
https://doi.org/10.1371/journal.pgen.1004745
Summary
Modification of cis regulatory elements to produce differences in gene expression level, localization, and timing is an important mechanism by which organisms evolve divergent adaptations. To examine gene regulatory change during the domestication of maize from its wild progenitor, teosinte, we assessed allele-specific expression in a collection of maize and teosinte inbreds and their F1 hybrids using three tissues from different developmental stages. Our use of F1 hybrids represents the first study in a domesticated crop and wild progenitor that dissects cis and trans regulatory effects to examine characteristics of genes under various cis and trans regulatory regimes. We find evidence for consistent cis regulatory divergence that differentiates maize from teosinte in approximately 4% of genes. These genes are significantly correlated with genes under selection during domestication and crop improvement, suggesting an important role for cis regulatory elements in maize evolution. This work provides valuable insight into the evolution of gene regulatory elements during the domestication of an important crop plant.
Introduction
Changes in the cis regulatory elements (CREs) of genes with functionally conserved proteins have been considered a key mechanism, if not the primary mechanism, by which the diverse forms of multicellular eukaryotic organisms evolved [1]–[3]. Variation in CREs allows for the deployment of tissue specific patterning of gene expression, differences in developmental timing of expression, and variation in the quantitative levels of gene expression. Furthermore, modification of CREs, as opposed to coding sequence changes, are assumed to have less pleiotropy and consequently have a lower risk of unintended deleterious effects in secondary tissues. The importance of CREs for the development of novel morphologies is supported by the growing catalog of examples for which differences in gene specific CREs between closely related species contributed to the evolution of diversity in form [4].
While compelling evidence for the importance of CREs in evolution has come from mapping causative variants to CREs, additional evidence has emerged from genomic analyses that show abundant cis regulatory variation both within [5]–[8] and between species [9]–[11]. Some studies have reported a bias such that genes with cis differences between species or ecotypes show preferential up-regulation of the alleles of one parent, possibly as a result of natural selection [7], [11], [12]. Consistent with the hypothesis that cis differences are a key element of adaptive evolution, divergence for cis regulation between yeast species is more often associated with positive selection than trans divergence [10], [13].
Crop plants offer a powerful system for the investigation of evolutionary mechanisms because they display considerable divergence in form from their wild progenitors, yet exhibit complete cross-fertility with these progenitors [14]–[16]. QTL fine-mapping experiments have provided multiple examples of modified CREs that underlie trait divergence between crops and their ancestors. These studies include examples in which cis changes confer the up-regulation of a gene during domestication [17], the down-regulation of a gene [18], [19], the loss of a tissue specific expression pattern [20], the gain of a tissue specific expression pattern [21], and a heterochronic shift in the expression profile [22]. These diverse modifications suggest that changes in CREs offer a powerful means to fine-tune gene expression to generate new plant morphologies.
Several transcriptional profiles contrasting crops and their ancestors have been performed, although the experimental designs used did not allow separation of cis and trans effects. These studies have shown that hundreds or even thousands of genes have altered expression in crops as compared to their progenitors and that genes with altered expression often show evidence for selection [23]–[25]. The data suggest massive alterations in gene expression profiles accompanied domestication. Work in cotton and maize shows a more frequent up-regulation of genes in the crop as compared to the wild ancestor, however whether this was due to cis or trans effects was not discernible [23], [24].
In this study, we used RNAseq to parse genome-wide expression differences between maize and its progenitor, teosinte (Zea mays ssp. parviglumis), into cis and trans effects. Three tissue types were assayed: immature ear, seedling leaf, and seedling stem. Approximately 70% of the 17,000 genes assayed show evidence of regulatory divergence between maize and teosinte. Over 1,000 genes show cis divergence that is highly consistent across our sampled maize and teosinte lines. For ∼70% of genes with consistent cis effects, the cis effects are specific to a single tissue type. The number of genes with cis differences is greatest for the ear, which underwent a profound transformation in form during domestication. Genes with cis regulatory differences between maize and teosinte are correlated with genes that show evidence for positive selection during domestication while trans genes are not. Maize also possesses less cis regulatory variation than teosinte over all genes and this deficit in maize is greatest for genes with cis regulatory divergence from teosinte. We observed a directional bias in genes with cis differences such that maize alleles were more frequently up-regulated than teosinte. Finally, our data provide a catalog of cis and trans regulatory variation for over 17,000 genes in three tissue types for 15 maize and teosinte inbred lines.
Results
RNAseq provides expression data for more than 17,000 genes in three tissues
RNAseq data for seedling leaf, seedling stem (including the shoot apical meristem), and immature ear from six maize inbreds, nine teosinte inbreds, and 29 of their F1 hybrids were used to examine variation in gene expression on a genome-wide scale. In total, 259 RNAseq libraries were constructed from an average of 1.96 biological replicates for each parent inbred and F1.
Overall, 996 million, 1.13 billion, and 1.21 billion F1 hybrid and 286 million, 283 million, and 276 million parent RNAseq reads were collected for ear, leaf, and stem tissue types, respectively (Table 1). These reads were aligned to custom-made parent specific pseudo-transcriptomes containing an average of 54,000 segregating sites (SNPs or small indels) in each of the 29 maize-teosinte contrasts. For F1 hybrid reads, 556 million, 672 million, and 716 million reads mapped to pseudo-transcriptomes in ear, leaf, and stem tissue, respectively. In parent inbred lines, 171 million, 170 million, and 163 million reads mapped to the pseudo-transcriptomes (Table 1). Thus, approximately the same percentage of reads (58.2% and 59.6%) mapped to pseudo-transcriptomes in both the F1 hybrids and parent datasets with about 7.15% of the total reads mapping to segregating sites in the individual F1 hybrids and their parents.

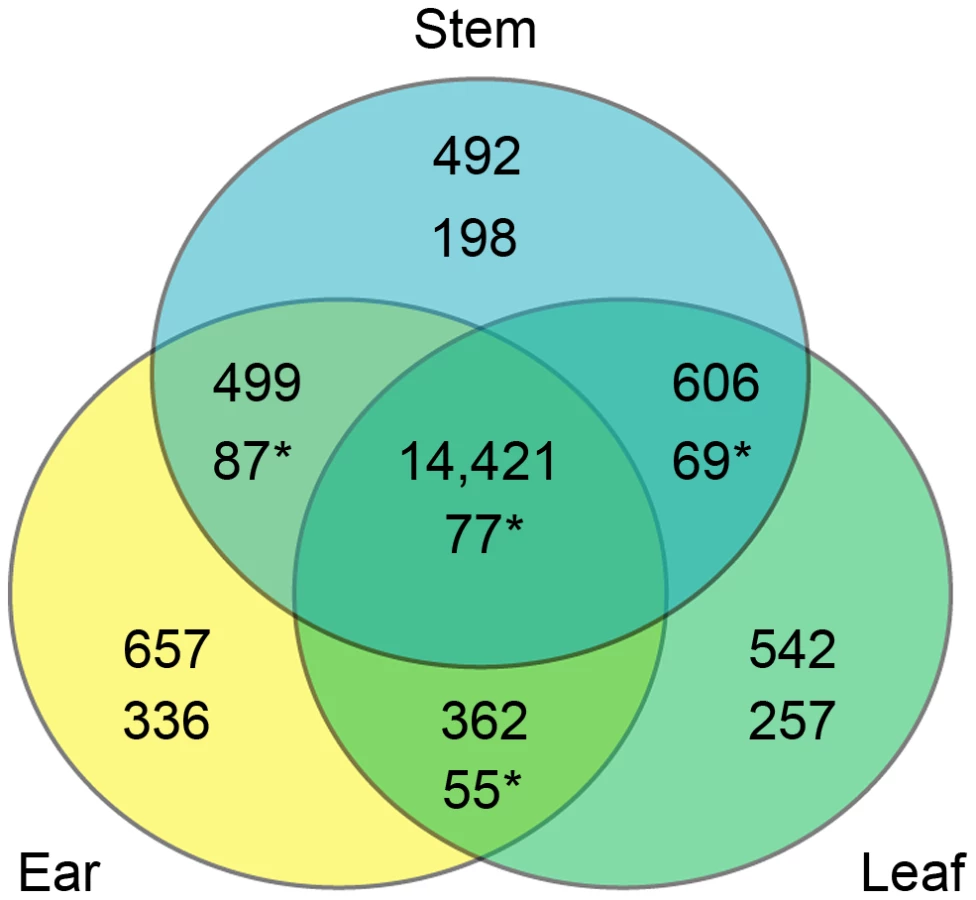
RNAseq reads for all 29 F1 hybrids and 15 parents that aligned to segregating sites in the transcriptomes represent 23,816, 24,055, and 24,643 genes for ear, leaf and stem tissues, respectively (Table 2). The union of these three groups is 25,619 genes, which is 65% of the 39,423 genes from the maize filtered gene set (version 5b). We applied a filter to this list, requiring a read depth of 100 in both the parent inbreds and F1 hybrids. This filter reduced the lists to 15,939, 15,931, and 16,018 genes in ear, leaf, and stem tissues, respectively. The union of these three groups is 17,579 genes or ∼45% of the filtered gene set. There is a large degree of overlap among the genes expressed in the three tissues with 14,421 of 17,579 genes (82%) seen in all three tissues. Of the remaining genes, 1,467 are in two tissues and 1,691 are in only a single tissue (Figure 1).

Prolific regulatory variation but few consistent cis differences
We measured cis regulatory effects as log2 of the ratio of maize to teosinte read counts in F1 hybrids, and the trans effects as the difference between the F1 and parent log2 ratios. Binomial and Fisher's exact tests were used to determine whether these ratios deviated from 1∶1 and to assign genes to one of seven regulatory categories (Table 3; see Materials and Methods). In overall maize versus teosinte comparisons, about 70% of genes (69.27% ear, 74.21% leaf, and 63.82% stem genes) from the three tissues were classified as having significant cis and/or trans regulatory effects (Figure 2, Figure S1). The remaining genes were classified as having conserved (18.6%, 15.5%, and 20.7%) or ambiguous (12.1%, 10.2%, and 15.5%) expression patterns. All three tissues had similar proportions of genes falling into the different regulatory categories in the overall maize-teosinte comparison (Figure 2, Figure S1).


We asked what proportion of regulatory divergence between maize and teosinte was due to cis effects by calculating the ratio: |cis|/(|cis|+|trans|) [11]. Overall, cis effects account for 45%, 42% and 47% of regulatory divergence for ear, leaf and stem tissue, respectively (Table S1). We further asked the relative contribution of cis and trans in generating large expression differences by binning genes based on the magnitude of overall expression difference (|log2 parent ratio|). This analysis shows that the proportion of divergence due to cis is greater with greater total divergence in expression (Figure 3). At high degrees of expression divergence between maize and teosinte (log2 change of 5 or more), over 75% of divergence is due to cis. Thus, large expression differences appear to be caused primarily through difference in cis regulation as opposed to trans.

A primary goal in this study was to identify genes with cis regulatory differences between maize and teosinte. Such genes in the cis only or cis plus trans regulatory categories (CCT genes) are candidates for direct targets of selection during maize domestication or improvement for altered gene expression. We identified 5,618 ear, 5,398 leaf and 5,435 stem CCT genes in the overall analysis (Table 2). To exclude CCT genes with little data, the list was filtered to include only genes assayed in at least 15 maize-teosinte F1s involving at least three maize and five teosinte inbred lines. This filtering resulted in 4,770 ear, 4,494 leaf, and 4,601 stem CCT genes (union of 8,396 genes). Next, we asked if genes on the filtered CCT list consistently favor expression of maize or teosinte alleles in the individual F1 hybrids. The goal was to exclude CCT genes for which the significant overall cis effect was caused by a large expression bias in one or a few F1 crosses. We defined three levels of consistency: groups A, B and C for which 100%, 90% and 80% of F1s showed the same directionality, respectively. Groups A, B, and C genes combined across tissues contained 69, 1,042, and 2,326 genes respectively (Table 2). Thus, relatively few of the 8,396 filtered CCT genes show a significant overall cis effect that is highly consistent among 15 or more F1 hybrids.
Possible directional bias in cis evolution
Visual examination of Figure 1 shows a greater density of cis genes (black points) with positive log2 hybrid expression ratios than with negative ratios, suggesting cis evolution during domestication more often favored alleles with increased expression in maize relative to teosinte. Consistent with this visual observation, the number of CCT (ABC list) genes with a positive (maize biased) versus negative (teosinte biased) log2 hybrid expression ratio are 947∶598, 844∶483 and 826∶545 for ear, leaf and stem, respectively (Table S2). All of these ratios are significantly different from a 50∶50 unbiased expectation (binomial test, p<0.001). Additionally, a plot of the distribution of log2 hybrid expression ratio for CCT genes shows a greater density of genes with positive values for all three tissues (Figure 4, Figure S2).

The apparent bias in directionality of cis evolution could be the result of error in our bioinformatics pipeline. One potential error is preferential alignment of maize RNAseq reads due to greater sequence divergence of teosinte lines from the reference transcriptome (B73) as compared to maize inbred lines. If such systematic error exists, the observed bias in directionality of cis evolution would be expected to be greatest for F1s involving the reference B73 (zero alignment bias of maize reads and high bias for teosinte) and less extreme for crosses between teosinte and non-reference maize lines (moderate bias for non-reference maize and high bias for teosinte).
To test this expectation, we calculated the number of CCT (ABC list) genes with positive versus negative log2 hybrid expression ratios for F1s involving B73 and non-B73 maize parents separately. For ear tissue, there are 569 teosinte-biased and 975 maize-biased genes for B73 F1s and 606 teosinte-biased and 939 maize-biased genes for non-B73 F1s. A Fisher's exact test fails to reject the null hypothesis of equivalent ratios (p = 0.18). There was also no evidence for non-equivalent ratios with the other two tissue types (Table S3). Thus, we see no evidence for significantly greater bias for maize alleles in crosses involving B73 versus the non-reference maize parents, suggesting alignment bias does not explain the excess of CCT genes with the maize allele expressed higher than the teosinte allele.
Gene expression variation is greater in teosinte
Both the domestication bottleneck and selection during domestication are expected to reduce variation in maize as compared to teosinte. We asked if these reductions in variation are apparent in our gene expression data. To quantify whether variation in maize or teosinte was the source of the variation in expression ratios among F1 hybrids, a linear model was fitted on a gene-by-gene basis with maize and teosinte inbred parent as explanatory factors for hybrid expression ratio. Among ∼13,000 genes included in this analysis, the maize parent explains only 85% as much variation as the teosinte parent (Figure 5, Table S4). The reduction is consistent across all seven regulatory categories (Figure S3). This represents the general reduction in diversity of maize as compared to teosinte, presumably a result of the domestication bottleneck.

While the bottleneck predicts reduced expression variation in maize overall, genes that were targets of selection for regulatory differences should have an even greater reduction in expression variation. Consistent with this expectation, we observed a greater reduction in variation in maize as compared to teosinte for CCT genes than the full set of ∼13,000 genes (Figure 5, Table S4). For the CCT-ABC genes, maize contributes 78% of teosinte variation, for the AB group ∼73%, and for the A group only 54% of teosinte variation. Thus, among our strongest cis regulatory candidate genes (A group), the data indicate that maize explains only about half as much of the cis regulatory variation as teosinte.
The reduction in gene expression variation in maize versus teosinte is also seen in the number of individual genes with significant effects due to the maize and/or teosinte parent on the F1 expression ratio (Table S5). In terms of numbers of genes on the AB list CCT genes, there were 2.0 to 2.5 fold more genes for which only the teosinte parent contributed significant variation to the F1 expression ratios than genes for which only the maize parent contributed. This difference is 5-fold in favor of teosinte for CCT genes on the A list.
Selection candidate genes are enriched for CCT genes
We compared CCT genes to putative targets of selection during maize domestication and improvement from a recent study [26]. There is significant enrichment for CCT genes among selection candidate genes for all three tissues (Table 4). The strength of the association with selected genes is strongest for the union of CCT genes from all three tissues. For example, there are 139 CCT-AB genes among the selected genes, while 87.7 would be expected by chance. Also, there were 10 CCT (A-list) genes from stem tissue among selected genes when only 2.16 were expected, a nearly 5-fold enrichment.

XPCLR scores (cross population composite likelihood ratios) quantify the degree of support for positive selection on a genomic region. A comparison of the distributions of ln(XPCLR) scores at the transcriptional start site (calculated by Hufford et al. [26]) for the union of CCT genes (A, AB, and ABC) versus genes with conserved expression between maize and teosinte shows that CCT genes having a higher mean XPCLR than conserved genes (Figure 6). The distribution for conserved genes is significantly different than all three CCT gene lists in terms of shape (Kolmogorov-Smirnov test, p<1.59e-5) and overall mean (t-test, p<5.00e-5). This pattern was also observed for tissue specific comparisons (Figure S4).

A goal of this study was to explore the relative importance of cis versus trans regulatory divergence during maize domestication. To address this question, we examined the evidence for selection on genes with cis only effects in comparison to genes that have trans only effects. Fisher's exact tests on 2×2 contingency tables tabulating cis and trans genes with selection feature genes from Hufford et al. [26] show cis only genes are significantly enriched (p-value<0.05) for selection in 6 of 9 comparisons, while trans only genes are never enriched and are actually significantly underrepresented among selected genes in two cases (Table 5).
![Fisher's exact tests (1 tailed) for enrichment of <i>cis</i> and <i>trans</i> only genes in domestication/improvement selection features defined by Hufford <i>et al.</i> <em class="ref">[26]</em>.](https://pl-master.mdcdn.cz/media/cache/media_object_image_large/media/image/2c1f634187ceb628873a0e00fa305887.png)
Microarray and RNAseq data only partially correspond
We assessed the degree of correspondence between our CCT genes and 612 differentially expressed genes identified by a recent microarray study in maize [24]. We constructed 2×2 contingency tables for differentially expressed (DE) and non-differentially expressed (NDE) genes from the two studies. A Fisher's exact test shows a highly significant degree of correspondence between the two studies for all three tissues (Table 6). Using our CCT-AB lists, ∼24 genes are identified as DE in both studies per tissue while about 7 are expected by chance. However, the absolute level of correspondence between the two studies is rather low. For example, of the 350 leaf genes identified as DE by RNAseq, only 24 (7%) were also identified by the microarray study (Table S6). Thus, while the overlap between our two studies is statistically significant, the two methodologies resulted in largely different lists of DE genes.
![Fisher's exact tests for the overlap between differentially expressed genes from the microarray study <em class="ref">[24]</em> and CCT genes from each of the three experimental tissues in our work.](https://pl-master.mdcdn.cz/media/cache/media_object_image_large/media/image/a415cd21b3159f0e315d6f3961e4c873.png)
The largely different lists of DE genes identified by microarray and RNAseq analysis could be due in part to the fact that the microarray analysis includes genes with trans and cis×trans differences. To assess the proportion of the 612 DE genes from the microarray study that have trans versus cis effects, we examined the RNAseq-based regulatory categories of the ∼250 DE genes (241, 262, 259; ear, leaf, and stem) for which there is both microarray and RNAseq data (Table S7). About 20% of these genes are classified as trans only or cis×trans by RNAseq, while 55% are classified as either cis only or cis+trans. The remaining 25% are classified as conserved, ambiguous or compensatory. These results suggests the very different lists of DE genes from the two technologies can only be explain in part by inclusion of genes with trans only effects in the list of DE genes from the microarray study. Most of the difference between the lists is likely due to differences in tissue, germplasm, environment, sampling error, or other sources of error.
CCT genes are unrelated to differentially methylated regions
In a recent study, Eichten et al. [27] identified differentially methylated regions (DMRs) in maize and teosinte. We compiled a list of the nearest genes both upstream and downstream of each DMR, which gave a list of 332 genes. Of these genes, we have RNAseq data from 115, 116, and 121 for the ear, leaf, and stem tissues, respectively. Of these genes, 19, 13, and 17 genes were on the CCT-ABC gene lists (Table S8). We asked if CCT-ABC list genes are over-represented among the DMR associated genes as compared to random expectation and found that they are not (Fisher's exact test, p>0.10). Finally, DMR methylation does not correspond with the allele specific expression of CCT-ABC list genes with only ∼50% agreement between methylation status and allele expression (Table S9).
Dominant and additive gene expression inheritance
We compared the proportions of genes showing dominant versus additive gene action in the cis only and trans only ABC lists. Dominant gene action of trans only genes will occur when there are haplo-sufficient loss of function (LOF) alleles at their trans regulators. In contrast, the effects of cis regulatory elements are expected to be purely additive in absence of transvection or similar mechanism [28]. Cis only genes classified as having dominant gene action may indicate error in classification due to trans effects below the level of statistical detection. Consistent with the expectation that dominance is more likely for trans only genes, the proportion of genes classified as dominant is higher for trans only genes in all three tissue types (Figure 7, Table S10).

It has been proposed that the allelic variants responsible for evolution during domestication are primarily recessive LOF alleles [29]. Under this model, a non-domesticated allele would be dominant to the recessive LOF domesticated allele. Among cis only genes with dominant gene action, dominance of the maize versus teosinte allele does not differ from the 50∶50 expectation (Figure 7, Table S10). Among trans only genes with dominant gene action, the maize allele is dominant to the teosinte allele more often than expected by chance. These results are counter to the proposal that domestication favored recessive LOF alleles.
Candidate genes enrichment in various functional categories
We examined CCT-ABC genes for enrichment of several functional classes of genes including transcription factors, genes in known metabolic pathways, genes underlying QTL, and gene ontology (GO) groups. First, a list of maize transcription factors and their corresponding families were compiled from the transcription factor database [30]. Although CCT genes (AB-list) were found to be slightly enriched for several transcription factor families (ARF and MADS-MIKC) by Fisher's exact tests, these results do not stand up to Bonferroni multiple test correction (Table S11). We conclude that there is no compelling evidence that CCT genes are enriched for transcription factors.
CCT (AB list) genes were also compared with results from a recent QTL mapping experiment for a number of domestication and improvement traits [31]. We compared observed versus expected overlap between CCT genes from the three tissues to the genes located within 1.5 LOD QTL support intervals for 11 traits. Testing was done on a trait by trait basis and restricted to 1.5 LOD QTL intervals containing 20 or fewer genes. After correction for multiple testing (Bonferroni), no significant enrichment for CCT-AB genes in domestication QTL was observed (Table S12). The greatest enrichment was seen with the trait ear diameter for which there were four CCT genes assayed in ear tissue within the QTL intervals when only 1.22 were expected by chance (Fisher's exact test, p = 0.03).
A test for enrichment of CCT genes and trans only genes in 15 different metabolic pathways defined in the Kyoto Encyclopedia of Genes and Genomes (KEGG) was done using Fisher's exact test on 2×2 contingency tables. There was no compelling evidence for enrichment/depletion of either groups of genes in any of the 15 pathways tested (Table S13). The smallest p-value identified was for the fatty acid degradation pathway in leaf tissue for CCT ABC genes (p = 0.008), however this result does not remain significant after Bonferroni multiple test correction.
We tested for GO term enrichment and depletion in the CCT and trans only gene lists. These analyses found significant GO term associations in the leaf CCT-ABC gene list for depletion for DNA binding (Table S14). For trans only genes, significant enrichment for a number of GO terms in the ear tissue was detected for transcription factor and photosynthesis related terms with additional enrichment for ribosomal GO terms found in the leaf tissue (Table S14).
Discussion
Regulatory differences between maize and teosinte
Approximately 70% of the ∼17,000 assayed genes exhibit some form of regulatory difference between maize and teosinte, suggesting considerable regulatory divergence has occurred during maize domestication and improvement (Figure 2, Figure S1). Similar proportions of gene regulatory differences were observed in recent studies of Drosophila [11] and yeast [13] species. The high amount of expression divergence between maize and teosinte is not surprising given the incredible divergence in their morphology and the exceptional expression variation existing within maize itself. For example, a recent study found 27.9% of maize genes are only expressed in a subset of maize inbred lines with over a thousand genes absent from the reference B73 genome [32].
The high fraction of genes exhibiting regulatory divergence between maize and teosinte should be viewed with this perspective. It includes all genes with specific combinations of significant binomial and Fisher's exact tests as outlined in Table 3. Given the massive amount of data analyzed, statistically significant cis and trans effects were detected for as small as 1.02 fold expression differences, which seem unlikely to have biological significance. Moreover, many genes with significant regulatory differences between maize and teosinte “on average” show diversity in expression within maize and within teosinte such that the favored allele can change depending on the specific pair of maize-teosinte inbred lines.
cis and cis+trans (CCT) candidate genes
Our primary focus was on genes with cis regulatory differences between maize and teosinte as this class of genes should include many direct targets of selection for domestication traits. The overall analysis classifies 8,396 genes (47.8%) as CCT genes that show cis divergence between maize and teosinte. This is a remarkably high proportion that reflects the considerable statistical power to detect small differences, likely with minimal biological importance, and does not consider whether the expression difference is consistent across maize-teosinte F1 comparisons. Thus, we focused our analysis on CCT A, B, and C gene lists showing consistent directionality of expression bias in 100%, 90% and 80% (respectively) of maize-teosinte comparisons. This approach narrows the list to 1,079 genes (A and B lists) that we consider our most robust candidates for genes with cis regulatory differences between maize and teosinte.
Ear tissue possesses the most genes with cis regulatory differences
CCT candidate genes from the three tissues were largely different. Among the 1,079 CCT genes on A and B lists, ∼73% were identified in only a single tissue. This includes 336 ear, 257 leaf, and 198 stem specific genes. In contrast, only 77 of the 1,079 CCT genes were classified as CCT candidates in all three tissues. These results are consistent with previous studies that examined cis regulatory divergence between taxa in multiple tissues [8], [12]. These results highlight the importance of assaying multiple tissues and developmental stages. It also exposes a major weakness of genomic scale expression assays such as ours. Given the complex ways in which gene expression is regulated across different tissue types, genomic-scale assays in one or even multiple tissues are a very blunt instrument for exploring the evolution of gene expression.
While CCT genes are mostly tissue-specific, genes overall are not. Of the 17,579 genes assayed with at least 100 read depth in both the parents and F1 hybrids, 14,421 were expressed in all three tissues. This high proportion of genes (82%) expressed in all tissues creates a false impression that sampling one tissue type at one point in developmental time provides a reasonable assay of all tissues at all developmental times. The discordant observations that CCT genes are mostly tissue specific, while genes overall are expressed in all tissues can be explained by tissue specific enhancers or repressors.
Among the sampled tissues, it is notable that ear has the largest number of overall (555) and tissue specific (336) CCT genes (Figure 1). The greater number of ear CCT genes identified may be related to the profound morphological changes that differentiate the maize and teosinte ear. By comparison, the sampled leaf and stem tissues differ only by size between maize and teosinte and not morphological structure. Similar to our results, an imbalance in number of DE genes in different tissues was also observed in a recent study in Arabidopsis [12], where tissues differed by up to 80% in number of DE genes.
Is there a bias toward increased expression of the maize allele?
In the F1 hybrid analysis, ∼55% of genes have higher maize expression than teosinte. Higher expression of the maize allele also occurs in the parent inbred lines, except for leaf, where an equal number of genes favor maize and teosinte alleles. This trend of up-regulated maize expression extends to the CCT gene lists, where ∼60% of genes favor the maize allele (Figure 4). Preferential expression for one of the parents (maize) is consistent with several previous studies in multiple organisms including maize [24], cotton [23], Arabidopsis [12], Cirsium [7], and fruit fly [11]. While our study mitigates alignment bias with parent specific pseudo-transcriptomes and perfect alignment to segregating sites, this method is unlikely to fully eliminate this bias. Consequently, we cannot exclude the possibility that bias for maize expression is an artifactual result. The mechanism for a general up-regulation of maize alleles across many genes is unclear. One possibility would be a remodeling of the epigenetic landscape during domestication.
cis versus trans regulatory divergence
This study shows cis and trans regulatory differences account for ∼45% and ∼55% of regulatory divergence between maize and teosinte, respectively (Table S1). These values suggest relatively equal contributions of these two mechanisms to regulatory divergence. However, this ignores the contribution of cis effects to large expression differences where cis accounts for nearly 80% of the expression divergence (Figure 3). The observation that cis effects account for the majority of expression divergence of genes with large expression differences was also seen in Drosophila [11]. The prominence of cis effect among genes with the largest divergence in expression may indicate cis regulation is a more effective mechanism than trans for producing large changes in gene expression.
A recent study using microarrays [24] showed greater overlap than expected by chance with CCT candidate genes (Table 6). However, the two studies produced largely different lists of DE genes. One difference between the RNAseq and microarray study is that the latter includes DE of genes with trans only and cis×trans regulatory regimes, which are excluded from RNAseq based CCT lists. This difference offers only a partial explanation for the differences between the two studies. Of 262 microarray DE genes assayed by RNAseq in leaf tissue, RNAseq classifies 31 as trans only and 16 as cis×trans (Table S7). Another 153 genes on the microarray DE list are classified as cis only or cis+trans by RNAseq, leaving 62 genes (24%) for which the two studies disagree. Although much of this disagreement can likely be attributed to factors such as differences in sampling or other sources of error, it reminds us of the imprecision in these types of data.
Regulatory variation was under selection during domestication
During domestication, maize experienced both a population bottleneck that caused a general reduction in genetic diversity as well as selection that further reduced diversity in targeted regions of the genome [33], [34]. A recent genome-wide analysis estimated that the maize genome possess approximately 81% of the nucleotide diversity found in teosinte [26]. Our data allows us to ask whether maize domestication has caused a parallel reduction in cis regulatory variation. Overall, maize possesses only ∼85% of the cis regulatory variation seen in teosinte (Figure 5, Table S4), a value very close to the reduction in nucleotide diversity. Moreover, the observed reduction in cis regulatory variation is greatest for genes that show evidence for cis differences between maize and teosinte. The loss of cis regulatory variation increases over C, B and A lists of CCT genes with CCT A-list genes possessing only ∼50% of the cis regulatory variation seen in teosinte. This trend suggests selection during the domestication process for cis regulatory variation. The high level of expression variation still present in teosinte also represents an untapped source of diversity for maize breeders, which could be explored with transcriptome profiling.
Genomic scans for evidence of selection during adaptive transitions have become a powerful tool in evolutionary biology [35]. Such scans provide both a measure of the prevalence of selection and a list of candidate genes for further study. In comparisons of RNAseq data with a recent genomic selection scan in maize [26], we sought to determine the specific target of selection in terms of cis and trans. If cis regulatory evolution was an important mechanism during maize domestication, then CCT genes should be enriched for selection candidates. In contrast, genes whose expression divergence between maize and teosinte are governed by trans effects should not be enriched for selection candidates, given that the trans regulators and not the trans responsive genes were the putative targets of selection. Consistent with these expectations, we observed a highly significant enrichment for selection candidate genes among CCT and cis only genes with no enrichment among trans only genes (Tables 4, 5).
Although greater than expected overlap was observed between selection candidates and CCT genes, the degree of correspondence is far from perfect. For example, 25 of 36 CCT A-list genes assessed in the genome selection scan from ear tissue do not show evidence for selection. The misalignment between the selection candidate and CCT lists is likely due to both biological factors and artifacts. Domestication genes such as tga1 for which the causative change appears to have been an amino acid change will not appear on CCT gene lists [36]. Similarly, genes with cis differences that were the target of soft sweeps or for which the signature of selection is weak for other reasons are expected to be missed in selection scans. The candidate for the major gene (ZmSh5.1) responsible for the loss of seed shattering during maize domestication is not on the list of selection candidates [26], [37]. These properties of genomic scans remind us of their limits and the probabilistic arguments on which they are based.
Does domestication favor recessive loss of function alleles?
It has been proposed that the allelic variants responsible for evolution during domestication are often recessive LOF alleles such that the wild progenitor allele would be dominant to the domesticated allele [29]. While there is some support for this hypothesis from rice in the form of increased frequency of deleterious amino acid changes [38], recent reviews of QTL studies found no compelling evidence for dominance of the progenitor alleles and few LOF alleles among positionally cloned domestication genes [39], [40]. There is some support that LOFs are relatively common among genes contributing to varietal differences within crops [39], [40].
Dominance is expected to be uncommon for gene expression of cis only genes, since dominance at cis only genes requires a mechanism such as transvection [28] and this is unknown in maize. In absence of mechanisms such as transvection, if a CRE in the progenitor allele of a cis only gene produced 5 RNAseq reads and disruption of the CRE reduced expression to 1 read per allele in the crop, then the diploid progenitor would have 10 reads, the crop would have 2 reads, and their F1 hybrid would have 6 (5+1) reads. The gene would be classified as purely additive. However, for trans only genes, if haplo-sufficient, dominance of the maize or teosinte allele could be observed.
Consistent with the first expectation, we found greater dominance among trans only genes versus cis only genes (Figure 7). The observed dominance effects among the cis only genes may be due to statistical error, trans effects that are below the level of statistical significance, or a molecular mechanism such as transvection. Among trans only genes with dominance, the maize allele is dominant more often than the teosinte allele (Figure 7). This observation fails to support the hypothesis that recessive LOFs were favored during domestication.
GO terms for transcription activities enriched in trans genes
GO term analysis showed genes involved in sequence-specific DNA binding transcription factor activity were enriched in the trans only class (Table S14). These trans only genes are responding to unknown upstream regulators that differ between maize and teosinte. It is the putative upstream regulators and not the trans only genes themselves that are the potential targets of selection during domestication/improvement. This result suggests that transcription factors are frequently downstream in regulatory cascades that were targets of selection during maize domestication and improvement. The identity of the upstream regulators of our trans only genes are unknown but they likely include genes involved in signal transduction, hormonal regulation of gene expression, and other transcription factors. The CCT gene lists are candidates for these unknown regulators of the trans only genes.
A catalog of genes with cis regulatory variants
A product of this study is a resource for researchers looking for preliminary data on the expression patterns of specific genes. To facilitate this use, two supplemental datasets have been made available from the Dryad Digital Repository: http://dx.doi.org/10.5061/dryad.4kh67. Supplemental dataset 1 contains overall data for the complete set of 25,619 genes including regulatory classification, summed RNAseq read counts, expression ratios, and other summary information for each gene. Supplemental dataset 2 contains read counts for F1 hybrid and parent contrasts on a cross-by-cross basis.
An example of the value in these supplemental datasets is barren stalk1 (ba1), a known maize single gene mutant that causes a defect in branch initiation for both the whole plant and tassel [41]. In our study, ba1 was one of our strongest candidates with all assayed crosses showing higher expression of the maize allele in the ear. The overall shift in expression was substantial (∼4-fold) and this shift was caused solely by cis regulatory differences. ba1 was also found to be under selection during maize domestication in two independent studies [26], [41]. These combined observations suggest that selection for a CRE drove up-regulation of ba1 in the ear, perhaps resulting in a greater number of rows (branches) of kernels in the maize ear as compared to teosinte. Compelling evidence for this hypothesis could be obtained by fine-mapping and identifying the hypothesized CRE and demonstrating with expression assays that the maize and teosinte alleles of the CRE have the imagined effects on gene expression during ear development and on phenotype (kernel row number) in the adult ear. ba1 illustrates the power of genomic scans to identify strong candidates for future study that can inform us about the fine details of evolution under domestication.
Materials and Methods
Plant material, RNA preparation, and sequencing
Six maize inbred lines, nine teosinte inbred lines, and 29 of their 54 possible maize-teosinte F1 hybrids were used in this experiment (Table S15). An average of 1.96 biological replicates of each genotype was used. Plants were grown in growth chambers with a 12 hour dark-light cycle for up to 6 weeks, after which they were moved to a greenhouse. Fifty to 100 milligram samples of the immature ear, leaf, and seedling stem were harvested for RNA extraction during this time. Leaf and seedling stem (including the shoot apical meristem) tissue was collected at the v4 leaf stage. Single ears from maize and F1 hybrid plants were collected when the ears weighed 50 to 100 milligrams with silks just beginning to be visible. Teosinte ears were also collected when silks just started to appear, however, due to the small size of teosinte ears 7 to 16 ears (average of 11.27) from each plant were pooled to obtain ∼50 milligrams of tissue. These three tissue types are referred to as the ear, leaf, and stem tissues.
Total RNA was extracted from the plant tissues using a standard TRIzol protocol, quantified by spectrophotometer, and normalized to 1 µg/µL in nuclease free water. Starting with 5 µg total RNA, we generated polyA selected, strand specific, barcoded RNAseq libraries with a previously published protocol using a five minute fragmentation time and 12 PCR amplification cycles [42]. Library adapters used barcode sequences of four and five base pairs (Table S16) designed to balance percent nucleotide composition within the first five base pairs of sequence reads and to have at least two base pair differences from any other barcode. RNAseq libraries were then pooled in groups of 14 (F1s) or 15 (parents), and the pooled libraries sequenced on one lane (parents) or two lanes (F1s) of an Illumina HiSeq2000 sequencer. The raw sequence data has been deposited in NCBI Sequence Read Archive with accessions SRX710894-711341 and the Gene Expression Omnibus (GEO) Series with accession number GSE61810 (http://www.ncbi.nlm.nih.gov/geo/query/acc.cgi?acc=GSE61810).
Bioinformatics
Mitigating mapping bias through use of multiple references or enhancing the reference with segregating sites is critical for allele specific studies [43], [44]. We investigated parent specific de novo transcriptome assemblies using Trinity [45], but ultimately pursued an enhanced reference approach due to poor Trinity assembly qualities (Text S1). The pipeline developed in this study, based on the work by Wang et al. [46], accounts for mapping bias through parent specific pseudo-transcriptomes generated by incorporating polymorphisms derived from non-B73 genomic paired-end reads into the B73 reference followed by alignment and evaluation of RNAseq read depth at segregating sites.
Pseudo-transcriptomes were constructed using the B73 reference genome (version AGPv2) and transcriptome (version ZmB73_5a_WGS) plus ∼403.1 million (17.5× coverage) paired-end genomic sequencing reads from each of the other 14 inbred lines (Table S17). For each of the 14 non-B73 inbreds, paired-end genomic sequencing reads were aligned to the reference genome with the BWA aligner (version 0.5.9) [47]. Only uniquely mapping reads with up to two mismatches were used to limit false polymorphism detection due to paralogous read alignment. Single nucleotide polymorphisms (SNPs) and small insertions and deletions (indels) with respect to B73 were called using the GATK package (version 1.0.5588) [48], [49] and filtered (Text S1) to include only polymorphisms that were homozygous in the inbred with read depth of at least 4×. A strand bias filter was also applied to ensure that the polymorphism was detected on both the plus and minus strand. Polymorphisms surviving these filters were then inserted into the reference B73 transcriptome to make a pseudo-transcriptome for each parent.
For each of the 29 maize-teosinte pairs, a robust set of segregating sites was determined by comparing the pseudo-transcriptomes of the two parents and taking the sites where: the two parental alleles differed, coverage in genomic read alignment was at least four for both parents within the read length (88 bp) of the site, and no heterozygous polymorphisms were detected in genomic read alignments of the two parents within the read length of the site.
RNAseq reads from each F1 hybrid and each corresponding pair of inbred parents were then aligned to the combined pseudo-transcriptomes of the two parents (B73 reference transcriptome used for the B73 parent) using the Bowtie aligner (version 0.12.7) [50]. We assessed allele specific expression by counting read depth from each parent at segregating sites (Table S18). Since only perfect alignments were allowed, assignment of reads to parents was straightforward (a read from a given parent could only align to this parent's allele at a segregating site).
Maize∶teosinte gene expression ratios
We calculated F1 hybrid and parent maize∶teosinte expression ratios for each gene of the 29 individual F1 hybrid comparisons. Total depth at segregating sites summed over genes was highly correlated between biological replicates (average of 95%, Table S19) and consequently read depth was pooled for the various genotypes. Gene expression ratios for F1s (e.g. B73×TIL01) were then calculated by dividing total maize read depth by total teosinte read depth summed over all segregating sites in the gene. The parent expression ratios for individual maize-teosinte comparisons were calculated the same way from parental RNAseq reads, except total parental read depths at segregating sites were corrected for differences in total number of reads between the two parent lines (Text S1). The result of these calculations was a set of 29 matched F1 and parent expression ratios consisting of maize∶teosinte read counts for each gene.
We produced overall maize-teosinte expression ratios for each gene by summing read depth over all maize-teosinte hybrid comparisons. To calculate the overall F1 expression ratio, the maize and teosinte read depths from the F1 hybrids were simply summed over all segregating sites in a gene and across all hybrids. The calculation of the overall parent expression ratio required weighting to avoid counting the parent reads multiple times for each of the F1 comparisons in which it was a parent and to compensate for the fact that different parents had variable total numbers of reads (Text S1). Only genes with a read depth of at least 100 in both the F1 and its parent comparison were included. The result of these calculations was an overall F1 and parent ratio of read counts for each gene. To check whether single F1s caused aberrant estimates of the cis effect with these overall ratios, we performed a drop1 analysis and found that inclusion/excluding of single F1s had on negligible effects (Text S1 and Figure S5). Finally, as a exercise in proof of concept, we compared allele specific expression results for several specific genes of known importance in domestication with expectations from the literature and found a good fit between our data and published results (Text S1 and Table S20).
Testing for cis and trans effects
The combination of F1 hybrid and parent inbred expression data allows estimation of both the cis and trans effects on gene expression. For the F1 hybrids, the maize and teosinte alleles at each gene are in a common trans cellular environment, and thus any deviation of the maize∶teosinte F1 expression ratio from 1∶1 represents purely cis effects. By contrast, the maize∶teosinte parent expression ratio is a combination of the cis and trans effects and any deviation of this ratio from 1∶1 reflects the combined cis plus trans effects. Therefore, the trans effects can be estimated by subtracting the F1 hybrid ratio (cis) from the parent ratio (cis plus trans).
Maize and teosinte gene expression as measured by the read depth counts at genes was used for statistical testing of cis and trans effects. Significant cis and trans effects were determined using binomial and Fisher's exact tests as described in McManus et al. [11]. In brief, two binomial tests were used to identify genes with maize∶teosinte expression ratios significantly different from 1∶1 in the F1 hybrid and parent comparisons. Genes with an expression ratio significantly different from 1∶1 for the F1 hybrid and/or parent comparison were then subjected to a Fisher's exact test to determine if the parent and F1 hybrid maize∶teosinte expression ratios were different from one another. An FDR rate of 0.5% using Storey's q-value [51] was used to compensate for the large number of statistical tests being performed. We investigated a higher FDR cutoff of 5% to include additional genes in downstream analyses, but only observed a minor increase in the number of candidate genes (Text S1, Table S21). The combination of the two binomial tests and Fisher's exact test allowed us to classify each gene into one of seven different regulatory categories (Table 3) as described in McManus et al. [11].
Candidate genes
Genes under selection for expression during maize domestication are expected to show a maize∶teosinte cis expression ratio that is significantly different from 1∶1. These genes can fall into the cis only (C) or cis plus trans (CT) groups on Table 3. We call this combined group CCT genes and these differential expression candidates are the focus of many of our analyses.
The list of CCT genes from the overall test was large (5,618 ear; 5,398 leaf; 5,435 stem) and reflects the considerable statistical power to detect slight overall expression biases for genes with thousands of reads aligning to segregating sites. We observed significant maize∶teosinte expression biases as small as 1.02-fold in the overall tests. Such small differences seem unlikely to have biological importance and genes showing these small differences are weak candidates for genes with cis expression variation that is causal in maize domestication and improvement. Therefore, we applied filters to identify candidates with the strongest and most consistent regulatory differences.
To narrow down the CCT gene list to candidate genes that show the strongest evidence for differential cis regulation between maize and teosinte, we applied two filters. (1) Genes with the strongest evidence for cis differences will fall in the CCT group and have data from a majority of sampled maize and teosinte parents. Thus, we filtered the initial list of CCT genes for those with data from at least fifteen F1 hybrids that include at least three different maize inbreds and five different teosinte inbreds. (2) For genes with cis differences that contributed to maize domestication/improvement, the direction of the expression bias should be highly consistent among the individual F1 hybrids. Consequently, CCT genes were classified for consistency of directionality of expression bias among the F1s with several levels of candidate genes partitioned at 100%, 90% and 80% of F1s showing the same directionality. In calculating these percentages, we used read depth for each F1 at the gene to weight the contribution of the F1s to the overall percentage. We refer to the CCT genes with 100%, 90% and 80% consistent directionality among the F1s as the A-list, B-list and C-list, respectively. For comparative purposes, we made similar A, B and C lists of genes for the cis only or trans only classes. These CCT and cis only gene lists (A, AB, and ABC) were used in downstream analyses in comparison with conserved or trans only genes to explore the role of cis regulatory variation in maize domestication.
Proportion of cis variation in maize and teosinte
CRE diversity within maize and teosinte is expected to display as variation in the F1 hybrid expression ratios. We asked whether cis expression variation among F1 hybrid ratios was more heavily influenced by maize or teosinte inbred parent. Since three teosinte inbreds (TIL05, TIL10, and TIL15) were involved in only a single F1 each, the three F1s involving these inbreds were removed in order to balance the number of maize and teosinte inbred parents for this analysis. Genes were tested for variation among the F1 expression ratios (cis variation) using a linear model on a gene-by-gene basis that fitted the log2(maize∶teosinte) F1 expression ratio to the maize and teosinte parents as independent variables. Significant maize and teosinte parent terms were identified with an F-test (p<0.05) using the R drop1 function. The data for each F1 was weighted by total depth at the gene to account for variable read depth in the F1 hybrids.
Additive and dominant gene expression
Our gene expression dataset consisting of parent inbred and hybrid expression ratios gives the opportunity to address dominant and additive gene expression on a genome-wide scale. We calculated the additive effect, dominant effect, and dominant/additive (D/A) ratio for each gene and maize-teosinte F1 hybrid comparison. The overall maize-teosinte average D/A ratio was then calculated after exclusion of outlier D/A ratios (Figure S6) by iteratively applying the Dixon method [52]. Genes were classified as additive if |D/A|<0.25 and as having dominant gene action if 0.75<|D/A|<1.25. Following calculation of D/A ratios, we examined ratios for cis only and trans only genes for altered degrees of dominance.
CCT gene enrichment in various functional categories
We assessed whether genes in different expression classes (CCT, cis only and trans only) are over or under represented in several functional categories as compared to all genes or genes with conserved expression levels between maize and teosinte. Generally, we tested all CCT gene lists (A, AB, and ABC) with the most weight given to the CCT-AB gene lists, which we consider our best candidates genes. The categories we tested include transcription factors, several metabolic pathways, gene ontology (GO) categories, selection candidates, and domestication QTL. A list of maize transcription factors and their associated families was obtained from the plant transcription factor database [30]. Metabolic enzyme cDNA sequences for starch and lipid metabolism pathways in maize were downloaded from the Kyoto Encyclopedia of Genes and Genomes (KEGG) [53], [54] and matched with genes from the maize filtered gene set (version 5b) by BLAST. Matches (single gene hit with percent identity greater than 95%) were found for 370 out of 379 genes and used to test for enrichment of genes in the various metabolic pathways. Genes under positive selection during maize domestication and improvement were taken from a recent genomic scan for selection [26]. We obtained a list of QTL associated with maize domestication and improvement traits from Table A.1 of a recent QTL analysis [31].
In general, enrichment or depletion of genes in expression classes among various functional categories was tested with Fisher's exact tests on 2×2 contingency tables. For QTL, enrichment of CCT genes among the genes within QTL 1.5 LOD support intervals were tested separately for each trait and only included QTL whose 1.5 LOD support intervals included 20 or fewer genes. For genes under positive selection during domestication and improvement [26], we also tested for a significant difference in the cross population composite likelihood ratio (XPCLR) at the transcription start site between CCT genes (A, AB, and ABC) versus genes with conserved expression using the Kolmogorov-Smirnov and simple t-tests. Finally, GO term enrichment and depletion was tested using the goseq package [55] in R [56] using median gene length to adjust the GO term reference. The base background GO term reference consisted of genes assessed in 15 crosses, three unique maize, and five unique teosinte inbred lines with a cumulative depth of 100 at segregating sites in F1 and parent comparisons. GO terms occurring at least five times in the background reference were tested with p-values corrected for multiple testing using the Benjamini-Hochberg method [57].
Supporting Information
Zdroje
1. CarrollSB (2005) Evolution at two levels: on genes and form. PLoS Biol 3: e245 doi:10.1371/journal.pbio.0030245
2. CarrollSB (2008) Evo-devo and an expanding evolutionary synthesis: a genetic theory of morphological evolution. Cell 134 : 25–36 doi:10.1016/j.cell.2008.06.030
3. WittkoppPJ, KalayG (2012) Cis-regulatory elements: molecular mechanisms and evolutionary processes underlying divergence. Nat Rev Genet 13 : 59–69 doi:10.1038/nrg3095
4. SternDL, OrgogozoV (2008) The loci of evolution: how predictable is genetic evolution? Evolution (N Y) 62 : 2155–2177 doi:10.1111/j.1558-5646.2008.00450.x
5. SpringerNM, StuparRM (2007) Allele-specific expression patterns reveal biases and embryo-specific parent-of-origin effects in hybrid maize. Plant Cell 19 : 2391–2402 doi:10.1105/tpc.107.052258
6. ZhangX, BorevitzJO (2009) Global analysis of allele-specific expression in Arabidopsis thaliana. Genetics 182 : 943–954 doi:10.1534/genetics.109.103499
7. BellGDM, KaneNC, RiesebergLH, AdamsKL (2013) RNA-seq analysis of allele-specific expression, hybrid effects, and regulatory divergence in hybrids compared with their parents from natural populations. Genome Biol Evol 5 : 1309–1323 doi:10.1093/gbe/evt072
8. SongG, GuoZ, LiuZ, ChengQ, QuX, et al. (2013) Global RNA sequencing reveals that genotype-dependent allele-specific expression contributes to differential expression in rice F1 hybrids. BMC Plant Biol 13 : 221 doi:10.1186/1471-2229-13-221
9. TiroshI, ReikhavS, Levy Aa, BarkaiN (2009) A yeast hybrid provides insight into the evolution of gene expression regulation. Science (80-) 324 : 659–662 doi:10.1126/science.1169766
10. EmersonJJ, HsiehL-C, SungH-M, WangT-Y, HuangC-J, et al. (2010) Natural selection on cis and trans regulation in yeasts. Genome Res 20 : 826–836 doi:10.1101/gr.101576.109
11. McManusCJ, CoolonJD, DuffMO, Eipper-MainsJ, GraveleyBR, et al. (2010) Regulatory divergence in Drosophila revealed by mRNA-seq. Genome Res 20 : 816–825 doi:10.1101/gr.102491.109
12. HeF, ZhangX, HuJ, TurckF, DongX, et al. (2012) Genome-wide Analysis of Cis-regulatory Divergence between Species in the Arabidopsis Genus. Mol Biol Evol 29 : 3385–3395 doi:10.1093/molbev/mss146
13. SchaefkeB, EmersonJJ, WangT-Y, LuM-YJ, HsiehL-C, et al. (2013) Inheritance of gene expression level and selective constraints on trans - and cis-regulatory changes in yeast. Mol Biol Evol 30 : 2121–2133 doi:10.1093/molbev/mst114
14. DoebleyJF, GautBS, SmithBD (2006) The molecular genetics of crop domestication. Cell 127 : 1309–1321 doi:10.1016/j.cell.2006.12.006
15. PuruggananMD, FullerDQ (2009) The nature of selection during plant domestication. Nature 457 : 843–848 doi:10.1038/nature07895
16. OlsenKM, WendelJF (2013) A bountiful harvest: genomic insights into crop domestication phenotypes. Annu Rev Plant Biol 64 : 47–70 doi:10.1146/annurev-arplant-050312-120048
17. StuderA, ZhaoQ, Ross-IbarraJ, DoebleyJ (2011) Identification of a functional transposon insertion in the maize domestication gene tb1. Nat Genet 43 : 1160–1163 doi:10.1038/ng.942
18. YangQ, LiZ, LiW, KuL, WangC, et al. (2013) CACTA-like transposable element in ZmCCT attenuated photoperiod sensitivity and accelerated the postdomestication spread of maize. Proc Natl Acad Sci 110 : 16969–16974 doi:10.1073/pnas.1310949110
19. LangZ, WillsDM, LemmonZH, ShannonLM, BukowskiR, et al. (2014) Defining the Role of prolamin-box binding factor1 Gene During Maize Domestication. J Hered doi:10.1093/jhered/esu019
20. KonishiS, IzawaT, LinSY, EbanaK, FukutaY, et al. (2006) An SNP caused loss of seed shattering during rice domestication. Science (80-) 312 : 1392–1396 doi:10.1126/science.1126410
21. WillsDM, WhippleCJ, TakunoS, KurselLE, ShannonLM, et al. (2013) From many, one: genetic control of prolificacy during maize domestication. PLoS Genet 9: e1003604 doi:10.1371/journal.pgen.1003604
22. FraryA, NesbittTC, GrandilloS, KnaapE, CongB, et al. (2000) fw2.2: a quantitative trait locus key to the evolution of tomato fruit size. Science 289 : 85–88 doi:10.1126/science.289.5476.85
23. RappRA, HaiglerCH, FlagelL, HovavRH, UdallJA, et al. (2010) Gene expression in developing fibres of Upland cotton (Gossypium hirsutum L.) was massively altered by domestication. BMC Biol 8 : 139 doi:10.1186/1741-7007-8-139
24. Swanson-WagnerR, BriskineR, SchaeferR, HuffordMB, Ross-IbarraJ, et al. (2012) Reshaping of the maize transcriptome by domestication. Proc Natl Acad Sci 109 : 11878–11883 doi:10.1073/pnas.1201961109
25. KoenigD, Jiménez-GómezJM, KimuraS, FulopD, ChitwoodDH, et al. (2013) Comparative transcriptomics reveals patterns of selection in domesticated and wild tomato. Proc Natl Acad Sci 110: E2655–62 doi:10.1073/pnas.1309606110
26. HuffordMB, XuX, van HeerwaardenJ, PyhäjärviT, ChiaJ-M, et al. (2012) Comparative population genomics of maize domestication and improvement. Nat Genet 44 : 808–811 doi:10.1038/ng.2309
27. EichtenSR, BriskineR, SongJ, LiQ, Swanson-WagnerR, et al. (2013) Epigenetic and genetic influences on DNA methylation variation in maize populations. Plant Cell 25 : 2783–2797 doi:10.1105/tpc.113.114793
28. DuncanIW (2002) Transvection effects in Drosophila. Annu Rev Genet 36 : 521–556 doi:10.1146/annurev.genet.36.060402.100441
29. LesterRN (1989) Evolution under domestication involving disturbance of genic balance. Euphytica 44 : 125–132 doi:10.1007/BF00022606
30. JinJ, ZhangH, KongL, GaoG, LuoJ (2014) PlantTFDB 3.0: a portal for the functional and evolutionary study of plant transcription factors. Nucleic Acids Res 42: D1182–7 doi:10.1093/nar/gkt1016
31. Shannon LM (2012) The Genetic Architecture of Maize Domestication and Range Expansion. Ph.D. dissertation. University of Wisconsin - Madison.
32. HanseyCN, VaillancourtB, SekhonRS, de LeonN, KaepplerSM, et al. (2012) Maize (Zea mays L.) genome diversity as revealed by RNA-sequencing. PLoS One 7: e33071 doi:10.1371/journal.pone.0033071
33. TenaillonMI, U'RenJ, TenaillonO, GautBS (2004) Selection versus demography: a multilocus investigation of the domestication process in maize. Mol Biol Evol 21 : 1214–1225 doi:10.1093/molbev/msh102
34. Eyre-WalkerA, KeightleyPD (2009) Estimating the rate of adaptive molecular evolution in the presence of slightly deleterious mutations and population size change. Mol Biol Evol 26 : 2097–2108 doi:10.1093/molbev/msp119
35. StrasburgJL, ShermanNA, WrightKM, MoyleLC, WillisJH, et al. (2012) What can patterns of differentiation across plant genomes tell us about adaptation and speciation? Philos Trans R Soc Lond B Biol Sci 367 : 364–373 doi:10.1098/rstb.2011.0199
36. WangH, Nussbaum-WaglerT, LiB, ZhaoQ, VigourouxY, et al. (2005) The origin of the naked grains of maize. Nature 436 : 714–719 doi:10.1038/nature03863
37. LinZ, LiX, ShannonLM, YehC-T, WangML, et al. (2012) Parallel domestication of the Shattering1 genes in cereals. Nat Genet 44 : 720–724 doi:10.1038/ng.2281
38. LuJ, TangT, TangH, HuangJ, ShiS, et al. (2006) The accumulation of deleterious mutations in rice genomes: a hypothesis on the cost of domestication. Trends Genet 22 : 126–131 doi:10.1016/j.tig.2006.01.004
39. BurgerJC, ChapmanMA, BurkeJM (2008) Molecular insights into the evolution of crop plants. Am J Bot 95 : 113–122 doi:10.3732/ajb.95.2.113
40. GrossBL, OlsenKM (2010) Genetic perspectives on crop domestication. Trends Plant Sci 15 : 529–537 doi:10.1016/j.tplants.2010.05.008
41. GallavottiA, ZhaoQ, KyozukaJ, MeeleyRB, RitterMK, et al. (2004) The role of barren stalk1 in the architecture of maize. Nature 432 : 630–635 doi:10.1038/nature03148
42. ZhongS, JoungJ, ZhengY, ChenY, LiuB, et al. (2011) High-throughput illumina strand-specific RNA sequencing library preparation. Cold Spring Harb Protoc 2011 : 940–949 doi:10.1101/pdb.prot5652
43. SatyaRV, ZavaljevskiN, ReifmanJ (2012) A new strategy to reduce allelic bias in RNA-Seq readmapping. Nucleic Acids Res 40: e127 doi:10.1093/nar/gks425
44. HuangS, HoltJ, KaoC-Y, McMillanL, WangW (2014) A novel multi-alignment pipeline for high-throughput sequencing data. Database (Oxford) 2014 : 1–12 doi:10.1093/database/bau057
45. GrabherrMG, HaasBJ, YassourM, LevinJZ, ThompsonDA, et al. (2011) Full-length transcriptome assembly from RNA-Seq data without a reference genome. Nat Biotechnol 29 : 644–652 doi:10.1038/nbt.1883
46. WangX, SolowayPD, ClarkAG (2011) A survey for novel imprinted genes in the mouse placenta by mRNA-seq. Genetics 189 : 109–122 doi:10.1534/genetics.111.130088
47. LiH, DurbinR (2009) Fast and accurate short read alignment with Burrows-Wheeler transform. Bioinformatics 25 : 1754–1760 doi:10.1093/bioinformatics/btp324
48. McKennaA, HannaM, BanksE, SivachenkoA, CibulskisK, et al. (2010) The Genome Analysis Toolkit: a MapReduce framework for analyzing next-generation DNA sequencing data. Genome Res 20 : 1297–1303 doi:10.1101/gr.107524.110
49. DePristoMA, BanksE, PoplinR, GarimellaKV, MaguireJR, et al. (2011) A framework for variation discovery and genotyping using next-generation DNA sequencing data. Nat Genet 43 : 491–498 doi:10.1038/ng.806
50. LangmeadB, TrapnellC, PopM, SalzbergSL (2009) Ultrafast and memory-efficient alignment of short DNA sequences to the human genome. Genome Biol 10: R25 doi:10.1186/gb-2009-10-3-r25
51. StoreyJD (2002) A direct approach to false discovery rates. J R Stat Soc Ser B (Statistical Methodol 64 : 479–498 doi:10.1111/1467-9868.00346
52. DeanRB, DixonWJ (1951) Simplified Statistics for Small Numbers of Observations. Anal Chem 23 : 636–638 doi:10.1021/ac60052a025
53. KanehisaM (2000) KEGG: Kyoto Encyclopedia of Genes and Genomes. Nucleic Acids Res 28 : 27–30 doi:10.1093/nar/28.1.27
54. KanehisaM, GotoS, SatoY, FurumichiM, TanabeM (2012) KEGG for integration and interpretation of large-scale molecular data sets. Nucleic Acids Res 40: D109–14 doi:10.1093/nar/gkr988
55. YoungMD, WakefieldMJ, SmythGK, OshlackA (2010) Gene ontology analysis for RNA-seq: accounting for selection bias. Genome Biol 11: R14 doi:10.1186/gb-2010-11-2-r14
56. R Development Core Team (2013) R: A language and environment for statistical computing.
57. BenjaminiY, HochbergY (1995) Controlling the false discovery rate: a practical and powerful approach to multiple testing. J R Stat Soc Ser B 57 : 289–300.
Štítky
Genetika Reprodukční medicínaČlánek vyšel v časopise
PLOS Genetics
2014 Číslo 11
- Kazuistika – Perspektivy využití precizované medicíny v rámci personalizované specifické terapie onkologických pacientů
- Nobelova cena za chemii pro genetické nůžky: Objev, který změní naši budoucnost?
- Technologie na bázi RNA v klinické praxi: od přebarvených petúnií k terapii vzácných a dosud jen obtížně léčitelných chorob u lidí
- „Nepředstavovali jsme si, že náš výzkum povede přímo ke vzniku nových léků, dokonce ještě za našeho života“
- Bezplatné služby pro diagnostiku ATTRv amyloidózy pro kardiology
Nejčtenější v tomto čísle
- An RNA-Seq Screen of the Antenna Identifies a Transporter Necessary for Ammonia Detection
- Systematic Comparison of the Effects of Alpha-synuclein Mutations on Its Oligomerization and Aggregation
- Functional Diversity of Carbohydrate-Active Enzymes Enabling a Bacterium to Ferment Plant Biomass
- Regularized Machine Learning in the Genetic Prediction of Complex Traits
Zvyšte si kvalifikaci online z pohodlí domova
Mazová zátka a její řešení
nový kurzVšechny kurzy