
Genome-Wide Associations between Genetic and Epigenetic Variation Influence mRNA Expression and Insulin Secretion in Human Pancreatic Islets
Inter-individual variation in genetics and epigenetics affects biological processes and disease susceptibility. However, most studies have investigated genetic and epigenetic mechanisms independently and to uncover novel mechanisms affecting disease susceptibility there is a highlighted need to study interactions between these factors on a genome-wide scale. To identify novel loci affecting islet function and potentially diabetes, we performed the first genome-wide methylation quantitative trait locus (mQTL) analysis in human pancreatic islets including DNA methylation of 468,787 CpG sites located throughout the genome. Our results showed that DNA methylation of 11,735 CpGs in 4,504 unique genes is regulated by genetic factors located in cis (67,438 SNP-CpG pairs). Furthermore, significant mQTLs cover previously reported diabetes loci including KCNJ11, INS, HLA, PDX1 and GRB10. We also found mQTLs associated with gene expression and insulin secretion in human islets. By performing causality inference tests (CIT), we identified CpGs where DNA methylation potentially mediates the genetic impact on gene expression and insulin secretion. Our functional follow-up experiments further demonstrated that identified mQTLs/genes (GPX7, GSTT1 and SNX19) directly affect pancreatic β-cell function. Together, our study provides a detailed map of genome-wide associations between genetic and epigenetic variation, which affect gene expression and insulin secretion in human pancreatic islets.
Published in the journal:
. PLoS Genet 10(11): e32767. doi:10.1371/journal.pgen.1004735
Category:
Research Article
doi:
https://doi.org/10.1371/journal.pgen.1004735
Summary
Inter-individual variation in genetics and epigenetics affects biological processes and disease susceptibility. However, most studies have investigated genetic and epigenetic mechanisms independently and to uncover novel mechanisms affecting disease susceptibility there is a highlighted need to study interactions between these factors on a genome-wide scale. To identify novel loci affecting islet function and potentially diabetes, we performed the first genome-wide methylation quantitative trait locus (mQTL) analysis in human pancreatic islets including DNA methylation of 468,787 CpG sites located throughout the genome. Our results showed that DNA methylation of 11,735 CpGs in 4,504 unique genes is regulated by genetic factors located in cis (67,438 SNP-CpG pairs). Furthermore, significant mQTLs cover previously reported diabetes loci including KCNJ11, INS, HLA, PDX1 and GRB10. We also found mQTLs associated with gene expression and insulin secretion in human islets. By performing causality inference tests (CIT), we identified CpGs where DNA methylation potentially mediates the genetic impact on gene expression and insulin secretion. Our functional follow-up experiments further demonstrated that identified mQTLs/genes (GPX7, GSTT1 and SNX19) directly affect pancreatic β-cell function. Together, our study provides a detailed map of genome-wide associations between genetic and epigenetic variation, which affect gene expression and insulin secretion in human pancreatic islets.
Introduction
Most cells in the human body share the same genetic sequence while the epigenetic pattern varies between different cell types and over time. DNA methylation is one of the most studied epigenetic modifications and it is involved in multiple biological processes such as transcriptional control during embryonic development, X-chromosome inactivation, genomic imprinting and regulation of cell specific gene expression [1]. In differentiated mammalian cells, DNA methylation occurs primarily on the 5′ position of cytosine followed by guanine, so called CpG sites [2]. Alterations in DNA methylation may affect phenotypic transmission and may be part of the etiology of human disease [3].
Inheritance of epigenetic traits between generations has been shown in animals [4], [5]. Previous studies in twins further suggest that genetic factors may affect DNA methylation profiles [6], [7]. Moreover, genetic variation has been shown to influence the inter-individual variation in DNA methylation in the human brain, fibroblast and adipose tissue [8]–[14]. While some of these studies used the Infinium HumanMethylation27 BeadChip which covers ∼14,500 genes [8]–[10], others used the HumanMethylation450 BeadChip and limited the analysis to cis regulatory effects [12]–[14]. However, studies examining the impact of genetic variation on the genome-wide DNA methylation pattern of most genes and regions, in both cis and trans, throughout the human genome are still scarce.
Pancreatic islets contribute to the regulation of whole body glucose homeostasis by secreting insulin in response to increased plasma glucose concentrations. Deficient insulin secretion, resulting in chronically elevated blood glucose levels, is a characteristic of diabetes mellitus. Recent genome-wide association studies (GWAS) have identified numerous genetic loci associated with diabetes and its related traits [15]–[30]. However, these variants only explain a small proportion of the estimated heritability for diabetes [31], proposing that there are additional genetic factors left to be discovered. These may include genetic variants interacting with epigenetic mechanisms.
To study the interaction between genetics and epigenetics and to identify novel loci affecting islet function and potentially diabetes, we performed the first genome-wide DNA methylation quantitative trait locus (mQTL) analysis in human pancreatic islets. The specific goals for this study were to: 1) identify single nucleotide polymorphisms (SNPs) associated with altered DNA methylation (mQTLs) in human pancreatic islets; 2) test if identified SNPs in significant mQTLs affect islet gene expression and diabetes related phenotypes; 3) examine the causal relationship between genotype, DNA methylation and gene expression or insulin secretion in human pancreatic islets; 4) test if identified candidate genes, based on our mQTL results, have a functional role in pancreatic β-cells; 5) examine if mQTLs in human pancreatic islets also associate with diabetes and its related traits in GWAS. To reach these goals, we related genome-wide genotype data of SNPs with genome-wide DNA methylation data of ∼470,000 CpG sites covering 21,231 (99%) RefSeq genes and most genomic regions in pancreatic islets of 89 human donors. Here, both cis and trans regulatory effects of SNPs on DNA methylation were analyzed. SNPs found to be associated with DNA methylation levels in the mQTL analysis were then followed-up with an expression quantitative trait locus (eQTL) analysis in the human islets, and related to islet insulin secretion data. In addition, we used a causal inference test (CIT) [32] to model the causal relationships between genotype, DNA methylation and phenotypic outcome. A number of candidate genes, where both DNA methylation and gene expression were associated with genetic variation, were then selected for functional follow-up analysis in clonal β-cells. Finally, identified mQTLs were examined for overlap with reported diabetes loci in publicly available GWAS data. The study design is described in Figure 1.

Using this approach, we identified significant mQTLs in cis and in trans. Numerous mQTLs were associated with altered mRNA expression and insulin secretion in human islets. Notably, identified mQTLs covered known diabetes loci. Together, our study highlights the importance of integrating genetic and epigenetic data in order to identify new loci affecting biological processes and disease risk.
Results
Associations between genetic variation and DNA methylation – A genome-wide mQTL analysis in human pancreatic islets
To examine whether genetic variation is associated with DNA methylation levels in human pancreatic islets, a genome-wide mQTL analysis was performed. In total, genotype data of 574,553 SNPs and DNA methylation data of 468,787 CpG sites from pancreatic islets of 89 human donors (Table S1) were included in the analysis. A correlation heatmap illustrating the overall variability in DNA methylation among included samples is presented in Figure S1. In the mQTL analysis, a total of 111,360,152 SNP-CpG pairs were found to be located in cis and 269,231,617,059 SNP-CpG pairs were located in trans. We proceeded to calculate the statistical significance threshold for the cis and trans-mQTL analyses, taking the linkage dependency of SNPs and number of tests into account. Linkage disequilibrium (LD) based SNP pruning, which takes into account the linkage dependency of SNPs that are run against DNA methylation of the same CpG site in the mQTL analysis, was then used to calculate the number of independent tests based on r2<0.9 for the SNPs and thereby the significance threshold after correction for multiple testing. After LD-based pruning, 102,307,720 SNP-CpG pairs were identified showing independence based on r2<0.9 in cis and this number was subsequently used as a correction value for multiple testing in the cis-mQTL analysis (significance threshold in the cis-mQTL: 0.05/102,307,720 = 4.9×10⁻¹⁰) (Table 1). Furthermore, 200,388,516,440 SNP-CpG pairs were identified showing independence based on r2<0.9 in trans and this number was used as a correction value for multiple testing in the trans-mQTL analysis (significance threshold in the trans-mQTL: 0.05/200,388,516,440 = 2.5×10⁻¹³) (Table 1).

Note that LD-based SNP pruning was used in order to calculate statistical significance thresholds based on number of independent tests. Our goal was to detect and present SNPs that show significant associations with DNA methylation regardless of linkage dependency and we subsequently included all genotyped SNPs in the mQTL analysis. In the cis-mQTL analysis, 67,438 SNP-CpG pairs were identified showing significant associations between genotype and DNA methylation levels after correction for multiple testing. These 67,438 SNP-CpG pairs consist of 36,783 unique SNPs (6.4% of tested SNPs) and 11,735 unique CpG sites (2.5% of tested CpG sites) which are annotated to 4,504 unique genes (Table 1). Among the significant cis-mQTLs, there are 31,313 SNP-CpG pairs with a LD threshold of r2<0.9 and 24,963 SNP-CpG pairs with r2<0.8 (Table 1). These include 20,251 unique SNPs with LD r2<0.9 and 16,557 unique SNPs with r2<0.8 (Table 1).
Depictions of the most and least significant cis-mQTLs are shown in Figure 2A–B and all significant cis-mQTLs are presented in Table S2. Distance analysis of significant cis-mQTLs showed that the majority of associated SNPs were located within a short range from CpG sites (Figure 2C). A SNP located within a cytosine or guanine of a CpG site, a so called CpG-SNP, can potentially remove or introduce a CpG site. Among SNP-CpG pairs showing significant associations in the cis-mQTL analysis, 459 pairs were identified as CpG-SNPs. Moreover, the cis-mQTLs showing the most significant associations were within SNPs located close to a CpG site (Figure 2D).

In the trans–mQTL analysis, 2,562 SNP-CpG pairs showed significant associations between genotype and DNA methylation levels after correction for multiple testing. These 2,562 SNP-CpG pairs consist of 1,465 unique SNPs (0.3% of tested SNPs) and 383 unique CpG sites (0.08% of tested CpG sites), which are annotated to 247 unique genes. Among the significant trans-mQTLs, there are 837 SNP-CpG pairs with a LD threshold of r2<0.9 and 629 SNP-CpG pairs with r2<0.8 (Table 1). These include 620 unique SNPs with LD r2<0.9 and 492 unique SNPs with r2<0.8 (Table 1).
Depictions of the most and least significant trans-mQTLs are shown in Figure 2E–F and all significant trans-mQTLs are presented in Table S3. Out of the significant trans-mQTLs, 1,564 (61.0%) SNP-CpG pairs, which consist of 970 unique SNPs and 229 unique CpG sites, are located on different chromosomes. Additionally, for the significant trans-mQTLs where the SNP and CpG are located on the same chromosome, the median distance between SNP and CpG is 1.2 Mb and these are potentially corresponding to long-range cis-effects.
We next generated quantile-quantile (Q-Q) plots of all –log10 (P-values) for the cis and trans mQTL analyses to illustrate the distribution of the P-values as compared to a theoretical null distribution (Figure 2G). The Q-Q plots illustrate that cis effects are stronger compared to trans effects.
A recent study reports that some probes on Illumina's DNA methylation chip can cross-react to multiple locations in the genome [33]. However, only 14 out of the 11,735 probes used to detect significant cis-mQTLs in human islets, and five out of 383 probes used to detect significant trans-mQTLs, were demonstrated to have a perfect match elsewhere in the human genome (Table S2, S3). Additionally, all significant probes with a 47–50 bp match elsewhere in the genome and possible cross-reactivity based on Chen et al [33] have been indicated in Table S2, S3.
Genomic distribution of mQTLs in human pancreatic islets
Although previous cancer studies have described the genomic location of CpG sites that exhibit differential DNA methylation in tumor versus normal cells [34], [35], to our knowledge, no previous study has examined the genomic distribution of CpG sites in genome-wide mQTLs. Moreover, while there is an accumulation of genetic variation on certain chromosomes associated with disease [23], [36], it remains unknown if there is an over - or underrepresentation of significant mQTLs on certain chromosomes linked to islet function. Here, we describe the genomic distribution of significant mQTLs in human pancreatic islets. When analyzing the chromosomal distribution of CpG sites among significant cis-mQTLs, an overrepresentation of CpG sites on chromosomes 6, 7, 8 and 21 together with an underrepresentation of CpG sites on chromosomes 1, 2, 3, 12, 14, 15, 16, 17, 19 and 20 were found in comparison to the chromosomal distribution of all analyzed sites on the Infinium HumanMethylation450 BeadChip based on chi-squared-tests (Figure 3A and Table S4A). In the trans-mQTL analysis, an overrepresentation of CpGs was found on chromosomes 6 and 17 together with an underrepresentation on chromosomes 1, 9 and 14 (Figure 3A and Table S4A). Chromosome 6, which possess the HLA region – a gene region known to be involved in diabetes and autoimmune reaction [37], [38], was found to show the highest enrichment when comparing the chromosomal distribution of CpG sites among significant mQTLs for both the cis - and trans-analysis compared with all analyzed CpG sites (Figure 3A and Table S4A).

Moreover, the CpG sites analyzed using the Infinium HumanMethylation 450 BeadChip have been annotated based on their genomic location in relation to the nearest gene (TSS1500, TSS200, 5′UTR, 1st exon, gene body, 3′UTR or intergenic regions) [39] (Figure 3B). When comparing the distribution of CpG sites of significant cis-mQTLs with all analyzed sites on the Infinium array, CpG sites in the gene body and intergenic regions were found to be overrepresented meanwhile CpG sites in TSS1500, TSS200, 5′UTR, 1st exon and 3′UTR were found to be underrepresented (Figure 3C and Table S4B). Among significant trans-mQTLs, overrepresentations of CpG sites were found in the 1st exon and intergenic regions while an underrepresentation of CpG sites was found in the TSS1500 (Figure 3C and Table S4B).
The CpG sites analyzed using the Infinium HumanMethylation 450 BeadChip have also been annotated based on their genomic location in relation to CpG islands (CpG island, northern - and southern shores, northern - and southern shelves or open sea) [39] (Figure 3B). Overrepresentations of CpG sites were found in northern - and southern shores, southern shelf and open sea while an underrepresentation was found in CpG islands when comparing the location of CpG sites of significant cis-mQTLs with all analyzed sites on the Infinium array (Figure 3D and Table S4C). CpG sites of significant trans-mQTLs were found to be overrepresented in CpG islands and underrepresented in northern shores (Figure 3D and Table S4C).
Epigenetic variation in enhancer regions has been proposed to play a key role in the regulation of gene expression in pancreatic islets [40]–[43]. We therefore proceeded to test if CpG sites in our significant mQTLs are located in long stretch enhancers based on publicly available data for human pancreatic islets [42]. These stretch enhancers are referred to as large gene elements (≥3 kb) of enhancer states that are cell type specific [42]. Here, we found that 993 (8.5%) CpG sites in our significant cis-mQTLs and 11 (2.9%) CpG sites in our significant trans-mQTLs are located in long stretch enhancers specific for pancreatic islets (Table S2 and Table S3), which is not more than expected by chance (P>0.05). Additionally, we found that 139 (1.2%) CpG sites in our significant cis-mQTLs and only two CpG sites in the significant trans-mQTLs are located in active enhancer regions of pancreatic islets identified by Pasquali et al [43] (Table S2 and Table S3).
Moreover, we tested if the genomic distribution of the significant mQTLs found in human islets in our study could be replicated in publicly available data. Here, we took advantage of published mQTL data in adipose tissue from Grundberg et al and we analyzed the genomic distribution of their significant cis-mQTLs [12]. In agreement with the genomic distribution of significant cis-mQTLs in human islets, we found that significant cis-mQTLs in human adipose tissue were overrepresented in the intergenic region, the gene body, the open sea as well as the shore and shelf regions, while underrepresented in regions close to the TSS and CpG island regions (Figure S2A–B). On the other hand, we found differences between human islets and adipose tissue regarding the chromosomal distribution of significant cis-mQTLs (Figure 3A and Figure S2C). Of note, differences in the study design and filtering of CpG probes between the two studies may influence these results.
Association of identified mQTL-SNPs with mRNA expression – A follow-up eQTL analysis in human pancreatic islets
Both genetic variation and DNA methylation have been shown to regulate gene expression [44], [45]. Therefore, SNPs identified to significantly affect DNA methylation in the mQTL analysis were followed-up and related to mRNA expression levels in human pancreatic islets. To calculate the number of independent tests to be used for correction for multiple testing in this analysis, we first connected SNPs of significant cis-mQTLs (n = 36,783) with all mRNA transcripts on the Affymetrix array located within 500 kb of respective SNP – the set cis boundary distance. With this setting, 895,764 SNP-mRNA transcript combinations were found in cis. However, after LD-based pruning of these SNPs, 692,616 SNP-mRNA transcript combinations remained showing independence of SNPs (based on r2<0.9) and this number was subsequently used as a correction value for multiple testing (significance threshold in the cis-eQTL: 0.05/692,616 = 7.2×10⁻⁸) (Table 2). In this cis-eQTL analysis, 302 SNP-mRNA transcript pairs were identified showing significant associations between genotypes and mRNA expression levels after correction for multiple testing (Table 2 and Table S5). These 302 significant pairs consist of 243 unique SNPs (0.7% of the significant cis-mQTL SNPs) and 46 unique mRNA transcripts (0.2% of tested mRNA transcripts). Among the significant cis-eQTLS, there are 117 SNP-mRNA transcript pairs with a LD threshold of r2<0.9 and 86 SNP-mRNA transcript pairs with r2<0.8 (Table 2). These include 99 unique SNPs with LD r2<0.9 and 76 unique SNPs with r2<0.8 (Table 2).

The SNPs of significant trans-mQTLs (n = 1,465) were then related to mRNA expression levels of all transcripts included on the Affymetrix array, giving rise to 40,127,815 SNP-mRNA transcript combinations. The correction value for multiple testing was calculated to 16,982,420 after LD-based pruning of SNPs (based on r2<0.9) (significance threshold in the trans-eQTL: 0.05/16,982,420 = 2.9×10⁻⁹) (Table 2). In the trans-eQTL, 32 SNP-mRNA transcript pairs consisting of 22 unique SNPs (1.5% of the significant trans-mQTL SNPs) and 8 unique mRNA transcripts (0.02% of tested mRNA transcripts) were found to show significance (Table 2 and Table S6). Among the significant trans-eQTLs, there are 16 SNP-mRNA transcript pairs with a LD threshold of r2<0.9 and 10 SNP-mRNA transcript pairs with r2<0.8 (Table 2). These include 10 unique SNPs with LD r2<0.9 and 7 unique SNPs with r2<0.8 (Table 2).
Moreover, a correlation heatmap illustrating the overall variability in mRNA expression among included samples is presented in Figure S3. We next used Mantel's test [46] to compare the hierarchical clustering results for mRNA expression (Figure S3) and DNA methylation (Figure S1) and obtained a correlation coefficient of 0.21 (P = 0.005).
Causality inference test (CIT) - DNA methylation potentially mediates the genetic impact on mRNA expression
We further used CIT [32] to examine if relationships between genotypes and phenotype (gene expression) are potentially mediated through DNA methylation of CpG sites in significant mQTLs. In this CIT approach, we consider SNPs identified in the mQTL/eQTL analysis as causal factors (G), DNA methylation of CpG sites identified in the mQTL analysis as potential mediators (M) and mRNA expression identified in the eQTL analysis as a phenotypic outcome (E). The possible relationships between these three factors are shown in Figure 4A. Significant SNP-CpG pairs from the mQTL analysis (Step 1 Figure 4B), where the mQTL-SNPs also show significant association with mRNA expression in the eQTL analysis (Step 2 Figure 4B), were included in the CIT. In the CIT analysis of cis-mQTLs/eQTLs, we identified 28 SNP-CpG-mRNA combinations (1.0%) consisting of 17 unique SNPs, 14 unique CpG sites and 5 unique mRNA transcripts that were significantly called as causal (causal hypothesis Q-value<0.05 based on FDR) and these represent potential methylation-mediated relationships between SNPs and mRNA expression (left panel Figure 4A, step 3 Figure 4B and Table 3). All hypothesis tests of the CIT for cis interactions are presented in Table S7. Interestingly, several identified relationships where DNA methylation potentially mediates the causal association between SNP and mRNA expression were annotated to HLA genes (Table 3), a gene region strongly linked to type 1 diabetes [37]. Moreover, a causal relationship between SNPs, DNA methylation and mRNA expression of genes involved in glutathione metabolism, including GSTT2 (Q<0.05, Table 3) and GSTT1 (P<0.05, Table S7), were also identified in the CIT analysis. Glutathione metabolism is known to protect against oxidative stress [47]–[49] and thereby has a potential role in islet function.


In the CIT analysis of trans-mQTLs/eQTLs, we identified 4 SNP-CpG-mRNA combinations (10.8%) showing a causal relationship with FDR<5% (step 3 Figure 4B and Table S8).
Biological features of genes identified in the mQTL/eQTL analyses
Next, we performed gene ontology and KEGG pathway analyses to identify cellular components or biological pathways with enrichment of genes that were significant in the mQTL and/or eQTL analyses in human pancreatic islets.
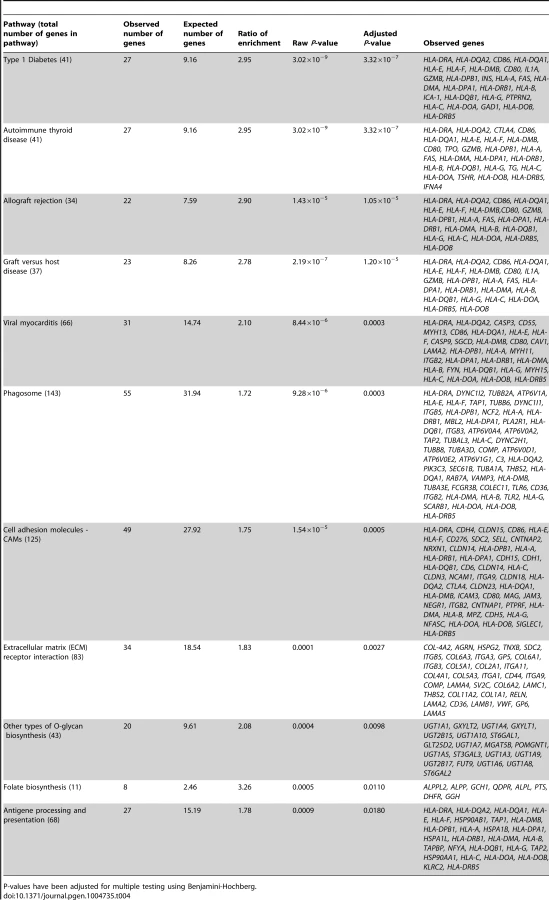
In the gene ontology analysis of significant cis-mQTLs, genes annotated to identified CpG sites were enriched in biological processes of relevance to human pancreatic islets, including the MHC protein complex (Padj = 5.8×10⁻⁷) and the endoplasmic reticulum (ER) to golgi transport (Padj = 1.6×10⁻²) (Figure S4, includes all enriched biological processes). Moreover, in the KEGG pathway analysis, type 1 diabetes (Padj = 3.3×10⁻⁷), phagosome (Padj = 3.0×10⁻⁴), cell adhesion molecules (Padj = 5.0×10⁻⁴), extracellular-receptor matrix (ECM) interaction (Padj = 2.7×10⁻³) and folate biosynthesis (Padj = 0.011) were found among the enriched pathways (Table 4, includes all enriched KEGG pathways).
In the gene ontology analysis of genes showing differential expression between genotype groups in the eQTL analysis of significant cis-mQTL-SNPs, we again found enrichment of genes in the MHC protein complex (Padj = 1.6×10⁻³) and in ER to golgi transport (Padj = 1.4×10⁻²). Moreover, genes involved in glutathione peroxidase activity (Padj = 1.1×10⁻²) and glutathione transferase activity (Padj = 1.1×10⁻²) were enriched in the gene ontology analysis of the cis-eQTLs (Figure S5). In the KEGG pathway analysis of differentially expressed genes in the cis-eQTL (Table S9), genes involved in the glutathione metabolism pathway which is of relevance to islet function were enriched including the following identified genes: GSTT1, GSTM3 and GPX7 (Padj = 3.0×10⁻⁴).
Furthermore, genes annotated to CpG sites of significant trans-mQTLs were also found to be enriched in the MHC protein complex (Padj = 1.1×10⁻³) and the ER part (Padj = 3.8×10⁻²) when performing a gene ontology analysis (Figure S6). This was also reflected in the KEGG pathway analysis of trans-mQTLs (Table S10) where type 1 diabetes was found to be an enriched pathway of relevance in human pancreatic islets, including the following genes: PTPRN2, HLA-DRB1, HLA-B, HLA-C, HSPD1 and HLA-DRB5 (Padj = 6.0×10⁻⁴).
In the gene ontology analysis of genes showing differential expression between genotype groups in the eQTL analysis of significant trans-mQTL-SNPs, the carboxylic acid metabolic process was found to be enriched (Padj = 8.4×10⁻³) (Figure S7). However, no significant enrichment was found in the KEGG pathway analysis including the same dataset.
Knockdown of Gpx7, Gstt1 and Snx19 alters β-cell proliferation and cell death signaling
To examine whether altered expression of some of the identified candidate genes in the islet mQTL/eQTL analyses affect β-cell function and thereby potentially the development of diabetes, we silenced the expression of three selected genes; Gpx7, Gstt1 and Snx19, in clonal β-cells. These genes were selected based on their potential role in diabetes and islet function [47], [49]–[51] and because they showed both differential DNA methylation and gene expression between genotype groups in the mQTL and eQTL analyses (Table S2 and Table S5). One representative mQTL and eQTL for GPX7,, GSTT1 and SNX19, respectively, is presented in Figure 5A–C. Moreover, GPX7 and GSTT1 belong to the genes that were enriched in the glutathione metabolism KEGG pathway of significant cis-eQTLs. The knock-down experiments were performed to establish if identified genes in our mQTL analysis have a biological function in pancreatic β-cells. While both GPX7 and GSTT1 encode proteins that are known to protect against oxidative stress [48], [52], [53], sortin nexin 19, encoded by SNX19, may put cells into a pre-apoptotic state [50]. We therefore studied cell number and cell death signaling, measured as caspase-3/7 activities, under control and lipotoxic stress conditions when silencing selected candidate genes in clonal β-cells. The expression level of Gpx7, Gstt1 and Snx19 respectively, was significantly reduced in the siRNA knockdown experiments (P<0.05, Figure 5D). Interestingly, both under control and lipotoxic conditions, we found increased caspase-3/7 activities in β-cells with silenced Gpx7 or Gstt1 expression compared to negative control siRNA transfected (siNC) β-cells (P<0.05, Figure 5E). Moreover, when crystal violet staining was used to measure β-cell number, knockdown of Snx19 resulted in increased cell number compared to negative control cells under both normal and lipotoxic conditions (P<0.05, Figure 5F).

Associations of identified mQTLs with insulin secretion in human pancreatic islets
Pancreatic islets play a major role in controlling whole-body glucose-homeostasis through secreting insulin in response to elevated blood glucose levels and other fuels. To further examine phenotypic outcomes of significant mQTLs in human pancreatic islets, significant cis and trans mQTL-SNPs were related to glucose-stimulated insulin secretion from human islets in vitro. Out of the identified cis-mQTL-SNPs, 1,843 (5.0%) SNPs were associated with glucose-stimulated insulin secretion in vitro (P<0.05) (Table S11). Moreover, seven of the cis-mQTL-SNPs associated with insulin secretion were also identified in the cis-eQTL analysis including the GPX7 and HLA genes (Table S5). Additionally, out of the identified trans-mQTL-SNPs, 90 (6.1%) SNPs were associated with glucose-stimulated insulin secretion in human islets (Table S12). We next used CIT [32] to examine if relationships between genotypes and phenotype (insulin secretion) were potentially mediated through DNA methylation of CpG sites in the significant mQTLs. In this CIT approach, we consider genotypes of SNPs identified in the mQTL analysis as causal factors (G), DNA methylation of CpG sites identified in mQTL analysis as potential mediators (M) and islet insulin secretion as a phenotypic outcome (I). The possible relationships between these three factors are shown in Figure S8A. Significant SNP-CpG pairs from the mQTL analysis where mQTL-SNPs also show association with insulin secretion were included in the CIT (Figure S8B). The CIT analysis of cis-mQTLs identified 14 (0.5%) SNP-CpG pairs consisting of 10 unique SNPs and 8 unique CpGs that were called as causal (causal hypothesis P-value<0.05; nothing hold for FDR with Q-value<0.05) and represent potential methylation-mediated relationships between mQTL-SNPs and insulin secretion (Figure S8B and Table S13). One identified mQTL, where methylation potentially mediates the causal association between the SNP and islet insulin secretion, was annotated to PTPRN2 (also known as IA-2β or in rodents as phogrin) (Table S13). Interestingly, the PTPRN2 gene encodes a protein that is an autoantigen in type 1 diabetes [54], [55]. When performing the CIT analysis of trans-mQTLs, no SNP-CpG pairs were found to show a causal relationship with islet insulin secretion (Figure S8B).
Identified mQTLs/eQTLs in human pancreatic islets capture reported diabetes SNPs
Previous GWAS have identified SNPs associated with an increased risk of diabetes or diabetes related traits [15], [20], [56]. Nevertheless the molecular understanding of how these SNPs contribute to disease is still limited. To examine if previously reported diabetes SNPs may affect DNA methylation and/or gene expression in human pancreatic islets, a key tissue in the pathogenesis of diabetes, they were checked for overlap with the identified mQTLs/eQTLs in the present study.
The GWAS catalog (www.genome.gov/gwastudies, accessed March 2013) [57] was used to find SNPs reported to be associated with diabetes. In total, 317 SNPs were identified showing associations (P<10−6) with type 1 diabetes, type 2 diabetes or related traits (glucose-, insulin - and proinsulin traits). To get better reference coverage of these SNPs a proxy search using SNAP [58] was performed, giving 5,448 SNPs in LD (r2>0.8) with the reported diabetes SNPs. This dataset was then used to check for any overlap with the identified SNPs in the mQTL/eQTL analyses of human islets.
In the overlap, 32 out of 317 (10.7%) reported diabetes SNPs were found to match directly or through a proxy with the identified cis-mQTL-SNPs, consisting of SNPs associated with type 1 diabetes (n = 12), type 2 diabetes (n = 12), fasting-plasma glucose (n = 4; 1 SNP overlapping with type 2 diabetes), 2 hour glucose challenge (n = 1), insulin response (n = 2) and proinsulin (n = 2) (Figure 6A–H; Table S14). Moreover, one diabetes associated SNP (rs9272346 HLA-DQA1, PT1D<10−128) was found through the proxy search to overlap with a cis-mQTL-SNP (rs1063355 HLA-DQB1, R2 = 0.87) (Figure 6B) that showed association with mRNA expression in the human islets (Table S5). Identified trans-mQTL-SNPs were not found to overlap with reported diabetes SNPs identified through GWAS.

Identified mQTL-SNPs were also checked for overlap with publicly available consortium data of type 2 diabetes associations from DIAGRAMv3 GWAS meta-analysis [59] and for glycemic traits association from MAGIC investigators [60]–[64]. Significant mQTL-SNPs overlapping with SNPs showing associations with type 2 diabetes (P<0.05 in DIAGRAM) or with glucose, insulin and proinsulin traits (P<0.05 in MAGIC) are presented in Table S15 and Table S16, cis - and trans-mQTL-SNPs respectively. These include SNPs annotated to the KIF11-HHEX-IDE region, WFS1, ADCY5, KCNJ11, FADS1, SIRT2 and SNX19.
As an evaluation of the number of islet mQTL-SNPs also reported to be diabetes associated SNPs in GWAS, we further checked for overlap between mQTL-SNPs identified in human islets and SNPs associated with breast cancer, stroke and hypothyroidism; diseases not relevant for our targeted tissue of pancreatic islets. In total, there were 63 reported SNPs associated with breast cancer, 18 SNPs associated with stroke and 20 SNPs associated with hypothyroidism in the GWAS catalog with P<10−6 (accessed March 2013). Out of these, four breast cancer SNPs, one SNP associated with stroke and no hypothyroidism SNPs could be identified directly or through a proxy SNP as cis-mQTLs in human pancreatic islets. However, the SNPs associated with the additional traits were neither identified in the trans-mQTL analysis nor in the eQTL analyses of human islets.
Associations between DNA methylation and mRNA expression in human pancreatic islets
Depending on the genomic location of a CpG site, DNA methylation may regulate gene transcription in several different ways [65], [66]. Nevertheless, the association between DNA methylation and gene expression throughout the human genome remains poorly described. To test if DNA methylation is directly associated with gene expression in human pancreatic islets, we performed a linear regression between individual mRNA transcripts and DNA methylation of CpG sites in cis (500 kb up - and 100 kb downstream of respective gene), including age, gender, BMI, HbA1c, islet purity, days in culture and batch as covariates. We found significant associations between DNA methylation and mRNA expression for 31,315 combinations (FDR<5%), consisting of 22,773 unique CpG sites (4.9% of tested CpG sites) and 5,377 unique mRNA transcripts (19.6% of tested mRNA transcripts), which are annotated to 4,876 genes. Out of these, CpG sites in 20,376 combinations (65.1%) were located in the region 0–500 kb upstream of a transcription start site, CpG sites in 5,718 combinations (18.3%) were intragenic, and CpG sites in 5,221 combinations (16.7%) were located 0–100 kb downstream of a gene (Figure 7). For CpGs upstream from a transcription start site, 9,436 combinations (46.3%) showed negative and 10,940 combinations (53.7%) showed positive correlations between DNA methylation and mRNA expression (Figure 7A). For intragenic CpGs, we found 3,694 (64.6%) negative and 2,024 (35.4%) positive correlations (Figure 7B). Interestingly, negative correlations were enriched for CpGs in the region close to the transcription start site (Figure 7C–D). For example, for CpGs in the region 1 kb upstream to 1 kb downstream from the transcription start site, 90% of the correlations between DNA methylation and mRNA expression were negative. For CpGs downstream of the gene, we found negative correlations for 2,499 combinations (47.9%) and positive correlations for 2,722 combinations (52.1%) (Figure 7E).

In addition, we looked for any overlap between significant mQTL/eQTL results and direct associations between DNA methylation and mRNA expression. Thereby, we extracted and paired CpG sites and mRNA transcripts that were significantly affected by the same SNPs in the mQTL/eQTL analyses, which resulted in identification of 410 unique CpG-mRNA transcript pairs. Out of these, 287 (70%) also showed a significant direct association between DNA methylation and mRNA levels, where 164 (57.1%) CpG-mRNA transcript pairs showed negative correlations and 123 (42.9%) showed positive correlations (Table S17). Of note, for all three genes selected for functional follow-up experiments based on both significant mQTL and eQTL results (Figure 5), DNA methylation was directly associated with gene expression, e.g. DNA methylation of 8 CpG sites within or around GSTT1 showed the most significant correlations with mRNA expression of GSTT1 (Padj<9.9×10⁻¹³) (Table S17). Additionally, DNA methylation within or around GPX7 and SNX19 was directly associated with mRNA expression of respective gene (Table S17).
Biological validation and replication of mQTL and eQTL data
To biologically validate our findings from the genome-wide mQTL analysis and the eQTL analysis, we analyzed DNA methylation with Pyrosequencing and mRNA expression of two selected genes (GPX7 and SNX19) in pancreatic islets from a different set of human donors than the ones used for the mQTL/eQTL analyses. The characteristics of the 37 islet donors used for biological validation can be found in Table S18. Importantly, our mQTL/eQTL data could be biologically validated in the new set of islets (Figure 8A–B, Figure 5, Table S2 and Table S5). We found significant differences in methylation and expression between genotype groups which were in the same direction as the genome-wide mQTL/eQTL analysis. Of note, for validation of SNX19 expression, there was only expression data available from one carrier of the rare variant and the association did not reach significance, P = 0.12 (Figure 8B). It should also be noted that we were able to validate significant mQTL data detected with an Infinium probe that contains a SNP by the use of Pyrosequencing (Figure 5C and Figure 8B), i.e., there is a SNP (rs4402303, C/T) located in the SNX19 methylation probe (cg08912652, Table S2), which either introduces or removes a CpG site and this SNP is in full LD with our significant mQTL SNP (rs3751035; D′ = 1, r2 = 1 based on 1000 Genomes project, CEU population panel, distance between SNPs = 5.7 kb).

We further examined whether our significant islet cis-mQTLs (presented in Table S2) were identified in previous reported mQTL studies from other human tissues [8], [9], [12]–[14]. Here, we tested for the overlap of CpG sites in significant mQTLs in our study and previously reported mQTL studies. For example, we found that ∼33% of identified CpG sites in significant cis-mQTLs in our human islet study were also identified in significant cis-mQTLs in adipose tissue [12]. The numbers of CpG sites in significant cis-mQTLs in our human islets study that could be replicated in previously published human mQTL studies are presented in Table S19. Significant cis-mQTLs identified in human pancreatic islets and not replicated in other human tissues may be islet specific. In total, we found 6,898 CpG sites in significant cis-mQTLs annotated to 3,241 unique genes in our islet mQTL analysis that cannot be replicated in any of the previously published human mQTL studies used in the overlap analysis [8], [9], [12]–[14]. To look for potential biological relevance of significant cis-mQTLs only identified in human islets, we performed KEGG pathway analysis of this subset of 3,241 unique genes (Table S20). However, we cannot rule out that unequal filtering and inclusion criteria of CpG probes, different significance thresholds for calling mQTL hits and various cis windows together with other factors may influence the replication of our islet mQTLs in previously published mQTL studies in other human tissues.
Associations between imputed genotype data and DNA methylation in human pancreatic islets
To generate a reference map of mQTL data in human pancreatic islets, we finally imputed autosomal genotype data generated with the Human OmniExpress BeadChip for the 89 islet donors to the 1000 Genomes phase 1, version 3 reference panel. We then associated imputed autosomal genotype data, including 6,544,062 SNPs, with DNA methylation data of 468,787 CpG sites from islets of 89 human donors. Based on significance thresholds of 4.9×10⁻¹⁰ and 2.5×10⁻¹³ in the cis - and trans-mQTL analyses, respectively, we found 978,128 SNP-CpG pairs in cis (Table 5 and Table S21) and 59,529 SNP-CpG pairs in trans (Table 5 and Table S22) showing significant associations between genotypes and DNA methylation levels. These 978,128 cis-SNP-CpG pairs consist of 494,642 unique SNPs (7.6% of tested SNPs) and 14,308 unique CpG sites (3.1% of tested CpG sites), which are annotated to 5,160 unique genes (Table 5 and Table S21). Moreover, the 59,529 trans-SNP-CpG pairs consist of 34,351 unique SNPs (0.5% of tested SNPs) and 545 unique CpG sites (0.1% of tested CpG sites), which are annotated to 352 unique genes (Table 5 and Table S22). Of note, only 2,573 new CpG sites were discovered in the cis-mQTL analysis of imputed genotype data compared with the cis-mQTL analysis of directly genotyped SNP data (Table 1/Table S2 and Table 5/Table S21). Additionally, we discovered 162 new CpG sites in the trans-mQTL analysis of imputed genotype data compared with the analysis of directly genotyped SNP data (Table 1/Table S3 and Table 5/Table S22). The mQTL analysis of imputed genotype data identified all significant SNP-CpG pairs presented in Table S2 and Table S3. The modest increase in discovered CpG sites and unique genes in the mQTL analysis of imputed SNPs is most likely due to a dependency in imputed and directly genotyped SNP data as the directly genotyped SNP data generated with the Human OmniExpress BeadChip was used for imputation.

Discussion
It is well established that genetic and epigenetic variation contributes to the development of numerous diseases, including diabetes [40], [56], [65], [67]–[73]. While most studies have investigated genetic and epigenetic mechanisms independent of each other, they may interact and together affect biological processes and susceptibility to disease. Here, we perform the first mQTL analysis in human pancreatic islets targeting DNA methylation of ∼99% of RefSeq genes and most genomic regions in the human genome. The present study gives new insights on how genetic and epigenetic factors can interact in humans and provides a detailed map of genetic loci affecting the genome-wide DNA methylation pattern in human pancreatic islets.
Pancreatic β-cells secrete insulin in proportion to extracellular glucose concentrations and thereby contribute to whole-body glucose-homeostasis. Deficient insulin secretion, giving rise to chronically elevated blood glucose levels, is a hallmark of diabetes mellitus. Recent GWAS have identified SNPs associated with an increased risk of both type 1 diabetes [15]–[17], [19], [21], [22], [24] and type 2 diabetes [25]–[28]. Interestingly, many of these SNPs seem to affect pancreatic islet function, autoimmunity and inflammation [15], [23], [74]–[79]. However, SNPs identified by GWAS only explain a small part of the estimated heritability of type 2 diabetes based on family studies [31], suggesting that there are additional genetic factors left to be discovered. SNPs that are carriers for inheritance of DNA methylation may explain some of the missing heritability of complex diseases. In the present study, we found that SNPs associated with DNA methylation, mRNA expression and insulin secretion in human pancreatic islets also showed nominal associations with type 2 diabetes as reported by the DIAGRAM consortium [59] and with glucose/insulin traits as reported by MAGIC investigators [60]–[64]. It is possible that some of the overlapping SNPs have escaped detection to disease phenotypes in previous GWAS and that association to diabetes can only be significantly detected if the degree of DNA methylation in cases and controls is taken into account. However, other cohorts than the one used in this study will be needed to test this. Environmental factors can change the degree of DNA methylation and may thereby control phenotype transmission [67], [71], [72], [80]–[82]. Effects of SNPs that interact with DNA methylation levels may thereby change under different environmental conditions, which could affect their impact on disease risk [70]. This may be one explanation for gene-environment interactions.
The majority of reported loci that predispose to diabetes seem to act through insulin secretion defects from pancreatic islets [83]–[85]. However, the molecular mechanisms of how most of these SNPs affect their target gene or phenotypic outcome remain unknown. In the present study, we found that several SNPs identified in GWAS to associate with type 1 diabetes (e.g. PTPN2 [15], INS [15] and HLA [86]), type 2 diabetes (e.g. ADCY5 [60], [64], [87] and KCNJ11 [25], [26], [29], [79]) and glucose-traits (GRB10 [64] and PDX1 [64]) were also associated with differential DNA methylation between genotype groups in human pancreatic islets. In particular we found an enrichment of significant mQTLs in the HLA region on chromosome 6p21, which possess the strongest genetic determinant for type 1 diabetes [23] and predisposition to autoimmunity [78]. In total, 55% of the CpG sites in significant cis-mQTLs on chromosome 6 were located within the HLA gene region (Chr6 : 29.570.005–33.377.701 - human genome build 37) and the enrichment cannot be explained by the distribution of analyzed sites on the array. A non-HLA gene, PTPN2, known to affect the risk of type 1 diabetes and Crohn's disease was also identified in the mQTL analysis of human islets [15], [74]. PTPN2 encodes a non-receptor type protein member of the tyrosine phosphate family and is expressed in β-cells where it has been shown to be involved in cytokine-induced apoptosis [75], [88]. We also found significant mQTLs in the PDX1 and INS (insulin) genes. PDX1 (pancreatic duodenal homeobox 1) is a transcription factor involved in pancreas development and function [89], [90]. The PDX1 gene is also expressed in β-cells of the mature pancreas, where it plays a role in glucose-dependent regulation of insulin gene expression and insulin secretion. Recent studies from our group show that increased DNA methylation may reduce expression of PDX1 and INS in diabetic islets and contribute to the development of the disease [40], [68], [91]. Altered DNA methylation levels in human pancreatic islets based on genotype may be a molecular mechanism through which diabetes associated SNPs contribute to the disease phenotype.
We recently showed that ∼50% of previously reported type 2 diabetes risk SNPs are so called CpG-SNPs that introduce or delete possible DNA methylation sites. These type 2 diabetes associated CpG-SNPs were significantly associated with altered DNA methylation, gene expression and islet hormone secretion in pancreatic islets from non-diabetic human donors [65]. In the present study, we also looked for associations between significant mQTL-SNPs and islet insulin secretion in our study cohort and we found numerous associations with P<0.05. However, the lack of available insulin secretion data measured in pancreatic islets in vitro in an independent cohort limits our possibility to replicate and strengthen our results. Nevertheless, our findings may provide interesting biological insights to the field of insulin secretion.
Further, in order to mathematically model the relationships between genotype, DNA methylation and a phenotype (mRNA expression and insulin secretion), we performed CIT analysis [32]. While the CIT for mRNA expression remained significant after correction for multiple testing, the CIT for insulin secretion did not stand correction for multiple testing. Interestingly, we found that genetic associations with mRNA expression of genes located in the HLA region and of genes involved in glutathione metabolism were potentially mediated through DNA methylation. Both the HLA gene region and the glutathione genes have been genetically linked to type 1 diabetes and are suggested to play a biological role in islet function [37], [47]. Our data also suggest that DNA methylation of a CpG site within PTPRN2 is the potential mediator of the association between a SNP in the same gene and islet insulin secretion. The gene product of PTPRN2 (also known as IA-2β or in rodents as phogrin) is a receptor type of the protein tyrosine phosphatase family known to be a major islet autoantigen in type 1 diabetes [54], [55]. Expression of the PTPRN2 gene product in pancreatic islets is shown to have important biological β-cell functions and is involved in the regulation of insulin secretion [92]–[95]. Together with the mQTL findings in e.g. HLA genes and PTPN2, our results highlight that future studies may need to integrate genetics and epigenetics in order to clarify how candidate genes for type 1 diabetes contribute to the disease. To our knowledge, only two previous studies have applied a CIT approach to model the interacting relationship between genotype and DNA methylation on the effect of a human phenotype [13], [96]. In line with the study by Liu et al. that found ten differentially methylated positions in blood that mediate genetic risk in rheumatoid arthritis [96], we found in the present study 14 differentially methylated positions in human islets that act as potential mediators of genetic associations with mRNA expression. Since the CIT analyses are based on hypotheses that mathematically model the causal relationships of interactions between genetics and epigenetics on phenotypes, we cannot rule out the fact that confounding factors not coped for in the models may influence the suggested calls of causality. Although independent studies need to verify the modelled relationships, we will emphasize that the study approach previously addressed by Liu et al [96] and Gutierrez-Arcelus et al [13] and applied here reveals novel interesting information about molecular interactions between genetics and epigenetics, and may pose new questions about disease causality.
Functional in vitro follow-up studies in β-cells of selected genes, based on our mQTL/eQTL findings, showed that decreased expression of Gpx7 and Gstt1 significantly affects caspase activity and decreased expression of Snx19 significantly affects cell number. These functional experiments were performed to test if any of the identified genes in the mQTL/eQTL analyses have a biological role in β-cells. Importantly, we could also biologically validate our mQTL/eQTL results for GPX7 and SNX19 in a different set of islets than the ones included in the genome-wide analysis. Together, our data propose a model where altered DNA methylation and expression of these genes in human islets based on genotype may influence in vivo islet β-cell number and thereby diabetes risk. Interestingly, GPX7 (glutathione peroxidase 7), and GSTT1 (glutathione S-transferase theta 1), are involved in glutathione metabolism, a pathway we found to be enriched among differentially expressed genes in the eQTL analysis of the human islets, and known to have cell protective functions against oxidative stress [48], [49], [52]. Moreover, the protein encoded by SNX19 (sortin nexin 19) has been shown to interact with the islet autoantigen IA-2 and put cells into a pre-apoptotic state [50]. Here, we identified numerous mQTL loci that affect the expression of these genes. Interestingly, some of these loci were also nominally associated with glucose traits in analyses by MAGIC investigators [60]–[64]. Together, our functional data provide novel biological insights in the regulation of β-cell function.
Additionally, the genes covering significant cis-mQTLs were enriched in a total of 11 KEGG pathways. These include 9 KEGG pathways relevant to pancreatic islet function, e.g. type 1 diabetes [88], [97], cell adhesion molecules [98], extracellular-receptor matrix (ECM) interaction [99] and folate biosynthesis [100]. It should be noted, however, that many individual genes are included in multiple KEGG pathways and the significant pathways that do not seem to be relevant for pancreatic islet function, such as viral myocarditis, contain numerous individual genes with important roles in pancreatic islets e.g. CASP3, CAV1 and HLA-genes [101]–[103]. Moreover, for the analyses of genes covering significant cis-eQTLs and trans-mQTLs, all of the identified KEGG pathways were relevant to pancreatic islet function [49], [104]–[111].
This study is to our knowledge the first to perform both cis and trans mQTL analyses of DNA methylation data generated with the Infinium HumanMethylation450 BeadChip. Our aim was to select a cis distance that illustrates the overall distribution of significant cis-mQTLs. Before selecting 500 kb as our cis distance, we performed a preliminary mQTL analysis where we used 1 Mb as the cis distance. However, based on the small number of significant SNPs identified in the cis window between 501 kb and 1 Mb (e.g. only 1.43% of significant mQTL-SNPs were located in the 501–1000 kb window, while 98.57% of significant mQTL-SNPs were located within the 0–500 kb window), we reduced the cis distance to 500 kb. Quon et al have previously tried to find an optimal window size for inclusion of cis acting SNPs for mQTL analysis of methylation data from the human brain generated with the Infinium HumanMethylation27 BeadChip [112]. Here, they propose that using a too large or too small cis window dramatically reduced the number of identified heritable loci. However, it should be noted that the optimal cis distance may vary in different tissues and cell types.
In our mQTL analysis, we took advantage of the sampling of DNA methylation across the genome to explore distribution of mQTLs in genomic regions based on relation to the nearest gene or in relation to the nearest CpG island. Interestingly, based on Illumina's annotations, we found an enrichment of significant cis-mQTLs in the gene body and intergenic regions, as well as in northern - and southern shores, southern shelf and open sea. Additionally, we found less significant cis-mQTLs than expected in CpG islands. Most of the previous mQTL analyses, which mainly cover DNA methylation data in CpG islands of promoter regions, have subsequently not been able to describe the genomic location of significant mQTLs [8], [9], [113]. However, our study suggests that DNA methylation in more CpG-depleted regions to a larger extent is regulated by genetic factors. These results confirm previous efforts from our group and others [12], [72], [91], [114]. Interestingly, a very recent study from our group shows that differentially methylated CpG sites in pancreatic islets from patients with type 2 diabetes compared to non-diabetic donors are also overrepresented in intergenic regions and the open sea while underrepresented in CpG islands [91]. These results are also in line with a previous global analysis of DNA methylation in adipose tissue from twins using the Illumina 450 K chip, where they showed that high variability of DNA methylation in the gene body and intergenic regions across individuals can be explained by regulation of genetic factors [12]. We further took advantage of the published mQTL data in adipose tissue from Grundberg et al [12] and analysed if the genomic distribution of their significant cis-mQTLs show a similar pattern to the findings in our study. Confirmative, significant cis-mQTLs in human adipose tissue were overrepresented in the intergenic region, the gene body, the open sea as well as the shore and shelf regions, while underrepresented in regions close to the TSS and CpG island regions based on Illumina's annotations. In agreement with the data in the present study, we have previously found that CpG sites with significantly altered methylation in human adipose tissue after an exercise intervention or based on type 2 diabetes are enriched in the gene body, intergenic region and open sea, while underrepresented in the CpG island region [72], [114]. Together, our genome-wide data point to a direction that variable CpG sites in the human genome are more frequently located outside CpG rich regions. Moreover, the role of DNA methylation seems to vary in context between different genomic elements, and although the function of DNA methylation in gene body and enhancer regions is less well studied compared to promoter methylation, DNA methylation in these genomic regions seems to be crucial for biological function and cell regulation [40]–[43], [66]. It is possible that CpG sites annotated to intergenic regions in our study overlap with enhancer regions and thereby involve distal gene regulatory elements. Moreover, CpG sites located within gene bodies or non-coding regions of a gene may overlap with enhancer elements for another distant gene [115]. Additionally, it has also been suggested that the relationship between gene body DNA methylation and expression is bell shaped and varies depending on the transcriptional activity of the gene, e.g. that high levels of gene body methylation are observed in genes with moderate expression levels while low levels of gene body methylation are observed in genes with low and high expression [116].
Although our mQTL analysis was performed in pancreatic islets of to date the largest cohort of human islet donors, our statistical power is limited compared to large genetic population studies. Nevertheless, after correction for multiple testing, we identified ∼67,000 significant SNP-CpG pairs in human islets which demonstrate a strong interaction between genetic and epigenetic mechanisms. It may seem surprising that we found such a large number of significant associations between SNPs and DNA methylation in human islets from 89 donors after correcting for multiple testing (e.g. we corrected for 102,307,720 tests in cis). However, our mQTL data in human islets are in line with previous mQTL analyses performed in human brain samples, where ∼8,000–12,000 significant SNP-CpG pairs were identified when DNA methylation of only ∼27,000 CpG sites was analyzed in approximately 100–150 samples [8], [9]. One should also keep in mind that ∼28% of common SNPs in the human genome either introduce or remove a CpG site [117]. These so called CpG-SNPs can have very strong effects on DNA methylation in human tissues [65]. They have also been shown to be biologically relevant [70], [118]–[125]. Altering the binding of certain proteins is one possible mechanism through which methylation in CpG-SNPs can affect gene expression. For example, a recent study showed that DNA methylation of a CpG site created by the G allele of a CpG-SNP located in the 5′UTR of the GDF5 gene altered the binding affinity for SP1 and SP3 repressor proteins which have a higher affinity to the unmethylated allele and this lead to an expression imbalance between both alleles [118]. Interestingly, another study identified a variant associated with alcohol dependence that introduces a CpG site in PDYN. Even though carriers of the T risk allele had the highest binding affinity for a protein that regulates PDYN expression positively the researchers found that increased DNA methylation of the non-risk C allele increased its binding affinity for this protein more than the non-methylated C allele but still less than the risk T allele. Methylation of the C allele resulted in increased PDYN expression and made it act similar to the risk allele, and it is possible that the increase in DNA methylation may be a consequence of alcohol consumption [119]. Additionally, our group has previously reported a CpG-SNP in the promoter of NDUFB6 that shows increased DNA methylation in skeletal muscle from elderly but not young subjects which resulted in reduced NDUFB6 expression and insulin-stimulated glucose uptake only in the elderly subjects [70]. This demonstrates that the phenotypic outcome of a CpG-SNP can result not only from genotypic differences but that even carriers of the same genotype can have a different phenotype depending on the degree of DNA methylation of the SNP site which can be influenced by lifestyle and age. Interestingly, a CpG-SNP in the promoter of CYP17A1 is associated with Oligoasthenoteratozoospermia and testosterone levels in infertile males and the degree of methylation in the SNP site was high in colon and stomach tissue while low in testis, kidney and adrenal gland [120]. The tissue specific DNA methylation pattern within the CpG-SNP site of CYP17A1 was further associated with high CYP17A1 expression in tissues with low methylation in the SNP site. In addition, intragenic CpG-SNPs can influence transcription elongation positively or negatively through alternative promoters or noncoding transcripts [121]–[123]. Methylation of a CpG-SNP can also play a role in the regulation of splicing by helping the splicing machinery to identify exons [124] or by affecting recombination rates [125]. Together, these studies support key biological functions of differential DNA methylation due to CpG-SNPs.
It should also be noted that previous human case-control studies [73], [91], [126] and human intervention studies [71], [72], [80] have identified quite a large number of significant differences in DNA methylation in cohorts with less than 100 samples. Together, these studies demonstrate that both genetic and environmental factors can have strong effects on the human methylome and that a large number of significant differences in methylation can be found in modest sample-sizes.
Epigenetic modifications are involved in the regulation of gene transcription [67]. However, no previous study has to our knowledge related DNA methylation data generated with the HumanMethylation450 BeadChip to genome-wide expression data. Here, we found direct associations between DNA methylation of 22,773 CpG sites and mRNA expression of 4,876 genes in human islets. Interestingly, ∼2/3 of the CpG sites that showed significant associations with mRNA expression were located upstream of a transcription start site. Additionally, 90% of the associations were negative when CpG sites were located in the region 1 kb upstream to 1 kb downstream of the transcription start site. These data are in line with our previous studies where we have shown that DNA methylation in promoter regions close to the transcription start site has direct negative effects on the transcriptional activity using luciferase assays [71], [72]. While methylation close to a transcription start site is known to block initiation of transcription, methylation in the gene body might contribute to transcriptional elongation [66]. In the present study, 35.4% of the associations between gene expression and DNA methylation of intragenic CpGs were positive. Associations between expression and methylation of CpGs located downstream of genes have not been studied in human genome-wide data. We found direct associations between expression and methylation of CpGs located downstream of genes, where 47.9% of the associations were negative. However, it remains to be tested if methylation downstream of a gene affects the transcriptional machinery. Additionally, for ∼70% of identified mQTLs affecting gene expression there was also a direct association between DNA methylation and gene expression in human islets, suggesting that altered DNA methylation in the mQTL has a direct impact on gene expression. The CIT further supported this hypothesis. Although, these novel data improve our understanding of the associations between DNA methylation and gene expression throughout the genome, additional studies are needed to examine if the genome-wide association-pattern between methylation and expression is tissue specific or general for multiple human tissues.
The key biological findings of our study include; i) the identification of a large number of SNPs with strong effects on DNA methylation in human pancreatic islets; ii) the discovery of SNPs previously known to affect diabetes and its related traits that affect DNA methylation in human pancreatic islets; iii) the first demonstration of how SNPs can mediate their effects on gene expression via altered DNA methylation in human pancreatic islets; iv) the strong genetic regulation of DNA methylation in genomic regions with low CpG density; and v) the illustration of how the genome-wide DNA methylation pattern correlates directly with gene expression in human pancreatic islets. Impaired insulin secretion is a hallmark of diabetes. Understanding gene regulation in human pancreatic islets is therefore essential for creating a full picture of diabetes and for optimal drug development. As the prevalence of diabetes is rapidly increasing worldwide, the need for new treatment strategies for diabetic patients is growing. New treatments may include epigenetic editing, where selected genes are targeted [127]. The results from our study may then be used to identify target genes for epigenetic editing. Additionally, a growing body of literature proposes that new therapeutic treatments for diabetes may target epigenetic mechanisms e.g. enzymes responsible for altering the epigenetic pattern in target tissues for the disease [128], [129]. Importantly, our study shows that subjects at risk for diabetes, by carrying genetic risk variants for the disease, have altered DNA methylation in their pancreatic islets, and future therapeutics targeting epigenetic modifications may potentially reduce the risk for diabetes in these subjects.
In conclusion, we describe for the first time genome-wide interactions between genetic and epigenetic variation in human pancreatic islets. We show that interactions of these regulatory mechanisms can influence islet mRNA expression, islet function and potentially diabetes risk. Our results demonstrate the importance of considering epigenetics when studying the impact of genetic variation on phenotypic outcomes and human complex diseases. All together, these data can serve as a reference for future studies further dissecting the impact of genetic variation on epigenetic traits as well as for the understanding of epigenetic regulation of biological mechanisms.
Methods
Ethics statement
The pancreatic islet donor or her/his relatives had given their written or oral informed consent to donate organs for medical research upon admission to intensive care unit. All procedures were approved by ethics committees at Uppsala and Lund Universities.
Sample information
Pancreatic islets from 89 human donors not diagnosed with diabetes mellitus were obtained from the Nordic Network for Islets Transplantation, Uppsala University, Sweden (Table S1). This islet cohort is a resource within the human tissue laboratory of Lund University Diabetes Center (http://www.ludc.med.lu.se/platforms/human-tissue-laboratory/) and data from this cohort has previously been described [91], [130]–[132]. Islets were prepared and cultured for 4.0±0.2 days prior to RNA and DNA isolation as previously described [68]. AllPrep DNA/RNA Mini Kit was used for islet DNA and RNA isolation (Qiagen GmbH, Hilden, Germany) and concentrations and quality were measured with NanoDrop ND-1000 spectrophotometer (NanoDrop Technologies, Wilmington, DE). Islet purity was 75±0.8% [133]. Glucose-stimulated insulin secretion was measured as stimulation index as previously described [134].
Genotype data
Genome-wide genotyping was performed on DNA (200 ng) from 89 islet donors using the HumanOmniExpressBeadChip, which covers 731,412 SNPs and the iScan system (Illumina, Inc. CA) according to the Illumina protocol. Genotype calling was done with GenomeStudio software (Illumina). Quality control of genotype data was performed by PLINK software toolset [135]. All subjects passed the call rate threshold of >98% for inclusion. No gender discrepancy between the supplied donor information and the genotypic gender was detected. In population stratification analysis, no sample was highlighted as a population outlier supporting a homogenous ethnic make-up of the included islet donors. No donors were found to be related. SNP data were excluded from subsequent analysis based on following criteria's: call rate <98%; monomorphic SNPs; MAF<0.05; HWE<0.001; SNPs located on X and Y chromosomes due to bias of mixed gender population or with missing position. In total 574,553 SNPs passed quality control.
DNA methylation analysis
Genome-wide DNA methylation profiling in pancreatic islets from the 89 human donors was assessed using the Infinium HumanMethylation450 BeadChip [39] (Illumina, Inc.), which analyzes DNA methylation in 482,421 CpG sites that cover 21,231 genes (99% of RefSeq genes) and all genomic regions [39]. DNA (500 ng) from pancreatic islets was bisulfite treated with the EZ DNA methylation kit (Zymo Research, Orange, CA) and used for analysis of DNA methylation with Infinium assay according to the standard protocol (User Guide part #15019519). BeadChips were imaged with Illumina iScan. All samples had an acceptable bisulfite conversion efficiency (intensity values >4000) [136] and passed quality control steps in GenomeStudio where built in control probes for staining, hybridization, extension and specificity were examined.
Subsequent analyses were performed using the lumi package from Bioconductor [137]. Methylation Beta-values were converted to M-values (M = log2(Beta/(1-Beta))) [138] and these were used for all statistical analysis. However, Beta-values were included in the final report for its biological interpretation (Beta = 2M/(2M+1)) [138]. Probes were then filtered and all CpG sites with a mean detection P-value<0.01 were considered detected and used for subsequent analysis. The methylation data were background corrected by subtracting the median intensities of built in negative controls and then normalized using quantile normalization [137], [139]. COMBAT was used to correct for batch effects [140]. While a strong batch effect could be identified before COMBAT was applied (P = 7.5×10⁻⁶ for correlation between batch and the 1st component in a principal component analysis), there was no longer any identified batch effect after COMBAT (P>0.05 for the correlation between batch and first 10 principal components). After preprocessing of methylation data and exclusion of CpG sites located on X and Y chromosomes due to bias of mixed gender population, we obtained DNA methylation data for 468,787 CpG sites from human pancreatic islets. Probes reported to be cross-reactive (≥47 bases) or SNPs within underlying probe sequence, according to Chen et al. (2013) [33], are indicated in Table S2 and Table S3. Based on the important role of CpG-SNPs on DNA methylation [65], probes with potential SNPs in the probe sequence were not filtered out from the mQTL analysis. The overall variability in DNA methylation from all 89 donors is illustrated in Figure S1.
mRNA expression analysis
mRNA expression in pancreatic islets from 89 donors was analyzed genome-wide using the GeneChip Human Gene 1.0 ST array (Affymetrix, Santa Clara, CA) as previously described [133]. The array data was summarized and normalized using the Robust Multi-Array analysis method with the oligo package from Bioconductor. Gene transcripts with missing annotation or located on X and Y chromosomes were excluded from the dataset. COMBAT was used to correct for batch effects [140]. In total, mRNA expression of 27,391 transcripts was obtained for further analysis. The overall variability in mRNA expression from all 89 donors is illustrated in Figure S3.
Methylation quantitative trait loci (mQTL) analysis
To test for associations between SNPs and DNA methylation, a linear regression model with biological covariates was used. In the linear model; DNA methylation values were used as the quantitative trait, SNP genotypes were encoded as 0, 1 or 2 according to the number of minor alleles, and the categorical variable gender as well as the continuous variables age, BMI, HbA1c, islet purity and islet culture days were included as covariates. The analysis was based on an additive genetic model. To distinguish between local (cis-) and distant (trans-) mQTLs, an arbitrary boundary with the maximum distance of 500 kb between SNPs and CpG sites were used to define cis-mQTLs. All other SNP-CpG pairs were considered as trans-mQTLs. The mQTL analysis was performed by using the R package Matrix eQTL [141]. P-values were adjusted with a correction value for multiple testing, which takes into consideration the dependency of linkage disequilibrium (LD) between SNPs by LD based pruning and thereby uses the number of independent tests. In the cis-analysis, LD based pruning of SNPs within a distance of 500 kb from a CpG site was performed by pairwise-tagging (r2<0.9) and the total sum of all tagSNPs connected to each CpG site was used as a correction value when correcting for multiple testing. LD calculations were performed using R trio package (http://www.bioconductor.org/packages/release/bioc/html/trio.html). The correction value for the trans-analysis was calculated as the total number of analyzed CpG sites multiplied by the number of all tagSNPs in the whole dataset (pairwise-tagging r2<0.9) and subtracted by the correction value for the cis-analysis. Significance threshold was set to P<0.05 after correction for multiple testing.
Expression quantitative trait loci (eQTL) analysis of SNPs identified in the mQTL
To test for associations between SNPs and mRNA expression, an eQTL analysis in the human pancreatic islets including the significant SNPs found to be associated with DNA methylation in the cis - or trans-mQTL analyses were performed. In the eQTL analyses, significant SNPs identified in the cis-mQTL analysis were related to expression of genes in cis (≤500 kb between SNP and mRNA transcripts); meanwhile, significant SNPs identified in the trans-mQTL were related to expression of all analyzed genes (no distance limit). To test for associations between SNPs and mRNA expression a linear regression assuming an additive genetic model was used. mRNA expression values were used as quantitative trait, SNP genotypes were encoded as 0, 1 or 2 according to the number of minor alleles, and the categorical variable gender as well as the continuous variables age, BMI, HbA1c, islet purity and islet culture days were included as covariates. In the eQTL analysis of significant cis-mQTL SNPs, the correction value for multiple testing was calculated by the total sum of tagSNPs within 500 kb to each mRNA transcript in the dataset, where LD pruning of SNPs within a distance of 500 kb from a mRNA transcript was performed by pairwise-tagging with r2<0.9. The correction value for multiple testing for the eQTL analysis of significant trans-mQTL SNPs was calculated by the number of tagSNPs (LD pruning of included SNPs by pairwise tagging with r2<0.9) multiplied by the number of analyzed mRNA transcripts.
Gene ontology and pathway analyses
Enrichment of gene ontology and/or biological pathways assigned by KEGG was tested among the genes significantly identified in the mQTL and eQTL analyses using Webgestalt (http://bioinfo.vanderbilt.edu/webgestalt, March 2013). The full dataset of analyzed genes in respective mQTL and eQTL analysis was used as background reference. P-values for the KEGG pathway analyses were adjusted for multiple testing using the Benjamini-Hochberg method.
RNA interference of Gstt1, Gpx7 and Snx19 in clonal β-cells
Genes were silenced by siRNA transfection into 832/13 INS-1 β-cells [142] with Dharmafect I (Thermo Scientific, Waltham, MA) according to the manufacturer's instructions. siRNAs (LifeTechnologies, Paisley, UK) used were s151334 (Gpx7), s129302 (Gstt1), and s164019 (Snx19). RNA was isolated 72 h post transfection with the RNeasy Plus mini kit (Qiagen) and converted to cDNA with the RevertAid First Strand cDNA Synthesis kit (Thermo Scientific). Knockdown was quantified by qPCR with the following TaqMan assays (Life Technologies); Rn01416464_m1 (Gpx7), Rn00583932_m1 (Gstt1), and Rn01524775_m1 (Snx19). Assays for Cyclophilin B (Rn03302274_m1) and Hprt1 (Rn01527840_m1) were used as endogenous controls. Quantification was done with the ΔΔCt method.
Proliferation/apoptosis measurements in clonal β-cells
β-cell number was quantified 72 h post transfection by crystal violet staining as previously described [143], except we used a 0.1% crystal violet solution and read absorbance at 600 nm. The combined activity of caspase-3 and -7 was determined 72 h post transfection with the Apo-One Homogenous Caspase-3/7 assay (Promega, Madison, WI). Lipotoxicity was induced as previously described [144].
Associations of identified mQTL/eQTL SNPs with islet insulin secretion
To examine if SNPs identified in the mQTL/eQTL analyses were associated with glucose-stimulated insulin secretion in human pancreatic islets cultured in vitro, linear regression analyses assuming additive models adjusted for age, sex and BMI were performed. Glucose-stimulated insulin secretion, measured as stimulation index [134], was naturally log transformed before analysis.
Causal inference test (CIT)
A statistical hypothesis test called CIT [32] was used to distinguish if associations between genotype of SNPs identified in the mQTL analysis and phenotype (gene expression and islet insulin secretion) was potentially mediated by DNA methylation of CpG sites. Each of the genotype (G), methylation (M) and phenotype (Y) relationships were assessed using CIT to classify them as causal (methylation mediated), reactive (methylation consequential) or independent [32]. The statistical test of CIT is based on four mathematical conditions which must be satisfied for the definition of causality: 1) G and Y are associated, 2) G is associated with M after adjusting for Y, 3) M is associated with Y after adjusting for G and 4) G is independent of Y after adjusting for M [32]. A causal call with a hypothesis P-value<0.05 suggests that DNA methylation of a CpG site is a potential mediator between a SNP and phenotype.
Overlap between identified mQTL/eQTL SNPs and reported diabetes SNPs
The catalog of published genome-wide association studies (GWAS) (www.genome.gov/gwastudies, accessed March 2013) [57] was used to search for SNPs reported to be significantly associated (P<10−6) with type 1 - and/or type 2 diabetes or diabetes related traits as well as breast cancer, stroke and hypothyroidism used as evaluation references. To gain better reference coverage in the overlap between reported SNPs in the GWAS catalog and identified mQTL/eQTL SNPs in the islets, a SNP annotation and proxy (SNAP) [58] search was performed to identify SNPs in LD with the identified mQTL/eQTL SNPs. The search of LD SNPs was based on pairwise LD calculations of genotype data from the 1000 Genomes project of the CEU population panel, with r2 threshold >0.8 and a distance limit of 500 kb from the query SNP. The published diabetes SNPs from the GWAS catalog were then merged with the identified mQTL/eQTL SNPs, together with LD SNPs, to search for overlap between the two datasets.
Publicly available data from the DIAGRAM consortium and MAGIC investigators were also used to look for overlap between identified mQTL-SNPs and SNPs showing associations with diabetes or related traits (P<0.05).
Associations between DNA methylation and mRNA expression
To test if DNA methylation is directly associated with gene expression in human pancreatic islets, we performed a linear regression between DNA methylation of CpG sites and mRNA transcripts in cis (500 kb up - and 100 kb downstream of respective gene), including age, gender, BMI, HbA1c, islet purity, days in culture and batch as covariates.
Analysis of DNA methylation with Pyrosequencing
Pyrosequencing was used to biologically validate the mQTL data for methylation of two CpG sites annotated to GPX7 (cg18087326) and SNX19 (cg08912652). EpiTect Bisulfite Kit (Qiagen) was used for bisulfite conversion of human islet DNA. The PyroMark Assay design Software 2.0 (Qiagen) was used for primer design. PyroSequencing assays (PCR primers and sequencing primer) for the selected CpG sites (Qiagen) can be found in Table S23. The PyroMark PCR kit was used for amplification of bisulfite converted DNA. The PyroMark ID 96 and PyroMark Gold Q96 reagents were used for pyrosequencing (Qiagen) according to the manufacturer's instructions. Data were analyzed with the PyroMark Q96 2.5.7 software program.
Imputation of genotype data
Autosomal genotype data generated with the HumanOmniExpressBeadChip and which passed quality control for the 89 islet donors was imputed to 1000 Genomes phase 1 using Shapeit [145] for phasing and Impute2 for imputation [146]. Imputed data were then filtered based on MAF<0.05 and HWE<0.001.
Statistical methods
Results are expressed as mean ± sd/sem or Box and Whisker plots. Data were analyzed using linear regression models or Student's t-test. T-statistics are reported from the linear regression analysis, where a t-statistic is defined as the effect size estimate (slope coefficient) divided by its standard error.
Supporting Information
Zdroje
1. BirdA (2002) DNA methylation patterns and epigenetic memory. Genes Dev 16 : 6–21.
2. ListerR, PelizzolaM, DowenRH, HawkinsRD, HonG, et al. (2009) Human DNA methylomes at base resolution show widespread epigenomic differences. Nature 462 : 315–322.
3. RobertsonKD, WolffeAP (2000) DNA methylation in health and disease. Nat Rev Genet 1 : 11–19.
4. ChongS, WhitelawE (2004) Epigenetic germline inheritance. Curr Opin Genet Dev 14 : 692–696.
5. AnwayMD, CuppAS, UzumcuM, SkinnerMK (2005) Epigenetic transgenerational actions of endocrine disruptors and male fertility. Science 308 : 1466–1469.
6. KaminskyZA, TangT, WangSC, PtakC, OhGH, et al. (2009) DNA methylation profiles in monozygotic and dizygotic twins. Nat Genet 41 : 240–245.
7. OllikainenM, SmithKR, JooEJ, NgHK, AndronikosR, et al. (2010) DNA methylation analysis of multiple tissues from newborn twins reveals both genetic and intrauterine components to variation in the human neonatal epigenome. Hum Mol Genet 19 : 4176–4188.
8. ZhangD, ChengL, BadnerJA, ChenC, ChenQ, et al. (2010) Genetic control of individual differences in gene-specific methylation in human brain. Am J Hum Genet 86 : 411–419.
9. GibbsJR, van der BrugMP, HernandezDG, TraynorBJ, NallsMA, et al. (2010) Abundant quantitative trait loci exist for DNA methylation and gene expression in human brain. PLoS Genet 6: e1000952.
10. NumataS, YeT, HydeTM, Guitart-NavarroX, TaoR, et al. (2012) DNA methylation signatures in development and aging of the human prefrontal cortex. Am J Hum Genet 90 : 260–272.
11. DrongAW, NicholsonG, HedmanAK, MeduriE, GrundbergE, et al. (2013) The presence of methylation quantitative trait loci indicates a direct genetic influence on the level of DNA methylation in adipose tissue. PLoS One 8: e55923.
12. GrundbergE, MeduriE, SandlingJK, HedmanAK, KeildsonS, et al. (2013) Global analysis of DNA methylation variation in adipose tissue from twins reveals links to disease-associated variants in distal regulatory elements. Am J Hum Genet 93 : 876–890.
13. Gutierrez-ArcelusM, LappalainenT, MontgomerySB, BuilA, OngenH, et al. (2013) Passive and active DNA methylation and the interplay with genetic variation in gene regulation. eLife 2: e00523.
14. WagnerJR, BuscheS, GeB, KwanT, PastinenT, et al. (2014) The relationship between DNA methylation, genetic and expression inter-individual variation in untransformed human fibroblasts. Genome Biol 15: R37.
15. BarrettJC, ClaytonDG, ConcannonP, AkolkarB, CooperJD, et al. (2009) Genome-wide association study and meta-analysis find that over 40 loci affect risk of type 1 diabetes. Nat Genet 41 : 703–707.
16. BradfieldJP, QuHQ, WangK, ZhangH, SleimanPM, et al. (2011) A genome-wide meta-analysis of six type 1 diabetes cohorts identifies multiple associated loci. PLoS Genet 7: e1002293.
17. BurrenOS, AdlemEC, AchuthanP, ChristensenM, CoulsonRM, et al. (2011) T1DBase: update 2011, organization and presentation of large-scale data sets for type 1 diabetes research. Nucleic Acids Res 39: D997–1001.
18. FungEY, SmythDJ, HowsonJM, CooperJD, WalkerNM, et al. (2009) Analysis of 17 autoimmune disease-associated variants in type 1 diabetes identifies 6q23/TNFAIP3 as a susceptibility locus. Genes Immun 10 : 188–191.
19. GrantSF, QuHQ, BradfieldJP, MarchandL, KimCE, et al. (2009) Follow-up analysis of genome-wide association data identifies novel loci for type 1 diabetes. Diabetes 58 : 290–295.
20. GroopL, PociotF (2013) Genetics of diabetes - Are we missing the genes or the disease? Mol Cell Endocrinol 382 : 726–739.
21. HakonarsonH, GrantSF, BradfieldJP, MarchandL, KimCE, et al. (2007) A genome-wide association study identifies KIAA0350 as a type 1 diabetes gene. Nature 448 : 591–594.
22. LoweCE, CooperJD, BruskoT, WalkerNM, SmythDJ, et al. (2007) Large-scale genetic fine mapping and genotype-phenotype associations implicate polymorphism in the IL2RA region in type 1 diabetes. Nat Genet 39 : 1074–1082.
23. PociotF, AkolkarB, ConcannonP, ErlichHA, JulierC, et al. (2010) Genetics of type 1 diabetes: what's next? Diabetes 59 : 1561–1571.
24. QuHQ, GrantSF, BradfieldJP, KimC, FrackeltonE, et al. (2009) Association of RASGRP1 with type 1 diabetes is revealed by combined follow-up of two genome-wide studies. J Med Genet 46 : 553–554.
25. SaxenaR, VoightBF, LyssenkoV, BurttNP, de BakkerPI, et al. (2007) Genome-wide association analysis identifies loci for type 2 diabetes and triglyceride levels. Science 316 : 1331–1336.
26. ScottLJ, MohlkeKL, BonnycastleLL, WillerCJ, LiY, et al. (2007) A genome-wide association study of type 2 diabetes in Finns detects multiple susceptibility variants. Science 316 : 1341–1345.
27. SladekR, RocheleauG, RungJ, DinaC, ShenL, et al. (2007) A genome-wide association study identifies novel risk loci for type 2 diabetes. Nature 445 : 881–885.
28. SteinthorsdottirV, ThorleifssonG, ReynisdottirI, BenediktssonR, JonsdottirT, et al. (2007) A variant in CDKAL1 influences insulin response and risk of type 2 diabetes. Nat Genet 39 : 770–775.
29. ZegginiE, WeedonMN, LindgrenCM, FraylingTM, ElliottKS, et al. (2007) Replication of genome-wide association signals in UK samples reveals risk loci for type 2 diabetes. Science 316 : 1336–1341.
30. ProkopenkoI, PoonW, MagiR, PrasadBR, SalehiSA, et al. (2014) A central role for GRB10 in regulation of islet function in man. PLoS Genet 10: e1004235.
31. VoightBF, ScottLJ, SteinthorsdottirV, MorrisAP, DinaC, et al. (2010) Twelve type 2 diabetes susceptibility loci identified through large-scale association analysis. Nat Genet 42 : 579–589.
32. MillsteinJ, ZhangB, ZhuJ, SchadtEE (2009) Disentangling molecular relationships with a causal inference test. BMC Genet 10 : 23.
33. ChenYA, LemireM, ChoufaniS, ButcherDT, GrafodatskayaD, et al. (2013) Discovery of cross-reactive probes and polymorphic CpGs in the Illumina Infinium HumanMethylation450 microarray. Epigenetics 8 : 203–209.
34. DoiA, ParkIH, WenB, MurakamiP, AryeeMJ, et al. (2009) Differential methylation of tissue - and cancer-specific CpG island shores distinguishes human induced pluripotent stem cells, embryonic stem cells and fibroblasts. Nat Genet 41 : 1350–1353.
35. IrizarryRA, Ladd-AcostaC, WenB, WuZ, MontanoC, et al. (2009) The human colon cancer methylome shows similar hypo - and hypermethylation at conserved tissue-specific CpG island shores. Nat Genet 41 : 178–186.
36. LindgrenCM, MahtaniMM, WidenE, McCarthyMI, DalyMJ, et al. (2002) Genomewide search for type 2 diabetes mellitus susceptibility loci in Finnish families: the Botnia study. American journal of human genetics 70 : 509–516.
37. PociotF, McDermottMF (2002) Genetics of type 1 diabetes mellitus. Genes Immun 3 : 235–249.
38. ShiinaT, InokoH, KulskiJK (2004) An update of the HLA genomic region, locus information and disease associations: 2004. Tissue Antigens 64 : 631–649.
39. BibikovaM, BarnesB, TsanC, HoV, KlotzleB, et al. (2011) High density DNA methylation array with single CpG site resolution. Genomics 98 : 288–295.
40. YangBT, DayehTA, VolkovPA, KirkpatrickCL, MalmgrenS, et al. (2012) Increased DNA methylation and decreased expression of PDX-1 in pancreatic islets from patients with type 2 diabetes. Mol Endocrinol 26 : 1203–1212.
41. SandoviciI, SmithNH, NitertMD, Ackers-JohnsonM, Uribe-LewisS, et al. (2011) Maternal diet and aging alter the epigenetic control of a promoter-enhancer interaction at the Hnf4a gene in rat pancreatic islets. Proc Natl Acad Sci U S A 108 : 5449–5454.
42. ParkerSC, StitzelML, TaylorDL, OrozcoJM, ErdosMR, et al. (2013) Chromatin stretch enhancer states drive cell-specific gene regulation and harbor human disease risk variants. Proc Natl Acad Sci U S A 110 : 17921–17926.
43. PasqualiL, GaultonKJ, Rodriguez-SeguiSA, MularoniL, Miguel-EscaladaI, et al. (2014) Pancreatic islet enhancer clusters enriched in type 2 diabetes risk-associated variants. Nat Genet 46 : 136–143.
44. BirdA (2007) Perceptions of epigenetics. Nature 447 : 396–398.
45. GiladY, RifkinSA, PritchardJK (2008) Revealing the architecture of gene regulation: the promise of eQTL studies. Trends Genet 24 : 408–415.
46. MantelN (1967) The detection of disease clustering and a generalized regression approach. Cancer research 27 : 209–220.
47. BekrisLM, ShephardC, PetersonM, HoehnaJ, Van YserlooB, et al. (2005) Glutathione-s-transferase M1 and T1 polymorphisms and associations with type 1 diabetes age-at-onset. Autoimmunity 38 : 567–575.
48. CircuML, AwTY (2008) Glutathione and apoptosis. Free Radic Res 42 : 689–706.
49. RobertsonRP, HarmonJS (2007) Pancreatic islet beta-cell and oxidative stress: the importance of glutathione peroxidase. FEBS Lett 581 : 3743–3748.
50. HarashimaSI, HarashimaC, NishimuraT, HuY, NotkinsAL (2007) Overexpression of the autoantigen IA-2 puts beta cells into a pre-apoptotic state: autoantigen-induced, but non-autoimmune-mediated, tissue destruction. Clin Exp Immunol 150 : 49–60.
51. NguyenVD, SaaranenMJ, KaralaAR, LappiAK, WangL, et al. (2011) Two endoplasmic reticulum PDI peroxidases increase the efficiency of the use of peroxide during disulfide bond formation. J Mol Biol 406 : 503–515.
52. PengD, BelkhiriA, HuT, ChaturvediR, AsimM, et al. (2012) Glutathione peroxidase 7 protects against oxidative DNA damage in oesophageal cells. Gut 61 : 1250–1260.
53. UtomoA, JiangX, FurutaS, YunJ, LevinDS, et al. (2004) Identification of a novel putative non-selenocysteine containing phospholipid hydroperoxide glutathione peroxidase (NPGPx) essential for alleviating oxidative stress generated from polyunsaturated fatty acids in breast cancer cells. J Biol Chem 279 : 43522–43529.
54. LuJ, LiQ, XieH, ChenZJ, BorovitskayaAE, et al. (1996) Identification of a second transmembrane protein tyrosine phosphatase, IA-2beta, as an autoantigen in insulin-dependent diabetes mellitus: precursor of the 37-kDa tryptic fragment. Proc Natl Acad Sci U S A 93 : 2307–2311.
55. NotkinsAL, LernmarkA (2001) Autoimmune type 1 diabetes: resolved and unresolved issues. J Clin Invest 108 : 1247–1252.
56. McCarthyMI (2010) Genomics, type 2 diabetes, and obesity. N Engl J Med 363 : 2339–2350.
57. HindorffLA, SethupathyP, JunkinsHA, RamosEM, MehtaJP, et al. (2009) Potential etiologic and functional implications of genome-wide association loci for human diseases and traits. Proc Natl Acad Sci U S A 106 : 9362–9367.
58. JohnsonAD, HandsakerRE, PulitSL, NizzariMM, O'DonnellCJ, et al. (2008) SNAP: a web-based tool for identification and annotation of proxy SNPs using HapMap. Bioinformatics 24 : 2938–2939.
59. MorrisAP, VoightBF, TeslovichTM, FerreiraT, SegreAV, et al. (2012) Large-scale association analysis provides insights into the genetic architecture and pathophysiology of type 2 diabetes. Nat Genet 44 : 981–990.
60. DupuisJ, LangenbergC, ProkopenkoI, SaxenaR, SoranzoN, et al. (2010) New genetic loci implicated in fasting glucose homeostasis and their impact on type 2 diabetes risk. Nat Genet 42 : 105–116.
61. SaxenaR, HivertMF, LangenbergC, TanakaT, PankowJS, et al. (2010) Genetic variation in GIPR influences the glucose and insulin responses to an oral glucose challenge. Nat Genet 42 : 142–148.
62. SoranzoN, SannaS, WheelerE, GiegerC, RadkeD, et al. (2010) Common variants at 10 genomic loci influence hemoglobin A(1)(C) levels via glycemic and nonglycemic pathways. Diabetes 59 : 3229–3239.
63. StrawbridgeRJ, DupuisJ, ProkopenkoI, BarkerA, AhlqvistE, et al. (2011) Genome-wide association identifies nine common variants associated with fasting proinsulin levels and provides new insights into the pathophysiology of type 2 diabetes. Diabetes 60 : 2624–2634.
64. ManningAK, HivertMF, ScottRA, GrimsbyJL, Bouatia-NajiN, et al. (2012) A genome-wide approach accounting for body mass index identifies genetic variants influencing fasting glycemic traits and insulin resistance. Nat Genet 44 : 659–669.
65. DayehTA, OlssonAH, VolkovP, AlmgrenP, RonnT, et al. (2013) Identification of CpG-SNPs associated with type 2 diabetes and differential DNA methylation in human pancreatic islets. Diabetologia 56 : 1036–1046.
66. JonesPA (2012) Functions of DNA methylation: islands, start sites, gene bodies and beyond. Nat Rev Genet 13 : 484–492.
67. LingC, GroopL (2009) Epigenetics: a molecular link between environmental factors and type 2 diabetes. Diabetes 58 : 2718–2725.
68. YangBT, DayehTA, KirkpatrickCL, TaneeraJ, KumarR, et al. (2011) Insulin promoter DNA methylation correlates negatively with insulin gene expression and positively with HbA(1c) levels in human pancreatic islets. Diabetologia 54 : 360–367.
69. LingC, Del GuerraS, LupiR, RonnT, GranhallC, et al. (2008) Epigenetic regulation of PPARGC1A in human type 2 diabetic islets and effect on insulin secretion. Diabetologia 51 : 615–622.
70. LingC, PoulsenP, SimonssonS, RonnT, HolmkvistJ, et al. (2007) Genetic and epigenetic factors are associated with expression of respiratory chain component NDUFB6 in human skeletal muscle. J Clin Invest 117 : 3427–3435.
71. NitertMD, DayehT, VolkovP, ElgzyriT, HallE, et al. (2012) Impact of an exercise intervention on DNA methylation in skeletal muscle from first-degree relatives of patients with type 2 diabetes. Diabetes 61 : 3322–3332.
72. RonnT, VolkovP, DavegardhC, DayehT, HallE, et al. (2013) A Six Months Exercise Intervention Influences the Genome-wide DNA Methylation Pattern in Human Adipose Tissue. PLoS Genet 9: e1003572.
73. VolkmarM, DedeurwaerderS, CunhaDA, NdlovuMN, DefranceM, et al. (2012) DNA methylation profiling identifies epigenetic dysregulation in pancreatic islets from type 2 diabetic patients. EMBO J 31 : 1405–1426.
74. ToddJA, WalkerNM, CooperJD, SmythDJ, DownesK, et al. (2007) Robust associations of four new chromosome regions from genome-wide analyses of type 1 diabetes. Nat Genet 39 : 857–864.
75. MooreF, ColliML, CnopM, EsteveMI, CardozoAK, et al. (2009) PTPN2, a candidate gene for type 1 diabetes, modulates interferon-gamma-induced pancreatic beta-cell apoptosis. Diabetes 58 : 1283–1291.
76. Wellcome Trust Case Control Consortium (2007) Genome-wide association study of 14,000 cases of seven common diseases and 3,000 shared controls. Nature 447 : 661–678.
77. SmythDJ, PlagnolV, WalkerNM, CooperJD, DownesK, et al. (2008) Shared and distinct genetic variants in type 1 diabetes and celiac disease. N Engl J Med 359 : 2767–2777.
78. de BakkerPI, McVeanG, SabetiPC, MirettiMM, GreenT, et al. (2006) A high-resolution HLA and SNP haplotype map for disease association studies in the extended human MHC. Nat Genet 38 : 1166–1172.
79. ZegginiE, ScottLJ, SaxenaR, VoightBF, MarchiniJL, et al. (2008) Meta-analysis of genome-wide association data and large-scale replication identifies additional susceptibility loci for type 2 diabetes. Nat Genet 40 : 638–645.
80. JacobsenSC, BronsC, Bork-JensenJ, Ribel-MadsenR, YangB, et al. (2012) Effects of short-term high-fat overfeeding on genome-wide DNA methylation in the skeletal muscle of healthy young men. Diabetologia 55 : 3341–3349.
81. GillbergL, JacobsenSC, RonnT, BronsC, VaagA (2014) PPARGC1A DNA methylation in subcutaneous adipose tissue in low birth weight subjects - impact of 5days of high-fat overfeeding. Metabolism 63 : 263–271.
82. BronsC, JacobsenS, NilssonE, RonnT, JensenCB, et al. (2010) Deoxyribonucleic acid methylation and gene expression of PPARGC1A in human muscle is influenced by high-fat overfeeding in a birth-weight-dependent manner. J Clin Endocrinol Metab 95 : 3048–3056.
83. FlorezJC (2008) Newly identified loci highlight beta cell dysfunction as a key cause of type 2 diabetes: where are the insulin resistance genes? Diabetologia 51 : 1100–1110.
84. RosengrenAH, BraunM, MahdiT, AnderssonSA, TraversME, et al. (2012) Reduced insulin exocytosis in human pancreatic beta-cells with gene variants linked to type 2 diabetes. Diabetes 61 : 1726–1733.
85. RuchatSM, ElksCE, LoosRJ, VohlMC, WeisnagelSJ, et al. (2009) Association between insulin secretion, insulin sensitivity and type 2 diabetes susceptibility variants identified in genome-wide association studies. Acta Diabetol 46 : 217–226.
86. CooperJD, SmythDJ, SmilesAM, PlagnolV, WalkerNM, et al. (2008) Meta-analysis of genome-wide association study data identifies additional type 1 diabetes risk loci. Nat Genet 40 : 1399–1401.
87. PerryJR, VoightBF, YengoL, AminN, DupuisJ, et al. (2012) Stratifying type 2 diabetes cases by BMI identifies genetic risk variants in LAMA1 and enrichment for risk variants in lean compared to obese cases. PLoS Genet 8: e1002741.
88. SantinI, EizirikDL (2013) Candidate genes for type 1 diabetes modulate pancreatic islet inflammation and beta-cell apoptosis. Diabetes Obes Metab 15 Suppl 3 : 71–81.
89. KanetoH, MiyatsukaT, KawamoriD, YamamotoK, KatoK, et al. (2008) PDX-1 and MafA play a crucial role in pancreatic beta-cell differentiation and maintenance of mature beta-cell function. Endocr J 55 : 235–252.
90. DuttaS, GannonM, PeersB, WrightC, Bonner-WeirS, et al. (2001) PDX:PBX complexes are required for normal proliferation of pancreatic cells during development. Proc Natl Acad Sci U S A 98 : 1065–1070.
91. DayehT, VolkovP, SaloS, HallE, NilssonE, et al. (2014) Genome-wide DNA methylation analysis of human pancreatic islets from type 2 diabetic and non-diabetic donors identifies candidate genes that influence insulin secretion. PLoS Genet 10: e1004160.
92. CaromileLA, OganesianA, CoatsSA, SeifertRA, Bowen-PopeDF (2010) The neurosecretory vesicle protein phogrin functions as a phosphatidylinositol phosphatase to regulate insulin secretion. J Biol Chem 285 : 10487–10496.
93. DoiA, ShonoT, NishiM, FurutaH, SasakiH, et al. (2006) IA-2beta, but not IA-2, is induced by ghrelin and inhibits glucose-stimulated insulin secretion. Proc Natl Acad Sci U S A 103 : 885–890.
94. CaiT, HiraiH, ZhangG, ZhangM, TakahashiN, et al. (2011) Deletion of Ia-2 and/or Ia-2beta in mice decreases insulin secretion by reducing the number of dense core vesicles. Diabetologia 54 : 2347–2357.
95. ToriiS, SaitoN, KawanoA, HouN, UekiK, et al. (2009) Gene silencing of phogrin unveils its essential role in glucose-responsive pancreatic beta-cell growth. Diabetes 58 : 682–692.
96. LiuY, AryeeMJ, PadyukovL, FallinMD, HesselbergE, et al. (2013) Epigenome-wide association data implicate DNA methylation as an intermediary of genetic risk in rheumatoid arthritis. Nat Biotechnol 31 : 142–147.
97. StorlingJ, OvergaardAJ, BrorssonCA, PivaF, Bang-BerthelsenCH, et al. (2013) Do post-translational beta cell protein modifications trigger type 1 diabetes? Diabetologia 56 : 2347–2354.
98. KellyC, McClenaghanNH, FlattPR (2011) Role of islet structure and cellular interactions in the control of insulin secretion. Islets 3 : 41–47.
99. SabraG, DubielEA, KuehnC, KhalfaouiT, BeaulieuJF, et al. (2013) INS-1 cell glucose-stimulated insulin secretion is reduced by the downregulation of the 67 kDa laminin receptor. Journal of tissue engineering and regenerative medicine 10.1002/term.1689.
100. SmithGC, KonychevaG, DziadekMA, RavelichSR, PatelS, et al. (2011) Pre - and postnatal methyl deficiency in the rat differentially alters glucose homeostasis. Journal of nutrigenetics and nutrigenomics 4 : 175–191.
101. CnopM, WelshN, JonasJC, JornsA, LenzenS, et al. (2005) Mechanisms of pancreatic beta-cell death in type 1 and type 2 diabetes: many differences, few similarities. Diabetes 54 Suppl 2: S97–107.
102. LernmarkA, LarssonHE (2013) Immune therapy in type 1 diabetes mellitus. Nat Rev Endocrinol 9 : 92–103.
103. YangSN, BerggrenPO (2005) Beta-cell CaV channel regulation in physiology and pathophysiology. Am J Physiol Endocrinol Metab 288: E16–28.
104. CalderonB, CarreroJA, UnanueER (2014) The central role of antigen presentation in islets of Langerhans in autoimmune diabetes. Current opinion in immunology 26 : 32–40.
105. GuoY, ZhuLR, LuG, WangH, HongJY (2012) Selective expression of CYP2A13 in human pancreatic alpha-islet cells. Drug metabolism and disposition: the biological fate of chemicals 40 : 1878–1882.
106. In't VeldPA, PipeleersDG (1988) In situ analysis of pancreatic islets in rats developing diabetes. Appearance of nonendocrine cells with surface MHC class II antigens and cytoplasmic insulin immunoreactivity. J Clin Invest 82 : 1123–1128.
107. StandopJ, SchneiderM, UlrichA, BuchlerMW, PourPM (2003) Differences in immunohistochemical expression of xenobiotic-metabolizing enzymes between normal pancreas, chronic pancreatitis and pancreatic cancer. Toxicologic pathology 31 : 506–513.
108. TsoTK, HuangHY, ChangCK, LiaoYJ, HuangWN (2004) Clinical evaluation of insulin resistance and beta-cell function by the homeostasis model assessment in patients with systemic lupus erythematosus. Clinical rheumatology 23 : 416–420.
109. VerganiA, FotinoC, D'AddioF, TezzaS, PodettaM, et al. (2013) Effect of the purinergic inhibitor oxidized ATP in a model of islet allograft rejection. Diabetes 62 : 1665–1675.
110. ZengYJ, ZengFQ, DaiL, YangC, LinBZ, et al. (2011) [Insulin sensitivity and beta cell function in female systemic lupus erythematosus patients]. Zhonghua nei ke za zhi 50 : 18–22.
111. ZhangL, Moffatt-BruceSD, GaughanAA, WangJJ, RajabA, et al. (2009) An anti-CD103 immunotoxin promotes long-term survival of pancreatic islet allografts. American journal of transplantation: official journal of the American Society of Transplantation and the American Society of Transplant Surgeons 9 : 2012–2023.
112. QuonG, LippertC, HeckermanD, ListgartenJ (2013) Patterns of methylation heritability in a genome-wide analysis of four brain regions. Nucleic Acids Res 41 : 2095–2104.
113. BellJT, PaiAA, PickrellJK, GaffneyDJ, Pique-RegiR, et al. (2011) DNA methylation patterns associate with genetic and gene expression variation in HapMap cell lines. Genome Biol 12: R10.
114. NilssonE, JanssonPA, PerfilyevA, VolkovP, PedersenM, et al. (2014) Altered DNA methylation and differential expression of genes influencing metabolism and inflammation in adipose tissue from subjects with type 2 diabetes. Diabetes 63 : 2962–2976.
115. SmemoS, TenaJJ, KimKH, GamazonER, SakabeNJ, et al. (2014) Obesity-associated variants within FTO form long-range functional connections with IRX3. Nature 507 : 371–375.
116. JjingoD, ConleyAB, YiSV, LunyakVV, JordanIK (2012) On the presence and role of human gene-body DNA methylation. Oncotarget 3 : 462–474.
117. ZhiD, AslibekyanS, IrvinMR, ClaasSA, BoreckiIB, et al. (2013) SNPs located at CpG sites modulate genome-epigenome interaction. Epigenetics 8 : 802–806.
118. ReynardLN, BuiC, SyddallCM, LoughlinJ (2014) CpG methylation regulates allelic expression of GDF5 by modulating binding of SP1 and SP3 repressor proteins to the osteoarthritis susceptibility SNP rs143383. Hum Genet 133 : 1059–1073.
119. TaqiMM, BazovI, WatanabeH, SheedyD, HarperC, et al. (2011) Prodynorphin CpG-SNPs associated with alcohol dependence: elevated methylation in the brain of human alcoholics. Addiction biology 16 : 499–509.
120. ParkJH, LeeJ, KimCH, LeeS (2014) The polymorphism (−600 C>A) of CpG methylation site at the promoter region of CYP17A1 and its association of male infertility and testosterone levels. Gene 534 : 107–112.
121. MaunakeaAK, NagarajanRP, BilenkyM, BallingerTJ, D'SouzaC, et al. (2010) Conserved role of intragenic DNA methylation in regulating alternative promoters. Nature 466 : 253–257.
122. DeatonAM, BirdA (2011) CpG islands and the regulation of transcription. Genes Dev 25 : 1010–1022.
123. DeatonAM, WebbS, KerrAR, IllingworthRS, GuyJ, et al. (2011) Cell type-specific DNA methylation at intragenic CpG islands in the immune system. Genome Res 21 : 1074–1086.
124. ShuklaS, KavakE, GregoryM, ImashimizuM, ShutinoskiB, et al. (2011) CTCF-promoted RNA polymerase II pausing links DNA methylation to splicing. Nature 479 : 74–79.
125. SigurdssonMI, SmithAV, BjornssonHT, JonssonJJ (2009) HapMap methylation-associated SNPs, markers of germline DNA methylation, positively correlate with regional levels of human meiotic recombination. Genome Res 19 : 581–589.
126. RakyanVK, BeyanH, DownTA, HawaMI, MaslauS, et al. (2011) Identification of type 1 diabetes-associated DNA methylation variable positions that precede disease diagnosis. PLoS Genet 7: e1002300.
127. ChenH, KazemierHG, de GrooteML, RuitersMH, XuGL, et al. (2014) Induced DNA demethylation by targeting Ten-Eleven Translocation 2 to the human ICAM-1 promoter. Nucleic Acids Res 42 : 1563–1574.
128. ChristensenDP, DahllofM, LundhM, RasmussenDN, NielsenMD, et al. (2011) Histone deacetylase (HDAC) inhibition as a novel treatment for diabetes mellitus. Molecular medicine 17 : 378–390.
129. ChristensenDP, GysemansC, LundhM, DahllofMS, NoesgaardD, et al. (2014) Lysine deacetylase inhibition prevents diabetes by chromatin-independent immunoregulation and beta-cell protection. Proc Natl Acad Sci U S A 111 : 1055–1059.
130. KrusU, KingBC, NagarajV, GandasiNR, SjolanderJ, et al. (2014) The complement inhibitor CD59 regulates insulin secretion by modulating exocytotic events. Cell Metab 19 : 883–890.
131. MahdiT, HanzelmannS, SalehiA, MuhammedSJ, ReinbotheTM, et al. (2012) Secreted frizzled-related protein 4 reduces insulin secretion and is overexpressed in type 2 diabetes. Cell Metab 16 : 625–633.
132. TaneeraJ, LangS, SharmaA, FadistaJ, ZhouY, et al. (2012) A systems genetics approach identifies genes and pathways for type 2 diabetes in human islets. Cell Metab 16 : 122–134.
133. OlssonAH, YangBT, HallE, TaneeraJ, SalehiA, et al. (2011) Decreased expression of genes involved in oxidative phosphorylation in human pancreatic islets from patients with type 2 diabetes. Eur J Endocrinol 165 : 589–595.
134. StahleMU, BrandhorstD, KorsgrenO, KnutsonF (2011) Pathogen inactivation of human serum facilitates its clinical use for islet cell culture and subsequent transplantation. Cell Transplant 20 : 775–781.
135. PurcellS, NealeB, Todd-BrownK, ThomasL, FerreiraMA, et al. (2007) PLINK: a tool set for whole-genome association and population-based linkage analyses. Am J Hum Genet 81 : 559–575.
136. TeschendorffAE, MenonU, Gentry-MaharajA, RamusSJ, GaytherSA, et al. (2009) An epigenetic signature in peripheral blood predicts active ovarian cancer. PLoS One 4: e8274.
137. DuP, KibbeWA, LinSM (2008) lumi: a pipeline for processing Illumina microarray. Bioinformatics 24 : 1547–1548.
138. DuP, ZhangX, HuangCC, JafariN, KibbeWA, et al. (2010) Comparison of Beta-value and M-value methods for quantifying methylation levels by microarray analysis. BMC Bioinformatics 11 : 587.
139. BolstadBM, IrizarryRA, AstrandM, SpeedTP (2003) A comparison of normalization methods for high density oligonucleotide array data based on variance and bias. Bioinformatics 19 : 185–193.
140. JohnsonWE, LiC, RabinovicA (2007) Adjusting batch effects in microarray expression data using empirical Bayes methods. Biostatistics 8 : 118–127.
141. ShabalinAA (2012) Matrix eQTL: ultra fast eQTL analysis via large matrix operations. Bioinformatics 28 : 1353–1358.
142. HohmeierHE, MulderH, ChenG, Henkel-RiegerR, PrentkiM, et al. (2000) Isolation of INS-1-derived cell lines with robust ATP-sensitive K+ channel-dependent and -independent glucose-stimulated insulin secretion. Diabetes 49 : 424–430.
143. WeissT, GrellM, HessabiB, BourteeleS, MullerG, et al. (1997) Enhancement of TNF receptor p60-mediated cytotoxicity by TNF receptor p80: requirement of the TNF receptor-associated factor-2 binding site. J Immunol 158 : 2398–2404.
144. MalmgrenS, SpegelP, DanielssonAP, NagornyCL, AnderssonLE, et al. (2013) Coordinate changes in histone modifications, mRNA levels, and metabolite profiles in clonal INS-1 832/13 beta-cells accompany functional adaptations to lipotoxicity. J Biol Chem 288 : 11973–11987.
145. O'ConnellJ, GurdasaniD, DelaneauO, PirastuN, UliviS, et al. (2014) A general approach for haplotype phasing across the full spectrum of relatedness. PLoS Genet 10: e1004234.
146. HowieBN, DonnellyP, MarchiniJ (2009) A flexible and accurate genotype imputation method for the next generation of genome-wide association studies. PLoS Genet 5: e1000529.
Štítky
Genetika Reprodukční medicínaČlánek vyšel v časopise
PLOS Genetics
2014 Číslo 11
- Kazuistika – Perspektivy využití precizované medicíny v rámci personalizované specifické terapie onkologických pacientů
- Nobelova cena za chemii pro genetické nůžky: Objev, který změní naši budoucnost?
- Technologie na bázi RNA v klinické praxi: od přebarvených petúnií k terapii vzácných a dosud jen obtížně léčitelných chorob u lidí
- „Nepředstavovali jsme si, že náš výzkum povede přímo ke vzniku nových léků, dokonce ještě za našeho života“
- Bezplatné služby pro diagnostiku ATTRv amyloidózy pro kardiology
Nejčtenější v tomto čísle
- An RNA-Seq Screen of the Antenna Identifies a Transporter Necessary for Ammonia Detection
- Systematic Comparison of the Effects of Alpha-synuclein Mutations on Its Oligomerization and Aggregation
- Functional Diversity of Carbohydrate-Active Enzymes Enabling a Bacterium to Ferment Plant Biomass
- Regularized Machine Learning in the Genetic Prediction of Complex Traits
Zvyšte si kvalifikaci online z pohodlí domova
Mazová zátka a její řešení
nový kurzVšechny kurzy