
Approximation to the Distribution of Fitness Effects across Functional Categories in Human Segregating Polymorphisms
The relative frequencies of polymorphic mutations that are deleterious, nearly neutral and neutral is traditionally called the distribution of fitness effects (DFE). Obtaining an accurate approximation to this distribution in humans can help us understand the nature of disease and the mechanisms by which variation is maintained in the genome. Previous methods to approximate this distribution have relied on fitting the DFE of new mutations to a single probability distribution, like a normal or an exponential distribution. Generally, these methods also assume that a particular category of mutations, like synonymous changes, can be assumed to be neutral or nearly neutral. Here, we provide a novel method designed to reflect the strength of negative selection operating on any segregating site in the human genome. We use a maximum likelihood mapping approach to fit these scores to a scale of neutral and negative fitness coefficients. Finally, we compare the shape of the DFEs we obtain from this mapping for different types of functional categories. We observe the distribution of polymorphisms has a strong peak at neutrality, as well as a second peak of deleterious effects when restricting to nonsynonymous polymorphisms.
Published in the journal:
. PLoS Genet 10(11): e32767. doi:10.1371/journal.pgen.1004697
Category:
Research Article
doi:
https://doi.org/10.1371/journal.pgen.1004697
Summary
The relative frequencies of polymorphic mutations that are deleterious, nearly neutral and neutral is traditionally called the distribution of fitness effects (DFE). Obtaining an accurate approximation to this distribution in humans can help us understand the nature of disease and the mechanisms by which variation is maintained in the genome. Previous methods to approximate this distribution have relied on fitting the DFE of new mutations to a single probability distribution, like a normal or an exponential distribution. Generally, these methods also assume that a particular category of mutations, like synonymous changes, can be assumed to be neutral or nearly neutral. Here, we provide a novel method designed to reflect the strength of negative selection operating on any segregating site in the human genome. We use a maximum likelihood mapping approach to fit these scores to a scale of neutral and negative fitness coefficients. Finally, we compare the shape of the DFEs we obtain from this mapping for different types of functional categories. We observe the distribution of polymorphisms has a strong peak at neutrality, as well as a second peak of deleterious effects when restricting to nonsynonymous polymorphisms.
Introduction
Genetic variation within species is shaped by a variety of evolutionary processes, including mutation, demography, and natural selection. With the advent of whole-genome sequencing, we can make unprecedented inferences about these and other processes by analyzing population genomic data. An important goal is to understand the extent to which segregating genetic variants are impacted by natural selection, and to quantify the intensity of natural selection acting genome-wide. Understanding the prevalence of different modes of selection on a genomic scale has wide-ranging implications across evolutionary and medical genetics. For instance, genome-wide association studies (GWAS) are searching for mutations associated with disease in large samples of humans [1]. Because mutations associated with disease are a priori likely to be deleterious, quantifying the portion of mutations that are deleterious along with their average effects could have significant implications for the design and interpretation of GWAS. Moreover, the ENCODE project has recently claimed that much of the genome is involved in some form of functional activity [2], [3]. However, the extent to which molecular signals identified by this project are actually produced by biological processes affecting fitness has been disputed [4], [5]. Indeed, comparative genomics studies suggest that only a small proportion of the human genome (5–10%) is under purifying selection, based on signals detectable on phylogenetic timescales [6]–[8]. Quantifying the DFE in noncoding regions is a first step toward understanding the fitness implications of functional activity at the genomic level.
Traditionally, studies have sought to estimate the distribution of fitness effects (DFE) for nonsynonymous mutations by using summary statistics based on the number of polymorphisms and substitutions [9]–[11] and/or the full frequency spectrum [12]–[14]. These studies typically assumed that synonymous variation is neutral or under weak selection. Many of these analyses suggest that while a large proportion of nonsynonymous mutations are nearly neutral, there is also a significant probability that an amino acid changing mutation will be strongly deleterious. While these studies were limited to analysis of protein-coding genes, recent work has focused on quantifying the DFE in regulatory regions, including short interspersed genomic elements such as enhancers [15], [16] and cis-regulatory regions [17]. Reviews of these and other approaches can be found in ref. [18], [19].
There are several obstacles to quantifying the DFE of new or segregating mutations genome-wide. First, inferences about the DFE are confounded by demography [20]. For example, a high proportion of low frequency derived alleles is a signature of negative selection, but can also be caused by recent population growth [21]. Hence, a well-supported demographic model must be used to appropriately control for population history when inferring the DFE. Second, most current methods rely on dividing up polymorphisms into either putatively selected sites or putatively neutral (or less selected) sites (for example, nonsynonymous and synonymous sites, respectively). These studies have relied on fitting a demographic model to the neutral class of sites and then fitting the DFE of new mutations to a probability distribution, typically an exponential or gamma distribution [9], [13] to the class of sites that are putatively under selection (e.g. nonsynonymous sites). While flexible, these distributions may miss some important features of the DFE [22]. For example, mutation accumulation experiments suggest that the DFE may be bimodal for at least some species, with most mutations either having nearly neutral or strongly deleterious effects, and very few mutations falling in between [23], [24]. Thus, assuming two classes of sites may not serve to capture all the relevant information about the DFE (but see [25] for an example of fitting a multimodal DFE to population genetic data and [22], [26] for nonparametric approaches to estimating the DFE of new amino-acid changing mutations). Finally, previous studies have been restricted to analyzing specific subclasses of mutations (e.g. nonsynonymous, enhancers, etc.) because until recently, no single metric existed that could serve to compare the disruptive potential of any type of variant, regardless of its genomic consequence.
Recently, Kircher et al. [27] developed a method to synthesize a large number of annotations into a single score to predict the pathogenicity or disruptive potential of any mutation in the genome. It is based on an analysis comparing real and simulated changes that occurred in the human lineage since the human-chimpanzee ancestor, and that are now fixed in present-day humans. The method relies on the realistic assumption that the set of real changes is depleted of deleterious variation due to the action of negative selection, which has pruned away disruptive variants, while the simulated set is not depleted of such variation. A support vector machine (SVM) was trained to distinguish the real from the simulated changes using a kernel of 63 annotations (including conservation scores, regulatory data and protein deleteriousness scores), and then used to assign a score (C-score) to all possible single-nucleotide changes in the human genome, controlling for local variation in mutation rates. These C-scores are meant to be predictors of how disruptive a given change may be, and are comparable across all types of sites (nonsynonymous, synonymous, regulatory, intronic or intergenic). Thus, they allow for a strict ranking of predicted functional disruption for mutations that may not be otherwise comparable. C-scores are PHRED scaled, with larger values corresponding to more disruptive effects.
Importantly, human-specific genetic variation patterns are not used as input to train the C-score SVM. In this work, we make use of the C-scores to provide a fine-grained stratification of the deleteriousness of variants segregating in modern human populations. We take advantage of the Poisson random field model [28], [29] with a realistic model of human demographic history to fit a maximum likelihood selection coefficient for each C-score, creating a mapping from C-scores to selection coefficients.
Results
A mapping from C-scores to selection coefficients
To map C-scores to selective coefficients, we obtained allele frequency information from 9 Yoruba (YRI) individuals (18 haploid sequences) sequenced to high-coverage using whole-genome shotgun sequencing as part of a dataset produced by Complete Genomics (CG) [30]. We removed sites that had a Duke Uniqueness 20 bp-mapability score <1 (downloaded from the UCSC Genome Browser, [31]), to avoid potential errors due to mismapping or miscalling in regions of the genome that are not uniquely mapable.
When inferring the DFE, we focused only on models of neutral evolution and negative selection, because C-scores are uninformative about adaptive vs. deleterious disruption (i.e. a high C-score could either reflect a highly deleterious change or a highly adaptive change). Additionally, because we are using polymorphism data only, positive selection should contribute little to the site-frequency spectrum [32].
We first binned polymorphisms into C-scores rounded to the nearest integer and computed the site frequency spectrum for each bin (Figure S1). We then fit the lowest possible C-score (C = 0), presumed to be neutral, to different models of demographic history. We computed the likelihood of the SFS in this bin for a constant population size model, a range of exponential growth models, the model inferred by Tennessen et al. [33] and the model inferred by Harris and Nielsen [34] from the distribution of tracts of identity by state (IBS) (Figure S2), and used an EM algorithm to correct for ancestral state misidentification (Figure S3, see Materials and Methods). We find that a model of exponential growth at population-scaled rate = 1 for 13,000 generations is the best fit to the corrected SFS, although the Tennessen model is almost as good a fit (Figure S2).
Using the best-fitting demography, we next fit a range of models with different selection coefficients to the EM-corrected site frequency spectrum for each C-score bin, using maximum likelihood (Figure 1.A) (see Methods). We restricted to C≤40, because very few sites have larger C-scores, and hence estimates of the selection coefficients for those C-scores are unreliable. We tested the robustness of the mappings to different levels of background selection, by partitioning the data into deciles of B-scores [35] and re-computing the C-to-s mapping for each decile. We observe that the mapping is generally robust to background selection, with substantial differences only observed at the lowest two B-score deciles, which correspond to high background selection (Figure S4). For this reason, and so as to obtain reliable DFEs at exonic sites (where background selection is generally higher than in the rest of the genome), we also performed a neutral demographic fitting and a C-to-s mapping while restricting only to sites in the exome (Figure 1.C). This mapping has a steeper decline than the genomic mapping, reflecting patterns of background selection which are not fully controlled by C-scores but that affect the SFS. We therefore show estimated DFEs using both the genome-wide and the exome-wide fittings below. After removing the C-score bins that best fit the neutral model, we fit a smoothing spline with 20 degrees of freedom to the remaining C-scores, so as to produce a continuous mapping of C-scores to selection coefficients (Figure 1.A).

We were concerned that our binning-based mapping would miss important features about the distribution of coefficients within each bin. To address this, we also fitted individual gamma distributions of selection coefficients to each of the bins. We show the mean, standard deviation (SD) and ancestral misidentification rate of each gamma fitting in Figure S3. The shape of the fitted gammas vary from an L-shape (Mean/SD <1) at low C bins, to a shape resembling a skewed normal distribution at intermediate C bins (Mean/SD>1) to a shape resembling an exponential distribution at high C bins (Mean/SD≈1) (Figure 1.D). We performed a likelihood ratio test comparing the gamma model to the single-coefficient model, and find that only 4 out of the 40 bins (containing only 0.5% of all polymorphisms and 4.7% of nonsynonymous polymorphisms) are significantly supportive of the gamma model (Figure 1.E). A chi-squared test of the fit to the data shows both models perform similarly well, though both result in significant chi-squared scores at low C-score bins when using the genome-wide data (Figure 1.F). This also occurs if we use the human demography model from [33] (Figure S6). We attribute this to the large amount of data present in those bins as well as complex details of demographic history that affect neutral sites but that we did not model in our neutral fitting. In contrast, when mapping using only the exome, almost all bins have non-significant statistics, suggesting that selection dominates over demography in these regions. Based on these results, we decided to use the smoothed single-coefficient fitting for estimating the DFE in most downstream analyses (Figure 2), although we may be missing a small proportion of within-bin variability. Additionally, we show the inferred DFE of each functional class obtained from the gamma-fitted mapping in Figure S5.

We aimed to test the robustness of the selection coefficient estimates within each bin. We were specifically concerned about highly deleterious bins, which are composed of a smaller number of segregating sites than neutral or nearly neutral bins, and could produce unstable or biased estimates. We obtained bootstrapped confidence intervals for each bin and observe that the mappings are relatively stable up to C = 35 (Figure 1.A). As expected, the standard deviation of the bootstrap estimates is strongly negatively correlated with the sample-size per bin (Figure S7, Pearson correlation coefficient = −0.89). Thus, most of the increase in the width of the confidence intervals observed at higher C-score bins can be explained by the small number of polymorphisms available in those bins, and is likely not the result of other unaccounted processes, such as positive selection, operating exclusively on highly scored polymorphisms. To verify that our mapping was not an artifact of the different number of C-scores within each bin, we also performed 100 randomizations of the C-score assignments to each SNP in the genome. For each randomization, we re-computed the C-to-s mapping. When doing so, the bootstrap confidence intervals increase in size with increasing C scores, but the mapping remains flat, as expected (Figure 1.B).
Further, we verified that the mapping did not change considerably when filtering for sites in regions with low CpG density (<0.05), defined as the proportion of CpG dinucleotides in a window of +/ − 75 bp around the site [27] (Figure S8.A). This is expected, as the C-score model accounts for differential mutation rates at CpG sites and the resulting scores are generally robust to them [27]. As before, the gamma model is a significantly better fit than the single-coefficient model at only 4 out of the 40 bins (Figure S8.B).
Additionally, we re-mapped the scores using a constant-size model, and verified that the mapping does not change considerably if we assume a different demographic history than the best fit (Figure S9). The mappings are highly similar in shape, with the exception that, because the constant-size model is depleted of singletons relative to the best-fit model, it takes more bins to reach an SFS that is deleterious enough to map to , and so more C-scores map to s = 0.
To test the dependence of our mapping on the choice of score used to estimate selection coefficients, we performed the same fitting procedure on a variety of other conservation and deleteriousness scores (see Methods). We note, however, that all of these scores are included as input in the C-score SVM. Figure S10 shows that the shape of the mapping is fairly consistent across different choices of scores, except for highly deleterious bins, which contain very few sites. When comparing different categories of sites in the Results, we show their distribution of selection coefficients obtained from the C-score mapping, as this score has been shown to be a better correlate to functional disruption than all the other scores mentioned above, and also controls for mutation rate variation across the genome, while other scores do not [27]. Additionally, we plotted the mapped density of selection coefficients for each functional category, using each of the other scores (with smoothing bandwidth = 0.000005 in Figure S11, 0.0000025 in Figure 3 and 0.000001 in Figure S12). We observe that, while all scores easily distinguish genic sites, PhastCons scores have difficulty distinguishing between synonymous and nonsynonymous sites, which we believe is due to PhastCons scores being regional, rather than position-specific scores. Additionally, while bimodality at nonsynonymous sites is most prominent when using C-scores, it also is apparent in other position-specific scores when plotting the density with a fine smoothing bandwidth. Below, we focus on the DFE obtained from C-scores, but draw comparisons with other DFEs to verify the robustness of particular patterns across annotations.

The distribution of fitness effects of segregating mutations
Using the C-score-to-selection coefficient mapping, we obtained the DFE of segregating polymorphisms in Yoruba individuals. This distribution is highly peaked when all polymorphisms are considered (Figure 2, black dashed line), with a large proportion of neutral changes and a long tail of deleterious mutations, as has been observed before when estimating the DFE of coding sequences [9], [11]–[13], [20]. Interestingly, we observe a pronounced drop in frequency for values of . We note that this is not due to our capping our mapping at as the selection coefficients we are able to map are of a greater magnitude than this drop (Figure 1, S13).
We partitioned the data by the genomic consequence of the polymorphisms, using the Ensembl Variant Effect Predictor (v.2.5) [36]. Some classes exhibit a peak of highly deleterious changes for . This peak results in a bimodal distribution that is especially pronounced for nonsynonymous sites (Figure 2, top row, red line), and is almost non-existent for intergenic sites (Figure 2, top row, pink line). Other types of polymorphisms—like splice site, synonymous, 3′ UTR, 5′ UTR and regulatory mutations—have less deleterious peaks than the one observed at nonsynonymous polymorphisms (Figure 2, top row). The C-to-s mapping computed from all genome-wide sites differs from the C-to-s mapping computed from exonic sites only (Figure 1.C), which is likely due to C-scores not being able to fully account for differences in conservation and background selection in the exome (Figure S4). To correct for this, we also computed DFEs obtained from the exome mapping (Figure 2, middle row). Here, bimodality is weaker (though still present) at putatively functional sites. Finally, we plotted a “hybrid” set of DFEs where we show DFEs for exonic sites (nonsynonymous, synonymous, splice sites) computed from the exome-wide mapping and DFEs for non-exonic sites (UTR, regulatory, intergenic) computed from the genome-wide mapping (Figure 2, bottom row).
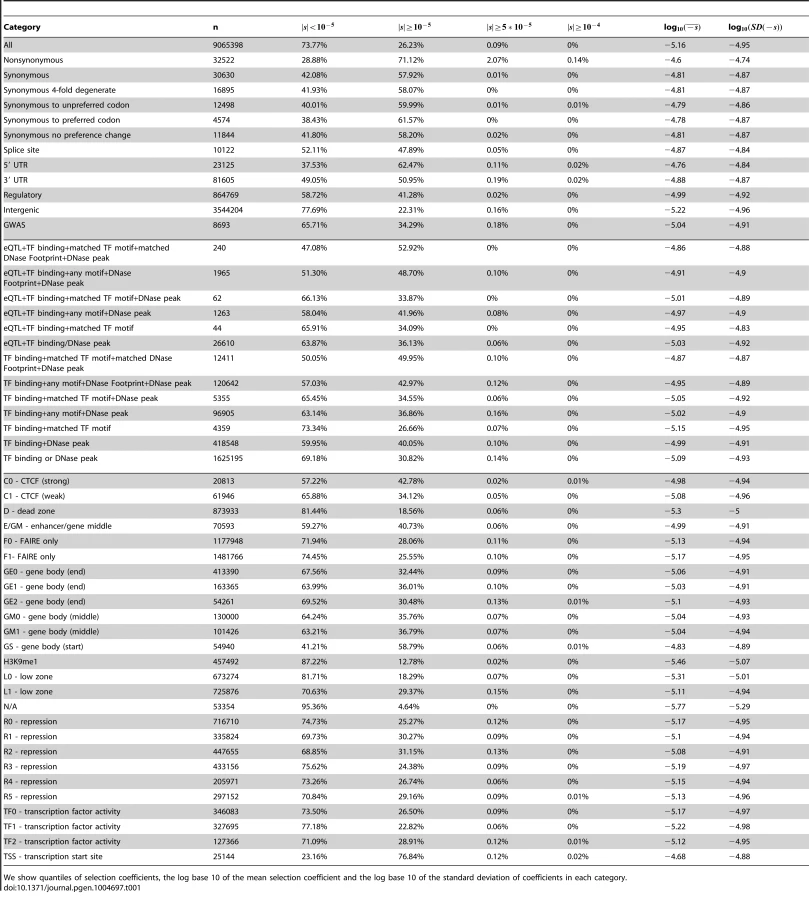
We can compare the selection coefficient distributions to the distributions of unmapped C-scores (Figure S13) which are much less tightly peaked at intermediate C-score values and do not show a sharp decrease in density for high values, as does the s distribution in Figure 2. We show various statistics calculated on each of the selection coefficient distributions in Table 1 with the genome-wide mapping and in Table S1 with the exome-wide mapping.
Next, we partitioned the data by whether the polymorphisms were found in the GWAS database [37] or not (Figure S14, Tables 1, S1). While we observe a second deleterious peak among the GWAS SNPs as well, these SNPs seem to be highly enriched for neutral polymorphisms.
Finally, we classified polymorphisms by different regulatory categories. We used two regulatory tracks. First, we partitioned the genome by regulatory regions identified by RegulomeDB [38], which predicts regulatory activity in noncoding regions based on different types of experimental evidence (Figure S15, Tables 1, S1). Second, we used the Segway regulatory segment tracks [39], which are the product of an unsupervised pattern discovery algorithm that serves to identify and label regulatory regions along the genome, including genic regions (Figure 4, Tables 1, S1).

Discussion
The distribution of fitness effects (DFE) describes the proportion of mutations with given selection coefficients. Knowledge of the DFE has profound implications for our understanding of evolution and health. We infer a highly peaked distribution for all polymorphisms, with a drop in density at , which may be the cutoff between weakly deleterious mutations that segregate in human populations and highly deleterious mutations that are easily pruned away by negative selection.
Our inferred non-synonymous distribution is bimodal and looks very similar to the one obtained for nonsynonymous mutations in Drosophila in ref. [11], with a peak at neutrality and another peak at . Several experimental studies have also shown that non-synonymous non-lethal mutations tend to have a multimodal DFE in model organisms [40], [41] (see ref. [18] for a comprehensive review). We note that it is impossible to obtain such kinds of distributions using a gamma or lognormal probability distribution unless one approximates bimodality by assuming a second, separate class of nonsynonymous mutations that are completely neutral and do not follow the best-fitting probability distribution [11], [13], [20], [25].
We also tested the precision of the C-scores by fitting gamma distributed DFEs to each C-score bin. While only very few bins were fit by a highly peaked gamma distribution (Figure 1.D), the increased variation offered by the gamma distribution rarely improved the likelihood significantly (Figure 1.E). This suggests that the C-scores are precise quantifications of negative selection, and that mutations with similar C-scores are likely to have similar selection coefficients.
Interestingly, we found that for many low C-score bins, a chi-squared test would reject the fit of the demographic model to the data. This is possibly because these low C-score bins have a significant number of sites, and hence subtle features of the demography and quality control are relevant. Nonetheless, we note that for moderate-to-high C-score bins and for exonic data, we were not able to reject the fit of the predicted site frequency spectrum from the data. While these bins have fewer sites, it is also likely that stronger selection is obscuring some of the signal of subtle demographic events.
Our novel expectation-maximization approach to quantifying ancestral state misidentification allows us to assess differential misidentification rates across C-score categories. Ancestral state misidentification occurs because a site is hit by more than one mutation, hence obscuring the identity of the ancestral allele. Here, we found that low C-score bins are enriched with ancestral state misidentification, with rates in excess of 5% for some bins (Figure S3). This may reflect a bias induced by the C-scores themselves, because C-scores are trained to distinguish classes of sites that have relatively few substitutions between humans and chimpanzees. Because the signal of ancestral state misidentification and positive selection are very similar [42], it is possible that low C-score bins are enriched for positive selection, although we did not pursue that direction any further. For larger C-score bins, we infer misidentification rates along the lines of those obtained in simulation studies by ref. [42].
Importantly, unlike previous studies, we also obtain DFEs for other types of mutations, including synonymous, splice site, 3′ UTR, 5′ UTR and regulatory polymorphisms, which exhibit bimodality to a lesser degree than the nonsynonymous DFE. In particular, 5′ UTR changes constitute the category with the smallest proportion of neutral or nearly neutral () polymorphisms after nonsynonymous changes, likely reflecting selection on gene regulation upstream of coding sequences. Futhermore, distributions corresponding to mutations in UTR and regulatory regions have a less pronounced trough between the two peaks than the ones observed among coding mutations, suggesting that the magnitude of deleterious effects is more uniformly distributed in non-coding regions. In contrast, missense mutations appear to have more of an “all-or-nothing” effect, as would perhaps be expected when replacing an amino acid inside a protein.
Our method does not use synonymous sites as a neutral benchmark, as do other studies [9], [11], [20]. In fact, our inferred DFE suggests that a considerable number of synonymous polymorphisms may not be neutral, as we observe a second deleterious peak in them too, albeit less deleterious than the one observed at nonsynonymous polymorphisms. We caution, however, that this second peak is less promient when using an exome-specific mapping (Figure 2) or when using other position-specific scores (Figures S11, 3, S12), which suggests that at least part of this peak may be caused by regional patterns of conservation or background selection in the exomes. Instead, intergenic polymorphisms are the class of sites most likely to evolve neutrally. Because this class is so abundant, most of the signal observed when all polymorphisms are pooled together closely reflects the distribution observed for intergenic polymorphisms (Figure 2).
Our results have implications for GWAS, as we find a high proportion of GWAS SNPs to be neutral or nearly neutral, which could suggest a high rate of false positives in this type of association studies. On the other hand, GWAS studies only aim to find polymorphisms linked to causative variants, and so GWAS SNPs need not have strongly deleterious effects. Alternatively, if the effect size of many GWAS SNPs are sufficiently small, it is possible that many of them are not subject to strong selection.
Additionally, by stratifying our results based on different ENCODE categories, we can elucidate the fitness consequences of molecular activity signals detected by ENCODE [2], [3], [38]. We find the category with the lowest proportion of neutral polymorphisms to be the one corresponding to sites that have eQTL evidence as well as evidence for transcription factor (TF) binding, a matched TF motif, a matched DNase footprint and that are located in a DNase peak. In general, categories that combine many regulatory signals tend to show lower proportions of neutral mutations than those that do not, suggesting that data integration across distinct approaches to detecting selection and functionality is likely to do better than any individual approach [43]. Moreover, this suggests that much of the molecular activity detected by ENCODE may not have significant fitness consequences.
Stratification by Segway regions allows us to look at a different aspect of regulatory activity in the genome. Interestingly, we observe that polymorphisms in Transcription Start Sites (TSS) are the ones containing the largest proportion of deleteriousness. This echoes results from analyses of variation at transcription factor binding sites, which have been found to be under stronger constraint when found near TSS than when found far from them [44]. Other regions with high proportions of deleterious polymorphisms include Gene Body (Start), strong CTCF and Enhancer/Gene Middle. This suggests that regions with strong repressor, insulator or enhancer activity, as well as near the start of genes, are particularly important for biological function, perhaps unsurprisingly given our knowledge of the molecular role that these regions play in the regulation of transcription.
DFEs produced from different conservation scores reveal interesting properties about each score (Figures S11, 3). For example, because PhastCons scores are regional and not position-specific, they do not perform well at distinguishing between different classes of genic polymorphisms. Bimodality at nonsynonymous sites is observed to a lesser or greater extent in almost all scores, and it is especially prominent when using C-scores, but bimodality at synonymous sites is only observed in PhastCons scores and C-scores, which suggests it may be caused by regional patterns of background selection. Finally, we note that high PhyloP scores computed from deeper phylogenetic (e.g. Vertebrate) alignments tend to be more deleterious than high PhyloP scores computed from shallower phylogenetic (e.g. Primate) alignments. This likely reflects the higher resolution one can obtain by using deeper alignments to find extremely deleterious sites.
There are several limitations to our method. First, we have restricted ourselves to estimating the DFE of segregating mutations that have reached appreciable frequencies in the population. An extension of this approach would be to infer the DFE of new mutations from the DFE of segregating mutations genome-wide. Second, we assumed no dominance, epistasis or positive selection, which future studies could attempt to incorporate into our approach. In addition, we have assumed sites are independent and have therefore ignored the covariance between linked sites, which likely leads to an underestimatation of confidence intervals obtained from the bootstrapping. The free-recombination assumption may also affect inference due to Hill-Robertson interference between mutations subject to selection [45] as well as linked background selection affecting the SFS of neutral sites in the human genome [35]. This may be a more important issue in our case than other genic-only approaches because we are also including intergenic mutations in our analysis, so the space between analyzed polymorphisms is on average smaller than if we were only looking at coding polymorphisms [20]. We also assume no positive selection. This, however, should not be a major problem, because we are only basing our inferences on polymorphic sites and advantageous mutations contribute little to polymorphism, assuming [32].
One final limitation is that the type of inference performed here is only possible in species from which accurate deleteriousness scores can be obtained, and that it relies on these scores being able to correctly rank sites throughout the genome. As the amount of genomic data increases, new and better scores will likely emerge in the near future for both humans and other species, and so we expect our method could be re-implemented once better proxies for deleteriousness become available.
Materials and Methods
Computing the theoretical site frequency spectrum
We used the theory developed by Evans et al. [46] to obtain the expected population site frequency spectrum with non-equilibrium demography. We assume a Wright-Fisher population in the limit of large population size and use diffusion theory to model this process. Writing for the frequency spectrum at frequency x and time where is in units of generations and , we can approximate the dynamics of with genic selection and mutation by solving the following partial differential equation:


We assume N(0) to be 10,000 for all exponential and constant models. For the constant population size model, . For the exponential growth model where is the population-scaled growth rate and is the per-generation growth rate. For models taken from the literature, we use the N(0) assumed by the corresponding paper. For the model of Harris and Nielsen, is piece-wise defined according to their Figure 7. The Tennessen model is similarly defined in a piece-wise fashion according to their Figure 2, although it also includes periods of exponential growth, as opposed to simply being piece-wise constant as in the Harris and Nielsen model.
We solve for numerically in Mathematica, and can then compute the expected number of segregating sites with copies of the derived allele out of a sample of genes. Denoting by the theoretical SFS with selection coefficient s, this quantity is


We focused on fitting the shape of the SFS, and hence worked with the probability that a given site in a sample of has copies of the derived allele,

The Mathematica code used for obtaining the theoretical SFS can be found online at: http://malecot.popgen.dk/schraiber/.
Expectation maximization algorithm to fit ancestral state misidentification rates
We observed that the SFS showed signs of ancestral state misidentification, in particular an excess of high frequency derived alleles (Figure S2). To account for ancestral state misidentification errors, we developed an expectation maximization (EM) algorithm. In the E step, we estimate the posterior probability that a site at frequency out of is misidentified given the current estimated site frequencies, , and the current estimate of the misidentification rate, , as


Maximum likelihood fitting of demographic models
The exponential growth model has two free parameters, r, the population-scaled growth rate and t, the total time of exponential growth. We first obtained the site frequency spectrum for all sites with C = 0. Next we solved for the exponential growth model across a grid of and r, as well as the constant, Harris and Tennessen models, and applied our EM algorithm to estimate the best fitting demographic model, using a grid search over demographic models during the M step.
Maximum likelihood fitting of selection coefficients
To find the maximum likelihood estimate of for each C-score bin, we first obtained the site frequency spectrum corresponding to each C-score bin. Next, we solved under the fitted demography for in steps of 0.005, along with s = 0. To obtain an estimated SFS under the assumption of gamma distributed selection coefficients, we used the trapezoid rule to numerically integrate against a gamma distribution as in formula 3.
We used our EM algorithm to estimate the best fitting selection coefficient for each bin. When fitting a single coefficient, we used a grid search during the M-step, and when fitting gamma distributed selection coefficients, we used the L-BFGS-B algorithm. To plot the DFE, we used kernel density estimation with smoothing bandwith = 0.000005, unless otherwise stated.
Genomic annotations
Consequences for different types of sites were determined using the Ensembl Variant Effect Predictor (v.2.5) [36]. If more than one consequence existed for a given SNP, that SNP was assigned to the most severe of the predicted categories, following the VEP's hierarchy of consequences. Codon and degeneracy information was obtained from snpEff [47]. Segway segmentation information [39], [48] was obtained from ref. [27] and RegulomeDB categories [38] were obtained from http://www.regulomedb.org/(last accessed: 24th February 2014).
Reference/alternative bias
We were concerned that reference/alternative bias in PolyPhen and SIFT – which use humans in their alignments – would lead to strong biases in C-scores, as the C-score method uses these scores in its training set. To mitigate this issue, the C-scores we are using were polarized with respect to the ancestral allele at sites where the reference differs from the ancestral allele, unlike the standard C-scores, which are always polarized with respect to the human reference (Martin Kircher, pers. comm.).
Nevertheless, we aimed to quantify how much bias remained after this correction. To do so, we obtained PhyloP [49] and PhastCons [50] scores derived from vertebrate, mammal and primate alignments, as well as GERP++ rejected substitution (GERP S) scores [51], for all YRI SNPs. All of these scores were calculated using human-free alignments [27]. We compared the bias observed at the C-scores we are using to the bias observed at the human-free conservation scores. We computed the absolute difference between the mean of each score at sites where reference = ancestral and at sites where reference = derived, divided by the total standard deviation at both types of sites. We plotted this standardized absolute difference as a function of the number of derived alleles in YRI (Figure S16). Though we observe some bias in all the scores, C-scores fall within the range of bias of human-free conservation scores and are not more biased than them. We hypothesize this occurs because the fraction of sites in the training set of the C-score SVM for which SIFT and PolyPhen scores are available (i.e. their “relevance” score as defined in Supplementary Table S3 of [27]) is very small (0.0063), as SIFT and PolyPhen are nonsynoymous-specific scores, and not genome-wide scores. In contrast, PhastCons, PhyloP and GERP Scores were all explicitly obtained from human-free alignments [27] and these are the training annotations with the highest area under the ROC curve (AUC) that have Relevance = 1 (i.e. they are genome-wide scores). The sites we used to obtain the C-to-s mapping are genome-wide polymorphisms, so the bulk of the signal comes from these scores. Interestingly, GERP scores show the least amount of bias. C-scores tend to show some bias, but unlike other scores like PhyloP, the bias is low when the number of derived alleles is high, and therefore when the reference is more likely to be derived.
Mapping using different scores
To test how robust the mapping of C-scores to selection coefficients is to different types of conservation scores, we produced DFEs by using selection coefficient mappings from each of the aforementioned conservation scores. We attempted to equalize the range of all scores by PHRED-scaling them, i.e. converting each score to –log10(p) where is the probability of observing a change as or more disruptive/conserved (based on that particular score scale) among all polymorphic YRI sites. We note that this is different from the natural PHRED scale of C-scores (where is the the probability of observing a score as or more disruptive among all possible, but not necessarily realized, mutations in the human genome), and so we also re-scaled the C-scores to produce a fair comparison. Then, we repeated the maximum likelihood mapping for each PHRED-scaled score in bins of 0.25 units (e.g. 0–0.125, 0.125–0.375, 0.375–0.625, etc). It is important to note that PhastCons are regional scores, while PhyloP and GERP S are position-specific scores. Another difference is that PhastCons scores only measure the probability of negative selection, while PhyloP and GERP S scores also measure positive selection (i.e. low/negative scores represent faster evolution than expected purely under drift), which may be why we observe an uptick at the lower end of the mapping for those scores in Figure S10.
Supporting Information
Zdroje
1. McCarthyMI, AbecasisGR, CardonLR, GoldsteinDB, LittleJ, et al. (2008) Genome-wide association studies for complex traits: consensus, uncertainty and challenges. Nature Reviews Genetics 9 : 356–369.
2. DunhamI, KundajeA, AldredS, CollinsP, DavisC, et al. (2012) An integrated encyclopedia of DNA elements in the human genome. Nature 489 : 57–74.
3. EddySR (2013) The encode project: missteps overshadowing a success. Current Biology 23: R259–R261.
4. GraurD, ZhengY, PriceN, AzevedoRB, ZufallRA, et al. (2013) On the immortality of television sets: “function” in the human genome according to the evolution-free gospel of ENCODE. Genome Biology and Evolution 5 : 578–590.
5. LawrieDS, PetrovDA (2014) Comparative population genomics: power and principles for the inference of functionality. Trends in Genetics 30 : 133–139.
6. Siepel A, Pollard KS, Haussler D (2006) New methods for detecting lineage-specific selection. In: Research in Computational Molecular Biology. Springer, pp. 190–205.
7. Lindblad-TohK, GarberM, ZukO, LinMF, ParkerBJ, et al. (2011) A high-resolution map of human evolutionary constraint using 29 mammals. Nature 478 : 476–482.
8. WardLD, KellisM (2012) Evidence of abundant purifying selection in humans for recently acquired regulatory functions. Science 337 : 1675–1678.
9. PiganeauG, Eyre-WalkerA (2003) Estimating the distribution of fitness effects from DNA sequence data: Implications for the molecular clock. Proceedings of the National Academy of Sciences 100 : 10335–10340.
10. SawyerSA, KulathinalRJ, BustamanteCD, HartlDL (2003) Bayesian analysis suggests that most amino acid replacements in Drosophila are driven by positive selection. Journal of Molecular Evolution 57: S154–S164.
11. LoeweL, CharlesworthB, BartoloméC, NöelV (2006) Estimating selection on nonsynonymous mutations. Genetics 172 : 1079–1092.
12. KeightleyPD, Eyre-WalkerA (2007) Joint inference of the distribution of fitness effects of deleterious mutations and population demography based on nucleotide polymorphism frequencies. Genetics 177 : 2251–2261.
13. BoykoAR, WilliamsonSH, IndapAR, DegenhardtJD, HernandezRD, et al. (2008) Assessing the evolutionary impact of amino acid mutations in the human genome. PLoS Genetics 4: e1000083.
14. WilsonDJ, HernandezRD, AndolfattoP, PrzeworskiM (2011) A population genetics-phylogenetics approach to inferring natural selection in coding sequences. PLoS Genetics 7: e1002395.
15. Arbiza L, Gronau I, Aksoy BA, Hubisz MJ, Gulko B, et al.. (2013) Genome-wide inference of natural selection on human transcription factor binding sites. Nature Genetics.
16. GronauI, ArbizaL, MohammedJ, SiepelA (2013) Inference of natural selection from interspersed genomic elements based on polymorphism and divergence. Molecular Biology and Evolution 30 : 1159–1171.
17. TorgersonDG, BoykoAR, HernandezRD, IndapA, HuX, et al. (2009) Evolutionary processes acting on candidate cis-regulatory regions in humans inferred from patterns of polymorphism and divergence. PLoS Genetics 5: e1000592.
18. Eyre-WalkerA, KeightleyPD (2007) The distribution of fitness effects of new mutations. Nature Reviews Genetics 8 : 610–618.
19. Siepel A, Arbiza L (2014) Cis-regulatory elements and human evolution. bioRxiv.
20. Eyre-WalkerA, WoolfitM, PhelpsT (2006) The distribution of fitness effects of new deleterious amino acid mutations in humans. Genetics 173 : 891–900.
21. WilliamsonSH, HernandezR, Fledel-AlonA, ZhuL, NielsenR, et al. (2005) Simultaneous inference of selection and population growth from patterns of variation in the human genome. Proceedings of the National Academy of Sciences 102 : 7882–7887.
22. KousathanasA, KeightleyPD (2013) A comparison of models to infer the distribution of fitness effects of new mutations. Genetics 193 : 1197–1208.
23. WlochDM, SzafraniecK, BortsRH, KoronaR (2001) Direct estimate of the mutation rate and the distribution of fitness effects in the yeast Saccharomyces cerevisiae. Genetics 159 : 441–452.
24. SanjuánR, MoyaA, ElenaSF (2004) The distribution of fitness effects caused by single-nucleotide substitutions in an RNA virus. Proceedings of the National Academy of Sciences of the United States of America 101 : 8396–8401.
25. LoeweL, CharlesworthB (2006) Inferring the distribution of mutational effects on fitness in Drosophila. Biology Letters 2 : 426–430.
26. KeightleyPD, Eyre-WalkerA (2010) What can we learn about the distribution of fitness effects of new mutations from dna sequence data? Philosophical Transactions of the Royal Society B: Biological Sciences 365 : 1187–1193.
27. KircherM, WittenDM, JainP, O'RoakBJ, CooperGM, et al. (2014) A general framework for estimating the relative pathogenicity of human genetic variants. Nature Genetics 46 : 310–315.
28. SawyerSA, HartlDL (1992) Population genetics of polymorphism and divergence. Genetics 132 : 1161–1176.
29. BustamanteC, NielsenR, SawyerS, OlsenK, PuruggananM, et al. (2002) The cost of inbreeding in Arabidopsis. Nature 416 : 531.
30. DrmanacR, SparksAB, CallowMJ, HalpernAL, BurnsNL, et al. (2010) Human genome sequencing using unchained base reads on self-assembling dna nanoarrays. Science 327 : 78–81.
31. KarolchikD, BarberGP, CasperJ, ClawsonH, ClineMS, et al. (2014) The ucsc genome browser database: 2014 update. Nucleic acids research 42: D764–D770.
32. SmithNG, Eyre-WalkerA (2002) Adaptive protein evolution in Drosophila. Nature 415 : 1022–1024.
33. TennessenJA, BighamAW, O'ConnorTD, FuW, KennyEE, et al. (2012) Evolution and functional impact of rare coding variation from deep sequencing of human exomes. Science 337 : 64–69.
34. HarrisK, NielsenR (2013) Inferring demographic history from a spectrum of shared haplotype lengths. PLoS Genetics 9: e1003521.
35. McVickerG, GordonD, DavisC, GreenP (2009) Widespread genomic signatures of natural selection in hominid evolution. PLoS Genetics 5: e1000471.
36. McLarenW, PritchardB, RiosD, ChenY, FlicekP, et al. (2010) Deriving the consequences of genomic variants with the ensembl api and snp effect predictor. Bioinformatics 26 : 2069–2070.
37. HindorffLA, SethupathyP, JunkinsHA, RamosEM, MehtaJP, et al. (2009) Potential etiologic and functional implications of genome-wide association loci for human diseases and traits. Proceedings of the National Academy of Sciences 106 : 9362–9367.
38. BoyleAP, HongEL, HariharanM, ChengY, SchaubMA, et al. (2012) Annotation of functional variation in personal genomes using RegulomeDB. Genome Research 22 : 1790–1797.
39. HoffmanMM, BuskeOJ, WangJ, WengZ, BilmesJA, et al. (2012) Unsupervised pattern discovery in human chromatin structure through genomic segmentation. Nature Methods 9 : 473–476.
40. DaviesEK, PetersAD, KeightleyPD (1999) High frequency of cryptic deleterious mutations in Caenorhabditis elegans. Science 285 : 1748–1751.
41. KeightleyPD (1996) Nature of deleterious mutation load in Drosophila. Genetics 144 : 1993–1999.
42. HernandezRD, WilliamsonSH, BustamanteCD (2007) Context dependence, ancestral misidentification, and spurious signatures of natural selection. Molecular biology and evolution 24 : 1792–1800.
43. ScheinfeldtLB, TishkoffSA (2013) Recent human adaptation: genomic approaches, interpretation and insights. Nature Reviews Genetics 14 : 692–702.
44. MuXJ, LuZJ, KongY, LamHY, GersteinMB (2011) Analysis of genomic variation in non-coding elements using population-scale sequencing data from the 1000 genomes project. Nucleic acids research 39 : 7058–7076.
45. McVeanGA, CharlesworthB (2000) The effects of Hill-Robertson interference between weakly selected mutations on patterns of molecular evolution and variation. Genetics 155 : 929–944.
46. EvansSN, ShvetsY, SlatkinM (2007) Non-equilibrium theory of the allele frequency spectrum. Theoretical Population Biology 71 : 109–119.
47. CingolaniP, PlattsA, CoonM, NguyenT, WangL, et al. (2012) A program for annotating and predicting the effects of single nucleotide polymorphisms, snpeff: Snps in the genome of drosophila melanogaster strain w1118; iso-2; iso-3. Fly 6 : 80–92.
48. RosenbloomKR, DreszerTR, PheasantM, BarberGP, MeyerLR, et al. (2010) Encode whole-genome data in the ucsc genome browser. Nucleic Acids Research 38: D620–D625.
49. PollardKS, HubiszMJ, RosenbloomKR, SiepelA (2010) Detection of nonneutral substitution rates on mammalian phylogenies. Genome Research 20 : 110–121.
50. SiepelA, BejeranoG, PedersenJS, HinrichsAS, HouM, et al. (2005) Evolutionarily conserved elements in vertebrate, insect, worm, and yeast genomes. Genome Research 15 : 1034–1050.
51. AdzhubeiIA, SchmidtS, PeshkinL, RamenskyVE, GerasimovaA, et al. (2010) A method and server for predicting damaging missense mutations. Nature Methods 7 : 248–249.
Štítky
Genetika Reprodukční medicínaČlánek vyšel v časopise
PLOS Genetics
2014 Číslo 11
- Kazuistika – Perspektivy využití precizované medicíny v rámci personalizované specifické terapie onkologických pacientů
- Nobelova cena za chemii pro genetické nůžky: Objev, který změní naši budoucnost?
- Technologie na bázi RNA v klinické praxi: od přebarvených petúnií k terapii vzácných a dosud jen obtížně léčitelných chorob u lidí
- „Nepředstavovali jsme si, že náš výzkum povede přímo ke vzniku nových léků, dokonce ještě za našeho života“
- Bezplatné služby pro diagnostiku ATTRv amyloidózy pro kardiology
Nejčtenější v tomto čísle
- An RNA-Seq Screen of the Antenna Identifies a Transporter Necessary for Ammonia Detection
- Systematic Comparison of the Effects of Alpha-synuclein Mutations on Its Oligomerization and Aggregation
- Functional Diversity of Carbohydrate-Active Enzymes Enabling a Bacterium to Ferment Plant Biomass
- Regularized Machine Learning in the Genetic Prediction of Complex Traits
Zvyšte si kvalifikaci online z pohodlí domova
Mazová zátka a její řešení
nový kurzVšechny kurzy