
Inversion of the Chromosomal Region between Two Mating Type Loci Switches the Mating Type in
The mating system of Saccharomycotina has evolved from the ancestral heterothallic system as seen in Yarrowia lipolytica to homothallism as seen in Saccharomyces cerevisiae. The acquisition of silent cassettes was an important step towards homothallism. However, some Saccharomycotina species that diverged from the common ancestor before the acquisition of silent cassettes are also homothallic, including Hansenula polymorpha. We investigated the structure and functions of the mating type locus (MAT) in H. polymorpha, and found two MAT loci, MAT1 and MAT2. Although MAT1 contains both a and α information, the results suggest that it functions as MATα. MATa is represented by MAT2, which is located at a distance of 18 kb from MAT1. The functional repression of MAT1 or MAT2 was required to establish a or α mating type identity in individual cells. The chromosomal location of MAT1 and MAT2 was found to influence their transcriptional status, with only one locus maintained in an active state. An inversion of the MAT intervening region resulted in the switching of the two MAT loci and hence of mating type identity, which was required for homothallism. This chromosomal inversion-based mechanism represents a novel form of mating type switching that requires two MAT loci, of which only one is expressed.
Published in the journal:
. PLoS Genet 10(11): e32767. doi:10.1371/journal.pgen.1004796
Category:
Research Article
doi:
https://doi.org/10.1371/journal.pgen.1004796
Summary
The mating system of Saccharomycotina has evolved from the ancestral heterothallic system as seen in Yarrowia lipolytica to homothallism as seen in Saccharomyces cerevisiae. The acquisition of silent cassettes was an important step towards homothallism. However, some Saccharomycotina species that diverged from the common ancestor before the acquisition of silent cassettes are also homothallic, including Hansenula polymorpha. We investigated the structure and functions of the mating type locus (MAT) in H. polymorpha, and found two MAT loci, MAT1 and MAT2. Although MAT1 contains both a and α information, the results suggest that it functions as MATα. MATa is represented by MAT2, which is located at a distance of 18 kb from MAT1. The functional repression of MAT1 or MAT2 was required to establish a or α mating type identity in individual cells. The chromosomal location of MAT1 and MAT2 was found to influence their transcriptional status, with only one locus maintained in an active state. An inversion of the MAT intervening region resulted in the switching of the two MAT loci and hence of mating type identity, which was required for homothallism. This chromosomal inversion-based mechanism represents a novel form of mating type switching that requires two MAT loci, of which only one is expressed.
Introduction
Many yeast species have a sexual cycle as well as an asexual proliferation cycle. Sexual reproduction in yeast is initiated by the recognition of a mating partner and cell fusion, followed by nuclear fusion to form diploid cells that undergo meiosis and produce haploid progeny. In most ascomycetous yeast, cell-cell recognition only occurs between opposite mating types that are dictated by a single mating type locus, the MAT locus [1], which encodes transcriptional regulators that function in various combinations to regulate the expression of genes that confer a sexual identity to cells. Because mating type in Ascomycota is predominantly bipolar, there are two possible DNA sequences for the MAT locus, which are referred to as idiomorphs rather than alleles due to a lack of overall DNA sequence homology [2] (Figs. 1 and S1).

In Saccharomyces cerevisiae, haploid a or α cells are competent to mate with cells of the opposite mating type while diploid a/α cells are non-mating. The S. cerevisiae MAT locus carries one of two idiomorphs, MATa or MATα that encodes one or two proteins, a1 or α1 and α2, respectively. The α1 protein induces the expression of α-specific genes, while α2 represses a-specific genes. In contrast, the expression of a-specific genes does not require any of the MAT genes and occurs by default as long as α2 is absent [3]. This has resulted from the evolutionary loss of a2, another protein found in MATa idiomorphs of several other Saccharomycotina species. In Candida albicans and Candida lusitaniae, a2 activates a-specific genes [4]. In diploid S. cerevisiae cells, α2 forms a complex with a1 to repress haploid-specific genes, which results in the loss of mating capability and gain of the ability to initiate meiosis [4].
Communication through mating pheromones is important in yeast mating [5]. In S. cerevisiae, pheromone and receptor genes are regulated by MAT [3]; the α-factor receptor, Ste2, and a-factor are expressed only in a cells and the a-factor receptor, Ste3, and α-factor only in α cells. Therefore, pheromone/receptor pairs can only be formed between a and α cells and mating can only occur between a and α cells. When bound by pheromone, both receptors activate the same downstream target molecules [6], and the signal is transmitted through the mitogen-associated protein kinase (MAPK) cascade—comprising Ste11, Ste7, and Fus3—to ultimately activate downstream effectors including the transcription factor Ste12, which then activates the expression of mating-specific genes [7]. The pheromone signal transduction pathway is highly conserved across fungi even beyond Ascomycota [8], [9].
Sexual reproduction can be heterothallic (cross-fertility), where mating occurs between individuals with compatible MAT idiomorphs, or else homothallic (self-fertility), where mating occurs within a population of the same strain. Two types of homothallism are known in yeast: in one, genetically identical cells mate with each other [10], while in the other, cells switch from one mating type to another, producing a cell population with two cell types that differ only in terms of MAT and are compatible to mate. The best characterized example of the latter is in S. cerevisiae which, in addition to the MAT locus, has silent copies of both idiomorphs at different locations on the same chromosome (HMLα and HMRa) [3], [11], [12]. Cells switch mating type during the mitotic cycle and become sexually compatible with neighboring cells. Mating type switching is a gene conversion event that copies information from silent cassettes to the MAT locus and is initiated by a double-strand break generated by the HO endonuclease. While species related to S. cerevisiae such as C. glabrata, Saccharomyces castellii, and Zygosaccharomyces rouxii have silent mating type cassettes and the HO endonuclease gene, the silent cassette is absent in the most distantly related Saccharomycotina such as C. albicans or Yarrowia lipolytica [13] (Fig. 1). In more closely related yet still relatively distant yeasts such as Kluveromyces lactis, there are two silent cassettes but the HO endonuclease is absent. As in S. cerevisiae, mating type switching in K. lactis is mediated by mitotic gene conversion, but the initiating DNA lesion is evoked by a transposase homolog encoded by the MATα locus [14], [15].
Hansenula polymorpha is a more distantly related yeast used for genetic analyses, but the genetic and molecular details of its life cycle remain unknown. The species is predominantly haploid, but diploid cells can be isolated and maintained [16]. Because it is homothallic, haploid cells can mate with each other, followed by meiosis and sporulation under conditions of nutrient limitation. Diploid cells also efficiently undergo meiosis to form four ascospores [16], [17]. Mating type was suggested to be bipolar and the switching induced by nitrogen deprivation [16]. However, it was also claimed to be tetrapolar [16]. The genome sequence revealed the presence of the MAT locus but not silent cassettes or the HO gene. The MAT locus contains a unique combination of mating type genes—α2, α1, and a1—adjacent to each other on the same chromosome in that order and all in the same orientation [13]. However, it is not known how mating type is determined and whether and how the mating type switch occurs in this organism [13].
Here we report a functional analysis of mating type genes in H. polymorpha. Mutational analyses revealed that the previously reported MAT locus corresponds to MATα, while MATa is encoded by a second MAT locus located close to MATα. Only one MAT locus was transcribed mitotically while the other was repressed. The chromosomal location determined which MAT was active. During mating, the chromosomal region between the two MAT loci became inverted, which resulted in the switching of the MAT locus that was expressed. Preventing the inversion severely perturbed the mating of cells with each other, suggesting that this is the major mechanism of homothallism in H. polymorpha.
Results
H. polymorpha has two mating type loci
The MAT locus of H. polymorpha has been previously described as containing both MATa and MATα information on the same idiomorph, i.e., the α2, α1, and a1 genes in that order [13] (Figs. 2, S1, and S2). In addition, the draft genome sequence of BY4329 (originally named SH4329) revealed a second a1-like gene, together with the C-terminal half of the SLA2 gene, about 18 kb upstream of α2 in the opposite orientation (Fig. 2). The predicted amino acid sequences of the two a1-like proteins were identical except for the N-terminal 24 amino acids (Fig. S3). Amino acid similarity to S. cerevisiae a1 was detected only within the identical sequences (Fig. S3). A similar genome structure was reported for the closely related yeast Ogataea parapolymorpha DL-1 [18]. Hereafter, the a1 gene of the previously reported MAT locus and the second a1-like open reading frame (ORF) are referred to as a1* and a1 genes, respectively, and mating type loci containing them are referred to as the MAT1 and MAT2 loci, respectively, since both are expressed and function in the sexual cycle (Fig. 2, see below).

Mating partner recognition requires two pheromone receptor homologs
To elucidate the molecular mechanism of homothallism in H. polymorpha, the contribution of each mating type gene to the sexual cycle, i.e. mating and meiosis/sporulation, was investigated. To this end, we first sought cells that behaved like heterothallic a and α cell type strains in mating and meiosis. H. polymorpha genome sequences contain ORFs homologous to S. cerevisiae STE2 and STE3 genes encoding α - and a-factor receptors, respectively [19], [20]. Ste2Δ and ste3Δ strains were generated that were expected to behave as heterothallic α and a cell types, respectively, and therefore unable to self-mate, while cross-mating was possible. The mating capability of the strains was determined by a semi-quantitative mating assay. When H. polymorpha mate successfully, the resulting diploid cells (zygotes) immediately undergo meiosis and sporulation, provided that nutrients remain limited. However, if nutrients are supplied after mating and before the commitment to meiosis, cells return to the proliferative state as diploids. We took advantage of this life cycle to evaluate mating efficiency based on the number of diploid colonies formed after return to growth. Although Ste2Δ and ste3Δ cells produced comparable numbers of diploids when crossed with wild-type cells or with each other, no diploids were observed from the Ste2Δ × Ste2Δ and ste3Δ × ste3Δ crosses (Fig. 3A). These results suggest that mating is bipolar in the homothallic laboratory strain derived from NCYC495, and that Ste2Δ and ste3Δ cells can undergo mating only as α and a cells, respectively.

α1 is required for mating, whereas α2 and a1 have roles in meiosis and sporulation
Genetic and phenotypic analyses of mating type gene deletion mutants were carried out to determine the functional roles of the a1, a1*, α1, and α2 transcription factors. Mating capability was evaluated by the semi-quantitative mating assay and meiosis/sporulation was determined by microscopy.
Although mating efficiency was generally low (<∼2% after 24 h) and varied widely among strains, deleting the α1 gene nearly abolished mating with cells of the same genotype (i.e., α1Δ × α1Δ; Fig. 3B). There were no signs of mating such as zygotes and altered cell morphology (i.e., mating projections) detected by microscopy. In contrast, a1*Δ, a1Δ, and α2Δ cells exhibited normal mating behavior and produced homozygous diploids in crosses with cells of the same genotype (i.e., α2Δ × α2Δ, a1*Δ × a1*Δ, and a1Δ × a1Δ; Fig. 3B), although the efficiency was lower for the a1Δ × a1Δ cross than for other combinations. Interestingly, α1Δ cells were able to mate with Ste2Δ cells, but did not produce diploids when mated with ste3Δ (Figs. 3C and S4A). Furthermore, α1Δ ste2Δ cells did not mate with wild-type cells (Figs. 3D and S4B). In contrast, Ste2Δ cells could mate with all mutants of mating type genes (Figs. 3C and S4A). Thus, α1 but not α2 determines the α cell identity and is indispensable for mating. The a cell identity may be established by default, as is the case in S. cerevisiae, because neither the a1* nor the a1 gene was essential for mating. Support for this conjecture comes from the observation that constitutive expression of the α1 gene strongly inhibited mating with Ste2Δ (α cell-like) but not with ste3Δ (a cell-like) (Fig. S5).
Although a1 and α2 were not required for mating, homozygous diploids of a1Δ or α2Δ (a1Δ/a1Δ and α2Δ/α2Δ) did not undergo meiosis nor did they produce spores (Fig. 3E, F). In contrast, a1*Δ/a1*Δ diploid cells exhibited normal meiosis/sporulation (Fig. 3F). Since the amino acid sequences of a1* and a1 are identical except for the N-terminal 24 amino acids (Fig. S3), the possibility of functional redundancy was examined. Meiotic deficiency of a1Δ/a1Δ diploid cells was not suppressed by expressing the a1* gene from the constitutive HpTEF1 promoter[21], while a1 expression restored normal meiosis and sporulation (Fig. 3E), suggesting that the two genes have distinct functions. Thus, α1 has an essential role in mating while a1 and α2 are indispensable for meiosis and sporulation, in a manner analogous to S. cerevisiae. Because a1* was not involved in sexual differentiation, we concluded that MAT1 and MAT2 represent α and a mating types, respectively.
Inversion of the region between MAT1 and MAT2 alters MAT gene expression
The sequences 2049 bp downstream of MAT1 and upstream of MAT2 (referred to as IR1 and IR2, respectively) are identical (Fig. 4A). Since PCR amplification of the region spanning IR1 or IR2 often yields ambiguous results (Fig. S6A), Southern blot analysis was used to verify genome sequences surrounding the two MAT loci. Genomic DNA was prepared from the laboratory wild-type strains HPH22 (derived from BY4329) and BY4330 (originally named SH4330), and DNA fragments encompassing MAT1 and in close proximity to MAT2 were used as probes A and C, respectively. Results for BY4330 matched our draft genome sequences, but for HPH22, a match was observed only if the sequences between IR1 and IR2were presumed to be inverted (Fig. 4A, B). To investigate whether the orientation of this region differed in the two strains, two PCR reactions were carried out in which only one orientation was amplified (Fig. 4C). A PCR product was observed for only one reaction using BY4330 and the other reaction using HPH22 (Fig. 4C), indicating that there are two distinct genomic structures surrounding the MAT loci.
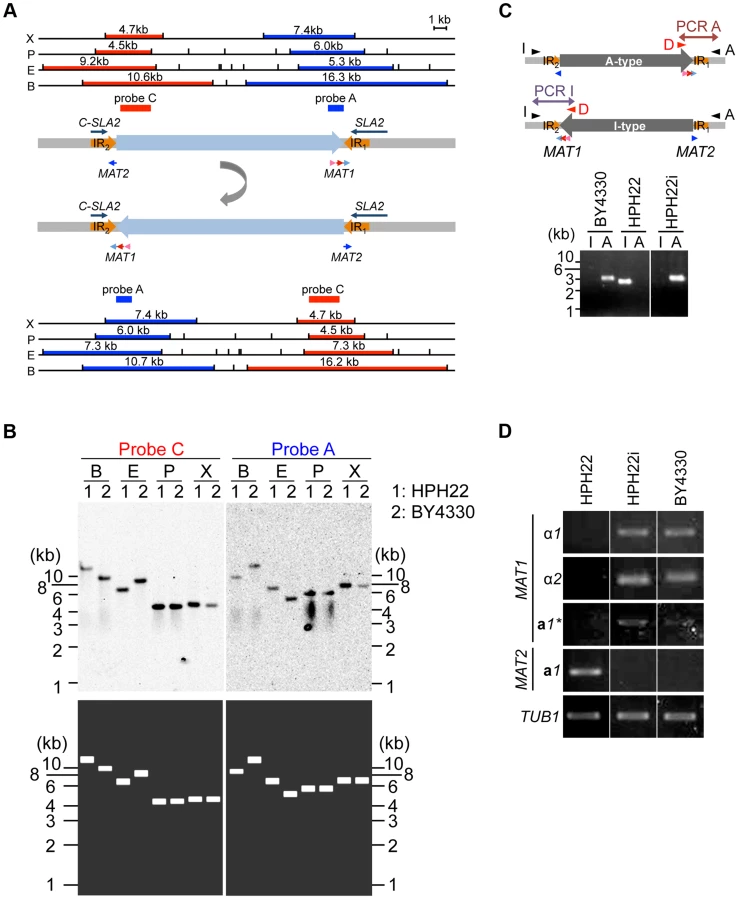
The conservation of gene order flanking the MAT1 locus has been previously noted [13]. The presence of the SLA2 and SUI1 genes downstream of the MAT locus is conserved among yeast species distantly related to S. cerevisiae such as Saccharomyces kluyveri, K. lactis, and Y. lipolytica [13](Fig. S1). Furthermore, the DIC1 gene is located on the other side of MAT in S. kluyveri. Based on this conserved gene order, BY4330 likely reflects the ancestral type. Therefore, the BY4330 and HPH22 types are hereafter referred to as ancestral (A) - and inverted (I)-type, respectively (Fig 4C). In addition, the ancestral chromosomal location of MAT and the 2nd location are referred to as positions 1 and 2, respectively (Fig. 2).
After an additional 5–10 amplification cycles, specific products often appeared in both PCR reactions (Fig. S6A). Furthermore, although most single colonies isolated from HPH22 maintained the I-type orientation, some isolates such as HPH22i became A-type (Fig. 4C). Further isolates obtained from HPH22i (15 out of 16) remained as A-type (Fig. S6B). These results suggest that the switch between I - and A-types can occur in mitotically growing cells, albeit at a low frequency. Moreover, once inversion takes place, the new orientation is stably maintained.
Given that information for both MATa and MATα co-exist in a single cell but cells are nonetheless competent for mating, the possibility that the transcription of mating type genes are differentially regulated was investigated. Reverse transcriptase PCR (RT-PCR) analysis of mitotically growing HPH22 cells revealed that the a1 gene but not genes at the MAT1 locus (α1, α2, and a1*) are expressed (Fig. 4D). In contrast, three genes at MAT1 were expressed while the a1 gene at MAT2 was repressed in BY4330 cells (Fig. 4D). The differences in MAT gene expression patterns were not due to different genetic backgrounds, but were instead dependent on the chromosomal arrangement surrounding MAT loci (A - or I - type), because HPH22i exhibited the same type of expression as BY4330 (Fig. 4D). This suggests that both MAT1 and MAT2 are transcriptionally active at position 1, but are repressed at position 2.
Although α1, α2, a1* RNA was detected by RT-PCR, it is unclear whether these are transcribed individually. The α2 and α1 ORFs are separated only by a 5-bp gap, while a 19-bp overlap exists between α1 and a1* (Fig. S2). Indeed, we detected RNA species that carry both α1 and a1* ORFs (Fig. S7).
Mating type switching is induced by nutrient starvation
Because MAT1 and MAT2 represent α and a mating types, respectively, and the mating type identity of cells was determined by the chromosomal arrangement of MAT loci (A - or I - type), it was predicted that mating efficiency would be higher when the A - and I-types were mixed than for either type alone. However, combining A - or I - types had no effect on mating efficiency (Fig. 5A). This might suggest that the mating type identity of cells frequently switches under mating conditions regardless of the mating type during mitotic growth.

Next, the expression of mating type genes under mating conditions was investigated. In addition to α1, the expression of a1 was induced in the A-type strain BY4330 after a 10-h incubation on the mating medium, MEMA (Fig. 5B, C). Similarly, the α1 transcript was upregulated in the I-type strain HPH22 during mating although the induction was weaker than that of a1 in BY4330 (Fig. 5B, C). Thus, all mating type genes were expressed during mating, providing an explanation for the self-mating observed in all examined strains.
The transcriptional activation of the MAT locus at position 2 after transfer to the mating medium could be due to de-repression of the repressed MAT locus. Alternatively, the inversion of the MAT intervening region could bring the repressed MAT locus to a transcriptionally active location. In the latter instance, the inversion would be frequently observed under starvation conditions. To investigate this possibility, logarithmically growing HPH22, HPH22i, and BY4330 cells were transferred to mating medium and chromosome orientation was evaluated by PCR (Fig. 5D). In all three strains, the inverted orientation became apparent under starvation conditions. The inversion might be more efficient in BY4330 than in HPH22, which could explain the stronger induction of a1 mRNA in BY4330 as compared to α1 mRNA in HPH22 under these conditions (Fig. 5B, C). These results support the notion that the inversion of the MAT intervening region is responsible for transcriptional induction.
The above results do not exclude the possibility that de-repression of the MAT locus at position 2 contributes to mating. In this scenario, the resulting diploids would harbor two chromosomes of the same type; therefore, chromosome types in diploid clones were examined. All 146 diploids isolated from all combinations of crosses had one I - and one A-type chromosome (Table 1). Thus, it is unlikely that transcription from the MAT locus at position 2 contributes significantly to mating. To further confirm the transcriptional status at position 2, meiosis was examined in diploid cells heterozygous for a1Δ (a1Δ/+). Diploid cells carrying the a1Δ allele on an A-type chromosome would be expected to express meiotically indispensable a1 protein from the a1 gene at position 1 on an I-type chromosome. As predicted, such diploid cells underwent efficient meiosis and sporulation (HPH824; Fig. 5E). On the contrary, diploid cells carrying a1Δ on an I-type chromosome would only be capable of meiosis if the a1 gene at position 2 were expressed. Indeed, meiosis was severely perturbed in these cells (HPH825; Fig. 5E). These results suggest that mating type genes at position 2 are not transcribed or else activated at subthreshold levels that are insufficient to induce meiosis.

Homothallism in H. polymorpha relies on inversion
The aforementioned data strongly suggests that the A - and I - inversion types correspond to α and a mating types, respectively, and that inversion of the MAT intervening region is the major mechanism of mating type switching. To test this model, inversion-deficient mutants were generated. Because IR sequences likely play an important role in the inversion, an IR2 deletion was introduced (Fig. 6A), which abolished inversion in A-type (α) cells after transfer to the mating medium (Figs. 6B and S8). Mating with each other and with Ste2Δ cells was almost abolished in these cells, while mating with ste3Δ was unaffected (Fig. 6C). These results suggest that inversion after nutrient starvation is necessary for mating type switching, and is responsible for homothallism in H. polymorpha.

Discussion
The MAT locus of H. polymorpha contains information for both MATα and MATa, which has been proposed as an explanation for homothallism in this haploid species. However, the presence of two different mating types and the mechanisms through which sexual compatibility is established have not been previously examined. Here we report the complete set of mating type genes and their roles during sexual development. The results suggest that mating type identity is determined by which of the two MAT loci are present at the actively expressed locus, and that homothallism results from the inversion of the intervening chromosomal region to result in mating-type switching.
Sexual compatibility in H. polymorpha
Mutational analyses revealed that mating and meiosis are regulated by the distinct functions of four mating type gene products in H. polymorpha (Fig. 7A). The activation of haploid-specific genes is likely to be regulated in a manner similar to what is presumed for mating type genes of S. cerevisiae, although genes that are expressed specifically in a-, α-, or haploid cells have not yet been identified in H. polymorpha. In S. cerevisiae haploid cells, α1 is essential for α-specific gene expression, while a-specific genes are expressed by default and do not require any mating type genes. Thus, in this species, a cell identity is established by default unless α2 represses a-specific genes [1]. Establishment of α identity requires the activation of α-specific genes by α1 in addition to the repression of a-specific genes. However, in H. polymorpha, α2 is not involved in the repression of a-specific genes, and it is therefore unclear how these are repressed in α cells. It is currently unknown whether the repression of a-specific genes is necessary in α cells. One possibility is that α1 contributes to this repression, as was suggested in C. lusitaniae [4]. Alternatively, there may be no mechanism to repress a-specific genes, in which case the intrinsic noise of gene expression may create different populations that express variable levels of α1 and a-specific genes. Cells may therefore exhibit α identity during a time window during which α1 level is high and a-specific gene expression is low.

Repression of the MAT locus
The MAT loci in H. polymorpha—MAT1 and MAT2—are transcriptionally active at position 1, the ancestral location. However, their transcription became repressed at position 2 after the inversion of the MAT intervening region. The promoter sequences of mating type genes were not responsible for the repression, since sequences upstream of mating type genes were unaltered; instead, the orientation of mating type genes and others within the MAT intervening region was reversed. However, this was unlikely to repress transcription. Indeed, the expression of the FAS2 gene located in the middle of the MAT intervening region was independent of A - or I-type arrangement and nutrient starvation (Fig. S9) [22]. The most plausible explanation is that position 2 is in a silent configuration. This is supported by the fact that there are no ORFs in the >12 kb region next to IR2 distal to position 1, except for one encoding the polyprotein-like protein of the Ty/Copia retrotransposon. It may also explain why IR2 deletion could not be rescued by a DNA fragment containing a selection marker of similar size. Whether the repression at position 2 depends on heterochromatin structure is unknown. However, it is worth noting that, like other Saccharomycotina, there are no Heterochromatin Protein 1 family members in H. polymorpha, nor any clear homologs of S. cerevisiae trans-acting silencing proteins such as Sir1, Sir3, and Sir4 [23]-[26], although a histone deacetylase homologous to S. cerevisiae Sir2/Hst1 is present. H. polymorpha may have a silencing mechanism in which the Sir2 homolog plays a critical role and the Orc1 homolog possesses a Sir3-like silencing function as in K. lactis [27]. A Sir4 homolog may be too diverse to detect based on amino acid sequence similarity [28].
Transcriptional circuit of sexual programs in H. polymorpha
Mating and meiosis are distinct programs in S. cerevisiae but are integrated in H. polymorpha. A similar sexual cycle occurs in the Saccharomycotina species C. lusitaniae and the distantly related Taphrinomycotina species S. pombe [4]. A recent study on the mechanism of sexual programs in C. lusitaniae has revealed the co-regulation of mating - and meiosis-specific gene expression programs [29]. In S. cerevisiae, the pheromone-associated transcription factors Ste12 and Ime2 are specifically involved in mating and meiosis, respectively. In contrast, C. lusitaniae Ste12 and Ime2 orthologs are required for efficient progression through both mating and meiosis. The absence of α2, which prevented expression of haploid-specific genes, including MAPK genes, was proposed to facilitate MAPK signaling and confer a meiotic role to Ste12. The coupling of mating and meiosis may have evolved to ensure the return of diploids to the haploid state to satisfy the preference for haploidy [29]. The same argument could be applied to the sexual cycle of the predominantly haploid H. polymorpha. Nonetheless, there are species differences in the expression of components essential for sexual regulation. In both C. lusitaniae and S. pombe, the transcription of genes encoding pheromone receptors and pheromone-associated transcription factors is induced during mating, but these are constitutively expressed in mitotically growing H. polymorpha cells (Fig. S10) [4], [30]–[32]. The evolution of this constitutive expression and the mechanisms involved in its regulation will be a focus of future studies.
Mechanism of homothallism
Mating type switching has been best studied in S. cerevisiae, K. lactis, and S. pombe [14], [15], [33]. These species all harbor silent cassettes in their genomes and their switching events are mitotic recombination-dependent, although the molecular details differ. Homothallism in H. polymorpha involves two independent regulatory processes: transcriptional repression of one MAT locus, and inversion of the chromosomal region between the two MAT loci—MAT1 and MAT2—that reside ∼18 kb apart on the same chromosome and are idiomorphs for the α and a mating types, respectively (Fig. 7B). Both MAT loci are active in the ancestral chromosomal position (position 1) while the other locus (at position 2) is repressed. The inversion of the MAT intervening region is induced under mating conditions, resulting in a chromosome that harbors the formerly repressed mating type genes at the active location and establishes the opposite mating type identity. Because this system differs from those of S. cerevisiae and K. lactis, it is likely to have evolved independently after H. polymorpha branched out from Saccharomycetaceae. Interestingly, the organization of MAT1 is similar to that observed in homothallic Pezizomycotina such as Sclerotiniasclerotiorum and some Cocliobolus species [34], [35]. In the former, the inversion of part of the MAT locus leads to mating type switching [36]. Thus, the fusion of two MAT idiomorphs of the heterothallic ancestor followed by the acquisition of mitotic recombination to differentiate the two transcriptional profiles likely occurred multiple times during fungal evolution. In H. polymorpha, the insertion of a retrotransposon found in close proximity to position 2 may have caused the duplication of the IR region that contains most of the a1*/a1 ORF and then initiated an inversion event between the two IR regions. The two MAT loci in H. polymorpha may therefore represent an intermediate state preceding the acquisition of a set of silent cassettes. Comparative studies in other fungal species would be required to evaluate this possibility.
The molecular mechanism underlying the inversion in H. polymorpha is currently unknown. Well-studied examples of inversion-dependent phenotypic switching include phase variation systems in bacteria, such as Type 1 fimbrial phase variation in Escherichia coli and flagellar phase variation in Salmonella enterica, where the inverting regions contain a promoter for adjacent genes that determine the phenotype, with inversion therefore resulting in transcriptional on/off switching. In these cases, nonhomologous, site-specific serine or tyrosine families of recombinases act on inverted repeats, which leads to the inversion of the intervening sequence [37], [38]. In S. cerevisiae, the site-specific FLP tyrosine recombinase is an essential part of the 2-µm plasmid amplification system [39]. It will be interesting to determine whether inversion in H. polymorpha depends on site-specific recombination. However, there were no serine or tyrosine recombinases in the genome. Given that long homologous sequences (>2 kb) are in inverted orientations (IR1 and IR2), homologous recombination between IR regions is another possible mechanism leading to inversion of the MAT intervening region.
Although inversion is observed at low frequency during mitotic growth, it is strongly induced upon nutrient starvation in H. polymorpha. It is interesting that mating type switching is induced and mating is initiated in response to harsh environmental conditions such as nutritional starvation in K. lactis [40]. Elucidating the molecular mechanisms and regulation of mating type switching in H. polymorpha can provide deeper insight into how mating type switching evolved.
Materials and Methods
Yeast strains and plasmids
Strains and plasmids used in this study are listed in Table S1. Unless otherwise indicated, yeast strains were derived from NCYC495 [41] and were generated by PCR-based methods [42], [43]. Gene deletion alleles were generated in ku80Δ or ku70Δ cells and then crossed with either HPH22 or BY4330 to obtain KU80+ or KU70+ cells carrying the deletion allele. Primers used to amplify cassettes are listed in Table S2. H. polymorpha cells were transformed by electroporation [44]. pSC6cen103a is a newly developed plasmid stably maintained in H. polymorpha, the construction of which will be described elsewhere. The HpURA3 DNA fragment containing 800 bp upstream and 500 bp downstream sequences was amplified by PCR and inserted into AatII/SacI sites in pRS305 to generate pHM821. The 500-bp sequences up - and downstream of the HpTEF1 ORF were used as the HpTEF1 promoter and terminator, respectively [21].
Yeast growth conditions and general methods
Yeast strains were grown in yeast extract, peptone, and dextrose medium containing 200 mg/l adenine, leucine, and uracil (YPDS) [45]. Diploid cells were grown in synthetic/defined (SD) medium supplemented with appropriate amino acids and nucleotides. Cells were grown at 30°C unless otherwise indicated. Mating and meiosis were induced on 2.5% maltose and 0.5% malt extract medium (MEMA) plates at 30°C.
Microscopy
Yeast cells were fixed with 70% ethanol, washed with phosphate-buffered saline (PBS), and incubated in PBS containing 1 µg/ml 4′6,-diamidino-2-phenylindole (DAPI) to visualize DNA. Images were acquired using the DeltaVision Personal system (Applied Precision, Issaquah, WA, USA). A Z series in 0.4-µm steps was acquired for DAPI images, and ImageJ (National Institutes of Health, Bethesda, MD, USA) was used to generate projected images. Adobe Photoshop (Adobe Systems, Inc., San Jose, CA, USA) was used to process and produce merged images.
Genome sequencing and determination of A - or I-type
The BY4329 genome was sequenced using a Genome Sequencer FLX System (Roche Diagnostics, Basel, Switzerland) and Genome Analyzer GAIIx (Illumina Inc., San Diego, CA, USA). The paired-end library for the former was prepared according to the Paired-End Library Preparation Method Manual −20 kb and 8 kb Span (Roche Diagnostics), and a genome library for the latter was prepared with a TruSeq DNA Sample Preparation v2 Kit (Illumina Inc.) according to the manufacturer's protocol. All reads were assembled into contigs and then ordered into scaffolds using GS De Novo Assembler version 2.6 (Roche Diagnostics). The draft sequence data is submitted to DNA Data Bank of Japan (DDBJ) and its BioProject ID is PRJDB3035.
To determine the orientation of the region between IR1 and IR2, PCR primers specific for the sequence to the left of IR2 (Primer_I), the intervening region (Primer_D and Primer_E), and the sequence to the right of IR1 (Primer_A) were designed. Primer_I and Primer_D were used in the I reaction, which yielded an I-type chromosome-specific 3-kb PCR product, while Primer_A and Primer_D were used in the A reaction, which was A-type chromosome-specific. Primer_A and Primer_E were used in the Ai reaction, which gave an I-type-specific product. A total of 10 ng genomic DNA was used in each reaction. I - or A - type was judged after 20 cycles of amplification with PrimeSTAR Max DNA polymerase (Takara Bio Inc., Shiga, Japan).
For Southern blotting, H. polymorpha genomic DNA was prepared using a standard protocol [46]. Briefly, 3 µg DNA was digested with EcoRI, XhoI, PstI, and BamHI restriction enzymes before electrophoresis. A standard protocol was used for blotting and hybridization [46]. DNA probes were prepared and detection was performed using the AlkPhos Direct Labeling and Detection System with CDP-Star (GE Healthcare, Pittsburgh, PA, USA).
Semi-quantitative mating
Yeast strains of leu1-1 or ura3-1 genotypes were grown at 30°C in YPDS until the optical density at 663 nm (A663) was between 0.5 and 1.5. Cells were washed with PBS and diluted to A663 = 1.0, and a 10-µl cell suspension of the two strains was mixed on a nitrocellulose membrane filter that was placed on a MEMA plate and incubated for 24 h at 30°C. Cells were re-suspended in PBS and dilutions were plated on SD plates supplemented with leucine or uracil or on unsupplemented SD plates that were incubated for 2 days at 37°C. The mating percentage was calculated as the number of colonies on unsupplemented plates divided by the number on leucine - or uracil-supplemented plates (i.e., whichever had fewer colonies). It should be noted that the mating percentage does not represent overall mating efficiency because meiosis and sporulation proceed immediately after mating in H. polymorpha.
RNA analysis
Total RNA was isolated from H. polymorpha as previously described [47], treated with DNase I, and then further purified using the RNeasy Plus Kit (Qiagen, Valencia, CA, USA). A total of 1 µg RNA was used to synthesize cDNA with SuperScriptIII (Invitrogen, Carlsbad, CA, USA) according to the manufacturer's protocol, and 1 µl cDNA reaction mixture was used in a PCR reaction with the primers listed in Table S2. The QuantStudio 3D Digital PCR system (Thermo Fisher Scientific Inc., Waltham, MA, USA) was used to quantify RNA copy number. Forward, reverse, and TaqMan primers are listed in Table S2.
Supporting Information
Zdroje
1. HerskowitzI (1989) A regulatory hierarchy for cell specialization in yeast. Nature 342 : 749–757.
2. LeeSC, NiM, LiW, ShertzC, HeitmanJ (2010) The Evolution of Sex: a Perspective from the Fungal Kingdom. Microbiology and Molecular Biology Reviews 74 : 298–340 doi:10.1128/MMBR.00005-10
3. HaberJE (2012) Mating-Type Genes and MAT Switching in Saccharomyces cerevisiae. Genetics 191 : 33–64 doi:10.1534/genetics.111.134577
4. ReedyJL, FloydAM, HeitmanJ (2009) Mechanistic Plasticity of Sexual Reproduction and Meiosis in the Candida Pathogenic Species Complex. Current Biology 19 : 891–899 doi:10.1016/j.cub.2009.04.058
5. JonesSKJr, BennettRJ (2011) Fungal mating pheromones: Choreographing the dating game. Fungal Genetics and Biology 48 : 668–676 doi:10.1016/j.fgb.2011.04.001
6. NakayamaN, MiyajimaA, AraiK (1987) Common signal transduction system shared by STE2 and STE3 in haploid cells of Saccharomyces cerevisiae: autocrine cell-cycle arrest results from forced expression of STE2. EMBO J 6 : 249–254.
7. HerskowitzI (1995) MAP Kinase Pathways in Yeast: Review For Mating and More. Cell 80 : 187–197.
8. MerliniL, DudinO, MartinSG (2013) Mate and fuse: how yeast cells do it. Open Biology 3 : 130008 doi:10.1007/BF00312769
9. RaudaskoskiM, KotheE (2010) Basidiomycete Mating Type Genes and Pheromone Signaling. Eukaryotic Cell 9 : 847–859 doi:10.1128/EC.00319-09
10. Poggeler S (2007) MAT and Its Role in the Homothallic Ascomycete Sordaria macrospora. In: Heitman J, Kronstad J, Taylor J, Casselton L, editors. Sex in Fungi. American Society for Microbiology. pp. 171–188. doi:10.1128/9781555815837.ch10.
11. HicksJB, HerskowitzI (1977) Interconversion Of Yeast Mating Types Ii. Restoration Of Mating Ability To Sterile Mutants In Homothallic And Heterothallic Strains.Genetics 85 : 373–393.
12. Klar AJS, Fogel S, Radin DN (1979) Switching Of A Mating-Type a Mutant Allele In Budding Yeast Saccharomyces cerevisiae. Genetics: 759–776.
13. ButlerG, KennyC, FaganA, KurischkoC, GaillardinC, et al. (2004) Evolution of the MAT locus and its Ho endonuclease in yeast species. Proceedings of the National Academy of Sciences 101 : 1632–1637 doi:10.1073/pnas.0304170101
14. HermanA, RomanH (1966) Allele specific determinants of homothallism in Saccharomyces lactis. Genetics 53 : 727–740.
15. BarsoumE, MartinezP, AstromSU (2010) Alpha3, a transposable element that promotes host sexual reproduction. Genes & Development 24 : 33–44 doi:10.1101/gad.557310
16. Hansen H, Hollenberg CP (1996) Hansenula polymorpha (Pichia angusta). In: Wolf K, editor. Nonconventional Yeasts in Biotechnology. Berlin, Heidelberg: Springer Berlin Heidelberg. pp. 293–311. doi:10.1007/978-3-642-79856-6_9.
17. Lahtchev K (2002) Basic genetics of Hansenula polymorpha. In: Gellissen G, editor. Hansenula polymorpha. wiley-vch. pp. 8–20.
18. RavinNV, EldarovMA, KadnikovVV, BeletskyAV, SchneiderJ, et al. (2013) Genome sequence and analysis of methylotrophic yeast Hansenula polymorpha DL1. BMC Genomics 14 : 837 doi:10.1186/1471-2164-14-837
19. BurkholderAC, HartwellLH (1985) The yeast a-factor receptor: structural properties deduced from the sequence of the STE2 gene. Nucleic Acids Res 13 : 8463–8475.
20. HagenDC, McCaffreyG, SpragueGJ (1986) Evidence the yeast STE3 gene encodes a receptor for the peptide pheromone a factor: Gene sequence and implicationsfor the structure of the presumed receptor. Proceedings of the National Academy of Sciences 83 : 1418–1422.
21. KielJAKW, TitorenkoVI, van der KleiIJ, VeenhuisM (2007) Overproduction of translation elongation factor 1-alpha (eEF1A) suppresses the peroxisome biogenesis defect in a Hansenula polymorpha pex3 mutant via translational read-through. FEMS Yeast Research 7 : 1114–1125 doi:10.1111/j.1567-1364.2007.00232.x
22. SangwallekJ, KanekoY, SugiyamaM, OnoH, BambaT, et al. (2013) for fatty acyl chain length in Saccharomyces cerevisiae. Arch Microbiol 195 : 843–852 doi:10.1007/s00203-013-0933-3
23. HaberJE, GeorgeJP (1979) A mutation that permits the expression of normally silent copies of mating-type information in Saccharomyces cerevisiae. Genetics 93 : 13–35.
24. RineJ, StrathernJN, HicksJB, HerskowitzI (1979) A suppressor of mating-type locus mutations in Saccharomyces cerevisiae: evidence for and identification of cryptic mating-type loci. Genetics 93 : 877–901.
25. RineJ, HerskowitzI (1987) Four Genes Responsible for a position effect on expressio from HML and HMR in Saccharomyces cerevisiae. Genetics 116 : 9–22.
26. LorentzA, OstermannK, FleckO, SchmidtH (1994) Switching gene swi6, involved in repression of silent mating-type loci in fission yeast, encodes a homologue of chromatin-associated proteins from. Gene 143 : 139–143.
27. HickmanMA, RuscheLN (2010) Transcriptional silencing functions of the yeastprotein Orc1/Sir3 subfunctionalizedaftergene duplication. Proceedings of the National Academy of Sciences 107 : 19384–19389 doi:10.1073/pnas.1006436107/-/DCSupplemental
28. AströmSU, RineJ (1998) Theme and Variation Among Silencing Proteins in Saccharomyces cerevisiae and Kluyveromyces lactis. Genetics 148 : 1021–1029.
29. SherwoodRK, ScadutoCM, TorresSE, BennettRJ (2014) Convergent evolution of a fused sexual cycle promotes the haploid lifestyle. Nature 506 : 387–390 doi:10.1038/nature12891
30. KitamuraK, ShimodaC (1991) The Schizosaccharomyces pombe mam2 gene encodes a putative pheromone receptor which has a significant homology with the Saccharomyces cerevisiae Ste2 protein. EMBO J 10 : 3743–3751.
31. TanakaK, DaveyJ, ImaiY, YamamotoM (1993) Schizosaccharomyces pombe map3+ encodes the putative M-factor receptor. Molecular and Cellular Biology 13 : 80–88.
32. TodaT, ShimanukiM, YanagidaM (1991) Fission yeast genes that confer resistance to staurosporine encode an AP-1-like transcription factor and a protein kinase related to the mammalian ERK1/MAP2 and budding yeast FUS3 and KSS1 kinases. Genes & Development 5 : 60–73 doi:10.1101/gad.5.1.60
33. Arcangioli B, Thon G (2004) Mating-Type Cassettes: Structure, Switching and Silencing. In: Egel R, editor. The Molecular Biology of Schizosaccharomyces pombe. Berlin, Heidelberg: Springer Berlin Heidelberg. pp. 129–147. doi:10.1007/978-3-662-10360-9_9.
34. YunS-H, BerbeeML, YoderOC, TurgeonBG (1999) Evolution of the fungal self-fertile reproductive life style from self-sterile ancestors. Proceedings of the National Academy of Sciences 96 : 5592–5597.
35. YunS-H, ArieT, KanekoI, YoderOC, TurgeonBG (2000) Molecular Organization of Mating Type Loci in Heterothallic, Homothallic, and Asexual Gibberella/Fusarium Species. Fungal Genetics and Biology 31 : 7–20 doi:10.1006/fgbi.2000.1226
36. ChitrampalamP, InderbitzinP, MaruthachalamK, WuB-M, SubbaraoKV (2013) The Sclerotinia sclerotiorum Mating Type Locus (MAT) Contains a 3.6-kb Region That Is Inverted in Every Meiotic Generation. PLoS ONE 8: e56895 doi:10.1371/journal.pone.0056895.s022
37. SilvermanM, SimonM (1980) Phase Variation: Genetic Analysis of Switching Mutants. Cell 19 : 845–854.
38. van der WoudeMW, BäumlerAJ (2004) Phase and antigenic variation in bacteria. Clinical Microbiology Reviews 17 : 581–611 doi:10.1128/CMR.17.3.581-611.2004
39. AndrewsBJ, ProteauGA, BeattyLG, SadowskiPD (1985) The FLP Recombinase of the 2∼ Circle DNA of Yeast: Interaction with Its Target Sequences. Cell 40 : 759–803.
40. BarsoumE, RajaeiN, AstromSU (2011) RAS/cyclic AMP and transcription factor Msn2 regulate mating and mating-type switching in the yeast Kluyveromyces lactis. Eukaryotic Cell 10 : 1545–1552 doi:10.1128/EC.05158-11
41. LuSF, TolstorukovII, AnamnartS, KanekoY, HarashimaS (2000) Cloning, sequencing, and functional analysis of H-OLE1 gene encoding delta9-fatty acid desaturase in Hansenula polymorpha. Appl Microbiol Biotechnol 54 : 499–509.
42. JankeC, MagieraMM, RathfelderN, TaxisC, ReberS, et al. (2004) A versatile toolbox for PCR-based tagging of yeast genes: new fluorescent proteins, more markers and promoter substitution cassettes. Yeast 21 : 947–962 doi:10.1002/yea.1142
43. SarayaR, KrikkenAM, KielJAKW, BaerendsRJS, VeenhuisM, et al. (2012) Novel genetic tools for Hansenula polymorpha. FEMS Yeast Research 12 : 271–278 doi:10.1111/j.1567-1364.2011.00772.x
44. FaberKN, HaimaP, HarderW, VeenhuisM, GeertAB (1994) Highly-efficient electrotransformation of the yeast Hansenulapolymorpha. Current Genetics 25 : 305–310.
45. ShermanF (1991) Getting started with yeast. Meth Enzymol 194 : 3–21.
46. Sambrook J, Russell DW (2001) Molecular Cloning. CSHL Press. 1 pp.
47. van ZutphenT, BaerendsRJ, SusannaKA, de JongA, KuipersOP, et al. (2010) Adaptation of Hansenula polymorpha to methanol: a transcriptome analysis. BMC Genomics 11 : 1 doi:10.1186/1471-2164-11-1
Štítky
Genetika Reprodukční medicínaČlánek vyšel v časopise
PLOS Genetics
2014 Číslo 11
- Kazuistika – Perspektivy využití precizované medicíny v rámci personalizované specifické terapie onkologických pacientů
- Nobelova cena za chemii pro genetické nůžky: Objev, který změní naši budoucnost?
- Technologie na bázi RNA v klinické praxi: od přebarvených petúnií k terapii vzácných a dosud jen obtížně léčitelných chorob u lidí
- „Nepředstavovali jsme si, že náš výzkum povede přímo ke vzniku nových léků, dokonce ještě za našeho života“
- Bezplatné služby pro diagnostiku ATTRv amyloidózy pro kardiology
Nejčtenější v tomto čísle
- An RNA-Seq Screen of the Antenna Identifies a Transporter Necessary for Ammonia Detection
- Systematic Comparison of the Effects of Alpha-synuclein Mutations on Its Oligomerization and Aggregation
- Functional Diversity of Carbohydrate-Active Enzymes Enabling a Bacterium to Ferment Plant Biomass
- Regularized Machine Learning in the Genetic Prediction of Complex Traits
Zvyšte si kvalifikaci online z pohodlí domova
Mazová zátka a její řešení
nový kurzVšechny kurzy