
Integrated Enrichment Analysis of Variants and Pathways in Genome-Wide Association Studies Indicates Central Role for IL-2 Signaling Genes in Type 1 Diabetes, and Cytokine Signaling Genes in Crohn's Disease
Pathway analyses of genome-wide association studies aggregate information over sets of related genes, such as genes in common pathways, to identify gene sets that are enriched for variants associated with disease. We develop a model-based approach to pathway analysis, and apply this approach to data from the Wellcome Trust Case Control Consortium (WTCCC) studies. Our method offers several benefits over existing approaches. First, our method not only interrogates pathways for enrichment of disease associations, but also estimates the level of enrichment, which yields a coherent way to promote variants in enriched pathways, enhancing discovery of genes underlying disease. Second, our approach allows for multiple enriched pathways, a feature that leads to novel findings in two diseases where the major histocompatibility complex (MHC) is a major determinant of disease susceptibility. Third, by modeling disease as the combined effect of multiple markers, our method automatically accounts for linkage disequilibrium among variants. Interrogation of pathways from eight pathway databases yields strong support for enriched pathways, indicating links between Crohn's disease (CD) and cytokine-driven networks that modulate immune responses; between rheumatoid arthritis (RA) and “Measles” pathway genes involved in immune responses triggered by measles infection; and between type 1 diabetes (T1D) and IL2-mediated signaling genes. Prioritizing variants in these enriched pathways yields many additional putative disease associations compared to analyses without enrichment. For CD and RA, 7 of 8 additional non-MHC associations are corroborated by other studies, providing validation for our approach. For T1D, prioritization of IL-2 signaling genes yields strong evidence for 7 additional non-MHC candidate disease loci, as well as suggestive evidence for several more. Of the 7 strongest associations, 4 are validated by other studies, and 3 (near IL-2 signaling genes RAF1, MAPK14, and FYN) constitute novel putative T1D loci for further study.
Published in the journal:
. PLoS Genet 9(10): e32767. doi:10.1371/journal.pgen.1003770
Category:
Research Article
doi:
https://doi.org/10.1371/journal.pgen.1003770
Summary
Pathway analyses of genome-wide association studies aggregate information over sets of related genes, such as genes in common pathways, to identify gene sets that are enriched for variants associated with disease. We develop a model-based approach to pathway analysis, and apply this approach to data from the Wellcome Trust Case Control Consortium (WTCCC) studies. Our method offers several benefits over existing approaches. First, our method not only interrogates pathways for enrichment of disease associations, but also estimates the level of enrichment, which yields a coherent way to promote variants in enriched pathways, enhancing discovery of genes underlying disease. Second, our approach allows for multiple enriched pathways, a feature that leads to novel findings in two diseases where the major histocompatibility complex (MHC) is a major determinant of disease susceptibility. Third, by modeling disease as the combined effect of multiple markers, our method automatically accounts for linkage disequilibrium among variants. Interrogation of pathways from eight pathway databases yields strong support for enriched pathways, indicating links between Crohn's disease (CD) and cytokine-driven networks that modulate immune responses; between rheumatoid arthritis (RA) and “Measles” pathway genes involved in immune responses triggered by measles infection; and between type 1 diabetes (T1D) and IL2-mediated signaling genes. Prioritizing variants in these enriched pathways yields many additional putative disease associations compared to analyses without enrichment. For CD and RA, 7 of 8 additional non-MHC associations are corroborated by other studies, providing validation for our approach. For T1D, prioritization of IL-2 signaling genes yields strong evidence for 7 additional non-MHC candidate disease loci, as well as suggestive evidence for several more. Of the 7 strongest associations, 4 are validated by other studies, and 3 (near IL-2 signaling genes RAF1, MAPK14, and FYN) constitute novel putative T1D loci for further study.
Introduction
By systematically surveying the genome for variants correlated with disease phenotypes, genome-wide association studies (GWAS) have led to the discovery of genes and genetic loci underlying complex diseases [1]–[4]. Even though disease-correlated variants tend to have small effects on susceptibility to disease, followup investigations of the genetic loci implicated by GWAS have nonetheless advanced our understanding of many complex diseases. One strategy researchers have taken to translate initial genetic clues into biological models of disease etiology has been to identify common features of these genetic loci. For example, the discovery of disease-correlated variants in GWAS of Crohn's disease, a common form of inflammatory bowel disease, has helped draw links to genes that regulate autophagy and innate immune responses [5]–[10].
Recognizing that insights into disease can emerge by exploring the functional relationships among genes implicated in GWAS, researchers have attempted to assess these relationships in a systematic way by developing “pathway analysis” approaches to GWAS [11]–[28]. These methods are motivated by the theory that complex disease arises from the accumulation of genetic effects acting within common biological pathways [29]–[32]. The aim is to identify pathways that are enriched for disease—that is, groups of related genes that preferentially harbour disease-associated variants compared to arbitrary regions of the genome. Identifying enriched pathways is an important aim in itself, but pathway analysis can also improve power to uncover genetic factors relevant to disease; a major shortcoming of standard mapping approaches that test each marker one at a time for association with disease is that they lack power to map genetic factors of small effect [33]–[36]. The intuition is that identifying the accumulation of genetic effects acting in a common pathway is often easier than mapping the individual genes within the pathway that contribute to disease susceptibility.
Despite the considerable potential of pathway analysis approaches to GWAS, existing methods have an important limitation: they do not tell us which genes within an enriched pathway are most likely relevant to disease. Identifying enriched pathways is often useful, but many pathways contain genes with only loosely interrelated functions, so identifying the genes and variants within the pathway that are driving the enrichment is likely to yield additional insights into disease. This could be tackled in a two-stage process: first, identify the enriched pathways; second, gauge support for associated variants within the enriched pathways. In the second stage, significance thresholds for association could be relaxed relative to a genome-wide scan, reflecting the increased likelihood that variants near genes in the pathway are associated with disease. This is called prioritizing variants within the pathway [29], [37]–[45]. The question is how to implement this in a systematic way: to what extent can we relax significance thresholds while keeping the rate of false positives at an acceptable level?
To address this question, we develop a model-based approach for integrated analysis of pathways and genetic variants, in which we interpret enrichment as a parameter of the model. We begin with a large-scale multivariate regression that models disease risk as the combined effect of multiple markers. Unlike single-marker disease mapping, the multi-marker approach accounts for correlations between variants that arise due to linkage disequilibrium. Within this framework, we introduce an enrichment parameter that quantifies the increase in the probability that each variant in the pathway is associated with disease susceptibility. This model-based approach not only estimates the level of enrichment, but also adjusts the evidence for disease associations in light of predicted pathway enrichments—and, in so doing, tackles the problem of how to prioritize variants related to groups of genes or pathways.
Though we focus on incorporating pathways—and, more broadly, biologically related gene sets—into analysis of GWAS, our methods could be applied to other types of genome annotations, such as Gene Ontology categories [46], and DNA sequences where proteins are recruited to regulate gene transcription [47]–[51]. In this respect, our method is related to other model-based approaches that leverage prior knowledge about variants to estimate enrichment of association signals across functionally related regions or locate causal variants that affect disease risk [29], [52]–[62]. One distinguishing feature of our approach is that we have an efficient procedure to evaluate hypotheses about enrichment, which allows us to interrogate support for enrichment of thousands of candidate pathways in genome-wide data.
Another feature that distinguishes our analysis is that we use multiple pathway databases in an attempt to interrogate pathways as comprehensively as possible—the more pathways we consider, the greater chance we have of drawing new connections between pathways, genes within these pathways, and complex disease. We demonstrate how using our approach to comprehensively interrogate pathways results in increased evidence for enrichment, and is robust to inclusion of a large number of irrelevant pathways. In our case studies, we include ∼3100 candidate gene sets drawn from eight pathway databases available on the Web [44], [63], [64].
We illustrate our approach in a detailed analysis of genome-wide data from the Wellcome Trust Case-Control Consortium (WTCCC) studies of 7 complex diseases [65]. These studies provide an opportunity to gauge the added value of our approach because genetic associations based on these data have already been published [65], and pathway analyses of these data have found evidence for enriched pathways [11], [13], [16], [22], [23], [66]–[74]. Our methods highlight several pathways that have not been identified in previous pathway-based analyses, but which are known to be linked to these diseases. And, by prioritizing variants within the enriched pathways, our methods identify disease-susceptibility candidates that are not deemed significant in conventional analyses of the same data. These results demonstrate the potential for our methods to yield novel biological insights into complex disease.
Overview of statistical analysis
Our approach builds on previous work that casts simultaneous analysis of genetic variants as a variable selection problem—the problem of deciding which variables (the genetic variants) to include in a multivariate regression of the phenotype. We begin with a method that assumes each variant is equally likely to be associated with the phenotype [75], [76], then we modify this assumption to allow for enrichment of associated variants in a pathway.
The data from the GWAS are the genotypes and phenotypes from n study participants. We assume the genetic markers are single nucleotide polymorphisms (SNPs), and the phenotype is disease status: patients with the disease (“cases”) are labeled , and disease-free individuals (“controls”) are labeled . Entries of the matrix are observed minor allele counts , or expectations of these counts estimated using genotype imputation [77], [78], for each of the n samples and p SNPs.
We assume an additive model of disease risk, in which the log-odds for disease is a linear combination of the minor allele counts:

Although the log-odds for disease is expressed in (1) as a linear combination of all SNPs, our framework is guided by the assumption that most SNPs have no effect on disease risk (). While there is some debate over this assumption [80], an advantage of this choice is that a SNP “included” in the multi-marker disease model—that is, a SNP j that has a non-zero coefficient, —indicates that the SNP is relevant to disease, or that it is in linkage disequilibrium with other, possibly untyped, variants that contribute to disease risk. Therefore, the main goal of the analysis is to identify regions of the genome that contain SNPs included in the disease model with high posterior probability, or identify SNPs within these regions that have a high “posterior inclusion probability,” . A high PIP is the analogue of a small p-value in a conventional single-marker analysis.
To obtain these posterior probabilities, we must first specify a prior for the coefficients . A standard assumption, and the assumption made in previous approaches [75], [76], is that all SNPs are equally likely to be associated with the phenotype a priori; that is, is the same for all SNPs.
To model enrichment of associations within a pathway, we modify this prior. Precisely, the prior inclusion probability for SNP j depends on whether or not it is assigned to the enriched pathway:

We assess enrichment by framing each hypothesis test for enrichment as a model comparison problem. To weigh the evidence for the hypothesis that candidate pathway with indicators is enriched for disease associations, we evaluate a Bayes factor [81], [82]:

Note that the Bayes factor (3) does not allow for a negative —that is, pathways that are underrepresented for associations with the phenotype. While it could be useful to investigate negative log-enrichments in other settings, in most GWAS of complex disease where there are generally few significant associations to begin with, reduced rates of disease associations in pathways would be difficult to find, and would be unlikely to have a useful interpretation.
We use the same approach to test for joint enrichment of multiple candidate pathways. We compute as before (eq. 3), except that we set to 1 whenever SNP j is assigned to at least one of the enriched pathways. In this case, represents the increased level of associations (on the log-odds scale) among SNPs assigned to one or more of the pathways. This is equivalent to assuming that all enriched pathways have the same level of enrichment, which greatly simplifies the analysis. We allow for different enrichment levels only when accounting for enrichment of the MHC in RA and T1D. In that case, we have good reason to treat the MHC differently, given the predominant contribution of MHC alleles to RA and T1D risk [83], [84].
To assess evidence for association of individual variants with the phenotype, we compute for each variant j. These posterior probabilities depend on which pathways are enriched, and on the log-fold enrichment , because these factors affect the prior probabilities , which in turn affect the posterior probabilities , following Bayes' rule. (In practice, we account for uncertainty in and when calculating the posterior probabilities by averaging over and ; see Methods.) Since enrichment leads to higher prior inclusion probabilities for SNPs in the enriched pathway, an association that is not identified by a conventional genome-wide analysis may become a strong candidate in light of its presence in an enriched pathway. Because we estimate from the data, the extent to which we prioritize variants is determined by the data. In this way, our framework integrates the problem of identifying enriched pathways with the problem of prioritizing variants near genes in enriched pathways.
Results
We illustrate our methods in a detailed analysis of genome-wide marker data from case-control studies of seven common diseases: bipolar disorder (BD), coronary artery disease (CAD), Crohn's disease (CD), hypertension (HT), rheumatoid arthritis (RA), type 1 diabetes (T1D) and type 2 diabetes (T2D) [65]. After steps to ensure data quality (see Methods), the data for each disease consist of ∼440,000 SNPs genotyped for 1748–1963 cases and 2938 controls (Table S1). Many of the genetic associations based on these data [65] have been replicated in follow-up studies [85]–[89]. We compare our results to previously reported associations, and to existing pathway analyses of these data [11], [13], [16], [22], [23], [66]–[74].
We analyze the data in three stages. First, we compute a BF for each candidate pathway to assess whether it is enriched for disease associations, and we rank the pathways according to their BFs. (Throughout, we use “pathway” to refer to a collection of functionally related genes.) Second, we investigate whether prioritizing variants within the enriched pathways can help locate disease associations beyond those identified in analyses that ignore information about pathways. Finally, for diseases with evidence of pathway enrichment, we re-examine the data for models in which two or more pathways are enriched, and investigate whether prioritizing combinations of enriched pathways yields further disease associations.
Selection of candidate pathways
We assemble a comprehensive list of candidate pathways to test for enrichment, drawing from a variety of publicly accessible collections (see Methods). We do not filter pathway candidates based on their potential relevance to disease. In total, we interrogate 3158 candidate pathways for each disease, plus the MHC and ×MHC gene sets described below. Most candidate pathways were curated by domain experts, and others are based on experimental evidence in non-human organisms and inferred via gene homology. For full details of pathway databases used, and steps taken to compile gene sets from pathway data, refer to Methods, Supplementary Materials, and links to source code implementing our analyses.
The major histocompatibility complex
In two of the seven diseases, RA and T1D, multiple disease associations map to the major histocompatibility complex (MHC) region on chromosome 6. Consequently, pathway analyses for RA and T1D tend to highlight pathways that involve MHC genes. When we apply our method to these diseases, the top pathways for T1D and RA are “Allograft rejection” and “Asthma,” respectively. Both gene sets include multiple MHC genes, and exhibit strong evidence for enrichment (). Other pathways with the strongest enrichment signals also contain MHC genes.
Most of the support for enrichment of these pathways is likely driven by disease associations that map to the MHC. To check this, we create a “pathway” containing all genes within the MHC [90], and test this gene set for enrichment. The MHC gene set shows more support for enrichment than any other pathway by several orders of magnitude ( in T1D and RA, respectively), and it is accompanied by a high enrichment estimate ( and 3.7). Performing a similar enrichment analysis for all genes within the “extended” MHC (xMHC) [91] yields smaller BFs (Figure S1), suggesting that the genetic contribution to RA and T1D risk lies mostly within the class I, II and III subregions of the MHC.
Our finding that the MHC is enriched for associations with T1D and RA is unsurprising considering the MHC is estimated to account for over half the genetic contribution to T1D risk, and at least a third for RA [83], [84], [92]. (By contrast, the genetic contribution of the MHC is estimated to be ∼10% for CD [83], and the BFs for the MHC and ×MHC in CD are 8 and 4, respectively.) In light of these findings, a reasonable question to ask is whether pathways show enrichment for disease associations beyond enrichment of the MHC. A strength of our model-based approach is that it can address this question by computing a BF for enrichment of each candidate pathway, conditioned on the estimated enrichment of the MHC. Thus, in our subsequent analysis of RA and T1D, we account for enrichment of disease associations within the MHC in this way. As far as we are aware, no other pathway-based analyses of these data incorporate enrichment of the MHC, which may explain why previous studies have highlighted mostly MHC-related pathways and gene categories.
Bayes factors for enrichment
To give an initial impression of our enrichment results, we show the pathway with the largest BF for each disease in Figure 1. The seven diseases exhibit a wide range of support for the strongest enrichment signal. For example, the top pathway for T1D, IL-2 signaling, has a BF of , whereas the largest BF for HT is only 5.
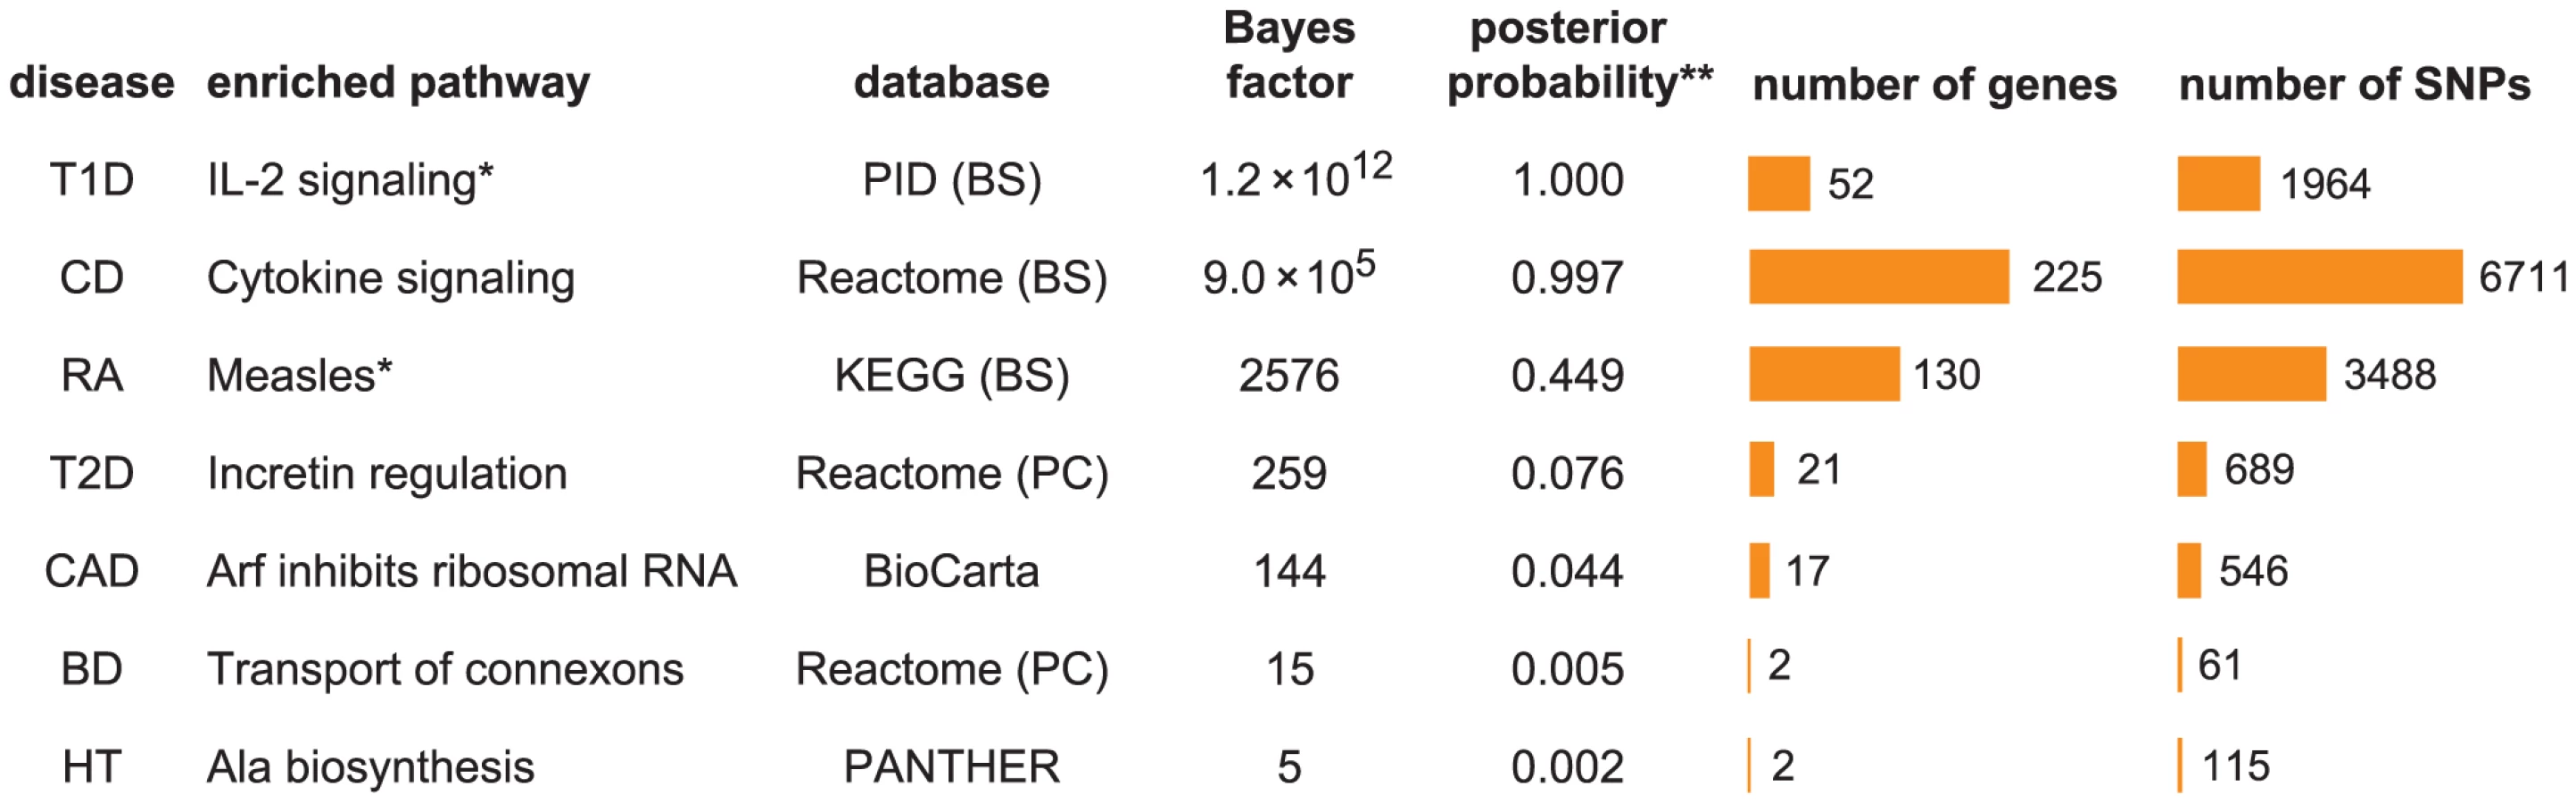
To address whether these top pathways constitute “significant” evidence for enrichment, the BF for enrichment must be weighed against the prior probability of the pathway being enriched to obtain a posterior probability of enrichment (see “Interpretation of Bayes factors” in Methods). While specification of a prior probability of enrichment is subjective, this subjectivity is unavoidable; similar issues arise when specifying significance thresholds for p-values, though these issues are usually hidden (0.05 is a common threshold, but it is subjective and not universally appropriate [93]). If we apply a “conservative” value of 1/3158 to the prior probability for all candidate pathways, so that one pathway is expected to be enriched among the 3158 candidates, then CD and T1D show compelling evidence for enrichment (posterior probability>0.99), and RA shows suggestive evidence (posterior probability = 0.45). Considering the plausible connection between Measles pathway genes and RA (discussed below), we view this as a compelling enrichment as well. The top pathway for T2D, Incretin regulation, shows only modest evidence for enrichment if we apply the conservative prior, but it might be considered “significant” if we adopt a less conservative prior to account for the known connection of this pathway to insulin resistance and diabetes. Based on these results, we do not investigate BD, CAD and HT further, and focus on the four diseases showing strongest evidence for enrichment, CD, RA, T1D and T2D.
Figure 2 shows an expanded list of pathways with the strongest support for enrichment in CD, RA, T1D and T2D, together with estimated enrichment levels (see Figure S1 for a longer list). Beyond these top results, the vast majority of candidate pathways show little or no evidence for enrichment (Figure S2), demonstrating that the method is robust to inclusion of many pathways that are most likely irrelevant to the disease.

Before discussing the biological relevance of these pathways, we point out three general features of Figure 2. First, some of the estimated enrichments are extremely large; for example, IL-2 signaling genes show more than a 10,000-fold enrichment of T1D risk factors. In contrast, the top pathway for CD, “Cytokine signaling in immune system,” has roughly a 100-fold enrichment. (Enrichment of this pathway nonetheless yields a large BF, partly because it implicates over 6700 SNPs; the BFs depend not only on the level of enrichment, but also on the number of SNPs assigned to the pathway.) Second, some of the top pathways overlap or are subsets of one another. For example, “Cytokine signaling in immune system” is a subset of “Immune system.” Also, the Immune system pathway from NCBI BioSystems (BS) overlaps with the Pathway Commons (PC) version of the same pathway (510 genes are common to both gene sets). This raises the question whether enrichment of just one pathway would suffice to explain the genome-wide association signal; we use our methods to investigate this question below. Third, 5 different pathway databases are represented in Figure 1, and all 8 pathway databases included in our analysis appear among the top pathways (Figure 2), illustrating the benefits of interrogating pathways from multiple sources.
Biological relevance of enriched pathways
The top-ranked pathway for CD (“Cytokine signaling”) is a collection of cytokine-driven networks that exhibit a complex relationship to autoimmunity—they promote inflammatory and immune responses, while also playing an important role in suppressing immunity [94]. Cytokine signaling implicates a broad class of 225 genes, suggesting that a collection of related gene networks explains the pattern of genetic associations better than any one signal transduction pathway. Enrichment of cytokine signaling is consistent with the accumulating evidence that points to cytokines, and the signaling cascades initiated by these cytokines, in a range of autoimmune disorders, including inflammatory bowel disease [9], [95], [96].
Previous findings from GWAS have linked autophagy genes ATG16L1 and IRGM to CD [65], [97], [98]. Our pathway analysis does not provide additional support for autophagy in CD because pathways reflecting current models of autophagy [9], [99] have not yet been incorporated, as far as we are aware, into any of the publicly available pathway databases.
Once we account for enrichment of the MHC, the top pathway for T1D is IL-2 signaling. Cytokine IL-2 and its interacting partners are indispensable to activation, development and maintenance of T regulatory cells, and disruption of IL2-mediated pathways promotes progression of autoimmune disorders [100]–[102]. T1D treatments targeting the IL-2 signaling pathway are currently undergoing clinical trials [103]. Additionally, studies in non-obese diabetic (NOD) mice suggest that defects in IL-2 signaling induce susceptibility to T1D [102], [104], [105]. Our findings support this hypothesis.
The top pathway for RA, the KEGG “Measles” pathway, contains genes involved in immune response cascades triggered by infection of measles virus, including the cellular receptors expressed for measles virus such as SLAM and CD46 [106]–[108]. (This result is again conditioned on enrichment of the MHC.) While studies have associated the measles virus with RA [109], other viral and bacterial infections have also been linked to incidence of RA [110], [111], and enrichment of the Measles pathway could reflect a larger class of genes involved in regulation of immune function during infection, rather than the measles virus specifically. The large BF for this pathway in both RA and T1D supports previous indications of a shared genetic basis [96], [112], and is consistent with observations that RA and T1D, along with other autoimmune diseases, recur in the same families [113].
All CD, RA and T1D pathways in Figure 2 implicate key actors in responses to pro-inflammatory stimuli and in regulation of innate and adaptive immunity. These include members of the NF-kB/Rel family, T-cell receptors (TCRs), members of the protein tyrosine phosphatase family (PTPs), mitogen-activated protein (MAP) kinases such as c-Jun NH2-terminal kinases (JNKs), and chemokine receptors (CXCRs) [114]–[117].
Comparison with previous pathway analyses
None of the top-ranked pathways for CD, RA and T1D in our analysis have been identified in previous pathway-based analyses of these diseases [11], [13], . An important difference between our methods and previous pathway analyses of RA and T1D is that we incorporate enrichment of the MHC into models of enrichment. A previous analysis of RA [67] highlighted pathways “Bystander B cell activation” (BioCarta, their p-value = ) and “Type 1 diabetes mellitus” (KEGG, p-value = ). However, both these pathways contain MHC genes, and our results suggest that enrichment of the MHC offers a better explanation of the association signal; in our analysis, support for enrichment of these pathways is several orders of magnitude less than support for enrichment of the MHC ( versus ), and the support vanishes once we account for enrichment of the MHC (BF = 0.69, 0.57). Similarly, previous analyses of T1D [16], [121] have highlighted the same “Type 1 diabetes mellitus” pathway, but again support for enrichment is driven mostly by the association signal in the MHC, as our methods yield only modest support for this pathway after accounting for MHC enrichment (BF = 43).
It is also notable that the top-ranked pathways for RA and T1D, Measles and IL-2 signaling, show strong support in our analysis only after accounting for enrichment of disease associations within the MHC; the BFs without MHC enrichment are 104 and 11, whereas the BFs are and after conditioning on enrichment of the MHC. This may explain why these pathways have not been identified in previous pathway analyses of these diseases. These results illustrate the benefits of estimating enrichment conditioned on the MHC and, more generally, quantifying support for models with multiple enriched pathways.
Another aspect that differs between our results and previous studies is that we interrogate a more comprehensive set of pathway databases. This may explain in part why the BF for the top pathway in CD, “Cytokine signaling in immune system” from Reactome, eclipses the BFs corresponding to previously reported pathways. For example, Wang et al [73] interrogated BioCarta, KEGG and Gene Ontology [46] (and not Reactome) gene sets for enrichment of CD associations, and reported the smallest p-value for BioCarta pathway “IL12 and Stat4 dependent signaling in Th1 development” (p-value = , FDR = 0.045). This pathway showed little evidence for enrichment in our analysis (BF = 20) compared to cytokine signaling (). (Below, when we combine this pathway with cytokine signaling genes, we obtain stronger evidence for enrichment in CD; the BF is 81% the size of the largest BF for 2 enriched pathways.)
Associations informed by enriched pathways
An important feature of our model-based approach is that pathway enrichments can help to map additional disease associations by prioritizing variants within enriched pathways. This is particularly useful for broad groups of enriched genes such as “Cytokine signaling in immune system,” which contains 225 genes, as only a small portion of these genes may actually harbour genetic variants that affect CD risk. Prioritization occurs automatically within our statistical framework; the enrichment parameter affects the prior probability of association for SNPs in the pathway, which in turn increases the posterior probability of association for these SNPs.
We therefore examine how re-interrogation of SNPs for association in light of inferred enrichments in CD, RA, T1D and T2D can reveal additional associations across the genome. We assess evidence for associations across genomic regions, rather than individual SNPs. The rationale is that genome-wide mapping using a multi-marker disease model sometimes spreads the association signal across nearby SNPs when they are correlated with one another, thereby diluting the signal at any given SNP [76]. We divide the genome into overlapping segments of 50 SNPs, with an overlap of 25 SNPs between neighbouring segments. For each segment, we compute , the posterior probability that at least one SNP in the segment is included in the multi-marker disease model. ( denotes the posterior probability that at least n SNPs are included.) We use segments with an equal number of SNPs so that, under the null hypothesis of no enrichment, the prior probability that at least one SNP is included is the same for each segment. A segment spans, on average, 307 kb (98% of the segments are between 100 kb and 1 Mb long), so calculating for these segments provides only a low-resolution map of genetic risk factors for disease. Still, this resolution suffices for our study.
Table 1 summarizes the regions of the genome showing strongest evidence for association after pathway prioritization, and Figure 3 compares support for disease associations under the null hypothesis of no enrichment with support under the model in which the pathway with the largest BF is enriched.


Overall, prioritization of SNPs in enriched pathways increases support for disease risk factors in many regions, often substantially; these regions correspond to points above the diagonal in the scatterplots (Figure 3). In CD and RA, 8 disease susceptibility loci with , not including segments overlapping the MHC, are revealed only after prioritizing SNPs in enriched pathways. In T1D, prioritization of SNPs in the IL-2 pathway yields a total of 37 associated regions outside the MHC with . This dramatic result reflects the high estimated enrichment for IL-2 signaling genes. The majority of the additional disease regions with the strongest support, including many of the loci with weaker association signals, are validated by other studies; in CD and RA, 7 of the 8 additional disease susceptibility loci with are corroborated by other GWAS and large-scale meta-analyses, and in T1D, 4 of the 7 additional disease regions with are similarly corroborated (see Table 1 for references).
Prioritization yields many new candidate disease susceptibility loci not previously implicated by GWAS. These loci will require followup studies to be validated. Three unconfirmed T1D susceptibility loci with strong support () are regions containing IL-2 signaling genes RAF1, MAPK14 and FYN: gene RAF1 is a critical target of insulin in primary β-cells, and variants of this gene may modulate loss of β-cell mass in forms of diabetes [122]; MAPK14 (p38) encodes at least 4 distinct isoforms, and deficiencies in one isoform have been shown in mice knockout studies to improve glucose tolerance and protect against insulin resistance, pointing to a role in development of T1D [123]; FYN interacts with PTPN22 to regulate T cell receptor signaling, and PTPN22 alleles are strongly associated with predisposition to T1D [124]. The one novel candidate region for RA contains Measles pathway gene TP73, whose homolog, TP53, is suspected to impair regulation of inflammation in RA patients [125], [126]. Finally, conditioning on enrichment of top pathways in T2D yields a single novel candidate region at 7q32 with moderate probability of containing a disease association (). This region contains GPR120 (also OSFAR1), a gene assigned to both the Incretin regulation and GLP-1 pathways. It was recently shown that GPR120-deficient mice develop obesity and reduced insulin signaling, and GPR120 expression is significantly higher in obese humans [127], so the effect of this gene may be similar to the reported T2D association with FTO, in which variants near FTO increase T2D risk through an effect on body weight [128], [129].
In addition to these associated regions, several promoted regions also lie within the MHC. (In the scatterplots for RA and T1D, these regions correspond to open circles above the diagonal.) Given the complexity of this region, which contains a high density of genes, and long-range correlations between SNPs, disentangling the association signal in the MHC will likely require higher density SNP data, and lies beyond the capacities of our current implementation (see Discussion).
Figure 4 compares the effect sizes of variants in regions selected only after accounting for pathway enrichment to the effect sizes from regions identified without the benefit of feedback from pathway enrichment. As expected, pathway prioritization uncovers many disease-associated variants with smaller effects than we would otherwise be able to map reliably. This could explain, at least in part, why many of the putative T1D associations uncovered in our analysis are not yet confirmed; the largest meta-analysis of T1D to date, with a combined sample of size ∼16,000 [130], still has limited power to detect associations within this range of effect sizes and minor allele frequencies. (In contrast, much larger meta-analyses exist for CD and RA, with 30,000 and 47,000 samples, respectively [131], [132].)

Finally, Figure 3 offers the opportunity to remark on four other features of our results. First, the strongest association signals without feedback from pathways stay strong whether or not they are related to the enriched pathway—these associations correspond to the points in the top-right corner of each scatterplot. (Note that the segments in the top-right corner recapitulate the strongest associations reported for CD, RA, T1D and T2D in the original study [65]. See Supplementary Materials for a detailed comparison to single-marker p-values in all 7 diseases.) Second, many segments show slightly decreased support for association under the enrichment hypothesis (points below the diagonal in the scatterplots). This occurs because the estimated prior inclusion probability for SNPs outside the pathway is reduced to reflect the fact that pathway enrichment helps to explain an appreciable portion of the genome-wide association signal. Third, although not evident from the figure due to over-plotting, most segments show little or no evidence for associations under either hypothesis; in each scatterplot, 98–99.7% of segments lie near the bottom-left corner. Fourth, associations with strong support under the null are not necessary for establishing evidence for enriched pathways; none of the RA associations in the top-right corner of the scatterplot contribute to evidence for enrichment of the Measles pathway.
Assessing combinations of pathways for enrichment
Above, we obtained evidence for enriched pathways in CD, RA and T1D. The question remains whether a combination of several enriched pathways offers a better fit to the data. A benefit of our approach is that we can compare support for enrichment of different combinations of pathways by comparing their BFs (assuming the same prior for these enrichment hypotheses).
We assess support for combinations of pathways in CD, RA and T1D by computing BFs for models in which 2 and 3 pathways are enriched. Since it is impractical to consider all combinations of 2 and 3 pathways, we tackle this in a “greedy” fashion by selecting combinations of pathways based on the initial ranking (see Methods). Figure 5 gives the combinations of 2 and 3 pathways that yield the largest BFs for these diseases. Again, to properly interpret these results we must weigh these BF gains against the relative prior plausibility of the models. Using a “conservative” prior for any pair of pathways being enriched (see “Interpretation of Bayes factors” in Methods), we interpret Figure 5 as providing considerable, if short of compelling, support for the hypothesis that 2 pathways are enriched for disease associations in CD, RA and T1D. For example, in CD the BF for enrichment of both cytokine signaling and IL-23 signaling genes is 377 times greater than the BF for enrichment of cytokine signaling genes alone. The BFs for models in which 3 pathways show further increases, but not enough to constitute strong evidence for enrichment of 3 pathways.

We also examine whether enrichment of multiple pathways can lead to identification of additional loci affecting susceptibility to disease. Figure S3 shows that allowing for 2 enriched pathways in CD, RA and T1D does not yield strong support for associations beyond what is already revealed by enrichment of the single top pathway. We do, however, find that a segment near IL12B shows a substantial gain in support for association with CD ( increases from 0.03 to 0.44), and this association is confirmed by other GWAS [6], [7], [132], [133].
Discussion
Motivated by the observation that it is easier, at least in principle, to identify associations within an enriched pathway, we developed a data-driven approach to simultaneously assess support for enrichment of disease associations in pathways, and prioritize variants in enriched pathways. We investigated the merits and limitations of this approach in a detailed analysis of data sets for seven complex diseases. We interrogated thousands of candidate pathways from multiple pathway databases, finding strong evidence linking pathways to pathogenesis of several diseases. By promoting variants within the enriched pathways identified in our analysis, we mapped disease susceptibility loci beyond those identified by a conventional analysis.
The CD and RA results provided some validation for our methods, as all but one of the additional disease associations identified by pathway prioritization are corroborated by other studies. The T1D results also provided some validation for our methods, as several of the strongest associations informed by enrichment of the IL-2 signaling pathway are confirmed in other GWAS for T1D. Prioritizing IL-2 signaling genes revealed other regions relevant to T1D that could not be corroborated by other GWAS, and this may be because the largest GWAS for T1D to date does not match the scale of the largest studies for CD and RA. All the disease associations informed by enriched pathways had smaller effects on disease susceptibility, illustrating how pathway prioritization can help overcome some of the constraints on our ability to reliably detect disease-conferring variants with small effects in GWAS.
Our approach builds on methods that use multi-marker models to simultaneously map associated variants in GWAS [61], [75], [76], [134]–[142]. In contrast to single-marker regression approaches, these methods model susceptibility to disease by the combined effect of multiple variants, and use sparse multivariate regression techniques to fit multi-marker (i.e. polygenic) models to the data. Within a multi-marker model of disease, estimating enrichment of a candidate pathway effectively reduces to counting, inside and outside the pathway, variants associated with disease (more precisely, variants included in the multi-marker model). Our approach to combining multi-marker modeling with pathway analysis offers several benefits. First, unlike many pathway analysis methods that test for enrichment of significant SNPs or genes within a pathway [24], [25], we have no need to select a threshold to determine which p-values are significant; instead, we use the association signal from all variants to assess enrichment. Second, by analyzing variants simultaneously, we avoid exaggerating evidence for enrichment from disease-associated variants that are correlated with each other (i.e. in linkage disequilibrium), while still allowing multiple independent association signals near a gene to contribute evidence for enrichment. Third, and most importantly, quantifying enrichment within this framework gives us feedback about associations within enriched pathways, potentially leading to discovery of novel genetic loci underlying disease.
In contrast to many pathway analysis methods, we modeled enrichment of disease associations at the level of variants, rather than genes. While there are arguments for both approaches, a feature of the variant-based approach is that, when there are multiple variants near a gene that affect disease susceptibility, all these signals contribute to the evidence for enrichment of pathways containing this gene.
Another important feature of our approach is that it can be used to assess models in which multiple pathways are enriched. Examining combinations of pathways for enrichment may highlight pathways that would otherwise not be highly ranked. The results on RA and T1D provided vivid examples of this; evidence for enrichment of the Measles and IL-2 pathways only became compelling once we assessed support for enrichment of these pathways together with enrichment of the MHC.
Our results focused on the regions showing the strongest evidence for association with disease. However, the large number of points approaching the middle of the vertical axes in Figure 3 suggests that many other gene variants in the enriched pathways may contribute to risk of CD, RA and T1D; from our estimates of and (Figure 2), approximately 38, 45 and 59 independent risk variants are, in expectation, hidden among Measles, cytokine signaling and IL-2 signaling genes, respectively. This suggests that more disease associations in these pathways remain to be discovered.
Several selected disease susceptibility regions (Table 1) contain multiple candidate genes, including cases in which the gene in the enriched pathway is not the same as the most credible gene suggested in prior studies. It is possible that pathway annotations would be useful to help pinpoint, or fine-map, the genes or variants relevant to disease within these regions. However, investigating this would require advances to our current methodology, as the approximations we made to improve the efficiency of our approach, building on earlier work [75], are less appropriate for refining the location of association signals, and these approximations will need to be modified to accommodate this aim. Nonetheless, we note that some of these regions may contain multiple variants that disrupt or regulate genes relevant to disease, and our methods can help assess this possibility. For example, we calculate that multiple independent risk variants reside at the 16p13 locus with probability (Table 1). So it is possible that both C1QTNF6 and IL2RB at this locus are associated with T1D risk variants.
A limitation of our current approach is that the prior variance of additive effects on disease risk must be chosen beforehand. We based our choice on the distribution of odds ratios reported in published genome-wide association studies, and checked that the ranking of enriched pathways was robust to different prior choices (see Methods). One problem with this prior is that published associations typically have the largest effects on disease risk, as these are the associations we usually have adequate power to identify. This results in a prior that places too much weight on larger additive effects. It would be preferable to estimate this prior from the data instead, but we found that this worked poorly in practice. The likely cause of this problem is that the non-zero effects on disease are not normally distributed, contrary to our assumptions. One possible solution would be to use a more flexible prior that is better able to capture the distribution of additive effects, such as a mixture of two or more normals [80].
In summary, our results on a range of complex diseases illustrate how an integrated approach to identification of enriched pathways, and prioritization of variants within enriched pathways, can identify additional disease associations beyond standard statistical procedures based on single-marker regression. Our results point to the potential for applying our methods to other common diseases, and larger studies, to uncover genetic loci that have not yet been identified as risk factors for disease.
Methods
Samples
Results on all seven diseases are based on genome-wide marker data from the case-control studies described in the original WTCCC study [65]. For all diseases, the control samples come from two groups: 1480 individuals from the 1958 Birth Cohort (58BC), and 1458 individuals from the UK Blood Services (UKBS) cohort. All subjects are from Great Britain, and are of self-described European descent. Genetic associations from these studies were first reported in [65].
All study subjects were genotyped for roughly 500,000 SNPs on autosomal chromosomes using a commercial version of the Affymetrix GeneChip 500K platform. We estimate missing genotypes at the SNPs using the mean posterior minor allele count from BIMBAM [79], [143], with SNP data from Phase II of the International HapMap Consortium project [144]. To be consistent with the original analysis, refSNP identifiers and locations of SNPs are based on Human Genome Reference Assembly 17 (NCBI build 35).
We apply quality control filters as described in [65], and remove SNPs that exhibit no variation in the sample. For all diseases, we include an additional quality control measure to filter out potentially problematic SNPs. Some SNPs with high minor allele frequencies (MAFs) show moderate evidence for association based on our calculations—“single-SNP” BFs [79] in which the prior standard deviation of the log-odds ratios is set to 0.1—but because they do not appear to be supported by nearby SNPs upon inspecting their single-SNP BFs, we cannot rule out the possibility of genotyping errors. Based on this criterion, we discard 2 additional SNPs in CD, rs1914328 on chromosome 8 at 69.45 Mb (, MAF = 0.43), and rs6601764 on chromosome 10 at 3.85 Mb (, MAF = 0.43). In each case, no nearby SNPs have single-SNP BFs greater than 46. For CAD, we discard SNP rs6553488 on chromosome 4 at 171.4 Mb (, MAF = 0.46). No nearby SNPs have a single-SNP BF greater than 11. Following the same quality control criterion, we do not filter out SNPs in the other data sets. Table S1 summarizes the data used in our analysis after following these quality control steps.
Pathways, and assignment of SNPs to genes in pathways
We aim for a comprehensive evaluation of pathways accessible on the Web in standard, computer-readable formats [63], [64], [145]. Since the results hinge on the quality of the pathways used in the analysis, we restrict the analysis to curated, peer-reviewed pathways based on experimental evidence, and pathways inferred via gene homology. We draw candidate pathways from the collections listed in Figure 6 (see also Supplementary Materials). KEGG [146] and HumanCyc [147] are primarily databases of metabolic pathways, and are unlikely to be relevant to some autoimmune diseases, but for completeness we include them in the analysis of all diseases. We create 2 additional gene sets to assess support for enrichment of disease associations within the MHC and “extended” MHC (xMHC) [90], [91]. We treat each candidate pathway as a set of genes, ignoring details such as molecules involved in biochemical reactions, and cellular locations of these reactions.

Many pathways are arranged hierarchically in the databases; we include all elements of the hierarchy in our analysis. Elements in upper levels of the hierarchy refer to groups of pathways with shared attributes, or a common function. Some gene groups have a broad definition, such as “Immune system” in Reactome (ID 6900), which includes pathways involved in adaptive and innate immune response. Enrichment of a large gene set is unlikely to provide much insight into disease pathogenesis. However, a key step in our analysis is to re-interrogate SNPs for association in light of inferred enrichments. Thus, enrichment of a broad physiological target such as “Immune system” can be useful if subsequent re-interrogation reveals associations that were not significant in a conventional analysis.
Since we combine pathways from different sources, we encounter pathways with inconsistent definitions [148], [149]; see Supplementary Materials. There is no single explanation for this lack of consensus, and we have no reason to prefer one definition over another, so we include all versions of pathways in our analysis.
Based on findings that the majority of variants modulating gene expression lie within 100 kb of the gene's transcribed region [150]–[152], we assign a SNP to a gene if it is within 100 kb of the transcribed region. Others have opted for a 20 kb window [69], [73] based on findings that cis-acting expression QTLs are rarely more than 20 kb from the gene [62]. We choose a broader region since the benefit of including potentially relevant SNPs in a pathway when the association signal is sparse seems likely to outweigh the cost of including a larger number of irrelevant markers.
Selection of combinations of pathways
In our case studies on CD, RA and T1D, we compute BFs to assess support for models in which 2 and 3 pathways are enriched for disease associations. Since it is impractical to consider all combinations of 2 and 3 pathways, we tackle this in a “greedy” fashion by selecting combinations of pathways based on the initial ranking. Our strategy is to select the pathway with the largest BF (Figure 1), and assess support for this pathway in combination with pathways from a larger set of candidates (we take all pathways with BF>10). This heuristic makes it feasible to evaluate many combinations of pathways that could plausibly be jointly enriched, though it does not consider all combinations, so we may miss a combination with stronger evidence for enrichment. In total, we compute BFs for 85, 24 and 408 pairs of pathways in CD, RA and T1D, respectively. (Note that models for RA and T1D also include enrichment of the MHC.) For completeness, we extend the analysis to models with 3 enriched pathways. Following the same greedy strategy, we take the top pair of pathways (Figure 5) and combine it with individual pathways with BF>10.
Statistical analysis
The Bayesian variable selection approach to simultaneous interrogation of SNPs involves fitting a multi-marker disease model to the data with different combinations of SNPs. By accounting for correlations between markers, fitting all markers simultaneously allows us to identify those that are independently associated—that is, markers that individually signal a variant contributing to disease risk independently of other risk-conferring variants.
Likelihood
The likelihood specifies the probability of observing disease (case-control) status y given the genotypes , the intercept , and the regression coefficients . From the additive model for the log-odds of disease (eq. 1), is the probability that , in which is the sigmoid function. Assuming independence of the observations , the likelihood is

Priors
Next we specify prior distributions for the following model parameters: the genome-wide log-odds , the log-fold enrichment , the intercept , and the coefficients of included SNPs.
Since inferences strongly depend on , and since is unknown and will be different for each setting, we estimate this parameter from the data. Following [75], [76], we assign a uniform prior to . We restrict to , so as few as 0 and as many as ∼4400 SNPs are expected to be included a priori. We assign a uniform prior to on interval . This allows for a wide range of enrichments.
For the prior on the non-zero coefficients , we follow standard practice that assumes they are i.i.d. normal with zero mean and standard deviation [153]. Ordinarily, to combat sensitivity of the results to the choice of , we would place a prior on and integrate over this parameter to let the data drive selection of . This approach is taken in [75], [76]. But in our case we find that the heterogeneity of the odds ratios in complex diseases presents a problem: although we expect most odds ratios for a common disease—and specifically odds ratios in a pathway relevant to disease pathogenesis—to be close to 1, the odds ratios corresponding to the strongest disease associations drive estimates of toward larger values, and a normal distribution that puts too little weight on modest odds ratios. One possible strategy would be to redo the analysis after removing associated regions with the largest odds ratios, but this is an unattractive solution because SNPs with large odds ratios would not contribute to the evidence for enrichment. Instead, we fix , grounding the choice on typical odds ratios reported in published GWAS, and we assess the robustness of our findings to this choice. Our choice is , which favours odds ratios close to 1 (95% of the odds ratios lie between 0.82 and 1.22 a priori), while being large enough to capture a significant fraction of the odds ratios for common alleles reported in genome-wide association studies of complex disease traits. According to a recent review [154], approximately 40% of estimated odds ratios are between 1.1 and 1.2, and an additional 10% of odds ratios are smaller than 1.1. This prior also closely corresponds to a survey of odds ratios reported in genetic association studies of common diseases [155]. Since there may be justification for a slightly smaller or slightly larger , we also try different values for , and examine how these choices affect the ranking of enriched pathways in the CD data set (see below).
To complete the probability model, we assign an improper uniform prior to the intercept, . In general, one must be careful with use of improper priors in Bayesian variable selection because they can result in improper posteriors. A sufficient condition for a proper posterior, and a well-defined BF, with logistic regression (eq. 1) is that the maximum likelihood estimator of β conditioned on which variables are included in the model, and on the other model parameters, is unique and finite [156]. This condition is difficult to check exhaustively in Bayesian variable selection, but we can at least guarantee that the posterior is proper under the variational approximation (see Supplementary Materials) so long as the coordinate ascent steps converge to a unique solution.
Sensitivity of pathway ranking to prior distribution of odds ratios
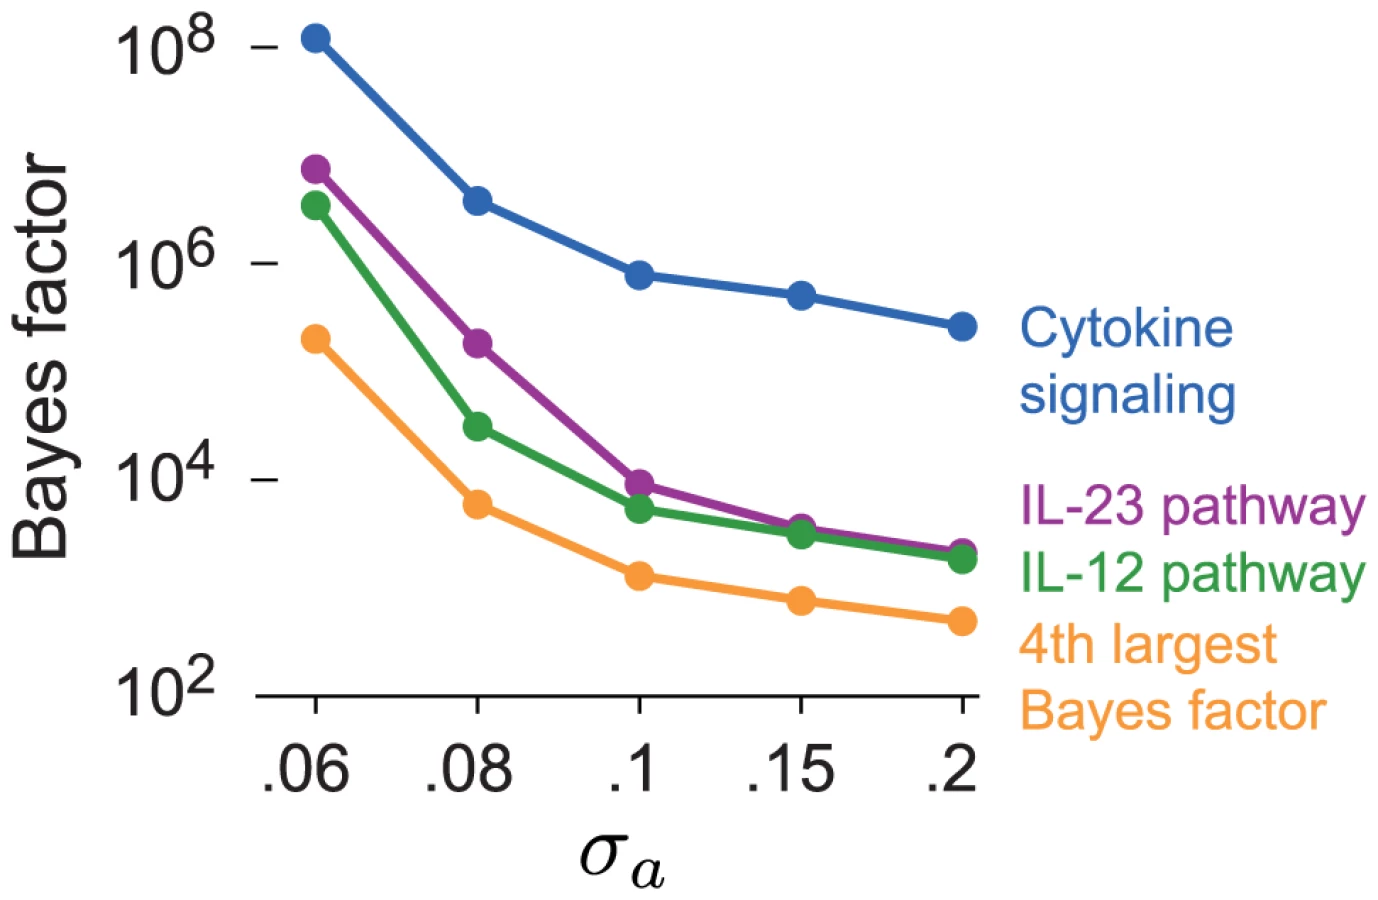
A concern with our choice of prior for β is that slightly smaller or slightly larger settings of could also be justified, and these choices could produce different results. Associations are unlikely to accumulate at a greater rate in pathways that are not related to the disease, even associations with small effects on disease risk, so we predict that the ranking of enriched pathways is largely robust to . Here we verify this claim on the CD data set. We assess the sensitivity to by recomputing the BFs for all candidate pathways with prior choices that favor slightly smaller () and slightly larger coefficients (). Figure 7 shows that smaller settings of yield substantially more support for enrichment of CD-related pathways, as expected. But the pathways with the largest BFs remain IL-23, IL-12 and cytokine signaling regardless of the choice of . In Supplementary Materials, we show that the BFs for most other candidate pathways do not change noticeably at different settings of .
Bayes factors
We adopt the Bayesian model averaging strategy [82], [135], [157] to account for possible uncertainty in and when evaluating the BFs (eq. 3). The likelihood under the enrichment hypothesis () and the likelihood under the null () are each expressed as an average over possible assignments to and :


Interpretation of Bayes factors
Given that enrichment analyses typically proceed by computing p-values and assessing “significance,” one may reasonably ask whether a given BF represents “significant” evidence for enrichment. Specifying an appropriate threshold for a BF to be considered significant, however, is context-dependent, and subjective. This is because the posterior odds for a pathway being enriched, relative to the null hypothesis that no pathways are enriched, is equal to the BF times the prior odds for enrichment, and the prior odds for each pathway depends on how plausible it is, a priori, that the pathway is relevant to the disease. (Similar issues arise when specifying significance thresholds for p-values; for example, the false discovery rate at a given p-value threshold depends on the prior probability of enrichment [159], [160]. But in practice significance thresholds of 0.01 or 0.05 are often used without attending to this concern.) Nonetheless, we can make the following observations. First, if we are willing to assume the pathways in Figures 1 and 2 are all equally plausible candidates for enrichment a priori, then the ratio of BFs indicates the relative support for the enrichment hypotheses; for example, if we must choose between enrichment of cytokine signaling genes and the IL-23 signaling pathway, the data overwhelmingly favour the former by a factor of (Figure 2). Second, even under a “conservative” prior for enrichment in which we expect 1 pathway to be enriched among the 3158 candidates, corresponding to a prior odds of 1/3158, the top pathways in CD and T1D are large enough to strongly support enrichment (the BFs are all much greater than 3158). Weighing this prior against the BF for the top pathway in RA does not yield strong support for this pathway, but given its plausible connection to RA, we view this enrichment result as compelling.
We can apply similar reasoning to weigh the evidence for hypotheses in which 2 or more pathways are enriched. For example, the model in which both cytokine signaling and IL-23 pathway genes are enriched for CD associations has a BF that is ∼400 times greater than the BF for enrichment of cytokine signaling genes alone. This indicates that the best model with 2 enriched pathways provides a much better fit to the CD data than the best model with any one enriched pathway. However, to properly interpret this result we must weigh this increase in the BF against the relative prior plausibility of the models. A naive argument using a “conservative” prior for any pair of pathways being enriched might suggest a prior odds of . This prior would make a 400-fold increase in the BF appear to be relatively insignificant. However, this argument not only depends on the earlier prior, which may be overly conservative, but also assumes independence of enriched pathways, which seems unwise considering many pathways mentioned in the results have related roles in immunity; a priori, one might expect that a pathway is more likely to be enriched when a related pathway is enriched.
Posterior inclusion probabilities and other posterior quantities
In this section, we define posterior inclusion probabilities (PIPs) and other posterior quantities used in the results. In all cases, posterior statistics under the null hypothesis are obtained by setting .
Like the BFs, the PIPs are obtained by averaging over and . Taking as shorthand for the GWAS data, we have

To identify regions of the genome associated with disease risk, for each region we calculate the posterior probability that at least 1 SNP in the region is included in the multi-marker disease model. Let represent the event that exactly n SNPs in a given region are included in the multi-marker disease model, so that . These posterior probabilities are easily calculated from the PIPs (7) using the variational approximation; see Supplementary Materials.
Since no single pathway stands out in Figure 2 as having greatest support for enrichment of T2D associations, we compute posterior quantities by averaging over different enrichment models with the largest BFs, weighting these models by their BFs. We do the same for models in which 2 or 3 pathways are enriched. (Implicitly, this assumes all models are equally plausible a priori.) The ability to average across models in this way is an advantage the Bayesian model comparison approach, because it allows us to assess associations in light of the enrichment evidence without having to choose a single enrichment model. Suppose we have m enrichment models, specified by their SNP annotations , with corresponding BFs, . Then is given by

Population stratification
Pathway enrichment analysis should be robust to population stratification because spurious associations that arise from population structure are unlikely to accumulate at a greater rate in the pathway. Further, the original report [65] and subsequent analyses [6], [161] affirm that cryptic population structure does not have a substantive impact in these data. Thus we did not correct for population structure in our analysis.
Modifications to analysis to account for large contributions of MHC alleles to RA and T1D risk
Recent work by Pirinen et al [162] has shown that when analyzing a case-control study with a prospective model, as we do here, controlling for non-confounding covariates, particularly those with large effects, can reduce power to detect associations. Their work implies that joint modeling of the effects of multiple SNPs on disease risk could actually reduce power to detect associations compared with single-marker tests, particularly for diseases such as RA and T1D in which MHC variants are known to have large effects on disease risk. Here we briefly explain how we modify our approach to address this issue.
Pirinen et al [162] recommend omitting non-confounding covariates when the goal is to discover new loci associated with disease. SNPs in the MHC associated with disease are non-confounding covariates of large effect, so we could adhere to their advice simply by ignoring all MHC SNPs when analyzing the non-MHC SNPs. However, omitting the MHC would prevent us from effectively interrogating pathways that contain MHC genes. Instead, we develop the following two-stage procedure: first, we fit our model using only SNPs outside the extended MHC to estimate their effects, ; second, fixing to the estimates obtained from the first step, we fit the multi-marker model to the full data to estimate , the effects of SNPs within the ×MHC. This procedure is equivalent to assuming that . (See Supplementary Materials for details on how this assumption is incorporated into the variational approximation to efficiently compute BFs and posterior statistics.) Thus, in the first stage we ignore the MHC when deciding which non-MHC SNPs to include in the multi-marker model, following the advice from [162], but in the second stage we allow that the MHC may contribute evidence toward pathway enrichment when the pathway includes MHC genes.
We found that addressing these issues was important for analyzing the RA and T1D data. With these modifications, our results more closely replicate the original single-marker association analysis (Figures S4 and S5), and our methods yield more support for enrichment of pathways that overlap the MHC.
Analyses conditional on MHC enrichment
Once we establish that the MHC has far greater support for enrichment of disease associations in RA and T1D than any other candidate pathway, we condition on enrichment of the MHC, and search for gene sets with evidence for enrichment beyond the MHC. To speed up computation, we fix the MHC enrichment parameter, , to its maximum a posteriori estimate, and we additionally assume that the posterior distribution of is unaffected by enrichment of the candidate pathway; that is, . (Note that we make a similar approximation to improve efficiency of computation for all pathways. We assume that coefficients for all SNPs j outside the enriched pathway are unaffected by pathway enrichment a posteriori; see Supplementary Materials.) To assess support for enrichment of a candidate pathway in RA and T1D, we compare the likelihood given the model in which the candidate pathway and the MHC are enriched to the likelihood given the model in which only the MHC is enriched. Thus, unless otherwise specified, all BFs for enrichment of pathways in RA and T1D are defined relative to the “null” that the MHC is enriched, rather than the null of no enrichment.
Software availability
MATLAB implementations of the statistical methods described here, and the MATLAB scripts used to implement the steps in our analysis, are available for download at http://github.com/pcarbo/bmapathway.
Supporting Information
Zdroje
1. AltshulerD, DalyMJ, LanderES (2008) Genetic mapping in human disease. Science 322 : 881–888.
2. FrazerKA, MurraySS, SchorkNJ, TopolEJ (2009) Human genetic variation and its contribution to complex traits. Nature Reviews Genetics 10 : 241–251.
3. McCarthyMI, AbecasisGR, CardonLR, GoldsteinDB, LittleJ, et al. (2008) Genome-wide association studies for complex traits: consensus, uncertainty and challenges. Nature Reviews Genetics 9 : 356–369.
4. PearsonTA, ManolioTA (2008) How to interpret a genome-wide association study. Journal of the American Medical Association 299 : 1335–1344.
5. AbrahamC, ChoJH (2009) Inflammatory bowel disease. New England Journal of Medicine 361 : 2066–2078.
6. BarrettJC, HansoulS, NicolaeDL, ChoJH, DuerrRH, et al. (2008) Genome-wide association defines more than 30 distinct susceptibility loci for Crohn's disease. Nature Genetics 40 : 955–962.
7. FrankeA, McGovernDPB, BarrettJC, WangK, Radford-SmithGL, et al. (2010) Genome-wide meta-analysis increases to 71 the number of confirmed Crohn's disease susceptibility loci. Nature Genetics 42 : 1118–1125.
8. KhorB, GardetA, XavierRJ (2011) Genetics and pathogenesis of inflammatory bowel disease. Nature 474 : 307–317.
9. StappenbeckTS, RiouxJD, MizoguchiA, SaitohT, HuettA, et al. (2011) Crohn disease: a current perspective on genetics, autophagy and immunity. Autophagy 7 : 355–374.
10. Van LimbergenJ, WilsonDC, SatsangiJ (2009) The genetics of Crohn's disease. Annual Review of Genomics and Human Genetics 10 : 89–116.
11. BallardD, AbrahamC, ChoJ, ZhaoH (2010) Pathway analysis comparison using Crohn's disease genome wide association studies. BMC Medical Genomics 3 : 25.
12. BraunR, BuetowK (2011) Pathways of distinction analysis: a new technique for multi-SNP analysis of GWAS data. PLoS Genetics 7: e1002101.
13. ChenX, WangL, HuB, GuoM, BarnardJ, et al. (2010) Pathway-based analysis for genome-wide association studies using supervised principal components. Genetic Epidemiology 34 : 716–724.
14. ChenLS, HutterCM, PotterJD, LiuY, PrenticeRL, et al. (2010) Insights into colon cancer etiology via a regularized approach to gene set analysis of GWAS data. American Journal of Human Genetics 86 : 860–871.
15. De la CruzO, WenX, KeB, SongM, NicolaeDL (2010) Gene, region and pathway level analyses in whole-genome studies. Genetic Epidemiology 34 : 222–231.
16. EleftherohorinouH, WrightV, HoggartC, HartikainenA, JarvelinM, et al. (2009) Pathway analysis of GWAS provides new insights into genetic susceptibility to 3 inflammatory diseases. PLoS ONE 4: e8068.
17. HoldenM, DengS, WojnowskiL, KulleB (2008) GSEA-SNP: applying gene set enrichment analysis to SNP data from genome-wide association studies. Bioinformatics 24 : 2784–2785.
18. JiaP, WangL, FanousAH, ChenX, KendlerKS, et al. (2012) A bias-reducing pathway enrichment analysis of genome-wide association data confirmed association of the MHC region with schizophrenia. Journal of Medical Genetics 49 : 96–103.
19. LeePH, O'DushlaineC, ThomasB, PurcellSM (2012) INRICH: interval-based enrichment analysis for genome-wide association studies. Bioinformatics 28 : 1797–1799.
20. RamananVK, ShenL, MooreJH, SaykinAJ (2012) Pathway analysis of genomic data: concepts, methods and prospects for future development. Trends in Genetics 28 : 323–332.
21. RuanoD, AbecasisGR, GlaserB, LipsES, CornelisseLN, et al. (2010) Functional gene group analysis reveals a role of synaptic heterotrimeric G proteins in cognitive ability. American Journal of Human Genetics 86 : 113–125.
22. ShahbabaB, ShachafCM, YuZ (2012) A pathway analysis method for genome-wide association studies. Statistics in Medicine 31 : 988–1000.
23. TorkamaniA, TopolEJ, SchorkNJ (2008) Pathway analysis of seven common diseases assessed by genome-wide association. Genomics 92 : 265–272.
24. WangK, LiM, HakonarsonH (2010) Analysing biological pathways in genome-wide association studies. Nature Reviews Genetics 11 : 843–854.
25. WangL, JiaP, WolfingerRD, ChenX, ZhaoZ (2011) Gene set analysis of genome-wide association studies: methodological issues and perspectives. Genomics 98 : 1–8.
26. WuMC, KraftP, EpsteinMP, TaylorDM, ChanockSJ, et al. (2010) Powerful SNP-set analysis for case-control genome-wide association studies. American Journal of Human Genetics 86 : 929–942.
27. Yaspan BL, Veatch OJ (2011) Strategies for pathway analysis from GWAS data, John Wiley and Sons, Inc., volume 71, chapter 1.20. pp. 1–15.
28. YuK, LiQ, BergenAW, PfeifferRM, RosenbergPS, et al. (2009) Pathway analysis by adaptive combination of P-values. Genetic Epidemiology 33 : 700–709.
29. CantorRM, LangeK, SinsheimerJS (2010) Prioritizing GWAS results: a review of statistical methods and recommendations for their application. American Journal of Human Genetics 86 : 6–22.
30. HartwellL (2004) Robust interactions. Science 303 : 774–775.
31. HirschhornJN (2009) Genomewide association studies—illuminating biologic pathways. New England Journal of Medicine 360 : 1699–1701.
32. SchadtEE (2009) Molecular networks as sensors and drivers of common human diseases. Nature 461 : 218–223.
33. EichlerEE, FlintJ, GibsonG, KongA, LealSM, et al. (2010) Missing heritability and strategies for finding the underlying causes of complex disease. Nature Reviews Genetics 11 : 446–450.
34. ManolioTA, CollinsFS, CoxNJ, GoldsteinDB, HindorffLA, et al. (2009) Finding the missing heritability of complex diseases. Nature 461 : 747–753.
35. RiouxJD, AbbasAK (2005) Paths to understanding the genetic basis of autoimmune disease. Nature 435 : 584–589.
36. RopersHH (2007) New perspectives for the elucidation of genetic disorders. American Journal of Human Genetics 81 : 199–207.
37. AertsS, LambrechtsD, MaityS, Van LooP, CoessensB, et al. (2006) Gene prioritization through genomic data fusion. Nature Biotechnology 24 : 537–544.
38. BaranziniSE, GalweyNW, WangJ, KhankhanianP, LindbergR, et al. (2009) Pathway and network-based analysis of genome-wide association studies in multiple sclerosis. Human Molecular Genetics 18 : 2078–2090.
39. ChenM, ChoJ, ZhaoH (2011) Incorporating biological pathways via a Markov random field model in genome-wide association studies. PLoS Genetics 7: e1001353.
40. FrankeL, van BakelH, FokkensL, de JongED, Egmont-PetersenM, et al. (2006) Reconstruction of a functional human gene network, with an application for prioritizing positional candidate genes. American Journal of Human Genetics 78 : 1011–1025.
41. LageK, KarlbergEO, StorlingZM, OlasonPI, PedersenAG, et al. (2007) A human phenomeinteractome network of protein complexes implicated in genetic disorders. Nature Biotechnology 25 : 309–316.
42. RaychaudhuriS, PlengeRM, RossinEJ, NgACY, PurcellSM, et al. (2009) Identifying relationships among genomic disease regions: predicting genes at pathogenic SNP associations and rare deletions. PLoS Genetics 5: e1000534.
43. SacconeSF, SacconeNL, SwanGE, MaddenPAF, GoateAM, et al. (2008) Systematic biological prioritization after a genome-wide association study: an application to nicotine dependence. Bioinformatics 24 : 1805–1811.
44. TrancheventL, CapdevilaFB, NitschD, De MoorB, De CausmaeckerP, et al. (2011) A guide to web tools to prioritize candidate genes. Briefings in Bioinformatics 12 : 22–32.
45. WuX, JiangR, ZhangMQ, LiS (2008) Network-based global inference of human disease genes. Molecular Systems Biology 4 : 189.
46. AshburnerM, BallCA, BlakeJA, BotsteinD, ButlerH, et al. (2000) Gene Ontology: tool for the unification of biology. Nature Genetics 25 : 25–29.
47. BoyleAP, HongEL, HariharanM, ChengY, SchaubMA, et al. (2012) Annotation of functional variation in personal genomes using RegulomeDB. Genome Research 22 : 1790–1797.
48. DegnerJF, PaiAA, Pique-RegiR, VeyrierasJ, GaffneyDJ, et al. (2012) DNase I sensitivity QTLs are a major determinant of human expression variation. Nature 482 : 390–394.
49. NicolaeDL, GamazonE, ZhangW, DuanS, DolanME, et al. (2010) Trait-associated SNPs are more likely to be eQTLs: annotation to enhance discovery from GWAS. PLoS Genetics 6: e1000888.
50. SchaubMA, BoyleAP, KundajeA, BatzoglouS, SnyderM (2012) Linking disease associations with regulatory information in the human genome. Genome Research 22 : 1748–1759.
51. WardLD, KellisM (2012) Interpreting noncoding genetic variation in complex traits and human disease. Nature Biotechnology 30 : 1095–1106.
52. CapanuM, OrlowI, BerwickM, HummerAJ, ThomasDC, et al. (2008) The use of hierarchical models for estimating relative risks of individual genetic variants: an application to a study of melanoma. Statistics in Medicine 27 : 1973–1992.
53. CapanuM, ConcannonP, HaileRW, BernsteinL, MaloneKE, et al. (2011) Assessment of rare BRCA1 and BRCA2 variants of unknown significance using hierarchical modeling. Genetic Epidemiology 35 : 389–397.
54. ChenGK, WitteJS (2007) Enriching the analysis of genome-wide association studies with hierarchical modeling. American Journal of Human Genetics 81 : 397–404.
55. CooperGM, ShendureJ (2011) Needles in stacks of needles: finding disease-causal variants in a wealth of genomic data. Nature Reviews Genetics 12 : 628–640.
56. FridleyBL, SerieD, JenkinsG, WhiteK, BamletW, et al. (2010) Bayesian mixture models for the incorporation of prior knowledge to inform genetic association studies. Genetic Epidemiology 34 : 418–426.
57. FridleyBL, LundS, JenkinsGD, WangL (2012) A Bayesian integrative genomic model for pathway analysis of complex traits. Genetic Epidemiology 36 : 352–359.
58. GaffneyDJ, VeyrierasJ, DegnerJF, RogerP, PaiAA, et al. (2012) Dissecting the regulatory architecture of gene expression QTLs. Genome Biology 13: R7.
59. LeeS, DudleyAM, DrubinD, SilverPA, KroganNJ, et al. (2009) Learning a prior on regulatory potential from eQTL data. PLoS Genetics 5: e1000358.
60. LewingerJP, ContiDV, BaurleyJW, TricheTJ, ThomasDC (2007) Hierarchical Bayes prioritization of marker associations from a genome-wide association scan for further investigation. Genetic Epidemiology 31 : 871–883.
61. SwartzMD, KimmelM, MuellerP, AmosCI (2006) Stochastic search gene suggestion: a Bayesian hierarchical model for gene mapping. Biometrics 62 : 495–503.
62. VeyrierasJB, KudaravalliS, KimSY, DermitzakisET, GiladY, et al. (2008) High-resolution mapping of expression-QTLs yields insight into human gene regulation. PLoS Genetics 4: e1000214.
63. BaderGD, CaryMP, SanderC (2006) Pathguide: a pathway resource list. Nucleic Acids Research 34: D504–D506.
64. Bauer-MehrenA, FurlongLI, SanzF (2009) Pathway databases and tools for their exploitation: benefits, current limitations and challenges. Molecular Systems Biology 5 : 290.
65. Wellcome Trust Case Control Consortium (2007) Genome-wide association study of 14,000 cases of seven common diseases and 3,000 shared controls. Nature 447 : 661–678.
66. AsklandK, ReadC, MooreJ (2009) Pathways-based analyses of whole-genome association study data in bipolar disorder reveal genes mediating ion channel activity and synaptic neurotransmission. Human Genetics 125 : 63–79.
67. EleftherohorinouH, HoggartCJ, WrightVJ, LevinM, CoinLJM (2011) Pathway-driven gene stability selection of two rheumatoid arthritis GWAS identifies and validates new susceptibility genes in receptor mediated signalling pathways. Human Molecular Genetics 20 : 3494–3506.
68. FreudenbergJ, LeeAT, SiminovitchKA, AmosCI, BallardD, et al. (2010) Locus category based analysis of a large genome-wide association study of rheumatoid arthritis. Human Molecular Genetics 19 : 3863–3872.
69. HolmansP, GreenEK, PahwaJS, FerreiraMAR, PurcellSM, et al. (2009) Gene Ontology analysis of GWA study data sets provides insights into the biology of bipolar disorder. American Journal of Human Genetics 85 : 13–24.
70. LuoL, PengG, ZhuY, DongH, AmosCI, et al. (2010) Genome-wide gene and pathway analysis. European Journal of Human Genetics 18 : 1045–1053.
71. O'DushlaineC, KennyE, HeronE, DonohoeG, GillM, et al. (2011) Molecular pathways involved in neuronal cell adhesion and membrane scaffolding contribute to schizophrenia and bipolar disorder susceptibility. Molecular Psychiatry 16 : 286–292.
72. PerryJRB, McCarthyMI, HattersleyAT, ZegginiE, WeedonMN, et al. (2009) Interrogating type 2 diabetes genome-wide association data using a biological pathway-based approach. Diabetes 58 : 1463–1467.
73. WangK, ZhangH, KugathasanS, AnneseV, BradfieldJP, et al. (2009) Diverse genome-wide association studies associate the IL12/IL23 pathway with Crohn disease. American Journal of Human Genetics 84 : 399–405.
74. ZhongH, YangX, KaplanLM, MolonyC, SchadtEE (2010) Integrating pathway analysis and genetics of gene expression for genome-wide association studies. American Journal of Human Genetics 86 : 581–591.
75. CarbonettoP, StephensM (2012) Scalable variational inference for Bayesian variable selection in regression, and its accuracy in genetic association studies. Bayesian Analysis 7 : 73–108.
76. GuanY, StephensM (2011) Bayesian variable selection regression for genome-wide association studies, and other large-scale problems. Annals of Applied Statistics 5 : 1780–1815.
77. LiY, WillerC, SannaS, AbecasisG (2009) Genotype imputation. Annual Review of Genomics and Human Genetics 10 : 387–406.
78. MarchiniJ, HowieB (2010) Genotype imputation for genome-wide association studies. Nature Reviews Genetics 11 : 499–511.
79. ServinB, StephensM (2007) Imputation-based analysis of association studies: candidate regions and quantitative traits. PLoS Genetics 3: e114.
80. ZhouX, CarbonettoP, StephensM (2013) Polygenic modeling with Bayesian sparse linear mixed models. PLoS Genetics 9: e1003264.
81. KassRE, RafteryAE (1995) Bayes factors. Journal of the American Statistical Association 90 : 773–795.
82. StephensM, BaldingDJ (2009) Bayesian statistical methods for genetic association studies. Nature Reviews Genetics 10 : 681–690.
83. FernandoMMA, StevensCR, WalshEC, De JagerPL, GoyetteP, et al. (2008) Defining the role of the MHC in autoimmunity: a review and pooled analysis. PLoS Genetics 4: e1000024.
84. PolychronakosC, LiQ (2011) Understanding type 1 diabetes through genetics: advances and prospects. Nature Reviews Genetics 12 : 781–792.
85. BartonA, ThomsonW, KeX, EyreS, HinksA, et al. (2008) Rheumatoid arthritis susceptibility loci at chromosomes 10p15, 12q13 and 22q13. Nature genetics 40 : 1156–1159.
86. CooperJD, WalkerNM, SmythDJ, DownesK, HealyBC, et al. (2009) Follow-up of 1715 SNPs from the Wellcome Trust Case Control Consortium genome-wide association study in type I diabetes families. Genes and Immunity 10: S85–S94.
87. ParkesM, BarrettJC, PrescottNJ, TremellingM, AndersonCA, et al. (2007) Sequence variants in the autophagy gene IRGM and multiple other replicating loci contribute to Crohn's disease susceptibility. Nature Genetics 39 : 830–832.
88. ThomsonW, BartonA, KeX, EyreS, HinksA, et al. (2007) Rheumatoid arthritis association at 6q23. Nature Genetics 39 : 1431–1433.
89. ToddJA, WalkerNM, CooperJD, SmythDJ, DownesK, et al. (2007) Robust associations of four new chromosome regions from genome-wide analyses of type 1 diabetes. Nature Genetics 39 : 857–864.
90. MHC Sequencing Consortium (1999) Complete sequence and gene map of a human major histocompatibility complex. Nature 401 : 921–923.
91. HortonR, WilmingL, RandV, LoveringRC, BrufordEA, et al. (2004) Gene map of the extended human MHC. Nature Reviews Genetics 5 : 889–899.
92. ImbodenJB (2009) The immunopathogenesis of rheumatoid arthritis. Annual Review of Pathology 4 : 417–434.
93. BergerJO, SellkeT (1987) Testing a point null hypothesis: the irreconcilability of P values and evidence. Journal of the American Statistical Association 82 : 112–122.
94. O'SheaJJ, MaA, LipskyP (2002) Cytokines and autoimmunity. Nature Reviews Immunology 2 : 37–45.
95. GodessartN, KunkelSL (2001) Chemokines in autoimmune disease. Current Opinion in Immunology 13 : 670–675.
96. ZhernakovaA, van DiemenCC, WijmengaC (2009) Detecting shared pathogenesis from the shared genetics of immune-related diseases. Nature Reviews Genetics 10 : 43–55.
97. HampeJ, FrankeA, RosenstielP, TillA, TeuberM, et al. (2007) A genome-wide association scan of nonsynonymous SNPs identifies a susceptibility variant for Crohn disease in ATG16L1. Nature Genetics 39 : 207–211.
98. RiouxJD, XavierRJ, TaylorKD, SilverbergMS, GoyetteP, et al. (2007) Genome-wide association study identifies new susceptibility loci for Crohn disease and implicates autophagy in disease pathogenesis. Nature Genetics 39 : 596–604.
99. HomerCR, RichmondAL, RebertNA, AchkarJ, McDonaldC (2010) ATG16L1 and NOD2 interact in an autophagy-dependent antibacterial pathway implicated in Crohn's disease pathogenesis. Gastroenterology 139 : 1630–1641.
100. GargG, TylerJR, YangJHM, CutlerAJ, DownesK, et al. (2012) Type 1 diabetes-associated IL2RA variation lowers IL-2 signaling and contributes to diminished CD4+CD25+ regulatory T cell function. Journal of Immunology 188 : 4644–4653.
101. SakaguchiS, YamaguchiT, NomuraT, OnoM (2008) Regulatory T cells and immune tolerance. Cell 133 : 775–787.
102. ToddJA (2010) Etiology of type 1 diabetes. Immunity 32 : 457–467.
103. van BelleTL, CoppietersKT, von HerrathMG (2011) Type 1 diabetes: etiology, immunology, and therapeutic strategies. Physiological Reviews 91 : 79–118.
104. ChistiakovDA, VoronovaNV, ChistiakovPA (2008) The crucial role of IL-2/IL-2RA-mediated immune regulation in the pathogenesis of type 1 diabetes, an evidence coming from genetic and animal model studies. Immunology Letters 118 : 1–5.
105. HulmeMA, WasserfallCH, AtkinsonMA, BruskoTM (2012) Central role for interleukin-2 in type 1 diabetes. Diabetes 61 : 14–22.
106. DörigRE, MarcilA, ChopraA, RichardsonCD (1993) The human CD46 molecule is a receptor for measles virus (Edmonston strain). Cell 75 : 295–305.
107. NanicheD (2009) Human immunology of measles virus infection. Current Topics in Microbiology and Immunology 330 : 151–171.
108. TatsuoH, OnoN, TanakaK, YanagiY (2000) SLAM (CDw150) is a cellular receptor for measles virus. Nature 406 : 893–789.
109. RosenauBJ, SchurPH (2009) Association of measles virus with rheumatoid arthritis. Journal of Rheumatology 36 : 893–897.
110. McInnesIB, SchettG (2011) The pathogenesis of rheumatoid arthritis. New England Journal of Medicine 365 : 2205–2219.
111. MehraeinY, LennerzC, EhlhardtS, RembergerK, OjakA, et al. (2004) Virus antibodies in serum and synovial fluid of patients with rheumatoid arthritis and other connective tissue diseases. Modern Pathology 17 : 781–789.
112. CotsapasC, VoightBF, RossinE, LageK, NealeBM, et al. (2011) Pervasive sharing of genetic effects in autoimmune disease. PLoS Genetics 7: e1002254.
113. TaitKF, MarshallT, BermanJ, Carr-SmithJ, RoweB, et al. (2004) Clustering of autoimmune disease in parents of siblings from the Type 1 diabetes Warren repository. Diabetic Medicine 21 : 358–362.
114. BonizziG, KarinM (2004) The two NF-kappaB activation pathways and their role in innate and adaptive immunity. Trends in Immunology 25 : 280–288.
115. CharoIF, RansohoffRM (2006) The many roles of chemokines and chemokine receptors in inflammation. New England Journal of Medicine 354 : 610–621.
116. DongC, DavisRJ, FlavellRA (2002) MAP kinases in the immune response. Annual Review of Immunology 20 : 55–72.
117. PaoLI, BadourK, SiminovitchKA, NeelBG (2007) Nonreceptor protein-tyrosine phosphatases in immune cell signaling. Annual Review of Immunology 25 : 473–523.
118. BallardDH, AporntewanC, LeeJ, LeeJ, WuZ, et al. (2009) A pathway analysis applied to Genetic Analysis Workshop 16 genome-wide rheumatoid arthritis data. BMC Proceedings 3: S91.
119. BeyeneJ, HuP, HamidJS, ParkhomenkoE, PatersonAD, et al. (2009) Pathway-based analysis of a genome-wide case-control association study of rheumatoid arthritis. BMC Proceedings 3: S128.
120. PengG, LuoL, SiuH, ZhuY, HuP, et al. (2010) Gene and pathway-based second-wave analysis of genome-wide association studies. European Journal of Human Genetics 18 : 111–117.
121. WangL, JiaP, WolfingerRD, ChenX, GraysonBL, et al. (2011) An efficient hierarchical generalized linear mixed model for pathway analysis of genome-wide association studies. Bioinformatics 27 : 686–692.
122. AlejandroEU, KalynyakTB, TaghizadehF, GwiazdaKS, RawstronEK, et al. (2010) Acute insulin signaling in pancreatic beta-cells is mediated by multiple Raf-1 dependent pathways. Endocrinology 151 : 502–512.
123. SumaraG, FormentiniI, CollinsS, SumaraI, WindakR, et al. (2009) Regulation of PKD by the MAPK p38δ in insulin secretion and glucose homeostasis. Cell 136 : 235–248.
124. BottiniN, VangT, CuccaF, MustelinT (2006) Role of PTPN22 in type 1 diabetes and other autoimmune diseases. Seminars in Immunology 18 : 207–213.
125. BartokB, FiresteinGS (2010) Fibroblast-like synoviocytes: key effector cells in rheumatoid arthritis. Immunological Reviews 233 : 233–255.
126. MurphySH, SuzukiK, DownesM, WelchGL, De JesusP, et al. (2011) Tumor suppressor protein (p)53 is a regulator of NF-kappaB repression by the glucocorticoid receptor. Proceedings of the National Academy of Sciences 108 : 17117–17122.
127. IchimuraA, HirasawaA, Poulain-GodefroyO, BonnefondA, HaraT, et al. (2012) Dysfunction of lipid sensor GPR120 leads to obesity in both mouse and human. Nature 483 : 350–354.
128. FraylingTM, TimpsonNJ, WeedonMN, ZegginiE, FreathyRM, et al. (2007) A common variant in the FTO gene is associated with body mass index and predisposes to childhood and adult obesity. Science 316 : 889–894.
129. McCarthyMI (2010) Genomics, type 2 diabetes, and obesity. New England Journal of Medicine 363 : 2339–2350.
130. BarrettJC, ClaytonDG, ConcannonP, AkolkarB, CooperJD, et al. (2009) Genome-wide association study and meta-analysis find that over 40 loci affect risk of type 1 diabetes. Nature Genetics 41 : 703–707.
131. EyreS, BowesJ, DiogoD, LeeA, BartonA, et al. (2012) High-density genetic mapping identifies new susceptibility loci for rheumatoid arthritis. Nature Genetics 44 : 1336–1340.
132. JostinsL, RipkeS, WeersmaRK, DuerrRH, McGovernDP, et al. (2012) Host-microbe interactions have shaped the genetic architecture of inflammatory bowel disease. Nature 491 : 119–124.
133. FisherSA, TremellingM, AndersonCA, GwilliamR, BumpsteadS, et al. (2008) Genetic determinants of ulcerative colitis include the ECM1 locus and five loci implicated in Crohn's disease. Nature Genetics 40 : 710–712.
134. BottoloL, RichardsonS (2010) Evolutionary stochastic search for Bayesian model exploration. Bayesian Analysis 5 : 583–618.
135. FridleyBL (2009) Bayesian variable and model selection methods for genetic association studies. Genetic Epidemiology 33 : 27–37.
136. HeQ, LinD (2011) A variable selection method for genome-wide association studies. Bioinformatics 27 : 1–8.
137. HoggartCJ, WhittakerJC, De IorioM, BaldingDJ (2008) Simultaneous analysis of all SNPs in genome-wide and re-sequencing association studies. PLoS Genetics 4: e1000130.
138. HungRJ, BaragattiM, ThomasD, McKayJ, Szeszenia-DabrowskaN, et al. (2007) Inherited predisposition of lung cancer: a hierarchical modeling approach to DNA repair and cell cycle control pathways. Cancer Epidemiology, Biomarkers and Prevention 16 : 2736–2744.
139. LogsdonBA, HoffmanGE, MezeyJG (2010) A variational Bayes algorithm for fast and accurate multiple locus genome-wide association analysis. BMC Bioinformatics 11 : 58.
140. SeguraV, VilhjálmssonBJ, PlattA, KorteA, SerenÜ, et al. (2012) An efficient multi-locus mixed-model approach for genome-wide association studies in structured populations. Nature Genetics 44 : 825–830.
141. YiN, XuS (2008) Bayesian Lasso for quantitative trait loci mapping. Genetics 179 : 1045–1055.
142. WuTT, ChenYF, HastieT, SobelE, LangeK (2009) Genome-wide association analysis by Lasso penalized logistic regression. Bioinformatics 25 : 714–721.
143. GuanY, StephensM (2008) Practical issues in imputation-based association mapping. PLoS Genetics 4: e1000279.
144. International HapMap Consortium (2007) A second generation human haplotype map of over 3.1 million SNPs. Nature 449 : 851–861.
145. DemirE, CaryMP, PaleyS, FukudaK, LemerC, et al. (2010) The BioPAX community standard for pathway data sharing. Nature Biotechnology 28 : 935–942.
146. KanehisaM, GotoS, FurumichiM, TanabeM, HirakawaM (2010) KEGG for representation and analysis of molecular networks involving diseases and drugs. Nucleic Acids Research 38: D355–D360.
147. CaspiR, AltmanT, DaleJM, DreherK, et al. (2010) The MetaCyc database of metabolic pathways and enzymes and the BioCyc collection of pathway/genome databases. Nucleic Acids Research 38: D473–D479.
148. SohD, DongD, GuoY, WongL (2010) Consistency, comprehensiveness, and compatibility of pathway databases. BMC Bioinformatics 11 : 449.
149. StobbeM, HoutenS, JansenG, van KampenA, MoerlandP (2011) Critical assessment of human metabolic pathway databases: a stepping stone for future integration. BMC Systems Biology 5 : 165.
150. CooksonW, LiangL, AbecasisG, MoffattM, LathropM (2009) Mapping complex disease traits with global gene expression. Nature Reviews Genetics 10 : 184–194.
151. DixonAL, LiangL, MoffattMF, ChenW, HeathS, et al. (2007) A genome-wide association study of global gene expression. Nature Genetics 39 : 1202–1207.
152. StrangerBE, NicaAC, ForrestMS, DimasA, BirdCP, et al. (2007) Population genomics of human gene expression. Nature Genetics 39 : 1217–1224.
153. GeorgeEI, McCullochRE (1993) Variable selection via Gibbs sampling. Journal of the American Statistical Association 88 : 881–889.
154. BodmerW, BonillaC (2008) Common and rare variants in multifactorial susceptibility to common diseases. Nature Genetics 40 : 695–701.
155. IoannidisJPA, TrikalinosTA, KhouryMJ (2006) Implications of small effect sizes of individual genetic variants on the design and interpretation of genetic association studies of complex diseases. American Journal of Epidemiology 164 : 609–614.
156. O'BrienSM, DunsonDB (2004) Bayesian multivariate logistic regression. Biometrics 60 : 739–746.
157. HoetingJA, MadiganD, RafteryAE, VolinskyCT (1999) Bayesian model averaging: a tutorial. Statistical Science 14 : 382–401.
158. MitchellTJ, BeauchampJJ (1988) Bayesian variable selection in linear regression. Journal of the American Statistical Association 83 : 1023–1032.
159. StoreyJD (2003) The positive false discovery rate: a Bayesian interpretation and the q-value. Annals of Statistics 31 : 2013–2035.
160. StoreyJD, TibshiraniR (2003) Statistical significance for genomewide studies. Proceedings of the National Academy of Sciences 100 : 9440–9445.
161. ZegginiE, ScottLJ, SaxenaR, VoightBF, MarchiniJL, et al. (2008) Meta-analysis of genomewide association data and large-scale replication identifies additional susceptibility loci for type 2 diabetes. Nature Genetics 40 : 638–645.
162. PirinenM, DonnellyP, SpencerCCA (2012) Including known covariates can reduce power to detect genetic effects in case-control studies. Nature Genetics 44 : 848–851.
163. SchaeferCF, AnthonyK, KrupaS, BuchoffJ, DayM, et al. (2009) PID: the Pathway Interaction Database. Nucleic Acids Research 37: D674–D679.
164. GeerLY, Marchler-BauerA, GeerRC, HanL, HeJ, et al. (2010) The NCBI BioSystems database. Nucleic Acids Research 38: D492–D496.
165. CeramiEG, GrossBE, DemirE, RodchenkovI, BaburÖ, et al. (2011) Pathway Commons, a web resource for biological pathway data. Nucleic Acids Research 39: D685–D690.
166. KandasamyK, MohanSS, RajuR, KeerthikumarS, KumarGSS, et al. (2010) NetPath: a public resource of curated signal transduction pathways. Genome Biology 11: R3.
167. CroftD, O'KellyG, WuG, HawR, GillespieM, et al. (2011) Reactome: a database of reactions, pathways and biological processes. Nucleic Acids Research 39: D691–D697.
168. RomeroP, WaggJ, GreenM, KaiserD, KrummenackerM, et al. (2004) Computational prediction of human metabolic pathways from the complete human genome. Genome Biology 6: R2.
169. PicoAR, KelderT, van IerselMP, HanspersK, ConklinBR, et al. (2008) WikiPathways: pathway editing for the people. PLoS Biology 6: e184.
170. KelderT, van IerselMP, HanspersK, KutmonM, ConklinBR, et al. (2012) WikiPathways: building research communities on biological pathways. Nucleic Acids Research 40: D1301–D1307.
171. MiH, DongQ, MuruganujanA, GaudetP, LewisS, et al. (2010) PANTHER version 7: improved phylogenetic trees, orthologs and collaboration with the Gene Ontology Consortium. Nucleic Acids Research 38: D204–D210.
172. SilverbergMS, DuerrRH, BrantSR, BromfieldG, DattaLW, et al. (2007) Refined genomic localization and ethnic differences observed for the IBD5 association with Crohn's disease. European Journal of Human Genetics 15 : 328–335.
173. Van LimbergenJ, RussellRK, NimmoER, SatsangiJ (2007) The genetics of inflammatory bowel disease. American Journal of Gastroenterology 102 : 2820–2831.
174. RiouxJD, GoyetteP, VyseTJ, HammarströmL, FernandoMMA, et al. (2009) Mapping of multiple susceptibility variants within the MHC region for 7 immune-mediated diseases. Proceedings of the National Academy of Sciences 106 : 18680–18685.
175. PlengeRM, SeielstadM, PadyukovL, LeeAT, RemmersEF, et al. (2007) TRAF1-C5 as a risk locus for rheumatoid arthritis—a genomewide study. New England Journal of Medicine 357 : 1199–1209.
176. StahlEA, RaychaudhuriS, RemmersEF, XieG, EyreS, et al. (2010) Genome-wide association study meta-analysis identifies seven new rheumatoid arthritis risk loci. Nature Genetics 42 : 508–514.
177. BartonA, EyreS, KeX, HinksA, BowesJ, et al. (2009) Identification of AF4/fmr2 family, member 3 (AFF3) as a novel rheumatoid arthritis susceptibility locus and confirmation of two further pan-autoimmune susceptibility genes. Human Molecular Genetics 18 : 2518–2522.
178. RaychaudhuriS, RemmersEF, LeeAT, HackettR, GuiducciC, et al. (2008) Common variants at CD40 and other loci confer risk of rheumatoid arthritis. Nature Genetics 40 : 1216–1223.
179. CooperJD, WalkerNM, HealyBC, SmythDJ, DownesK, et al. (2009) Analysis of 55 autoimmune disease and type II diabetes loci: further confirmation of chromosomes 4q27, 12q13.2 and 12q24.13 as type I diabetes loci, and support for a new locus, 12q13.3–q14.1. Genes and Immunity 10: S95–S120.
180. HuangJ, EllinghausD, FrankeA, HowieB, LiY (2012) 1000 Genomes-based imputation identifies novel and refined associations for the Wellcome Trust Case Control Consortium phase 1 data. European Journal of Human Genetics 20 : 801–805.
181. LoweCE, CooperJD, BruskoT, WalkerNM, SmythDJ, et al. (2007) Large-scale genetic fine mapping and genotype-phenotype associations implicate polymorphism in the IL2RA region in type 1 diabetes. Nature Genetics 39 : 1074–1082.
182. VellaA, CooperJD, LoweCE, WalkerN, NutlandS, et al. (2005) Localization of a type 1 diabetes locus in the IL2RA/CD25 region by use of tag single-nucleotide polymorphisms. American Journal of Human Genetics 76 : 773–779.
183. HakonarsonH, GrantSFA, BradfieldJP, MarchandL, KimCE, et al. (2007) A genome-wide association study identifies KIAA0350 as a type 1 diabetes gene. Nature 448 : 591–594.
184. CooperJD, SmythDJ, SmilesAM, PlagnolV, WalkerNM, et al. (2008) Meta-analysis of genomewide association study data identifies additional type 1 diabetes risk loci. Nature Genetics 40 : 1399–1401.
185. McVeanGAT, MyersSR, HuntS, DeloukasP, BentleyDR, et al. (2004) The fine-scale structure of recombination rate variation in the human genome. Science 304 : 581–584.
186. DreszerTR, KarolchikD, ZweigAS, HinrichsAS, et al. (2012) The UCSC Genome Browser database: extensions and updates 2011. Nucleic Acids Research 40: D918–D923.
Štítky
Genetika Reprodukční medicínaČlánek vyšel v časopise
PLOS Genetics
2013 Číslo 10
- Kazuistika – Perspektivy využití precizované medicíny v rámci personalizované specifické terapie onkologických pacientů
- Nobelova cena za chemii pro genetické nůžky: Objev, který změní naši budoucnost?
- Technologie na bázi RNA v klinické praxi: od přebarvených petúnií k terapii vzácných a dosud jen obtížně léčitelných chorob u lidí
- „Nepředstavovali jsme si, že náš výzkum povede přímo ke vzniku nových léků, dokonce ještě za našeho života“
- Bezplatné služby pro diagnostiku ATTRv amyloidózy pro kardiology
Nejčtenější v tomto čísle
- A GDF5 Point Mutation Strikes Twice - Causing BDA1 and SYNS2
- Dominant Mutations in Identify the Mlh1-Pms1 Endonuclease Active Site and an Exonuclease 1-Independent Mismatch Repair Pathway
- Eleven Candidate Susceptibility Genes for Common Familial Colorectal Cancer
- The Histone H3 K27 Methyltransferase KMT6 Regulates Development and Expression of Secondary Metabolite Gene Clusters
Zvyšte si kvalifikaci online z pohodlí domova
Mazová zátka a její řešení
nový kurzVšechny kurzy