
High Throughput Sequencing Reveals Alterations in the Recombination Signatures with Diminishing Spo11 Activity
Spo11 is the topoisomerase-like enzyme responsible for the induction of the meiosis-specific double strand breaks (DSBs), which initiates the recombination events responsible for proper chromosome segregation. Nineteen PCR-induced alleles of SPO11 were identified and characterized genetically and cytologically. Recombination, spore viability and synaptonemal complex (SC) formation were decreased to varying extents in these mutants. Arrest by ndt80 restored these events in two severe hypomorphic mutants, suggesting that ndt80-arrested nuclei are capable of extended DSB activity. While crossing-over, spore viability and synaptonemal complex (SC) formation defects correlated, the extent of such defects was not predictive of the level of heteroallelic gene conversions (prototrophs) exhibited by each mutant. High throughput sequencing of tetrads from spo11 hypomorphs revealed that gene conversion tracts associated with COs are significantly longer and gene conversion tracts unassociated with COs are significantly shorter than in wild type. By modeling the extent of these tract changes, we could account for the discrepancy in genetic measurements of prototrophy and crossover association. These findings provide an explanation for the unexpectedly low prototroph levels exhibited by spo11 hypomorphs and have important implications for genetic studies that assume an unbiased recovery of prototrophs, such as measurements of CO homeostasis. Our genetic and physical data support previous observations of DSB-limited meioses, in which COs are disproportionally maintained over NCOs (CO homeostasis).
Published in the journal:
. PLoS Genet 9(10): e32767. doi:10.1371/journal.pgen.1003932
Category:
Research Article
doi:
https://doi.org/10.1371/journal.pgen.1003932
Summary
Spo11 is the topoisomerase-like enzyme responsible for the induction of the meiosis-specific double strand breaks (DSBs), which initiates the recombination events responsible for proper chromosome segregation. Nineteen PCR-induced alleles of SPO11 were identified and characterized genetically and cytologically. Recombination, spore viability and synaptonemal complex (SC) formation were decreased to varying extents in these mutants. Arrest by ndt80 restored these events in two severe hypomorphic mutants, suggesting that ndt80-arrested nuclei are capable of extended DSB activity. While crossing-over, spore viability and synaptonemal complex (SC) formation defects correlated, the extent of such defects was not predictive of the level of heteroallelic gene conversions (prototrophs) exhibited by each mutant. High throughput sequencing of tetrads from spo11 hypomorphs revealed that gene conversion tracts associated with COs are significantly longer and gene conversion tracts unassociated with COs are significantly shorter than in wild type. By modeling the extent of these tract changes, we could account for the discrepancy in genetic measurements of prototrophy and crossover association. These findings provide an explanation for the unexpectedly low prototroph levels exhibited by spo11 hypomorphs and have important implications for genetic studies that assume an unbiased recovery of prototrophs, such as measurements of CO homeostasis. Our genetic and physical data support previous observations of DSB-limited meioses, in which COs are disproportionally maintained over NCOs (CO homeostasis).
Introduction
An important function of meiosis is to precisely segregate one copy of each chromosome into cells that become gametes. This accurate division is accomplished by presenting the meiosis I spindle with homolog pairs that have been linked by crossovers (COs), so that partner chromosomes can segregate from each other. Chromosomes that fail to sustain a CO are at risk of undergoing nondisjunction, and may produce aneuploid gametes that are usually inviable. A single CO can be sufficient for proper segregation. However, those COs that occur too close or too far from the centromere can also be detrimental [1]–[3]. Thus, it is essential for the meiotic cell to control the number and distribution of COs.
Meiotic DSBs formed by Spo11 are regarded as the major initiating events for CO and non-crossover (NCO) recombination in all organisms studied to date [4]. In budding yeast, it has been estimated that 140–220 DSBs result in ∼95 COs per meiosis [5]. Only a broad estimate of how the remaining DSBs are repaired can be made due to limitation in resolution and the current inability to detect certain repair events in absolute amounts. Nevertheless, given the aforementioned limitations, roughly 40 become detectable NCOs [5], [6] and the rest are undetectable events, including restorations (∼40) [7], intersister (∼10–30) and possibly NCOs with very short gene conversion (GC) tracts. Thus the majority of DSBs formed during meiosis are directed to interhomolog repair, in contrast to mitosis where intersister repair dominates.
Efficient interhomolog repair requires that the two homologs pair, at least locally, at DSBs. In yeast and mice, Spo11-initiated recombination has been shown to be essential for chromosomes to find their homologous partners and establish stable pairing [8], [9]. Spo11-initiated recombination is furthermore necessary for SC assembly. Homologous synapsis via SC deposition along the paired chromosomes further biases repair towards a CO outcome [10]. Although a large number of synapsis initiation events are presumed to occur at recombination sites themselves, the earliest synapsis events initiate at the centromeres [11]–[13]. A small set of spo11 alleles has been previously used to assess the consequences of reduced numbers of DSBs on CO distribution and frequency [14], [15]. These studies revealed the existence of a phenomenon whereby CO numbers remain stable despite fluctuations in total recombination events. It has been proposed that such “CO homeostasis” reflects a mechanism to ensure that COs form at the expense of NCOs when overall DSB levels are low [15].
In budding yeast meiosis, most COs result from resolution of a double Holliday junction, while NCOs arise predominantly through synthesis-dependent strand annealing (SDSA) [7], [16]. Both processes involve intermediates containing heteroduplex DNA. Mismatch repair of the heteroduplex can result in gene conversion that is generally contiguous; however, it is now appreciated that gene conversion tracts may also be discontinuous [6], [7], [17]. Since gene conversions are associated with both COs and NCOs, they have historically been used as a metric for overall recombination. Gene conversion can easily be measured when heteroalleles are used to select prototrophs. In meiosis, repair of the DSB is initiated by basepairing one free end with the non-sister chromatid, forming a heteroduplex. Depending on the length of the gene conversion tract, when one end of the heteroduplex stops between two heteroalleles, a functional gene can be generated, making the cell prototrophic. Prototrophs are a subset of gene conversions that are detectable.
The analysis of flanking marker exchange among prototrophs in the ARG4 region was used to substantiate the existence of CO homeostasis [15], [18]. Increasingly defective spo11 alleles generated prototrophs with increasingly higher levels of CO association (i.e., flanking marker exchange in selected prototrophs), suggesting that, as DSBs become scarce, a given recombination event is more likely to be repaired as a CO. A second way to define CO homeostasis was described [19] where the fluctuation of CO number remained low compared to larger fluctuations of total recombination events in wild-type meioses. This alternate analysis refocused the phenomenon of CO control in more physiological ranges of DSBs and paved the way to study CO homeostasis in other organisms [20]. CO homeostasis has now been documented in worm, mouse and human meioses using cytological markers to measure lower than expected fluctuations in CO number [21]–[23].
It is noteworthy that measurement of GC tract lengths is constrained by the density of heterozygous markers. Two studies in yeast [24], [25] measured GC tract lengths, averaging 1–2 kb, among identified recombinants within small well-marked regions. Recently, high density arrays and next-generation sequencing have further refined tract length measurements and expanded the data to encompass the whole genome [5], [6]. CO-associated tract lengths were found to be quite variable, averaging ∼2000 bp, and being ∼200 bp longer than conversion tracts not associated with a reciprocal exchange. Importantly, several recombination mutants have altered GC tract lengths, revealing that mutants can affect recombination in unexpected ways [5], [19].
Since Spo11 is the enzyme that catalyzes DSB formation, the identification of additional alleles can be a valuable tool for deciphering the role of DSB levels in various aspects of meiosis. Here we isolate nineteen new spo11 alleles and characterize them using genetics and sequencing to evaluate the relationship between recombination initiation and recombination outcomes. Historically, prototroph assays have been used as a genetic measure for DSB levels. We find, that especially for meioses with severely reduced Spo11 activity, prototroph frequencies critically underestimate DSB formation. Our findings indicate that a reduction in DSB activity influences detectability of recombination events due to alterations in the lengths of GC tracts. The extent and direction of tract length change depends on whether the event results in a CO or NCO.
Results
Novel spo11 hypomorphs display a broad spectrum of CO defects
Hypomorphic spo11 alleles were isolated by screening transformants carrying PCR-derived mutant SPO11 sequences for defects in gene conversions and spore viability (Materials and Methods). Nineteen non-null mutants were recovered and characterized. The sequence changes in these mutants are presented in Figure S1. Diploids homozygous for each mutation were constructed and used to quantify CO frequencies. Genetic analysis of spo11 hypomorphs must take into account that mutants with severe defects will generate mostly dead spores due to nondisjunction of nonrecombinant chromosomes [26]. Thus, the spores that are viable may have undergone higher than average numbers of COs. To eliminate this bias, we incorporated a spo13 mutation in the strains used to make genetic measurements. Meiosis in spo11 spo13 diploids generates viable diploid spores as a result of a single, predominantly equational round of chromosome segregation, independent of recombination. [27].
A wild-type diploid and twenty mutants (19 novel alleles and a previously characterized allele, spo11-D290A6HA [28]) in an isogenic background (Figure 1A) were induced to undergo meiosis at three different temperatures (18°C, 22°C and 31.5°C). To isolate meiotic products for measurements of CO frequencies, arginine prototrophs were selected from purified spore populations. Arg prototrophs result from a GC between heteroalleles at the ARG4 locus. Arg+ recombinants were scored for the segregation of four chromosome 3 markers; CO frequencies on chromosome 3 were then summed to obtain an overall measure of CO frequency (Table S1). The 20 mutants characterized exhibit a wide range of recombination levels. Among the different mutants, crossover defects ranged from 50 fold reduced (for spo11-751) to 1.6 fold reduced (for spo11-118), at the most restrictive temperature. Interestingly, the vast majority of mutants are cold sensitive; for example, the spo11-245 mutant exhibits 55% of the wild-type levels of COs at 31.5°C, but only 3.8% of the wild-type level at 18°C.

To obtain an independent measure of crossing over, we conducted a physical analysis of reciprocal recombination between linear and circular versions of chromosome 3 ([29]; Materials and Methods). Wild type (WT) and three spo11 hypomorphs were sporulated at 31.5°C, and chromosomes from populations of sporulated cells were then fractionated on a CHEF gel and analyzed by Southern blot hybridization using a probe from chromosome 3 (Figure 1B). A single CO between circular and linear chromosomes 3 results in a linear chromosome twice as long as the original. A CO between the linear dimer and the other circle generates a chromosome three times as long as the original. The abundance of chromosome 3 CO products as measured in this assay correlates well with the frequency of COs as determined genetically (Figure 1C) (correlation coefficient = 0.96; p-value<0.05.). DSBs were also physically measured with the same mutant alleles in a sae2 background and were found to have a reduction in observable DSBs (Figure 1B,C).
CO levels are correlated with spore viability and SC formation in SPO11 alleles
Since crossing over is required for proper chromosome segregation at meiosis I, a simple expectation is that spore viability varies with CO frequency in the spo11 mutants. Spore viability was measured in SPO13 versions of the spo11 mutants used to measure crossing over (Table S2). In wild-type yeast, COs are in significant excess to the number of chromosome pairs (∼95 COs vs. 16 pairs of chromosomes). Thus, modest decreases in crossing over are not expected to decrease spore viability dramatically as long as COs are properly distributed among chromosomes [30]. Accordingly, the relationship between CO frequency and spore viability was non-linear; dramatic decreases in viability were observed only as the number of measured COs approached the number of chromosome pairs (Figure 1D). The apparent requirement for more than one CO per chromosome may reflect a defect in crossover control or the inability for a functioning CO distribution system to deal with so few COs. However, we cannot eliminate the possibility that we have a selection bias for high functioning cells within a population due to our method of first selecting prototrophs.
Assembly of the SC begins at the sites of synapsis initiation complexes (SICs) [12], [31] and these complexes are thought to mark the sites of future COs [32], [33]. Thus, the extent of SC formation is presumed to parallel CO level [14]. We characterized spo11 hypomorphs for the extent of SC formation by staining surface-spread nuclei with antibodies to the SC component, Zip1 (Figures 1E and 1F). The synapsis phenotypes of the mutants encompassed the entire spectrum from mostly dotty Zip1 localization with only rare linear stretches to wild-type levels of full-length SC. Overall, the extent of SC formation in spo11 mutants roughly follows CO levels with those mutants undergoing more COs achieving more complete synapsis (Figure 1G, Table S2).
spo11 hypomorphs can be rescued by prophase arrest
In order to score synapsis in a uniformly arrested population for several severely defective spo11 hypomorphs, we measured SC formation in an ndt80 background. Ndt80 promotes progression beyond the pachytene stage of meiosis, thus SPO11 ndt80 cells arrest with fully synapsed chromosomes [34]. Interestingly, while some severe spo11 mutants only produced rare nuclei with partial SCs, in the ndt80 background such mutants displayed up to 96% of meiotic chromosome spreads with SC (Figure 2A, Table S2). This ndt80-associated restoration of synapsis was apparent for several alleles (179, 217, 245, 1025 and 240, Table S2 and data not shown) but either weakly restored or absent in other alleles (246, 117 and 845, data not shown). To further examine this apparent rescue of the spo11 phenotype, recombination levels were measured by scoring Arg prototroph formation after 48 hours of ndt80-arrest by a return to growth assay. While previous work reported small increases in heteroallelic prototrophy levels in ndt80 - and cdc28-arrested cells [34], [35] our WT ndt80 strain did not increase Arg prototrophy levels compared to WT (Figure 2). However, Arg prototroph formation was increased approximately 10 and 60-fold in spo11-179 ndt80 and spo11-217 ndt80, respectively (Figure 2B, Table S1) compared to the mutants in the NDT80 background, and reached about 10% of WT (and SPO11 ndt80) levels.

If recombination and synapsis are restored, then spore viability should increase as well in spo11 hypomorphs arrested at late pachytene. To explore this question we used an estrogen-inducible NDT80 allele [36], so that after a prolonged prophase arrest, cells could be induced to sporulate. Dissection of the spo11 hypomorphs after 48 hours of ndt80 arrest produced a large increase in spore viability (spo11-179 increased from 7% to 71% and spo11-217 increased from 5% to 88%, Figure 2C, Table S2). Moreover, crossing over, increased to about 60% of wild-type values (Figure 2D, Tables S1 and S3).
spo11 mutants display more severe defects in heteroallelic recombination than in crossing over
The effect of spo11 mutations on meiotic GC was assessed by determining the frequency of prototroph formation at ARG4. We observed insignificant temperature effects in the wild-type strain for prototroph frequency (2.3×10⁻⁴ vs. 1.8×10⁻⁴ when sporulated at 22° or 31.5° respectively). Although CO values appeared to be somewhat temperature sensitive (78 cM vs. 91 cM at 18° and 31.5° respectively, Table S1), no effects of temperature on CO numbers or tract lengths were found by deep sequencing analysis in a limited number of tetrads (see below).
Diaz et al. [28] found that certain spo11 alleles have altered cut sites within an artificial hotspot, suggesting that alterations of the Spo11 complex can affect more than just quantity of cuts. While we have checked that a subset of our spo11 alleles have decreased DSBs (Figure 1B) we do not know if they have additional alterations in the locations of cutting. For simplicity of this analysis, we will assume that each allele is a simple hypomorph, and that temperature effects change only the number of events. (Note that in our simulations below, we find that varying the usage of DSB sites within the ARG4 region does not significantly alter the prototrophy levels (Figure S2)
If prototroph formation and crossing over are similarly impacted by decreased Spo11 activity, then a directly proportional relationship should be observed when CO frequencies are plotted against prototroph frequencies. However, prototroph formation is affected more severely than crossing over (Figure 3A) and this trend is apparent in the entire spectrum of mutants and temperatures. The disparity between crossover and gene conversion levels increased as Spo11 activity declined. For example, a mutant with less than 1% of the wild-type level of prototroph formation exhibits as much as 15% of the wild-type level of crossing over (e.g., spo11-179 at 18°C, Table S1). This is seen even when mutants with greater than 20% of wild-type CO levels are plotted by temperature i.e. the three regression lines would have a positive X intercept rather than at zero. The use of spo13 dyads to generate spores avoids a viability bias in these analyses. However, if there is significant heterogeneity on a cell-to-cell basis for recombination within a genotype, it is possible that the observed disparity of CO and prototroph frequencies may be somewhat exaggerated. A similar trend to Arg prototrophy was observed when prototroph formation was measured at the LEU2 locus on chromosome 3, using a subset of SPO11 hypomorphs (Figure 3B, Table S4).

To better understand the relationship between GC and crossing over, we examined Arg prototrophs for the frequency of crossing over between flanking markers. In WT, the fraction of Arg prototrophs associated with a CO was ∼59% (Table S1). In the mutants, the fraction of Arg prototrophs associated with a CO was about 1.4 fold higher than in WT (Figure 3C), reaching a maximum of 78% crossover association, at the point where overall CO frequency (relative CO frequency on chromosome 3) decreased to ∼50% of the wild-type level (spo11-845 at 22°C, Table S1). However, when overall CO values decreased below 50%, the fraction of Arg prototrophs associated with a CO fell with the severity of the allele. A similar trend was observed when conversion-associated COs were measured at LEU2 (Figure 3D, Table S4). Since the majority of the mutants are cold-sensitive, the bulk of the data providing the downward trend in CO association (i.e., the most severe alleles) were derived from sporulation at 18°C. Thus, it is possible that this may reflect a temperature effect on CO association rather than a result of reduced Spo11 activity. However, inspection of the few alleles that provide similar Spo11 activity at high and low temperatures do not support the notion that cold temperatures influence CO association outcomes (Table S1, S2). With this caveat, we analyze the data using the simpler model that Spo11 activity is responsible for changes in CO association.
Our genetic experiments reveal two unexpected results. First, heteroallelic gene conversion levels (measured at ARG4 and LEU2) fell at a much greater rate especially in alleles with severely compromised Spo11 activity than other indicators of recombination ability (e.g. CO levels, spore viability and SC formation). Second, although flanking marker exchange among Arg and Leu prototrophs increased as expected in spo11 alleles with moderate defects (presumably due to CO homeostasis), in the most severe alleles, CO association surprisingly decreased compared to less severe mutants. Previous work using moderate spo11 alleles noticed a weakening of CO homeostasis as DSB activity decreased and proposed that CO homeostasis was strongest in cells with relatively high levels of DSBs [15]. If the trend of CO homeostasis had continued, we would expect that the alleles where Spo11 activity is severely compromised would show a continued gradual increase in CO/NCO ratio. Together, the hyper-reduction of prototrophs and the decrease in CO association suggests that the effects of severely reduced DSBs results not only in fewer events, but influences their repair outcome.
Whole-genome sequencing suggests a change in the CO/NCO ratio in spo11 hypomorphs
To better understand the effects of spo11 mutations on meiotic gene conversion and crossing over, we monitored meiotic recombination on a genome-wide scale by sequencing the genomes of spores from tetrads containing four viable spores. For this analysis, we used a diploid derived by mating a typical laboratory strain (S96) to a clinical isolate (YJM789). The parental strains differ from each other at ∼55,000 locations (single-nucleotide polymorphisms (SNPs)) allowing most interhomolog recombination events to be detected [6], [37].
Spores from five tetrads derived from spo11 hypomorphs (three from spo11-217 and two from spo11-32, sporulated at 24 or 31.5 oC) were subjected to high-throughput, multiplexed sequencing. The data were compared to sequenced data from three wild-type tetrads sporulated at 30°C of which two were reported previously [6]; the wild-type tetrads had an average of 92 COs (Table 1). We also analyzed one wild-type tetrad at 22°C and two wild-type tetrads at 26°C. The recombination characteristics of the wild-type tetrads do not differ with temperature (Table S5). Two of the tetrads from the spo11-217 mutant had an average of 80 COs (Table 1); these were classified as “high-functioning (HI)”. The remaining tetrad from spo11-217 and the two tetrads from spo11-32 sustained an average of 55 COs (Table 1); these were grouped together and classified as “low-functioning (LO)”. Comparison of recombination in these tetrads with the genetic analysis on chromosome 3 reveals a large bias from selecting four-spore viable tetrads from mutants with low spore viability. spo11-32 strains sporulated at 31.5°C show only 26% of wild-type crossing over in spo13 dyads compared to 60% of wild-type COs from the two sequenced four-spore viable tetrads. It seems likely that this difference reflects the fluctuation of DSB activity on a cell-by-cell basis and that selecting for four-spore-viable tetrads constrains the range of DSBs in the meioses that we can recover. We assume that the reason a given mutant acts differently in individual tetrads is due to a difference in DSB number, and thus we categorized these tetrads based on numbers of COs (rather than genotype).

Deep sequencing of wild-type tetrads revealed recombination types that included single and multiple COs and NCOs with and without continuous tracts, as well as multi-strand events [6]. Examination of the recombination landscape in the five SPO11 hypomorphic tetrads revealed a similar proportion of recombination types as observed in WT. The sole exception is a disproportionate reduction of NCOs (Table 1) as will be discussed below. We note that the proportions of multi-strand COs relative to the total COs were found to be the same for spo11 hypomorphs and WT (Table 1). This suggests that events classified as complex events are likely to arise from a single DSB rather than via multiple DSB events, since reducing the number of DSBs did not decrease the proportion of the multi-strand COs.
CO interference is the nonrandom spacing of COs that is a feature of the normal distribution of COs but not NCOs. Through sequencing analysis we obtained the positions of COs genome-wide and we then examined interference by fitting a gamma distribution to intercrossover distances [19] obtained from grouping all five spo11 tetrads. This grouping was necessary to obtain sufficient numbers of intercrossover distances. Gamma values obtained from the distribution reflect the strength of CO interference. Consistent with previous genetic analysis of interference that showed no change in interference for spo11 mutant alleles [15], our genome-wide analysis detected wild-type levels of interference (gamma = 2.0; gamma = 1.0 represents no interference and 1.8 is wild-type interference) [19]. Moreover with the reduction of DSBs, it is likely that some chromosomes will fail to experience a CO. From the five sequenced hypomorphic tetrads we found five instances where small or relatively large chromosomes (chromosomes 1, 8, 8, 13, 14) lacked a crossover (E0s). On these 5 E0 chromosomes no other events (NCO's) were observed.
Successful detection of NCOs is subject to the density of markers as well as tract length (e.g., short tracts have a reduced probability of converting a marker and thus are less likely to be detected). As shown in Table 1, the total number of detectable events decreased in the mutants, but NCOs decreased to a greater extent than COs. As a result, COs represent a somewhat greater fraction of total events in the mutants (an average of 77.1% in the LO tetrads versus an average of 66.7% in the wild-type tetrads; P = 0.04, two sample t-test), suggesting a relative increase in COs at the expense of NCOs. However, similar to our previous analysis using prototroph formation, this conclusion assumes that the probability of detecting a NCO by sequencing is constant across the spectrum of mutants.
In spo11 mutants, GC tract lengths are increased in COs and decreased in NCOs
Gene conversion tracts result from the repair of heteroduplex or double-stranded gaps formed during DSB repair. In order to assess gene conversion tract lengths in spo11 hypomorphs, we inspected all CO and NCO events for regions of gene conversions, i.e., regions of 3∶1 or 1∶3 segregation of markers flanked by regions of 2∶2 segregation. The distance between the last marker showing 3∶1 segregation and the closest marker showing 2∶2 segregation is highly variable due to the differences in the density of markers within different regions along the chromosomes, leaving the actual tract length ambiguous. For example, a 3∶1 tract that spans only 1 kb may have the next 2∶2 markers at 10 kb on one side and 1 kb on the other. Using the common midpoint method, this tract would be scored as 6.5 kb (1 kb minimum plus half of each maximum tracts) in length. Even a few of these might skew our tract length analysis.
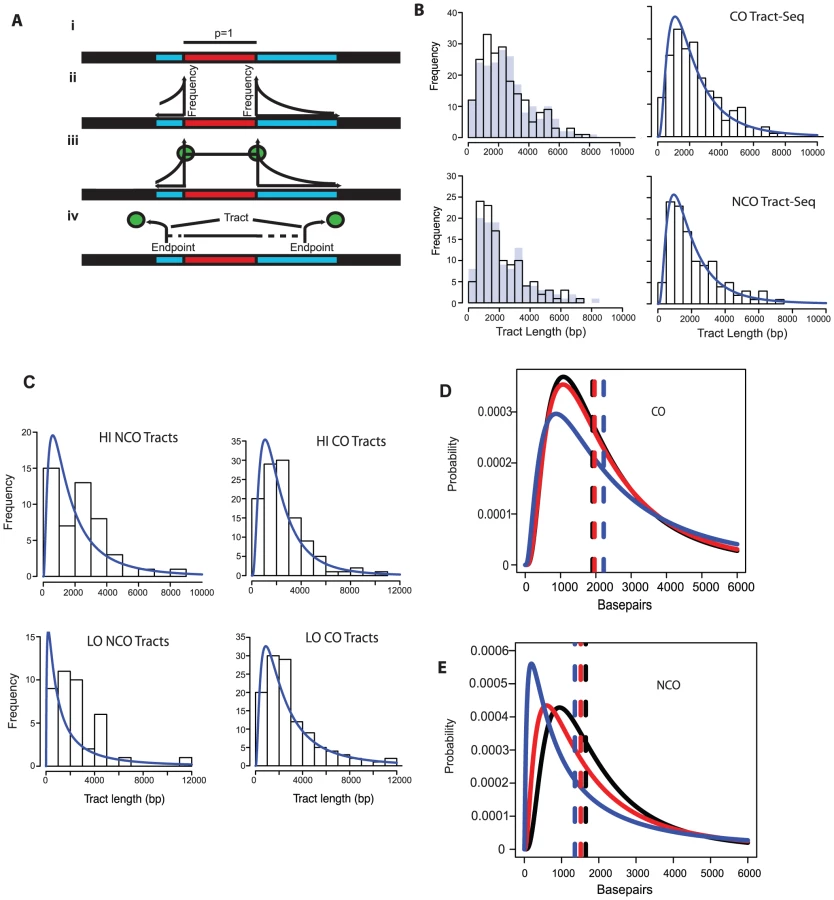
In order to better define tract lengths, we developed an algorithm, called Tract-Seq, that estimates tract length using a Markov model for tract growth combined with Monte Carlo simulations (Materials and Methods, Figure 4A). Figure 4B shows the distribution of wild-type tract lengths calculated by Tract-Seq in comparison to the distribution calculated by taking the midpoints. We generated similar graphs of “Tract-Seq” lengths for HI and LO (Figure 4C). Average tract lengths were determined from the log-normal fits for the distribution of CO-associated tracts and NCO tracts for WT, HI and LO tetrads (Figure 4D and E). CO-associated tracts increase in length as the Spo11 activity decreases; the means increased by 56 bp for HI tetrads and 316 bp for LO tetrads, compared to WT (Table 2). However, CO-associated tract lengths for LO tetrads, but not HI tetrads, compared to WT are significantly longer (p = 0.05 for LO vs. WT and p = 0.28 for HI vs. WT). In contrast, NCO tracts are smaller in context of decreased Spo11 activity; the mean length of tracts decreased by 134 for HI and 292 bp for LO (Table 2). Again, the difference in NCO tract lengths relative to WT is significant for LO tetrads, but not for HI tetrads (p = 0.02 for LO vs. WT and p = 0.17 for HI vs. WT). For both CO - and NCO-associated tracts, the range of possible tract lengths increases as Spo11 activity decreases.

The decrease in NCO tract length associated with decreasing Spo11 activity makes it possible that the abundance of NCOs relative to COs in the spo11 mutants was underestimated by sequencing analysis. This could occur if the decrease in NCOs is not an actual decrease in the number of NCOs, but a decrease in the ability to detect NCOs given their shorter length. To address this issue, we calculated how many NCOs would be missed due to detection issues (Materials and Methods). For LO, 6.3+/−0.2% are missed. Thus as Spo11 activity declines, the ability to assess the true number of NCOs becomes more difficult and could influence calculations such as the NCO/CO ratio, though marginally.
Besides detection, alterations in tract length could have unexpected consequences on measurements of DNA repair. Tract length changes of NCOs and COs in opposite directions, might affect measurements of prototroph formation or the association of a reciprocal recombination with gene conversion.
Modeling the tract length distributions in conjunction with CO homeostasis on ARG4 DSB hotspots recapitulates genetic data
In order to explore whether tract length changes in the spo11 hypomorphs could account for the discrepancy between prototroph levels and crossing over, we tested if we could obtain the observed ARG4 prototroph frequencies (Figure 3A) by computationally distributing tract lengths around the ARG4 hotspot for each of the three levels of Spo11 activity. For this analysis, we took advantage of the detailed information available regarding the location and usage of meiotic DSB sites near ARG4 [38]. Although these data were generated in the SK1 strain, we reasoned that the distribution of DSBs describes most genetic backgrounds since available comparisons with a hybrid strain used for microarrays and sequencing (YJM789xS96) have so far been in general agreement [7], [17], [19]. Information regarding tract length distribution and the relative abundance of NCOs and COs was used to generate sets of tracts for WT, HI and LO tetrads. Relative DSB frequencies at three hotspots in the vicinity of ARG4 were taken from a DSB hotspot map derived from Spo11-oligos and were used as a template to position these tracts [38] (Figure 5A). We assumed that a tract initiating at one of the three hotspots and ending within the region between the two ARG4 heteroalleles could generate a prototroph. We found that as Spo11 activity declined, projected prototrophs declined at an increased rate, comparable to the genetic results (Figure 5B, red dots).

We next asked if our tract length distributions could recapitulate the change in the fraction of Arg prototrophs associated with a CO that we observed genetically (Figure 3C). By determining which of the prototroph-forming tracts were associated with a CO and which were due to NCOs (Materials and Methods) a trend similar to that seen for the genetic results emerged, with increasing contributions from the COs as Spo11 activity declined (Figure 5C, red dots). The percentage of prototrophs associated with a CO increased from 54% in WT, to 63% in the HI tetrads, and 68% in LO tetrads (Figure 5C).
In Figure 5F, the proportion of NCOs and COs contributing to prototrophy as Spo11 activity decreases was obtained from the sequencing data (Figure S3A). Figure S3A indicates that as Spo11 activity decreases, COs represent a greater proportion of recombination repair, an observation consistent with the presence of CO homeostasis. However, is CO homeostasis necessary to attain the good fit to the genetic CO association data observed in Figure 5C? To address this question, we simulated tract lengths for our mutants (HI and LO) and generated values for CO association assuming no CO homeostasis, that is, we used the wild-type proportion of COs even when Spo11 activity declined. In the case of no CO homeostasis, the calculated values for CO association (Figure 5C, blue circles), did not match the genetic data, unlike the good fit achieved when CO homeostasis is incorporated (Figure 5C, red circles). We also looked at the effects of varying other parameters independently Figure S2.
Modeling predicts severe GC tract length changes at the lowest levels of Spo11 activity
Can our experimentally generated genetic data be used to understand the relationship between tract lengths of NCOs and COs as Spo11 activity decreases to extremely low levels? The HI and LO tetrads examined above represent a limited range of Spo11 activity. It was not possible to obtain the sequence data needed to measure tract lengths for severe mutants because they do not produce tetrads with four viable spores. To circumvent this biological limitation, we performed simulations with various models of how tract length would change, extrapolating from the data of WT, HI and LO tetrads (Figure S3B–F). We then determined which of our simulations best describes our genetic observations.
First, we computed the number of NCOs as a fraction of total events in hypothetical mutants having 30, 10 and 3 COs, assuming a linear trend of the CO fraction as seen in our experimentally determined data (Material and Methods, Figure S3A). Second, we determined the mean tract length of log-normal CO and NCO distributions for these hypothetical mutants applying four different regression models of tract length behavior (Figure S3B–F, Materials and Methods).
We asked whether these models would recapitulate prototroph levels as a function of CO levels. All models tested were consistent with the aforementioned trend that, as COs declined, the frequency of prototrophs decreased at an increased rate, to as much as 7-fold lower than the decrease in COs (Figure 5D, data not shown).
We then asked which model would best recapitulate the genetic data with regard to the fraction of Arg prototrophs associated with a CO. Of all four regression models, only the inverse model for the mean CO tract distributions that predicts an inverse relationship between tract lengths and COs recapitulated the genetic data well (70%, 67% and 45% for simulated vs. 68%, 70% and 59% for genetic, for mutants undergoing 30, 10 and 3 COs, respectively) (Figure 5E). Moreover, although all models gave reasonable fits for Arg prototrophy frequency, the inverse model for mean CO tract distributions was the overall best (16%, 4% and 0.6% values vs. 12%, 1% and 0.5% genetic values, for mutants undergoing 30, 10 and 3 COs, respectively) (Figure 5D). Figure S3G shows that the inverse model for the CO tract length distribution predicts a severe increase in CO associated tract lengths in the cases where Spo11 activity is greatly diminished. This large increase in tract length in our model could explain why prototroph frequencies decline faster than CO frequencies in the measured genetic data as Spo11 activity declined. This suggests that as Spo11 activity decreases, gene conversion tracts associated with COs become too long to produce prototrophs, and NCO tracts become too short to produce prototrophs.
Discussion
Analysis of nineteen new spo11 hypomorphic alleles, encompassing a wide range of activity, revealed an unanticipated relationship between reciprocal recombination and gene conversion. Although the various spo11 mutants displayed crossing over, SC and spore viability phenotypes that correlated well together, prototroph frequencies were far more influenced by the severity of the allele. This was an unexpected observation, since prototroph frequencies have commonly been used as a metric for DSB levels (e.g. [28], [39], [40]). High-throughput sequencing analysis of a subset of these mutants [6] showed that the fraction of COs (over total events) increased from 0.66 in WT to 0.77 in the LO tetrads (the most severe mutants), providing strong support for the existence of CO homeostasis.
Analysis of five tetrads from spo11-hypomorphs revealed extensive tract length alterations. Tracts associated with COs were longer in cells with diminished Spo11 activity. In contrast, NCO tracts were shorter in cells with lower Spo11 activity. By simulating tracts changing both in length and in the ratios of CO and NCOs for the mutants and then placing them onto the well-characterized ARG4 DSB map [38], we recapitulated the result that prototroph levels are more affected than CO levels in severe spo11 alleles. Modeling the altered tracts onto the ARG4 locus clarifies both the upward trend of increasing CO association for the less severe spo11 alleles and the downward trend in CO association that occurred with more severe spo11 alleles. Both the changes in tract length and CO/NCO ratio are needed to generate the best fit to the genetic data (Figure S2).
Analysis of hypomorphic mutants of the SPO11 homolog in S. pombe, REC12, revealed similar unexpected relationships between the severity of certain hypomorphs and recombination outcome [41], complementary to what we report here. Intragenic recombination was reduced even in mutants that appeared not to have a significant reduction in DSBs or COs. The authors conclude that these alleles reveal a “separation-of-function”. However, in light of the present study, we propose an alternative explanation, that S. pombe REC12 mutants experience changes in tract lengths that would impact measures of intragenic recombination similar to what we find at ARG4.
Models for tract length changes
Tract lengths associated with COs become longer as Spo11 activity declines. Longer tracts may be due to an increase in branch migration and resection [42]. Crossover recombination is thought to occur at SICs, which, like recombination nodules, contain many of the enzymes thought to be necessary for catalyzing the CO [43], [44]. In spo11 hypomorphs, there are fewer SICs, as estimated by numbers of Zip3 foci [14]. We propose that, in the SPO11 hypomorphs, recombination enzymes, including those for resection and mismatch repair, are distributed between fewer SICs, thus enriching them with a relative abundance of enzymes. Consequently, these SICs may be more active, and generate longer resections. This proposed increase in enzymatic ability in hypomorphs with low Spo11 activity might increase in a nonlinear way, reflecting the predicted increases in tract lengths. A similar explanation was given to explain the long resection products of a single VDE cut in a spo11 null background [45], [46]. Efficient DSB formation at a site in an otherwise DSB-deficient strain (spo11-null) produced longer resected tracts and generated fewer prototrophs than expected, and this phenomenon was apparently due to reduced levels of DSBs in the cell (and not synapsis defects) [45]. Similarly, Malkova et al. [47], [48] saw increased GC tracts from HO-induced DSBs in strain backgrounds with no meiotic DSBs.
In contrast to GC tracts associated with COs, NCO tract lengths are shorter in cells with diminished Spo11 activity. Most NCOs are thought to occur by a different mechanism than COs which may help to explain this altered outcome. While COs go through a double Holliday junction intermediate, NCOs are thought, for the most part, to undergo a single strand invasion or SDSA (Synthesis-Dependent Strand Annealing) [16]. SDSA events are likely independent of SICs, since the number of these events is not reduced in mutants lacking SIC components [49], [50]. We propose that the reduction in NCO tract length is due to SDSAs forming in the absence of stably associated homologs. That is, the Spo11 hypomorphs have reduced levels of homolog pairing and SC ([14], this paper), which may otherwise stabilize the interaction of non-sister chromatids. We propose that SDSA recombination is sensitive to this lack of reinforced homolog alignment. In the absence of stable associations, the movement of chromosomes in the prophase nucleus [51] could interrupt the SDSA event prematurely, leading to even shorter gene conversion tracts. Nuclei with less Spo11 activity and fewer paired chromosomes would have the greatest obstruction to SDSA events.
Evidence for CO homeostasis
Our data raise important considerations regarding the characterization of CO homeostasis.
First, sequencing of spo11 hypomorphic tetrads revealed an overall reduction in recombination events, with a stronger reduction in NCOs, supporting the notion of CO homeostasis. However, since NCO tracts in strains with limiting DSBs are shorter, these data may reflect an inability to detect NCOs due to their lesser likelihood to span a heterologous SNP. We have estimated the loss of NCOs in the mutants by positioning tracts on the genome taking into account the actual SNP density map. In the case of our most severe hypothetical mutant (3CO) up to 16% of the NCOs become undetectable yet this apparent loss of NCOs only marginally affects measures of CO homeostasis. An alternative explanation for the reduction of NCOs, particularly in severe mutants where homolog pairing is severely compromised, may be that some DSBs fail to find their homologous partner and are instead repaired using the sister chromatid [52].
Second, the assay used to measure CO homeostasis, flanking marker exchange of prototrophs, assumes that a tract emanating from a CO or an NCO would have the same probability of forming a prototroph. However, since tract lengths change in unexpected ways in both NCOs and COs, and thus alter their abilities to form prototrophs, apparent flanking marker exchange cannot be assumed to be equal, particularly in severe hypomorphs. Note that different pairs of heteroalleles and different loci will elicit unique outputs.
Using a novel color system to study CO homeostasis in tetrads, Thacker et al. [18] were unable to detect CO homeostasis in a flanking marker assay in the spo11-HA mutant which has little impact on DSB levels. The authors argued that tract-length alterations might obscure NCO/CO ratios. Consistent with this, if we apply our observed tract length changes to the GFP alleles, we would expect a decrease of GFP+ recombinants associated with COs and an increase in GFP+ recombinants unassociated with a CO, since the heteroalleles are so close in this assay. So although our measurements of tract length in the HI mutants may not be significant, it seems reasonable to suggest that tract lengths are changed in modestly defective spo11 alleles in both budding and fission yeast (see above).
Consistent with the operation of CO homeostasis, we were only able to recapitulate the CO/NCO genetic data when applying the experimentally observed changes in numbers of CO and NCOs. Thus our data support the accumulating evidence that as Spo11 activity decreases, the fraction of recombination events that become COs increases.
Rescue by Ndt80 arrest
Our observation that two severe spo11 alleles can be rescued for SC formation, recombination and spore viability by the ndt80 mutant suggests that holding cells in prophase allows further DSB formation. This notion, that DSB formation may continue in cells held at mid prophase, has been suggested previously [53], based on limited increases in prototroph formation of arrested cells. Further support came from the observations of Allers and Lichten [16] in which they report an accumulation of joint molecules during Ndt80 arrest. However, we find that WT diploids arrested at the Ndt80 arrest point fail to show genetic evidence of the additional DSBs in spores (i.e., no increase in heteroallelic recombination or crossing over, Figure 2).
If continued DSB activity is the result of Ndt80 arrest, then why is the genetic consequence strongly observed in certain spo11 hypomorphs, but only minimally in WT? Two scenarios seem likely. In the first, DSBs are unregulated (occurring in all backgrounds), but the repair outcome is dependent on the state of synapsis. In synapsed chromatin, the repair would favor the sister (SC is inhibitory to interhomolog recombination) and in unsynapsed chromatin, interhomolog repair would be favored. For poorly synapsed mutants, Ndt80 arrest would result in a disproportionate increase in observable recombination (and consequently increased synapsis). This model, where stably paired and/or synapsed chromatin is protected in cis from additional interhomolog repair, has been previously suggested to account for observations in worms [54]. A second possibility has been suggested for mouse meiosis, where DSB formation may be limited within synapsed chromatin [55]. If DSB activity, rather than repair, is modulated, such that unsynapsed chromatin receives more DSBs than already synapsed chromatin, and the DSBs are repaired normally (in favor of inter-homolog repair), this would also disproportionately affect meioses with poor synapsis. In either case, how DSBs and their repair may be controlled gives insight into how the meiotic cell may ensure higher levels of pairing, SC formation and recombination in meiotically compromised cells.
Materials and Methods
Screen for non-null mutants
Mutants of SPO11 were generated by a degenerate PCR based method. First, the endogenous SPO11 gene from our strain background (BR1919-8B) was cloned and sequenced, and it was found to encode six altered amino acid changes compared to that reported for S288C (SGD), although it had the identical amino acid sequence to SK1, another strain often used to study meiosis. The sequence of the SPO11 gene contains a string of 12 As which can corrupt the integrity of its sequence during PCR amplification. To alleviate this problem, two As in the middle of the run were silently substituted with Gs (A225G, A228G). A centromere plasmid containing this functionally wild-type SPO11 gene and URA3 (pRS316:SPO11) was subjected to degenerate PCR amplification (GeneMorphII EZClone Domain Mutagenesis kit from Stratagene). Three independently mutagenized plasmid libraries were prepared and transformed into a spo11-null diploid yeast strain (BR4590) for screening (Table S6).
In order to identify non-null alleles of SPO11, assays for both prototrophs at the LEU2 and THR1 loci, and spore viability (CanR CyhR) were incorporated into the diploid yeast strain used for the screen (see Table S6). Using this strain, null mutants, after sporulation would form no or very few papillae on either the leucine or threonine omission medium or the drug-containing medium after sporulation. Both cold-sensitive and heat sensitive alleles were isolated by screening replicas sporulated at different temperatures (22° and 30°C).
Over 26,000 transformants were screened from the three independent mutagenized libraries. 10.8% of the screened transformants behaved as null mutants, indicating that the mutagenesis was successful. Those passing a second screening (52 mutants) were chosen for plasmid retrieval, sequencing and retesting by retransformation into BR4590. The mutations were distributed throughout the gene (Figure S1). Six mutants were isolated more than once and at least five of these were independent. Nine of the mutants encoded a single amino acid change, but we chose to include eight alleles with two amino acid changes and two with three changes in our analysis.
Genetic analysis
The sequenced alleles were subcloned into integrating vectors (pRS306) so that they could be transformed stably into yeast by pop in/pop out and studied as homozygotes. Crosses to generate the various strains utilized a marked SPO11::KAN (or SPO11::HYG or SPO11::NAT) allele to monitor the unmarked mutants. All strains for subsequent analysis are isogenic to BR1919-8B [3] and any markers were changed by transformation. Isogenic derivatives were used for the subsequent analysis (Figure 1A, BR5348 and it's spo11-m derivatives Table S1, S6).
For nineteen of the new mutants and one previously described (D290A [28]), arginine prototroph frequencies and map distances for three intervals on chromosome 3 were obtained from cultures sporulated at 18 and 22, and 31.5°C. Prototroph frequencies were averaged from at least three cultures and premeiotic frequencies were determined and subtracted. Map distance measurements in dyad spores are complicated by occasional reductional segregation and the fact that recessive phenotypes can be masked by the dominant allele. Map distances for chromosome 3 markers were determined by first sorting out all the phenotypic classes. Although several classes of events are hidden by heterozygosities in one spore, their sister spore would be scorable. Equal numbers of scorable genotypes were then subtracted from the hidden classes and added to the appropriate recombinant class. Then CO's are summed for each interval to provide map distances.
In a subset of mutants (spo11-32, 179 and 217) and WT, LEU2 heteroalleles were added to the strains to measure prototrophs at a second locus. The leu2-3,112 allele already exists in the strain background. To create a second allele, a haploid was first transformed to Leu+ and subsequently transformed to leu2-cla by pop-in pop-out transformation (R477: pBR322 with EcoRI/XhoI fragment of LEU2 where the ClaI site of LEU2 was filled in with Klenow). HIS4 and iHYG flank the LEU2 gene.
Strains for the sequence analysis were heterozygous for the spo11 alleles. The YJM789 strain is deleted for spo11 and constructed by transformation of ura3::NAT derivatives of the two haploids, S96 and YJM789 [37], with pRS306-spo11-32 and pRS306-spo11-217 (and subsequent popout). Zygotes were isolated and sporulated at various temperatures. Tetrads were used from the spo11-217 strain from dissections at 31.5°C (spore viability was 81%; 78/96) and 24°C (spore viability was 11%; 65/576) and from the spo11-32 diploid, tetrads were used from dissections at 30°C (spore viability 10%; 58/576 with only four 4-spore viable tetrads). Wild-type hybrid strains were examined for temperature effects by sporulation at 22°C, 26°C and 30°C. Wild-type sequences are stored at the National Center for Biotechnology Information Sequence Read Archive (Bioproject accession number SRP028549). Output files from Recombine, CrossOver and TractSeq are available from the Dryad Digital Depository: http://doi.org/10.5061/dryad.53t4c.
CO association analysis
The fraction of Arg prototrophs resulting from a CO was determined from analysis of random dyad spores. Flanking markers, THR1 (4 cM distal to arg4-Nsp) and iTRP1 (a marker placed near the centromere, 16 cM proximal to arg4-Bgl) were scored for nonparental segregation among Arg prototrophs. Since the most frequently converted allele is cis to the Trp+ marker, most of the Arg+ spores are Trp+ and the reciprocal recombinants are Thr−. The number of Trp+ Thr− recombinants were doubled to account for the inability to see the reciprocal event.
A similar assay for CO association was carried out on chromosome 3, utilizing LEU2 heteroalleles and using the hygromycin resistance marker at CEN3 and the distal marker, HIS4 as flanking markers (Figure 1A). The configuration of the LEU2 alleles and the flanking markers is best suited for detecting recombinants (leu2-cla converts ∼80% of the time and thus is flanked by both HygR and HIS4) Table S4.
CHEF gels
Plugs were prepared from meiotic cultures and subjected to CHEF gel analysis [29] and Southern hybridization with a probe from chromosome 3 sequences (THR4 region) prepared from random priming kit (Rediprime II, GE Healthcare) and analyzed on a Storm phosphorimager (GE Healthcare). The “fraction recombinant bands” was estimated by summing twice the intensity of the trimer band plus the dimer band over the total intensity of the three bands. The averages of five experiments are presented. For the DSB analysis, plugs were made, ran, and hybridized as above, but from sae2Δ versions of the mutants. Three gels were averaged.
Meiotic chromosome spreads
Meiotic chromosomes were spread according to Rockmill [56]. Cultures sporulating at 31.5°C were spread after 15 hours, those sporulating at 22°C were spread at 24 hours and those sporulating at 18°C were spread at 30 hours to maximize those cells with the most SC. Since sporulation in this strain background is not synchronous, Red1 staining was used to identify nuclei at a similar stage, mid prophase I. Red1 accumulates on the chromosomes from early in prophase and culminates at the stages where the SC formation is most abundant, and is lost by Meiosis I. SC is scored by visualizing the Zip1 protein by immunofluorescence. spo11 mutants often form an aggregate of Zip1 and other proteins called a polycomplex (PC). In our strain background WT does not normally form PCs. SC was scored among Red1 positive nuclei as follows: One or no Zip1 lines (the PC can appear linear) is “no SC”; Two or more Zip1 lines but fewer than complete SC is “some SC”; and Zip1 lines encompassing the entire nuclear region is “full SC”. Raw data is presented in Table S2.
Multiplex tetrad sequencing
DNA from four-spore viable tetrads was purified and processed for Illumina high-throughput sequencing. Illumina sequencing libraries were generated using adapters for multiplexing, as described [57]. In general, four barcoded libraries, one from each spore of an individual tetrad, were mixed in equimolar ratios and processed on an Illumina Genome Analyzer II. One tetrad was analyzed using a two-plex strategy. Each sequence read started with a 4-bp index followed by 32 bp from the sample. Raw sequencing data were first processed by Illumina's Casava pipeline. After barcode parsing, the remaining bases were aligned against the S96 and YJM789 genomes using ReadAligner [6]. Barcode sorting, alignment to reference genomes, genotyping and detection of recombination events were performed using a suite of programs included in ReCombine [6].
Determination of tract lengths from sequencing data
A pillar of our analysis rests on a stringent and accurate estimation of gene conversion tracts for CO's and NCO's among various tetrads. Again the ReCombine package was employed, with a few modifications. First, we examined marker calls consisting of SNPs and indels to ensure the use of high-quality heterologies and to remove markers that might be misannotated and thus assigned to the wrong parent genome. A “confusion matrix” was created by comparing quality scores against S96 and YJM789 genomes from sequenced S96 and YJM789 parental strains, an important metric during genotype calling. For example, from a sequenced S96 parent, if a SNP had a higher quality score for YJM789 than S96 or equal scores, this heterology would be classified incorrectly as an YJM SNP. This ambiguity would lead to false positives and incorrectly called events and tracts. The estimated error rate was 0.3% for SNPs and 29% for indels after a first-pass analysis; these markers were excluded. Nevertheless, some single marker events encompassed an indel with mixed reads that passed our first-pass thresholds. Sanger sequencing of genomic DNA from spores failed to validate 13 out of 14 such events. We limited our analysis to SNP marker calls given the higher genotyping errors found in indels.
Second, marker calls were made on a tetrad basis and on individual spores to increase the precision of tract length predictions. The ReCombine package determines events and tracts considering all four spores [6]. It excludes from analysis high-confidence heterologies that could not be called in any one of four spores in a tetrad, often due to reduced local sequencing depth (no sequence read spanning the SNP). Using as a template the recombination map generated by ReCombine, we confirmed these events in a separate single spore analysis. This approach better defined tract lengths, by extending tract lengths, adding better boundaries to existing tracts and increasing the number of heterologies defining a given event. Moreover, our strategy uncovered a handful of recombination events that were missed by tetrad-based analysis. Overall, tetrad-based and individual spore analyses gave very similar results.
Tract length boundaries were predicted using the individual spore procedure described above. The minimal tract length was defined by markers that are certain to be part of the gene conversion event, while the maximal tract length was defined by the next 2∶2 segregating flanking markers, before which the gene conversion tract must end. The difference between the maximal and minimal tract lengths is often large, leaving the actual tract length ambiguous. Rather than using a commonly used measure, such as the midpoint, we have developed an algorithm to better estimate the tract lengths, taking into account biologically relevant information such as enzymatic processivity and marker distribution asymmetry (Figure 4A). Processive enzymes have a probability “p” of moving to the next base, and a probability “1-p” of falling off, following a geometric distribution (or exponential law). Statistical approaches have been able to model gene conversion tracts from genetic data using a maximum likelihood approach, considering ressection as a succession of Bernoulli trials [58]. Assuming bidirectionality from an initiation site, tract lengths would then follow a log-normal distribution [58], [59]. In Figure S4 we show the results using unidirectional compared to bidirectional tract formation. From gene conversion data obtained by genetic means, enzymatic processivity parameter “p” has been estimated to be around 0.999 in flies, yeasts and mice, from a meta-analysis [59]. Sequencing data differ from genetic assays in the measurements of tract lengths. In genetic analyses, an initiation site, i.e. the position of a DSB hotspot, is often known, and gene conversion gradients are usually measured from one side, establishing tract lengths that may only reveal half the length. Whereas a conversion tract determined by sequencing consists of a central region of certainty (minimal tract length) flanked by regions of uncertainty (maximal tract length). We developed a novel analytical method, Tract-Seq, to estimate more accurately the lengths of gene conversion tract, or any marker-based estimation of enzymatic processivity from sequencing data, using Monte Carlo simulations (Figure 4A). For each iteration, the bidirectional enzymatic complex falls from the end of the minimal interval, using an exponential law decreasing away from the minimal tract on both sides of the interval. These are termed endpoints. Tracts extending past the maximal gene conversion interval were not considered as were those not extending past the minimal gene conversion interval. We assumed a similar probability “p” as the enzymatic processivity (0.999) [59]. Using p values of 0.9970 to 0.9993, showed indistinguishable trends in tract lengths, suggesting these trends are robust to slight perturbations of enzyme processivity. The estimated tract length was then represented by the sum of the following distances: endpoint 1 to minimal tract (start) + minimal tract + minimal tract (end) to endpoint 2. After a minimum of 10,000 iterations, the median length of the estimated tract was used for distribution fitting. Statistical analysis of the median of tracts was performed using a non-parametric resampling test.
For events that span a single marker, a minimal interval cannot be determined with this method. This is often the case in regions with low marker density. As an example, a maximal interval might be 20 kb while a minimal interval of 1 bp. In such cases, using the maximum likelihood estimation from geometric distribution with processivity “p” described above to fine-tune estimated tract lengths, intervals of similar length would be generated. Since these point events are common (∼15%), it would result in biases during distribution fitting. To circumvent this problem, we made an estimation of tract length for tracts defined by a single SNP. From the linear relationship between maximal tract lengths and tract lengths defined by multiple SNPs, we determine an approximation for the tract length for a single SNP tract based on its maximal tract length.
Distribution fitting
To ensure a better overall fit, tract lengths from COs and single tract NCOs were grouped by their levels of Spo11 activity: WT, HI and LO. Tracts from complex events, such as NCOs on two chromatids and NCOs associated with a CO, display longer tract lengths than regular COs and NCOs, and these types were treated separately (and SPO11 genotypes were pooled). Gene conversion tract lengths can be described by a log-normal distribution [58], [59] (see Text S1). Log-normal curves were fitted by a Bayesian analysis with Markov Chain Monte Carlo (MCMC), using the R package – rjags (JAGS, http://mcmc-jags.sourceforge.net/) to determine the mean and standard deviation of log normal distributions. We tested the goodness of fit using Kolmogorov-Smirnov tests and could not reject any fitted curves from tract length data points (P>0.05 in all cases). Significance in the differences of the means was tested using re-sampling by comparing actual means along with the corresponding error on the means obtained from MCMC iterations (sdmean), correcting these sdmean for sample size differences (i.e. different numbers of tract lengths (data points) used in the distribution fitting process).
Estimation of NCO loss due to inability to detect shorter conversion tracts
To estimate the percentage of NCOs that would be missed because of shorter conversions tracts, we distributed onto our SNP map, a wild-type number of NCO tracts that were sampled from the fitted tract length distributions for WT, HI and LO. The percentage of NCO tracts that span at least one SNP was recorded. The difference between the percentage detected in WT vs. HI and WT vs. LO estimates the change in NCO numbers due to detection issues.
Computational analysis of ARG4 prototroph formation from gene conversion tract distributions
Gene conversion tracts were generated from fitted CO and NCO log normal distributions for WT, HI and LO. Similarly, tracts were created for severely hypomorphic SPO11 mutants from log normal curves using inferred parameters, as described above. We assume that genome-wide averages hold for any individual site. Tracts originated from one of three DSB sites around the ARG4 locus, in proportions that parallel the frequency of DSBs found by Spo11 oligo sequencing [38]. A tract originating from one initiation site and of length falling between the Bgl and Nsp heteroalleles is classified as prototroph-forming (Figure 4A). DSB site 1, located downstream of ARG4, is the initiation site for 6% of simulated tracts, which form prototroph if they are 1544 to 2818 bp in length. DSB sites 2 and 3, upstream of ARG4, accounts for 53% and 41% of initiations [38] and tracts emanating from these sites can generate a prototroph if they are comprised between 204 and 1478 bp for DSB site 2, or between 2354 and 3628 bp for DSB site 3. Monte Carlo simulations were performed to record the average number of prototroph-forming events and its standard deviation for different classes of events emanating from one of three DSB sites. For each of 1,000 iterations, more than a million random tracts were generated from various CO and NCO log normal distributions, totaling more than a billion tracts considered per genotype. The number of prototroph-forming tracts was then adjusted to follow the number of various types of meiotic recombination events for SPO11 hypomorphs. The percentage of prototroph-forming tracts from NCOs and prototroph-forming tracts originating from a CO event were calculated. To determine the individual effect of the parameters used, we varied each parameter separately: biased usage of ARG4 hotspots, NCO/CO ratio and tract length variations (Figure S2).
Extrapolation of tract length distributions and meiotic recombination events for severely hypomorphic SPO11 mutants
Hypothetical mutants with 30, 10 and 3 COs were designated as highly hypomorphic, (for which four-spore viable tetrads could not be experimentally obtained). Number of COs with tracts was estimated at 71% from pooled WT, HI and LO tetrads. Assuming a linear decrease in the proportion of NCOs as Spo11 activity diminishes (CO homeostasis), the number of total NCO's was estimated at 5.5, 1.2 and 0.3 for mutants with 30, 10 and 3 CO's respectively, using a linear regression for the fraction of CO's in total events from tetrad sequencing data. To determine the fraction of “complex events” (i.e., NCOs that appear as two COs and GC associated with a CO on a chromatid not involving the CO), the average proportion across WT, HI and LO was used. Complex NCO events are 14% of total NCO events and each event consists of two distinct tracts. Similarly, 7% of total CO's include a conversion tract on a third chromatid. In analyses involving the absence of homeostasis, the number of NCO events was kept constant at the same fraction of total events as in WT.
Means and standard deviations of log normal CO and NCO distributions for simulated mutants were first inferred using linear models lm(mean ∼ #CO) and lm(sd ∼ #CO). Given that the CO association at ARG4 from in silico analysis did not follow the trend seen in genetic assays due to the overproduction of prototrophs from CO tracts, we performed non-linear regressions to increase the means of CO curves and obtained overall better fit compared to a simple linear regression. Specifically, the following non-linear models were used during extrapolation: lm(mean ∼ √#CO), lm(mean ∼ log(#CO)) and lm(mean ∼ 1/#CO). The latter one provided the best fit to genetic data for CO association and prototroph formation frequency at ARG4.
Supporting Information
Zdroje
1. KoehlerKE, HawleyRS, ShermanS, HassoldT (1996) Recombination and nondisjunction in humans and flies. Hum Mol Genet 5 Spec No: 1495–1504.
2. RossLO, MaxfieldR, DawsonD (1996) Exchanges are not equally able to enhance meiotic chromosome segregation in yeast. Proc Natl Acad Sci USA 93 : 4979–4983.
3. RockmillB, Voelkel-MeimanK, RoederGS (2006) Centromere-proximal crossovers are associated with precocious separation of sister chromatids during meiosis in Saccharomyces cerevisiae. Genetics 174 : 1745–1754 doi:10.1534/genetics.106.058933
4. Keeney S (2008) Genome dynamics and stability. Egel R, Lankenau D-H, editors Berlin, Heidelberg: Springer Berlin Heidelberg. 43 pp. doi:10.1007/7050_2007_026.
5. ManceraE, BourgonR, BrozziA, HuberW, SteinmetzLM (2008) High-resolution mapping of meiotic crossovers and non-crossovers in yeast. Nature 454 : 479–485 doi:10.1038/nature07135
6. AndersonCM, ChenSY, DimonMT, OkeA, DerisiJL, et al. (2011) ReCombine: A suite of programs for detection and analysis of meiotic recombination in whole-genome datasets. PLoS ONE 6: e25509 doi:10.1371/journal.pone.0025509
7. MartiniE, BordeV, LegendreM, AudicS, RegnaultB, et al. (2011) Genome-wide analysis of heteroduplex DNA in mismatch repair-deficient yeast cells reveals novel properties of meiotic recombination pathways. PLoS Genet 7: e1002305 doi:10.1371/journal.pgen.1002305
8. KeeneyS, GirouxCN, KlecknerN (1997) Meiosis-specific DNA double-strand breaks are catalyzed by Spo11, a member of a widely conserved protein family. Cell 88 : 375–384 doi:10.1016/S0092-8674(00)81876-0
9. RomanienkoPJ, Camerini-OteroRD (2000) The mouse SPO11 gene is required for meiotic chromosome synapsis. Mol Cell 6 : 975–987.
10. SymM, RoederGS (1994) Crossover interference is abolished in the absence of a synaptonemal complex protein. Cell 79 : 283–292.
11. TsubouchiT, RoederGS (2005) A synaptonemal complex protein promotes homology-independent centromere coupling. Science 308 : 870–873 doi:10.1126/science.1108283
12. MacQueenA, RoederG (2009) Fpr3 and Zip3 ensure that initiation of meiotic recombination precedes chromosome synapsis in budding yeast. Curr Biol 19 : 1519 doi: 10.1016/.cub.2009.08.048
13. TsubouchiT, MacqueenAJ, RoederGS (2008) Initiation of meiotic chromosome synapsis at centromeres in budding yeast. Genes Dev 22 : 3217–3226 doi:10.1101/gad.1709408
14. HendersonKA, KeeneyS (2004) Tying synaptonemal complex initiation to the formation and programmed repair of DNA double-strand breaks. Proc Natl Acad Sci USA 101 : 4519–4524 doi:10.1073/pnas.0400843101
15. MartiniE, DiazRL, HunterN, KeeneyS (2006) Crossover homeostasis in yeast meiosis. Cell 126 : 285–295 doi:10.1016/j.cell.2006.05.044
16. AllersT, LichtenM (2001) Differential timing and control of noncrossover and crossover recombination during meiosis. Cell 106 : 47–57.
17. ManceraE, BourgonR, HuberW, SteinmetzLM (2011) Genome-wide survey of post-meiotic segregation during yeast recombination. Genome Biol 12: R36 doi:10.1186/gb-2011-12-4-r36
18. ThackerD, LamI, KnopM, KeeneyS (2011) Exploiting spore-autonomous fluorescent protein expression to quantify meiotic chromosome behaviors in Saccharomyces cerevisiae. Genetics 189 (2) 423–39 doi:10.1534/genetics.111.131326
19. ChenSY, TsubouchiT, RockmillB, SandlerJS, RichardsDR, et al. (2008) Global analysis of the meiotic crossover landscape. Dev Cell 15 : 401–415 doi:10.1016/j.devcel.2008.07.006
20. RoigI, KeeneyS (2008) Probing meiotic recombination decisions. Dev Cell 15 : 331–332 doi:10.1016/j.devcel.2008.08.009
21. RosuS, LibudaDE, VilleneuveAM (2011) Robust crossover assurance and regulated interhomolog access maintain meiotic crossover number. Science 334 : 1286–1289 doi:10.1126/science.1212424
22. ColeF, KauppiL, LangeJ, RoigI, WangR, et al. (2012) Homeostatic control of recombination is implemented progressively in mouse meiosis. Nat Cell Biol 14 : 424–430 doi:10.1038/ncb2451
23. YokooR, ZawadzkiKA, NabeshimaK, DrakeM, ArurS, et al. (2012) COSA-1 reveals robust homeostasis and separable licensing and reinforcement steps governing meiotic crossovers. Cell 149 : 75–87 doi:10.1016/j.cell.2012.01.052
24. BortsRH, HaberJE (1987) Meiotic recombination in yeast: alteration by multiple heterozygosities. Science 237 : 1459–1465.
25. SymingtonLS, PetesTD (1988) Expansions and contractions of the genetic map relative to the physical map of yeast chromosome III. Mol Cell Biol 8 : 595–604.
26. YoudsJL, BoultonSJ (2011) The choice in meiosis - defining the factors that influence crossover or non-crossover formation. J Cell Sci 124 : 501–513 doi:10.1242/jcs.074427
27. MaloneRE, EspositoRE (1981) Recombinationless meiosis in Saccharomyces cerevisiae. Mol Cell Biol 1 : 891–901.
28. DiazRL, AlcidAD, BergerJM, KeeneyS (2002) Identification of residues in yeast Spo11p critical for meiotic DNA double-strand break formation. Mol Cell Biol 22 : 1106–1115.
29. GameJC, SitneyKC, CookVE, MortimerRK (1989) Use of a ring chromosome and pulsed-field gels to study interhomolog recombination, double-strand DNA breaks and sister-chromatid exchange in yeast. Genetics 123 : 695–713.
30. NishantKT, ChenC, ShinoharaM, ShinoharaA, AlaniE (2010) Genetic analysis of baker's yeast Msh4-Msh5 reveals a threshold crossover level for meiotic viability. PLoS Genet 6: e1083 doi:10.1371/journal.pgen.1001083
31. ChuaPR, RoederGS (1998) Zip2, a meiosis-specific protein required for the initiation of chromosome synapsis. Cell 93 : 349–359.
32. RockmillB, FungJC, BrandaSS, RoederGS (2003) The Sgs1 helicase regulates chromosome synapsis and meiotic crossing over. Curr Biol 13 : 1954–1962.
33. FungJC, RockmillB, OdellM, RoederGS (2004) Imposition of crossover interference through the nonrandom distribution of synapsis initiation complexes. Cell 116 : 795–802.
34. XuL, AjimuraM, PadmoreR, KleinC, KlecknerN (1995) NDT80, a meiosis-specific gene required for exit from pachytene in Saccharomyces cerevisiae. Mol Cell Biol 15 : 6572–6581.
35. ShusterEO, ByersB (1989) Pachytene arrest and other meiotic effects of the start mutations in Saccharomyces cerevisiae. Genetics 123 : 29–43.
36. BenjaminKR, ZhangC, ShokatKM, HerskowitzI (2003) Control of landmark events in meiosis by the CDK Cdc28 and the meiosis-specific kinase Ime2. Genes Dev 17 : 1524–1539 doi:10.1101/gad.1101503
37. WinzelerEA, RichardsDR, ConwayAR, GoldsteinAL, KalmanS, et al. (1998) Direct allelic variation scanning of the yeast genome. Science 281 : 1194–1197.
38. PanJ, SasakiM, KniewelR, MurakamiH, BlitzblauHG, et al. (2011) A hierarchical combination of factors shapes the genome-wide topography of yeast meiotic recombination initiation. Cell 144 : 719–731 doi:10.1016/j.cell.2011.02.009
39. RockmillB, RoederGS (1990) Meiosis in asynaptic yeast. Genetics 126 : 563–574.
40. NagDK, PataJD, SironiM, FloodDR, HartAM (2006) Both conserved and non-conserved regions of Spo11 are essential for meiotic recombination initiation in yeast. Mol Genet Genomics 276 : 313–321 doi:10.1007/s00438-006-0143-7
41. SharifWD, GlickGG, DavidsonMK, WahlsWP (2002) Distinct functions of S. pombe Rec12 (Spo11) protein and Rec12-dependent crossover recombination (chiasmata) in meiosis I; and a requirement for Rec12 in meiosis II. Cell Chromosome 1 : 1.
42. HodgsonA, TerentyevY, JohnsonRA, Bishop-BaileyA, AngevinT, et al. (2011) Mre11 and Exo1 contribute to the initiation and processivity of resection at meiotic double-strand breaks made independently of Spo11. DNA Repair (Amst) 10 : 138–148 doi:10.1016/j.dnarep.2010.11.008
43. PlugAW, PetersAH, KeeganKS, HoekstraMF, de BoerP, et al. (1998) Changes in protein composition of meiotic nodules during mammalian meiosis. J Cell Sci 111 (Pt 4) 413–423.
44. AgarwalS, RoederGS (2000) Zip3 provides a link between recombination enzymes and synaptonemal complex proteins. Cell 102 : 245–255.
45. NealeMJ, RamachandranM, Trelles-StickenE, ScherthanH, GoldmanASH (2002) Wild-type levels of Spo11-induced DSBs are required for normal single-strand resection during meiosis. Mol Cell 9 : 835–846.
46. JohnsonR, BordeV, NealeMJ, Bishop-BaileyA, NorthM, et al. (2007) Excess single-stranded DNA inhibits meiotic double-strand break repair. PLoS Genet 3: e223 doi:10.1371/journal.pgen.0030223
47. MalkovaA, RossL, DawsonD, HoekstraMF, HaberJE (1996) Meiotic recombination initiated by a double-strand break in rad50 delta yeast cells otherwise unable to initiate meiotic recombination. Genetics 143 : 741–754.
48. MalkovaA, KleinF, LeungWY, HaberJE (2000) HO endonuclease-induced recombination in yeast meiosis resembles Spo11-induced events. Proc Natl Acad Sci USA 97 : 14500–14505 doi:10.1073/pnas.97.26.14500
49. BörnerGV, KlecknerN, HunterN (2004) Crossover/noncrossover differentiation, synaptonemal complex formation, and regulatory surveillance at the leptotene/zygotene transition of meiosis. Cell 117 : 29–45.
50. JessopL, RockmillB, RoederGS, LichtenM (2006) Meiotic chromosome synapsis-promoting proteins antagonize the anti-crossover activity of Sgs1. PLoS Genet 2: e155 doi:10.1371/journal.pgen.0020155
51. ScherthanH, WangH, AdelfalkC, WhiteEJ, CowanC, et al. (2007) Chromosome mobility during meiotic prophase in Saccharomyces cerevisiae. Proc Natl Acad Sci USA 104 : 16934–16939 doi:10.1073/pnas.0704860104
52. GoldfarbT, LichtenM (2010) Frequent and efficient use of the sister chromatid for DNA double-strand break repair during budding yeast meiosis. PLoS Biol 8: e1000520 doi:10.1371/journal.pbio.1000520
53. KeeneyS (2001) Mechanism and control of meiotic recombination initiation. Curr Top Dev Biol 52 : 1–53.
54. ZhangW, MileyN, ZastrowMS, MacqueenAJ, SatoA, et al. (2012) HAL-2 promotes homologous pairing during Caenorhabditis elegans meiosis by antagonizing inhibitory effects of synaptonemal complex precursors. PLoS Genet 8: e1002880 doi:10.1371/journal.pgen.1002880
55. WojtaszL, DanielK, RoigI, Bolcun-FilasE, XuH, et al. (2009) Mouse HORMAD1 and HORMAD2, two conserved meiotic chromosomal proteins, are depleted from synapsed chromosome axes with the help of TRIP13 AAA-ATPase. PLoS Genet 5: e1000702 doi:10.1371/journal.pgen.1000702
56. RockmillB (2009) Chromosome spreading and immunofluorescence methods in Saccharomyes cerevisiae. Methods Mol Biol 558 : 3–13 doi:_10.1007/978-1-60761-103-5_1
57. LefrançoisP, EuskirchenGM, AuerbachRK, RozowskyJ, GibsonT, et al. (2009) Efficient yeast ChIP-Seq using multiplex short-read DNA sequencing. BMC Genomics 10 : 37 doi:10.1186/1471-2164-10-37
58. HillikerAJ, HarauzG, ReaumeAG, GrayM, ClarkSH, et al. (1994) Meiotic gene conversion tract length distribution within the rosy locus of Drosophila melanogaster. Genetics 137 : 1019–1026.
59. de MassyB (2003) Distribution of meiotic recombination sites. Trends Genet 19 : 514–522.
Štítky
Genetika Reprodukční medicínaČlánek vyšel v časopise
PLOS Genetics
2013 Číslo 10
- Kazuistika – Perspektivy využití precizované medicíny v rámci personalizované specifické terapie onkologických pacientů
- Nobelova cena za chemii pro genetické nůžky: Objev, který změní naši budoucnost?
- Technologie na bázi RNA v klinické praxi: od přebarvených petúnií k terapii vzácných a dosud jen obtížně léčitelných chorob u lidí
- „Nepředstavovali jsme si, že náš výzkum povede přímo ke vzniku nových léků, dokonce ještě za našeho života“
- Bezplatné služby pro diagnostiku ATTRv amyloidózy pro kardiology
Nejčtenější v tomto čísle
- A GDF5 Point Mutation Strikes Twice - Causing BDA1 and SYNS2
- Dominant Mutations in Identify the Mlh1-Pms1 Endonuclease Active Site and an Exonuclease 1-Independent Mismatch Repair Pathway
- Eleven Candidate Susceptibility Genes for Common Familial Colorectal Cancer
- The Histone H3 K27 Methyltransferase KMT6 Regulates Development and Expression of Secondary Metabolite Gene Clusters
Zvyšte si kvalifikaci online z pohodlí domova
Mazová zátka a její řešení
nový kurzVšechny kurzy