
Genome Wide Analysis Reveals Zic3 Interaction with Distal Regulatory Elements of Stage Specific Developmental Genes in Zebrafish
Zic3 regulates early embryonic patterning in vertebrates. Loss of Zic3 function is known to disrupt gastrulation, left-right patterning, and neurogenesis. However, molecular events downstream of this transcription factor are poorly characterized. Here we use the zebrafish as a model to study the developmental role of Zic3 in vivo, by applying a combination of two powerful genomics approaches – ChIP-seq and microarray. Besides confirming direct regulation of previously implicated Zic3 targets of the Nodal and canonical Wnt pathways, analysis of gastrula stage embryos uncovered a number of novel candidate target genes, among which were members of the non-canonical Wnt pathway and the neural pre-pattern genes. A similar analysis in zic3-expressing cells obtained by FACS at segmentation stage revealed a dramatic shift in Zic3 binding site locations and identified an entirely distinct set of target genes associated with later developmental functions such as neural development. We demonstrate cis-regulation of several of these target genes by Zic3 using in vivo enhancer assay. Analysis of Zic3 binding sites revealed a distribution biased towards distal intergenic regions, indicative of a long distance regulatory mechanism; some of these binding sites are highly conserved during evolution and act as functional enhancers. This demonstrated that Zic3 regulation of developmental genes is achieved predominantly through long distance regulatory mechanism and revealed that developmental transitions could be accompanied by dramatic changes in regulatory landscape.
Published in the journal:
. PLoS Genet 9(10): e32767. doi:10.1371/journal.pgen.1003852
Category:
Research Article
doi:
https://doi.org/10.1371/journal.pgen.1003852
Summary
Zic3 regulates early embryonic patterning in vertebrates. Loss of Zic3 function is known to disrupt gastrulation, left-right patterning, and neurogenesis. However, molecular events downstream of this transcription factor are poorly characterized. Here we use the zebrafish as a model to study the developmental role of Zic3 in vivo, by applying a combination of two powerful genomics approaches – ChIP-seq and microarray. Besides confirming direct regulation of previously implicated Zic3 targets of the Nodal and canonical Wnt pathways, analysis of gastrula stage embryos uncovered a number of novel candidate target genes, among which were members of the non-canonical Wnt pathway and the neural pre-pattern genes. A similar analysis in zic3-expressing cells obtained by FACS at segmentation stage revealed a dramatic shift in Zic3 binding site locations and identified an entirely distinct set of target genes associated with later developmental functions such as neural development. We demonstrate cis-regulation of several of these target genes by Zic3 using in vivo enhancer assay. Analysis of Zic3 binding sites revealed a distribution biased towards distal intergenic regions, indicative of a long distance regulatory mechanism; some of these binding sites are highly conserved during evolution and act as functional enhancers. This demonstrated that Zic3 regulation of developmental genes is achieved predominantly through long distance regulatory mechanism and revealed that developmental transitions could be accompanied by dramatic changes in regulatory landscape.
Introduction
Early embryonic patterning is achieved through a process involving the determination of body axes and defining which cell types develop at each coordinate. The Zic family of transcription factors (TFs) is involved in such process [1]–[4]. Zic genes are the vertebrate homologues of the odd-paired gene, which is involved in the generation of segmental body plan in the Drosophila embryo [5], [6]. Although functions of Zic proteins partially overlap, their loss-of-function cause distinct phenotypes, suggesting unique roles in development [7], [8].
Of particular interest is ZIC3, which is linked to the heritable defects of the left-right internal organs placement (situs inversus) in humans [9]. Studies in animal models reveal the involvement of Zic3 the establishment of left-right (L-R) asymmetry [1], [10]–[12]. In Xenopus, Zic3 established left-sided expression of Xnr1 and Pitx2 [12], two determinants of internal organs asymmetry [13]–[15]. However, zic3 is expressed symmetrically along the L-R axis in the Xenopus embryo and its loss-of-function (LOF) affects structures in which its expression was not detected [1], [12]. Results from several studies provided clues to the mechanism of L-R patterning by Zic3. First, Zic3 acts in organizer formation by inhibiting the canonical Wnt signaling pathway [16]. Second, Zic3 regulates gastrulation in mouse [1], [17]. Furthermore, studies in zebrafish revealed a correlation between convergence-extension (C-E) and L-R patterning defects in Zic3 LOF [10]. These suggest that Zic3 may regulate L-R patterning through its role in an earlier developmental event such as C-E.
Zic3 is one of the earliest TFs expressed in the neuroectoderm [3], [18]. Its expression is regulated by determinants of the early neural fate specification and dorsal-ventral (D-V) axis formation, including BMP, FGF, and Nodal signaling [3], [17], [19], [20]. The role of Zic3 in establishing neural cell fate was demonstrated through experiments in Xenopus, where its overexpression resulted in the expansion of the neuroectoderm and induction of neural and neural crest markers [18]. This led to the assumption that Zic3 activates the expression of proneural genes such as Achaete-scute homologs, Neurogenin, and NeuroD [2]. However, Zic3 lacks the ability to induce ectopic neuronal differentiation in the epidermis [18], which suggested the complex interaction between Zic3 and the proneural genes.
Increasing evidence has established the presence of long-distance interactions between TFs and their target genes [21]–[24]. This feature is especially true for TFs regulating specific functions outside of the core transcription machinery [25]–[27]. Therefore, an unbiased evaluation of binding sites throughout the whole genome would be a more comprehensive and biologically relevant method in the context of a developing organism. However, genomic approaches to study TFs in vivo are often limited by the quantity of available tissue sample. Furthermore, in mammalian systems, this problem is exacerbated by the short supply of embryos at early developmental stages. The zebrafish, with its unlimited supply of embryos and external development, substitutes for the inconveniences of a mammalian system. Its genome annotation is also the most complete among non-mammalian vertebrates and the expression of many genes are well-defined. This makes the zebrafish a robust model system for functional studies of vertebrate development.
To understand the developmental role of Zic3, we applied a genomic approach to identify genes directly regulated by Zic3. To capture genome-wide binding sites of Zic3, chromatin fragments bound by Zic3 were immunoprecipitated from gastrulating embryos at 8 hpf and zic3 expressing cells were sorted from transgenics [21], [28] at 24 hpf and sequenced in-depth using ChIP-seq methodology. This provided unbiased coverage of Zic3 binding events during the period of gastrulation and segmentation. We used microarray expression profiling to characterize changes at the transcription level as a result of Zic3 LOF during gastrulation. In addition, we compared gene expression profiles of zic3-positive and -negative cells at 24 hpf to identify genes co-expressed with zic3. Combining binding site analysis and expression data, we demonstrated that Nodal and Wnt pathways are the main downstream targets of Zic3 during gastrulation, and show distinct pathways regulated by Zic3 in the dorsal neural tube at the end of segmentation. Finally, in vivo enhancer assay validated selected binding sites as developmental enhancers. Our results provide novel insights into the molecular mechanism underlying Zic3 regulation of developmental events during gastrulation and neural development, which ultimately results in the L-R patterning and neural fate specification and patterning.
Results
Genome-wide identification of Zic3 binding sites using ChIP-seq
The earliest zic3 transcript was detected at 3 hpf (Fig. 1A,B), coinciding with the initiation of zygotic transcription during mid-blastula transition [29]. At 4 hpf zic3 expression is restricted to dorsal blastoderm (Fig. 1C,C′), and is subsequently found in the dorsal neuroectoderm and marginal blastomeres (Fig. 1D, D′). To capture genome-wide Zic3 binding profile during zebrafish gastrulation, we performed ChIP-seq analysis at 8 hpf, a time coinciding with the beginning of neurogenesis [30]. At this time zic3 is expressed largely in the dorsal neuroectoderm (prospective neural plate) and blastoderm margin (presumptive mesendoderm; Fig. 1E,E′; [3]). Hence, the interaction of Zic3 with its targets could be considered within a context of neural induction and mesendodermal development. Although neuroectoderm does not show any obvious morphological organization at this time, its anteroposterior patterning at the molecular level was shown by fate mapping studies [31] and in vitro explant assays [32], [33]. At 24 hpf zic3 is expressed in the brain and dorsal spinal cord (Fig. 1F,F′). To identify Zic3 binding sites specifically in zic3-expressing cells, we performed ChIP-seq using sorted cells from transgenic line SqET33 [28], [34] at this stage. Since gfp expression in this line faithfully recapitulates zic3 expression (Fig. 1G–H″), we considered GFP-positive cells as zic3-expressing cells and GFP-negative cells as non - zic3-expressing cells. However, it is worth to note that in SqET33 line at least one zic3-positive domain (presomitic mesoderm) does not express GFP. This suggests that a small fraction of non-neuronal zic3-expressing cells may be present in the GFP-negative pool of cells.

Sequencing of the 8 hpf ChIP sample generated 23,945,552 reads (11,037,221 or 46% were mapped to the zebrafish genome); the 24 hpf ChIP sample generated 23,083,504 reads (11,797,011 or 51% were mapped). We identified 3209 and 2088 Zic3 binding sites (hereafter referred to as peaks) with high significance value at 8 hpf (Table S13) and 24 hpf (Table S14), respectively. Interestingly, both datasets showed that only a small fraction (8.6% at 8 hpf and 4% at 24 hpf) of the peaks mapped to promoter regions (within 5 kb of transcription start site, TSS), while the rest were aligned to intragenic (26.8% at 8 hpf and 29% at 24 hpf) and intergenic (64.6% at 8 hpf and 67% at 24 hpf) regions (Fig. 2A). This suggested that Zic3 mainly acts via distal regulatory elements. To validate the ChIP-seq performance, we carried out quantitative PCR (qPCR) on randomly selected peaks from the 8 hpf dataset, five within promoter region and sixteen at regions outside of gene promoters. Taking a fold-change of 2 as a cutoff for positive enrichment, the qPCR analysis validated all but one peak tested (Table S1).

To determine the biological relevance of our data, we used the gene association rule ‘basal plus 100 kb extension’ according to GREAT algorithm [35] (Fig. 2B). Using this criterion, the number of peaks associated with either none, one, or two genes were evenly distributed in both 8 hpf and 24 hpf datasets (Fig. 2C). Distribution of the peaks relative to the TSS of genes associated with them showed strong bias towards regions beyond 5 kb of the TSS (Fig. 2D). In agreement with known Zic3 functions at 8 hpf [10], [16], [18], [36] functional categories enriched were embryonic morphogenesis, gastrulation, and dorsal/ventral pattern formation (2835 genes, Fig. 2F; Table S2). Enrichment was also observed for neural tissue-specific genes, predominantly expressed in the neuroectoderm at 8 hpf (Fig. 2G). In contrast, at 24 hpf, different categories were enriched (neural crest development and migration, nervous system development; Fig. 2H,I) in agreement with these events of neurodevelopment taking place at this stage [18], [37].
To identify the common regions bound by Zic3 as well as those unique to either developmental stage, we overlapped the 8 hpf and 24 hpf peaks (Fig. 2E). Taking the combined list of peaks from 8 hpf and 24 hpf, we performed clustering using ChIP-seq signals around the peaks. We found 937 regions bound by Zic3 at both stages (class I), 2729 regions bound only at 8 hpf (class II), and 1630 regions only at 24 hpf (class III). A clear distinction of functional categories was observed among genes associated with each individual class (Fig. S2), which reflect the shift of Zic3 function from regulating gastrulation at 8 hpf, to directing neurodevelopment at 24 hpf.
Identification of Zic3 consensus binding motif
To identify the consensus motif in Zic3-binding sites, we performed de novo motif search using sequences within 50 bp (total length 100 bp) of the top 1000 peaks summit. The highest scoring motif in both datasets consisted of a CAGCAG core (Fig. 3A) and was similar to that previously identified in mouse ES cells using ChIP-chip [38] (Fig. S3A) and Zic3 motif in UniPROBE database [39]. This motif occurred in 48.5% (1556/3209) of 8 hpf peaks and 54.3% (1134/2088) of 24 hpf peaks (Fig. 3B). This consensus motif was bound in a dose-dependent manner by a recombinant protein encompassing the Zic3 DNA binding domain (Zic3_ZF2-5; Fig. 3C). This binding was reduced upon introducing three-point mutations to the motif, confirming binding specificity. The mouse Zic3 recombinant protein mZic3-DBD-HisMBP [38] also recognized the consensus motif derived from the zebrafish genome (Fig. S3B), demonstrating cross-species conservation of Zic3 consensus motif. On the other hand, two other motifs enriched in the dataset to a lesser extent were not specifically recognized by Zic3_ZF2-5 recombinant protein (Fig. S3C). Enrichment of these motifs among the identified peaks might signify an indirect binding of Zic3 to these sequences through interaction with other TFs. Interestingly, Gli motif was found in both 8 hpf and 24 hpf datasets (273 peaks, 8.5% in 8 hpf; 203 peaks, 9.7% in 24 hpf; Fig. 3B). More than half of peaks containing Gli motifs also had an adjacent consensus Zic3 motif at both developmental stages, in support of interactions between Gli and Zic3 [40], [41].

Zic3 regulates target genes involved in early development
To identify Zic3 target genes during gastrulation and early neural development, we profiled the transcriptome of 8 hpf embryos after Zic3 morpholino (MO)-mediated knockdown. Embryos injected with the same MO dosage as in Cast et al. [10] exhibited similar gastrulation and convergent extension (C-E) defects (data not shown). However, to minimize the detection of non-direct targets in microarray, we injected the embryos with a lower dose of MO (1.7 ng in our experiments versus 7.5 ng in [10]) which did not cause visible morphological defects during gastrulation (refer to Methods section), but affected heart laterality and caused curvature of the A-P axis at later stages (Fig. 4A). These phenotypes were rescued by co-injection with Zic3 mRNA which, when injected alone, had little effect (Fig. 4B). This confirmed the specificity of the phenotypes caused by Zic3 MO injection.

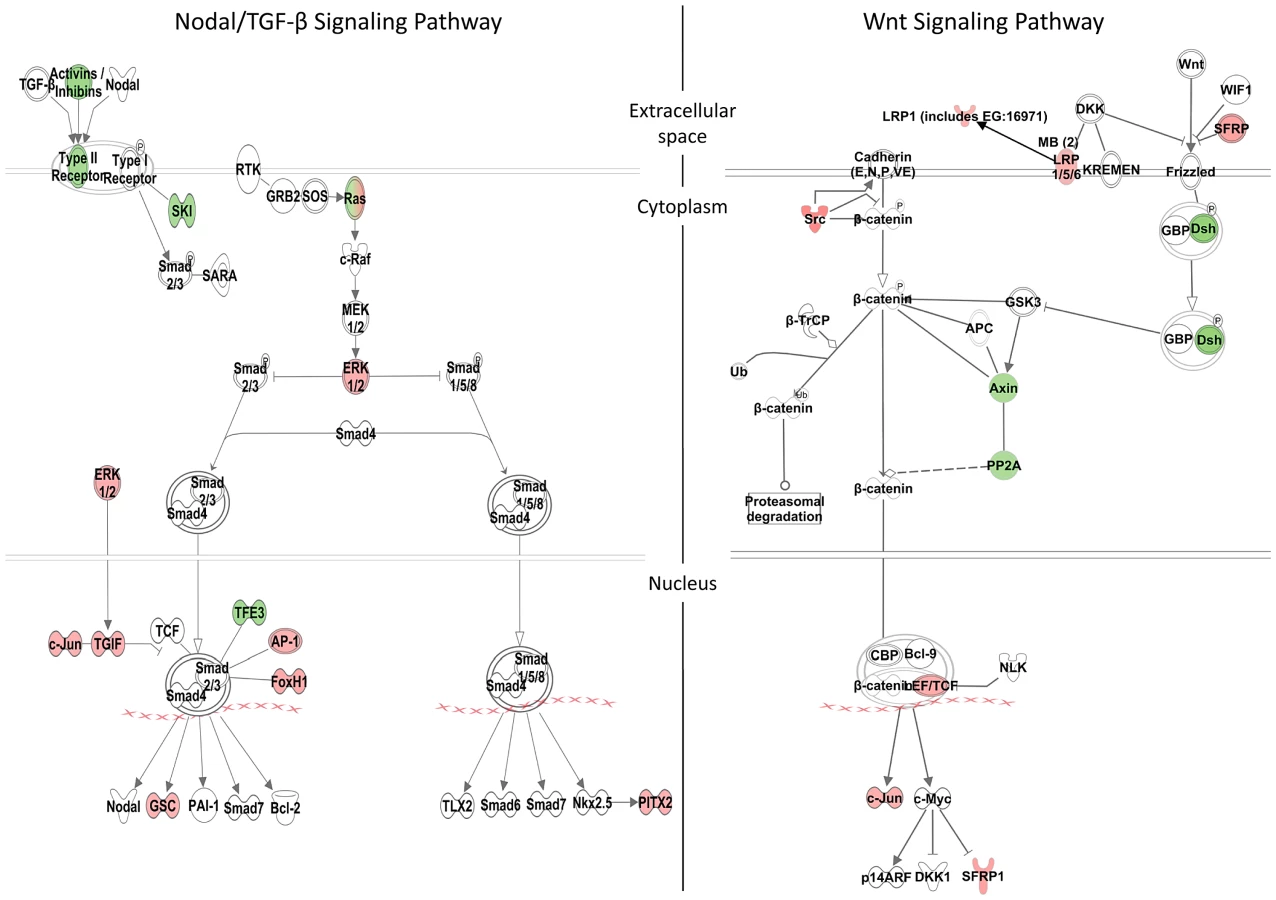
We identified 1316 genes differentially expressed in MO injected embryos (morphants, fold change >1.2; p≤0.05; Table S3). GO analysis revealed prominent enrichment in functions related to embryonic morphogenesis (Table S4). When the same or higher dose of MO (3.4 ng) was injected, the expression of several representative genes showed similar trend when measured by qPCR. This validated a possibility of their regulation by Zic3 (Fig. 4C; Table S7). We then determined the presence of Zic3 binding peaks within 100 kb of the TSS of these differentially expressed genes, which we defined as a selection criterion for Zic3 target gene. Based on this selection, 454 genes out of the total 1316 were identified as putative targets of Zic3 (Table S5 and Table S6). This set contains genes of the Nodal signaling pathway such as oep, lft1 and pitx2 (Fig. 5). While the presence of Zic3 binding in association with oep suggests direct regulation of Nodal pathway, the association of Zic3 peaks with lft1 and pitx2 suggests that Zic3 could also regulate the pathway through its modulators [42], [43]. These three genes, along with other members of this pathway not associated with Zic3 peaks (foxh1, bon, and gsc), were concurrently upregulated in Zic3 morphants (Fig. 4C; Table S3) suggesting negative regulation of the Nodal pathway by Zic3. Inhibition of Nodal signaling indicates suppression of endodermal fate [15], [44]–[46]. This correlated with broader expression of endodermal marker sox17a in 8 hpf Zic3 morphants (Fig. S4A). The inhibition of endodermal development by Zic3 is in line with previous observation in murine ES cells [38]. Similarly, peaks were associated with three genes of the canonical Wnt signaling pathway: axin1, jun, and vent (Table S5). In support of this association, microarray analysis revealed that the negative regulator of canonical Wnt pathway axin1 was downregulated in Zic3 morphants, while the downstream components jun and vent were upregulated (Fig. 5; Table S3). The expression of some other members of this pathway (axin2 and nlk1) without association with peaks has changed in Zic3 morphants based on microarray data. This implied that such genes could be the indirect targets of Zic3. Such observation provided further support for Zic3 regulation of the canonical Wnt pathway. The inhibition of canonical Wnt signaling by Zic3 was previously reported in frogs as a mechanism for organizer development [16]. Interestingly, Zic3 LOF only affected downstream components of these signaling pathways, and not the ligands, suggesting that at 8 hpf Zic3 is more likely to modulate the response to Wnt signaling in the target cells rather than initiation of signaling.
Apart from genes previously implicated as targets of Zic3, the combined ChIP-seq and microarray screen also identified novel candidates. Zic3 peaks were found in association with genes known to regulate cell proliferation in the neural plate, dlx4b and msxe [47], [48]. These genes perform a function [49], [50] similar to that of msxc, irx1a, and irx7, which do not have associated peaks but were nevertheless downregulated in Zic3 morphant (Table S3; S7). This observation suggests the role of Zic3 in promoting proliferation of neural progenitors at 8 hpf. Since these genes are known to inhibit neural differentiation, we assayed the expression of proneural gene neurog1 [51] in Zic3 morphants at 10 hpf. As expected, neurog1 was upregulated, in concert with the downregulation of her9 (Fig. 4C; Table S7), which provided further support for Zic3 role as a promoter of proliferation of neural progenitors and repressor of neural differentiation.
More interestingly, the novel candidate targets include members of the non-canonical Wnt signaling pathway (dvl2, rock2b and invs). These genes were co-expressed with zic3 during gastrulation (Fig. S5A, B) and were downregulated in the microarray (Table S3; Fig. 4C). One of the non-canonical Wnt pathways, the planar cell polarity (PCP), regulates convergence-extension (C-E) [52] and controls the positioning of the motile cilia [53]. The changes in expression of sox17, ntl, pax3a and sox19a mark correspondingly, endoderm, mesoderm, neural crest and neural plate. The broadening of their expression domains suggested that in Zic3 morphants C-E is affected (Fig. S4B–D, [10]). On the other hand, the disorganized expression of foxj1a and sox17a in the dorsal forerunner cells at an earlier stage indicated abnormalities of their migration in Zic3 morphants (Fig. S6), which may lead to abnormalities in L-R patterning. A correlation between C-E defects and L-R defects in Zic3 morphant was reported [14], suggesting Zic3 regulation of these events through the non-canonical Wnt pathway.
Several genes implicated in cell migration and polarity were among the targets. These include npy [54], ptenb [55], sepn1, srsf1a [56], and sparc [57], [58], all of which were downregulated in microarray and associated with peaks. WISH analysis showed that their expression overlap that of zic3 (Fig. S5C; ZFIN; University of Oregon, Eugene, OR 97403-5274; URL: http://zfin.org/; 21 June 2013). In addition, other genes with similar function, such as ccdc88a (probe generated from BC057440 which correspond to the annotated ccdc88a sequence) [59], [60] and tsg101 [58], were also downregulated in the microarray despite not having associated peaks. Hence the direct and indirect regulation of these genes by Zic3 could be the mechanism behind cell movements during gastrulation.
Zic3 regulates a distinct set of target genes and developmental processes at 24 hpf
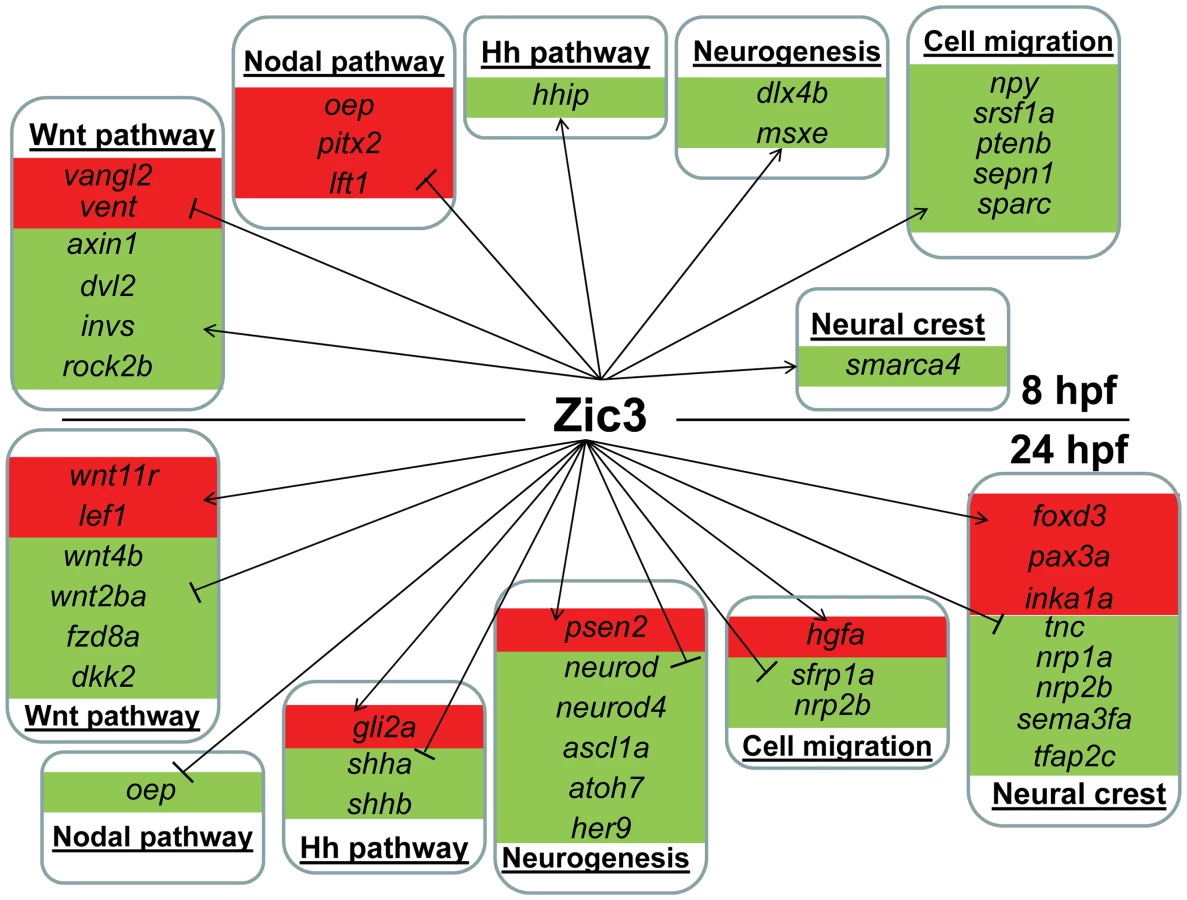
To identify potential zic3 targets during late neurogenesis, we performed microarray expression analysis on 24 hpf GFP-positive zic3 expressing cells that were FACS-sorted (Table S8). Comparing expression levels to a control dataset derived from GFP-negative cells (cells negative for zic3 expression), we identified genes enriched in GFP-positive cells (zic3-expressing cells). A total of 689 genes (p-value<0.05; fold change ≥1.5) were enriched in zic3-expressing cells (zic3-coexpressed genes). Among these genes were six members of the Zic family and other genes expressed in the dorsal neural tube. This confirmed the identity of the sorted cells as dorsal neural cells. Among the zic3-coexpressed genes, 167 had at least one peak within 100 kb of their TSS, rendering them putative Zic3 targets (Table S10). Similar to the 8 hpf stage, members of the Wnt pathway were also among the targets. However, Zic3 seems to regulate a different set of Wnt components, including wnt11r and lef1 (Fig. 6, Table S8). qRT-PCR revealed that wnt11r, were down-regulated in Zic3 morphants at 24 hpf (Fig. 4C; Table S7), confirming their positive regulation by Zic3. Two other genes encoding Wnt ligands, wnt10a and wnt10b, were co-expressed with zic3, and regulated upon Zic3 knockdown (Table S7; Fig. 4C) although they were not associated with peaks in ChIP-seq, suggesting that they may be indirect targets of Zic3. A striking difference between 8 hpf and 24 hpf regulatory landscape is apparent from the distinct functions associated with Zic3 target genes at each stage. For example, many genes regulating cell migration and polarity were identified as Zic3 targets at 8 hpf, whereas at 24 hpf neural crest determinants were found. The latter included foxd3, and pax3a which were further confirmed to be responsive to Zic3 knockdown (Fig. 4C, Table S7, S11).
On the other hand, in zic3-negative cells, 835 genes were enriched by at least 2-fold (non zic3-coexpressed genes enriched for endoderm and mesoderm-specific expression terms, Table S9). Among these, 195 had peaks within 100 kb of their TSS, suggesting repression of these genes in cells expressing zic3 (Table S10). Several proneural genes (neurod, neurod4, ascl1a) were found under this category, which may reflect that the zic3-expressing cells in the dorsal neural tube are not differentiating. Interestingly, the presence of a Zic3 peak in association with oep suggests that a similar inhibition of Nodal by Zic3 occurs at both 8 hpf and 24 hpf (Fig. 6).
Taken together, an entirely different set of candidate Zic3 target genes were found at 24 hpf compared to 8 hpf (Fig. 6). Although similar signaling pathways, such as the Wnt and Nodal pathways, were regulated by Zic3 at both developmental stages, different members of these pathways were targeted by this regulation at each stage. Furthermore, the global shift in Zic3 binding sites from 8 hpf to 24 hpf suggested the presence of complex regulatory changes accompanying developmental transitions.
Zic3 preferentially binds to distal regulatory elements and regulates developmental genes
The large number of Zic3 binding sites in the distant intergenic regions suggested that Zic3 may direct the expression of target genes by binding to the distal regulatory elements. In support of this idea, relevant biological categories could be observed among genes associated with peaks located outside of their basal regions of −5 kb to +1 kb of TSS (2716 genes; Table S2; Fig. S7A) or at a distance more than 50 kb (989 genes; Table S2; Fig. S7B). In contrast, no particular enrichment of GO categories could be observed for 119 genes associated with peaks in their basal region (Table S2). Of these, 77 had expression data in ZFIN (University of Oregon, Eugene, OR 97403-5274; URL: http://zfin.org/; 21 June 2013), but none of these were co-expressed with zic3 at 8 hpf, while only 6 (lppr3a, p2rx3b, lingo1b, myo15aa, robo4, gng3) had expression overlapping with zic3 at 24 hpf (not shown).
To test whether peaks associated with distal genes function as regulatory elements, we used the enhancer activity reporter assay [61]. We chose five distal peaks associated with genes from Nodal and Wnt signaling pathways, including oep (fragment 10-02, 94.7 kb downstream from TSS), axin1 (fragment 3-43, 71.53 kb downstream), lft1 (fragment 20-35, 29.77 kb downstream), dvl2 (fragment 7-214, 55.92 kb downstream), and invs (fragment 16-297, 78.08 kb downstream). A canonical Zic3 motif was present within 100 bp of each peak summit except for fragment 10-02. Only fragment 16-297, associated with invs, showed enhancer activity (Fig. 7B,C,G; Table S12). When the association region was extended to 500 kb, we found more peaks associated with dvl2 (fragment 7-211, 236.6 kb upstream), axin2 (fragment 3-56, 147.9 kb upstream), and pitx2 (fragment 14-37, 180.32 kb upstream). These peaks had at least one canonical Zic3 motif and exhibited positive enhancer activity (Fig. 7, Table S5, S12). Intriguingly, some of the expression patterns driven by the tested enhancers only partially matched that of the associated genes (fragments 14-37 and 3-56; Fig. 7D,E), which could be due to functional dependence on interaction of multiple regulatory elements [62], [63]. Nevertheless, the presence of Zic3-binding sites with an enhancer activity near genes responding to Zic3 LOF suggested that these genes were direct targets of Zic3.

To validate the activation of the enhancer fragments by Zic3, we co-injected fragment 7-211, which drove the strongest reporter gene expression at 8 hpf and 24 hpf (Fig. 7C), and Zic3 MO into the zebrafish embryo. When assayed by qRT-PCR at 8 hpf, a significant decrease in reporter expression in a MO dose-dependent matter was observed (Fig. S8). No reduction in reporter expression was observed when control MO was used. A similar result was obtained when two other fragments, 4-16 and 17-24 which coincided with CNEs (Tables 1, S12), were tested (Fig. S8), demonstrating Zic3-dependent induction of reporter expression through these fragments.

Conserved Zic3 binding sites act as enhancers
To study whether Zic3 binding sites were evolutionarily conserved, we overlapped the 8 hpf dataset with a list of known conserved non-coding elements (CNEs; ANCORA database) [64].We identified 228 peaks as CNEs conserved between zebrafish and Tetraodon, and 56 as CNEs conserved between zebrafish and humans (Fig. 8A), with 31 in common between the two groups. Similar to the distribution profile of the full set of peaks, these CNE peaks were mostly located outside of the basal promoter region (Fig. 8B). Genes associated with these CNEs were enriched for developmental functions and neural tissue-specific expression (Fig. 8C,D; Table S2).

Of 15 CNE peaks tested for enhancer activity, 11 (73%) drove gfp expression at either 8 hpf or 24 hpf, or both (Table 1). Of these eleven, eight drove higher gfp expression compared to the reporter vector alone at 8 hpf (fold change at least 1.5 compared to enhancer-less vector). Of these eight, four continuously drove reproducible tissue-specific gfp expression in various regions of the CNS up to 24 hpf (Fig. 8E–H), which overlapped with known expression domains of zic3 (Fig. 1F). Another three CNE peaks drove reporter expression only at 24 hpf. The CNE peaks with enhancer activity included the fragments 4-16 and 20-4, which drove expression in the brain, eye and trunk. In the hindbrain, both drove similar expression in neuroepithelial cells with radial morphology. In the trunk, activity of 4-16 was detected in muscle cells, whereas that of 20-4 was largely confined to the neural tube (Fig. 8E,F). The gfp expression pattern driven by 4-16 partially recapitulated that of a nearby gene, sox5. On the other hand, 20-4 was located in a gene desert region, suggesting long distance regulation. Fragment 15-26 drove gfp expression largely in cells along the neural tube (Fig. 8G), which partially recapitulated the expression of tbx2b nearby. Fragment 1-22 drove gfp expression mainly in the hindbrain region (Fig. 8H), which partially recapitulated that of the nearby mab21l2.
On the other hand, out of 12 non-CNE peaks tested only two (17%) drove higher gfp expression than the reporter vector alone at 8 hpf (Table 1). Together with the fragments corresponding to peaks associated with microarray-identified genes, out of 35 fragments tested for activity as enhancers, 17 (49%) were positive. Two thirds of the active peaks were previously identified as CNEs. Whereas this indicated somewhat better chance of finding enhancers amongst CNEs, it also suggested that a significant number of enhancers are not conserved in evolution.
Discussion
The majority of Zic3 binding sites were found outside promoter regions. While this could be partially attributed to the incomplete annotation of promoter regions in the zebrafish genome, the predominantly distal distribution of Zic3-binding sites revealed that Zic3 regulates transcription largely via distal regulatory elements. Such distribution of binding sites was previously observed in other genome-wide analyses of several TFs in cell culture or mammalian tissues [21], [22], [25], [65]. Our findings therefore establish that a similar distal regulatory mechanism is in effect within the context of Zic3 function during development in vivo.
Some of the Zic3 binding sites overlapped with CNEs, most of which drove expression in neural tissues. CNEs are known to regulate developmental genes [66]–[69]. However, in our dataset CNEs represented only 5% of the total Zic3 binding sites identified, while the majority was under weak evolutionary constraint. Tissue-specific enhancers have been shown to differ in the extent of evolutionary conservation of their sequence [70], [71]. Having only 5% overlap with CNEs, the set of Zic3-binding sites showed a similar trend. The lack of sequence conservation could be explained by the relaxation of selection pressure towards regulatory elements [72] owing to the genome duplication event in teleosts [73]–[75]. Given that at least for now the data available in zebrafish and mammals suggest that only a minority of sites are conserved in both classes of animals, other explanations should be considered. Detailed characterizations of other TFs in the zebrafish would provide a better understanding of the extent of conservation in regulatory regions in teleosts.
Cell culture studies have demonstrated interactions between multiple enhancer elements in regulating the transcription of a target gene [24], [62], [63], [76], [77], as well as interactions between a TF and different binding partners which can result in alternative transcriptional outputs [26], [78], [79]. Our results provide an insight of such complexity of transcriptional regulation by Zic3 in developmental context in vivo. For instance, the concurrent upregulation and downregulation of different subsets of direct target genes by Zic3 suggest that Zic3 binding can result in either activation or repression of target genes, and implies that additional mechanisms determine these two outcomes. Another facet of the data revealed distinct Zic3 binding profiles at 8 hpf and 24 hpf. The genes associated with binding events at these two stages showed relevant functional enrichments. This shift in binding was not dictated by a change in DNA recognition motif as almost identical dominant motifs were identified in both stages.
The combinatorial analysis of ChIP-seq and microarray datasets revealed an entirely distinct set of candidate Zic3 target genes at 8 hpf and 24 hpf. Whereas not totally unexpected, this analysis revealed some surprises. First, a developmental switch towards regulation of different members within the same signaling pathway was detected. In the context of Wnt signaling this shifted Zic3 impact from the intracellular part of Wnt signaling towards extracellular ligands in this pathway. Second, that cells expressing Zic3 show a reduced level of transcription of proneural genes placed an impact of Zic3 on cells that are in a state either before or after neural differentiation. Zic3 has been linked with pluripotency of stem cells in mammals [80]. Whereas it is less likely that Zic3 positively regulates the proneural genes at 24 hpf, at the same time this does not exclude a possibility that it could be involved in this process (as suggested [2]) during earlier stages. Taken together, these observations suggest that functional relationship between Zic3 and its target gene could not be deduced from a simple one-to-one interaction model. Factors, such as the presence of different subsets of interacting partners or accessibility of certain binding sites as dictated by chromatin states, in different spatiotemporal contexts may affect transcriptional output.
One implication of an interactive regulatory landscape is that genes targeted by a particular TF may not be determined by simply observing binding of the TF near its genomic locus. Additional proof, such as responsiveness of the particular target gene to LOF of the TF, would be necessary. In our data, there is a surplus of Zic3 binding events compared to those associated with responsive target genes. Widespread binding of TFs exceeding their known target genes have been reported in cell culture and in Drosophila [81]–[87] and is suggestive of non-functional binding. This may happen due to interaction of TFs with randomly occurring target sequences in the genome [78], [88]. The availability of expression data helps to identify candidate target genes within the vicinity of a TF binding event by providing additional functional cues. Nevertheless, given that TF-target genes interactions could occur over long distances [22], [89], [90], it is still possible that seemingly isolated Zic3 binding events with no responsive genes within a set distance criteria might actually be regulating a target located further away. Until a more detailed understanding of the architecture of genome-wide interactions have been achieved, this possibility could not be ruled out.
The highly interconnected TF regulatory network also necessitates a careful interpretation of enhancer function by reporter assays: while such assays can be useful to identify independently acting regulatory elements, evidence exists for regulatory elements acting in tandem, resulting in higher transcriptional output [24], [62], [63], [76], [77]. While other possibilities such as non-functional occupancy and repressive interactions could not be ruled out, the TF interaction model could account for the inactivity of several of the tested enhancers inferred from the reporter assay. The occurrence of Zic3 consensus motifs in close proximity to 50% of peaks containing Gli consensus motif supports this idea. Interestingly, the presence of Gli motifs does not seem to be specific to a particular developmental stage, as both 8 hpf and 24 hpf data show similar proportions of Zic3 peaks containing Gli motifs nearby. As in vitro data have demonstrated physical and functional interactions between Zic and Gli proteins [40], [41], such interaction, as well as interactions with other binding partners, may also occur in vivo in regulating transcription of target genes.
Our identification of novel target genes of Zic3 has improved an understanding of the mechanism by which Zic3 regulates development. These results demonstrated that Zic3 inhibits Nodal signaling (either directly or indirectly) which is implicated in mesendodermal specification [15], [44]–[46]. Similarly, Lim and colleagues [38] observed that murine ES cells acquired endodermal fate upon Zic3 knockdown, which supported an idea that Zic3 acts as an inhibitor of endodermal fate. Coincidentally, Nodal and Wnt signaling is known to regulate gastrulation [91]–[94]. Their regulation by Zic3 therefore may account for the gastrulation defect observed in Zic3 morphants. On the other hand, proper midline development during gastrulation is essential for proper L-R patterning [15], [95], [96]. Therefore, an involvement of Zic3 in regulating gastrulation through Nodal and canonical Wnt per se could have been sufficient to ensure a proper L-R asymmetry. However, our results suggested that Zic3 may also regulate the non-canonical Wnt (PCP) signaling pathway which is implicated in ciliogenesis. Interaction of these signaling pathways culminates in the establishment of a proper embryonic L-R axis [97]–[102]. Therefore, we could not rule out the possibility of direct involvement of Zic3 in later events specific to L-R patterning. In this context, it is noteworthy that mkks was also found as one of the Zic3 targets (Table S5) which is implicated in both L-R patterning and C-E movements during gastrulation through interaction with vangl2 [103]–[106]. Therefore, the regulation of non-canonical Wnt signaling by Zic3 could be at a core of developmental events linking C-E movement and L-R patterning [10].
Our finding that Zic3 regulates genes implicated in proliferation of neural progenitors agrees with the idea that Zic3 has properties of a stem cell factor [38], [80]. A mode of Zic3 regulation of genes responsible for the proliferation of neural progenitors reconciles the role of Zic3 in both early neuroectodermal specification and later events of neurogenesis. In essence, it establishes a particular role of Zic3 (and possibly other Zic family members) as an important regulator of proliferation of neural progenitors [7]. This model challenges previous assumptions that Zic3 induces the expression of proneural genes shown in overexpression studies [18], and suggests that an activation of proneural genes could be a downstream consequence of Zic3 regulation of proliferation of neural progenitor at an earlier stage of neurodevelopment. Given that neurog1 expression was upregulated upon Zic3 knockdown, and Zic3 binding sites were found near neurog1, as well as other proneural genes such as neurod4 and ncam1a, Zic3 may have an additional direct role in neural differentiation as its inhibitor. This possibility is also supported by the downregulation of her9. This places Zic3 within a regulatory landscape of Notch signaling in support of an early hypothesis based on functional analysis of Zic1 [107].
Materials and Methods
Zebrafish
Zebrafish of wild type (AB strain) and transgenic line SqET33 [28], [34] were maintained according to established protocols [108] following all the ethical practice recommended for fish maintenance. Embryos were staged according to standard morphological criteria [109].
Fluorescence-Activated Cell Sorting (FACS)
Dechorionated 24 hpf transgenic embryos were deyolked in PBS by pipetting through the 1 ml pipette tip. Cells were dissociated with trypsin solution (0.05% trypsin and 0.2 mM EDTA) in PBS for 15 min at room temperature. To facilitate dissociation of cells, embryos were pipetted through the 200 µl pipette tip. Trypsin was inhibited with complete protease inhibitor cocktail (Roche) and cell suspension was filtered through a nylon mesh (40 µm Cell Strainer, BD Falcon). Immediately, an equal volume of 4% paraformaldehyde (PFA) in PBS was added to cell suspension and cells were fixed for 10 min at room temperature. Reaction was stopped by an equal volume of ice-cold 0.25 M glycine in PBS, cells were washed three times with 0.125 M glycine-PBS and resuspended in the same buffer. Cell sorting was carried out with FACSAriaII Cell Sorter (BD Bioscience). To set autofluorescence level, cell sorter was calibrated with PFA-fixed GFP-negative cells before cell separation. GFP-positive and GFP-negative cells were collected in 0.125 M glycine-PBS, frozen in liquid nitrogen and kept at −80°C until use. For microarray analysis, PFA fixation step was omitted and cells were sorted into complete L-15 Leibovitz medium (Gibco) containing 20% fetal bovine serum.
ChIP-seq
Chromatin Immunoprecipitation (ChIP) was performed according to an established protocol (Wardle et al., 2006) with an addition of a deyolking step according to Link and colleagues (2006), with modifications (see Text S1). ChIP DNA was sequenced on the Illumina Genome Analyzer II (Illumina, USA). Detailed ChIP-seq methods are described in Supplementary information. Sequencing reads were mapped to the zebrafish Refseq genome assembly (Zv9), following which peak finding was performed using the QuEST algorithm [110] using the following parameters: bandwidth = 30 bp, region size = 600 bp, and FDR q-value<0.01. Peaks mapped to unassembled chromosomal contigs, centromeric regions, telomeric regions, segmental duplications and peaks consisting of >70% repeat sequence were removed. The ChIP-seq data have been deposited in the Gene Expression Omnibus database under the accession number GSE41458. To validate the ChIP-seq performance, we carried out quantitative PCR (qPCR) on randomly selected peaks, 5 within promoter region and 16 at regions outside of gene promoters. Taking a fold-change of 2 as a cutoff for positive enrichment, the qPCR analysis validated all but one peak tested (Table S1).The Database for Annotation, Visualization, and Integrated Discovery (DAVID) [111], [112] and Genomic Regions Enrichment of Annotations Tool (GREAT) [35] was used to find gene ontology-enriched terms. Overlapping of 8 hpf and 24 hpf ChIP-seq signals around peaks was performed within a region of +/−2 kb from each peak summit. Notice that some peak regions in 8 hpf dataset were not detected as peaks in 24 hpf dataset but they could be having sufficient amount of ChIP-seq tags at 24 hpf because of true binding by Zic3. Similarly there were regions detected as peaks in 24hpf samples and not detected in 8hpf but they may be bound by Zic3 in both samples and be having enriched ChIP-seq tag count in both. Hence ChIP-seq signal based clustering further clarified the status of detected peaks. Motif search was performed with MEME de novo motif finder [113]. From the top 1000 peaks by statistical significance, we extracted sequences comprising +/−50 bp from the summit of each peak. After finding the similarity of de novo motif from MEME with other published Zic3 motifs [39], [80], the quantification of occurrence of these motifs was done on all ChIP-seq peaks. For this the sequences within 400 bp from the peak summit were matched with PWM of motifs and the best matching score were calculated. After having the best matching score a threshold was used to determine the presence of motif. The PWM-matching threshold value for each motif was calculated using simulation such that when 10000 sequences were randomly designed to have probability similar to corresponding nucleotides in its PWM then 85% of those sequences could be detected. CNE peaks were identified by comparing the 8 hpf ChIP-seq dataset against a list of known CNEs in ANCORA database [64]. We performed the comparison to both human and Tetraodon CNE database to take into consideration the genome duplication event during teleosts evolution, which relaxed selection pressure on the conservation of important developmental enhancers [68], [72].The genomic coordinates of each peak summit were extended by 500 bp on each side and compared against the genomic coordinates of CNEs identified through comparison with either human hg19 or Tetraodon tetNig2 assemblies. A threshold of at least 70% sequence conservation within every 50 bp was used to define CNEs in each species.
Recombinant protein expression and EMSA
Two recombinant constructs of the zebrafish Zic3 protein were produced, the full-length protein (Zic3_ORF) and the DNA-binding domain encompassing Zn-fingers 2 to 5 (Zic3_ZF2-5, amino acid residues 273–391). DNA sequences corresponding to each domains were PCR-amplified using the following primers: Zic3_ORF: 5′-GGG GAC AAG TTT GTA CAA AAA AGC AGG CTT CGA AAA CCT GTA TTT TCA GGG CAG CTT ACG TGA AAT TGC G CTC-3′ and 5′-GGG GAC CAC TTT GTA CAA GAA AGC TGG GTT TAC TCC ACC TGA AAA CGG ACT TG-3′; Zic3_ZF2-5 : 5′-GGG GAC AAG TTT GTA CAA AAA AGC AGG CTT CGA AAA CCT GTA TTT TCA GGG CGC CTT CTT CAG ATA CAT GCG-3′ and 5′-GGG GAC CAC TTT GTA CAA GAA AGC TGG GTT TAT GAT TCG TGT ACC TTC ATA TG-3′. Each forward and reverse primer contained an attB recombination site overhang, with an additional Tobacco Etch Virus (TEV) protease cleavage site in the forward primer preceding the N-terminal Zic3 coding sequence. Protein expression and purification was performed as previously described (Lim et al., 2010). Electrophoretic mobility shift assay (EMSA) was performed as previously described [38]. Briefly, Cy5-labeled oligonucleotide pairs (1st BASE, Singapore) were annealed by heating to 95°C for 5 minutes in annealing buffer (500 mM MgCl2; 500 mM KCl; 200 mM Tris-HCl, pH 8.0) and left in room temperature to cool down overnight. These were subsequently incubated with the recombinant Zic3 in EMSA buffer (10 mM Tris, pH 8.0; 0.1 mg/ml BSA; 50 µM ZnCl2; 100 mM KCL; 0.5 mM MgCl2; 10% glycerol, 0.1% SDS; 2 mM β-mercaptoethanol) for 1 hour at 4°C. The reaction was subsequently run on 5% native Tris-Glycine polyacrylamide gel electrophoresis. Gel was scanned in Typhoon Scanner (GE Healthcare, USA). The affinity of protein to DNA was determined by titrating 0–250 nM of protein against 1 nM of annealed probes.
Morpholino injection and rescue
Zic3 knockdown was performed using a translation-blocking antisense morpholino oligonucleotide (MO) purchased from Gene Tools, LLC (USA). The MO sequence was 5′-AGG TTA GTG GAG TGA ACG GGT ACC G-3′. A standard control antisense MO was also obtained from Gene Tools, LLC with the following sequence 5′-CCT CTT ACC TCA GTT ACA ATT TAT A-3′. For microarray, 1.7 ng Zic3 MO was injected into 1-cell stage embryos. Rescue was performed using 20 pg of zic3 mRNA without morpholino-binding site. Capped zic3 mRNA was synthesized using mMessage mMachine Kit (Ambion, USA). Results were obtained from at least three different experiments on embryos from random pairs.
Microarray hybridization and data analysis
For gene expression profiling, custom made zebrafish oligonucleotide microarray (Agilent Technologies; GIS V2 with some modifications) containing 44,000 oligonucleotide probes (60 mer long; including positive and negative controls designed by Agilent and beta-actin controls) was used. The microarray was performed according to Agilent's One-Color Microarray Based Gene Expression Analysis (Quick Amp Labeling) protocol (Version 5.7, March 2008) and RNA Spike-In-One Color. Arrays were probed using cDNAs reverse transcribed in the presence of Cy3-dUTP using 600 ng of total RNA from either wild-type control or Zic3 knockdown embryos (8 hpf), or from either non zic3-expressing cells or zic3-expressing cells (24 hpf). Labeled cDNA was denatured and hybridized at 42°C for 16 h in a hybridization oven (Agilent Technologies, USA). After hybridization, the slides were washed and scanned for fluorescence detection on Agilent DNA Microarray Scanner. Scanned images were analyzed using Agilent Feature Extraction Software (v10.5.1.1). Feature extracted data were analyzed in Genespring software (Agilent Technologies, USA). Statistically significant gene expression was identified using Significance Analysis of Microarrays (SAM 3.05) for each successive time point [114]. Threshold values were set as follows: q-value<0.8, predicted false discovery rate (FDR)<0.05%. Genes were annotated using the “Unigene & Gene Ontology Annotation Tool” available at GIS site (http://123.136.65.67/). Genes were subjected to pathway assembly using Ingenuity Pathway Analysis (IPA; http://www.ingenuity.com). Selected genes (Fig. 4C; Table S7) were validated using real time RT-PCR (qRT-PCR) by assessing their expression level changes in embryos injected with higher dose of morpholino (3.4 ng) to show similar trend with microarray regulation.
Enhancer activity assay
Tested genomic regions encompassing the peaks with ∼200 bp flanking sequence at each side were amplified using PCR (primer list in Additional file 5) and cloned into SalI and BamHI sites of the pTol2-GFP reporter vector containing a minimal promoter from the mouse cFos gene [115]. Transposase mRNA was synthesized using mMESSAGE mMACHINE T3 Kit (Ambion, USA) and purified using RNeasy Mini Kit (QIAGEN, Germany). A total of 20 pg of the circular reporter plasmid and 50 pg of transposase mRNA were co-injected into 1–2-cell stage embryos. For each construct, two batches of at least 100 embryos were injected and assayed for egfp expression at 24 hpf. A consistent egfp expression pattern observed in at least 20% of injected embryos was considered as positive. The reporter vector alone showed expression in muscles and blood cells in G0 embryos (data not shown). Embryos positive for egfp expression were subsequently processed for whole mount immunohistochemistry (IHC) with anti-GFP antibody. qPCR was used to determine egfp expression level at 8 hpf since morphological identification of tissue specificity at this stage was difficult.
Supporting Information
Zdroje
1. WareSM, HarutyunyanKG, BelmontJW (2006) Zic3 is critical for early embryonic patterning during gastrulation. Dev Dyn 235 : 776–785.
2. ArugaJ (2004) The role of Zic genes in neural development. Mol Cell Neurosci 26 : 205–221.
3. GrinblatY, SiveH (2001) zic Gene expression marks anteroposterior pattern in the presumptive neurectoderm of the zebrafish gastrula. Dev Dyn 222 : 688–693.
4. NagaiT, ArugaJ, TakadaS, GuntherT, SporleR, et al. (1997) The expression of the mouse Zic1, Zic2, and Zic3 gene suggests an essential role for Zic genes in body pattern formation. Dev Biol 182 : 299–313.
5. ArugaJ, NagaiT, TokuyamaT, HayashizakiY, OkazakiY, et al. (1996) The mouse zic gene family. Homologues of the Drosophila pair-rule gene odd-paired. J Biol Chem 271 : 1043–1047.
6. BenedykMJ, MullenJR, DiNardoS (1994) odd-paired: a zinc finger pair-rule protein required for the timely activation of engrailed and wingless in Drosophila embryos. Genes Dev 8 : 105–117.
7. MerzdorfCS (2007) Emerging roles for zic genes in early development. Dev Dyn 236 : 922–940.
8. GrinbergI, MillenKJ (2005) The ZIC gene family in development and disease. Clin Genet 67 : 290–296.
9. GebbiaM, FerreroGB, PiliaG, BassiMT, AylsworthA, et al. (1997) X-linked situs abnormalities result from mutations in ZIC3. Nat Genet 17 : 305–308.
10. CastAE, GaoC, AmackJD, WareSM (2012) An essential and highly conserved role for Zic3 in left-right patterning, gastrulation and convergent extension morphogenesis. Dev Biol 364 : 22–31.
11. KitaguchiT, MizugishiK, HatayamaM, ArugaJ, MikoshibaK (2002) Xenopus Brachyury regulates mesodermal expression of Zic3, a gene controlling left-right asymmetry. Dev Growth Differ 44 : 55–61.
12. KitaguchiT, NagaiT, NakataK, ArugaJ, MikoshibaK (2000) Zic3 is involved in the left-right specification of the Xenopus embryo. Development 127 : 4787–4795.
13. CampioneM, SteinbeisserH, SchweickertA, DeisslerK, van BebberF, et al. (1999) The homeobox gene Pitx2: mediator of asymmetric left-right signaling in vertebrate heart and gut looping. Development 126 : 1225–1234.
14. RyanAK, BlumbergB, Rodriguez-EstebanC, Yonei-TamuraS, TamuraK, et al. (1998) Pitx2 determines left-right asymmetry of internal organs in vertebrates. Nature 394 : 545–551.
15. SampathK, RubinsteinAL, ChengAM, LiangJO, FekanyK, et al. (1998) Induction of the zebrafish ventral brain and floorplate requires cyclops/nodal signalling. Nature 395 : 185–189.
16. FujimiTJ, HatayamaM, ArugaJ (2012) Xenopus Zic3 controls notochord and organizer development through suppression of the Wnt/beta-catenin signaling pathway. Dev Biol 361 : 220–231.
17. PurandareSM, WareSM, KwanKM, GebbiaM, BassiMT, et al. (2002) A complex syndrome of left-right axis, central nervous system and axial skeleton defects in Zic3 mutant mice. Development 129 : 2293–2302.
18. NakataK, NagaiT, ArugaJ, MikoshibaK (1997) Xenopus Zic3, a primary regulator both in neural and neural crest development. Proc Natl Acad Sci U S A 94 : 11980–11985.
19. MarchalL, LuxardiG, ThomeV, KodjabachianL (2009) BMP inhibition initiates neural induction via FGF signaling and Zic genes. Proc Natl Acad Sci U S A 106 : 17437–17442.
20. WeberJR, SokolSY (2003) Identification of a phylogenetically conserved activin-responsive enhancer in the Zic3 gene. Mech Dev 120 : 955–964.
21. ENCODE Project Consortium (2004) The ENCODE (ENCyclopedia Of DNA Elements) Project. Science 306 : 636–640.
22. SanyalA, LajoieBR, JainG, DekkerJ (2012) The long-range interaction landscape of gene promoters. Nature 489 : 109–113.
23. FarnhamPJ (2009) Insights from genomic profiling of transcription factors. Nat Rev Genet 10 : 605–616.
24. SpitzF, FurlongEE (2012) Transcription factors: from enhancer binding to developmental control. Nat Rev Genet 13 : 613–626.
25. WederellED, BilenkyM, CullumR, ThiessenN, DagpinarM, et al. (2008) Global analysis of in vivo Foxa2-binding sites in mouse adult liver using massively parallel sequencing. Nucleic Acids Res 36 : 4549–4564.
26. ChenX, XuH, YuanP, FangF, HussM, et al. (2008) Integration of external signaling pathways with the core transcriptional network in embryonic stem cells. Cell 133 : 1106–1117.
27. CarrollJS, LiuXS, BrodskyAS, LiW, MeyerCA, et al. (2005) Chromosome-wide mapping of estrogen receptor binding reveals long-range regulation requiring the forkhead protein FoxA1. Cell 122 : 33–43.
28. ParinovS, KondrichinI, KorzhV, EmelyanovA (2004) Tol2 transposon-mediated enhancer trap to identify developmentally regulated zebrafish genes in vivo. Dev Dyn 231 : 449–459.
29. AanesH, WinataCL, LinCH, ChenJP, SrinivasanKG, et al. (2011) Zebrafish mRNA sequencing deciphers novelties in transcriptome dynamics during maternal to zygotic transition. Genome Res 21 : 1328–1338.
30. SchmitzB, PapanC, Campos-OrtegaJA (1993) Neurulation in the anterior trunk region of the zebrafish Brachydanio rerio. Roux's Arch Dev Biol 202 : 250–259.
31. WooK, FraserSE (1995) Order and coherence in the fate map of the zebrafish nervous system. Development 121 : 2595–2609.
32. GrinblatY, GamseJ, PatelM, SiveH (1998) Determination of the zebrafish forebrain: induction and patterning. Development 125 : 4403–4416.
33. SagerstromCG, GrinbaltY, SiveH (1996) Anteroposterior patterning in the zebrafish, Danio rerio: an explant assay reveals inductive and suppressive cell interactions. Development 122 : 1873–1883.
34. KondrychynI, Garcia-LeceaM, EmelyanovA, ParinovS, KorzhV (2009) Genome-wide analysis of Tol2 transposon reintegration in zebrafish. BMC Genomics 10 : 418.
35. McLeanCY, BristorD, HillerM, ClarkeSL, SchaarBT, et al. (2010) GREAT improves functional interpretation of cis-regulatory regions. Nat Biotechnol 28 : 495–501.
36. ArugaJ, MikoshibaK (2011) Role of BMP, FGF, calcium signaling, and Zic proteins in vertebrate neuroectodermal differentiation. Neurochem Res 36 : 1286–1292.
37. AppelB (2000) Zebrafish neural induction and patterning. Dev Dyn 219 : 155–168.
38. LimLS, HongFH, KunarsoG, StantonLW (2010) The pluripotency regulator Zic3 is a direct activator of the Nanog promoter in ESCs. Stem Cells 28 : 1961–1969.
39. NewburgerDE, BulykML (2009) UniPROBE: an online database of protein binding microarray data on protein-DNA interactions. Nucleic Acids Res 37: D77–82.
40. MizugishiK, ArugaJ, NakataK, MikoshibaK (2001) Molecular properties of Zic proteins as transcriptional regulators and their relationship to GLI proteins. J Biol Chem 276 : 2180–2188.
41. KoyabuY, NakataK, MizugishiK, ArugaJ, MikoshibaK (2001) Physical and functional interactions between Zic and Gli proteins. J Biol Chem 276 : 6889–6892.
42. ThisseC, ThisseB (1999) Antivin, a novel and divergent member of the TGFbeta superfamily, negatively regulates mesoderm induction. Development 126 : 229–240.
43. FaucourtM, HoulistonE, BesnardeauL, KimelmanD, LepageT (2001) The pitx2 homeobox protein is required early for endoderm formation and nodal signaling. Dev Biol 229 : 287–306.
44. FeldmanB, DouganST, SchierAF, TalbotWS (2000) Nodal-related signals establish mesendodermal fate and trunk neural identity in zebrafish. Curr Biol 10 : 531–534.
45. FeldmanB, GatesMA, EganES, DouganST, RennebeckG, et al. (1998) Zebrafish organizer development and germ-layer formation require nodal-related signals. Nature 395 : 181–185.
46. BisgroveBW, EssnerJJ, YostHJ (1999) Regulation of midline development by antagonism of lefty and nodal signaling. Development 126 : 3253–3262.
47. EkkerM, AkimenkoMA, AllendeML, SmithR, DrouinG, et al. (1997) Relationships among msx gene structure and function in zebrafish and other vertebrates. Mol Biol Evol 14 : 1008–1022.
48. WodaJM, PastagiaJ, MercolaM, ArtingerKB (2003) Dlx proteins position the neural plate border and determine adjacent cell fates. Development 130 : 331–342.
49. de la Calle-MustienesE, GlavicA, ModolellJ, Gomez-SkarmetaJL (2002) Xiro homeoproteins coordinate cell cycle exit and primary neuron formation by upregulating neuronal-fate repressors and downregulating the cell-cycle inhibitor XGadd45-gamma. Mech Dev 119 : 69–80.
50. LecaudeyV, AnselmeI, DildropR, RutherU, Schneider-MaunouryS (2005) Expression of the zebrafish Iroquois genes during early nervous system formation and patterning. J Comp Neurol 492 : 289–302.
51. KorzhV, SleptsovaI, LiaoJ, HeJ, GongZ (1998) Expression of zebrafish bHLH genes ngn1 and nrd defines distinct stages of neural differentiation. Dev Dyn 213 : 92–104.
52. WallingfordJB, HarlandRM (2002) Neural tube closure requires Dishevelled-dependent convergent extension of the midline. Development 129 : 5815–5825.
53. SongH, HuJ, ChenW, ElliottG, AndreP, et al. (2010) Planar cell polarity breaks bilateral symmetry by controlling ciliary positioning. Nature 466 : 378–382.
54. ThirietN, AgasseF, NicoleauC, GueganC, ValletteF, et al. (2011) NPY promotes chemokinesis and neurogenesis in the rat subventricular zone. J Neurochem 116 : 1018–1027.
55. YehCM, LiuYC, ChangCJ, LaiSL, HsiaoCD, et al. (2011) Ptenb mediates gastrulation cell movements via Cdc42/AKT1 in zebrafish. PLoS One 6: e18702.
56. GhignaC, GiordanoS, ShenH, BenvenutoF, CastiglioniF, et al. (2005) Cell motility is controlled by SF2/ASF through alternative splicing of the Ron protooncogene. Mol Cell 20 : 881–890.
57. SeuxM, PeugetS, MonteroMP, SiretC, RigotV, et al. (2011) TP53INP1 decreases pancreatic cancer cell migration by regulating SPARC expression. Oncogene 30 : 3049–3061.
58. GilbertMM, RobinsonBS, MobergKH (2009) Functional interactions between the erupted/tsg101 growth suppressor gene and the DaPKC and rbf1 genes in Drosophila imaginal disc tumors. PLoS One 4: e7039.
59. WangY, KanekoN, AsaiN, EnomotoA, Isotani-SakakibaraM, et al. (2011) Girdin is an intrinsic regulator of neuroblast chain migration in the rostral migratory stream of the postnatal brain. J Neurosci 31 : 8109–8122.
60. OharaK, EnomotoA, KatoT, HashimotoT, Isotani-SakakibaraM, et al. (2012) Involvement of Girdin in the determination of cell polarity during cell migration. PLoS One 7: e36681.
61. FisherS, GriceEA, VintonRM, BesslingSL, UrasakiA, et al. (2006) Evaluating the biological relevance of putative enhancers using Tol2 transposon-mediated transgenesis in zebrafish. Nat Protoc 1 : 1297–1305.
62. LiG, RuanX, AuerbachRK, SandhuKS, ZhengM, et al. (2012) Extensive promoter-centered chromatin interactions provide a topological basis for transcription regulation. Cell 148 : 84–98.
63. TenaJJ, AlonsoME, de la Calle-MustienesE, SplinterE, de LaatW, et al. (2011) An evolutionarily conserved three-dimensional structure in the vertebrate Irx clusters facilitates enhancer sharing and coregulation. Nat Commun 2 : 310.
64. EngstromPG, FredmanD, LenhardB (2008) Ancora: a web resource for exploring highly conserved noncoding elements and their association with developmental regulatory genes. Genome Biol 9: R34.
65. CawleyS, BekiranovS, NgHH, KapranovP, SekingerEA, et al. (2004) Unbiased mapping of transcription factor binding sites along human chromosomes 21 and 22 points to widespread regulation of noncoding RNAs. Cell 116 : 499–509.
66. SandelinA, BaileyP, BruceS, EngstromPG, KlosJM, et al. (2004) Arrays of ultraconserved non-coding regions span the loci of key developmental genes in vertebrate genomes. BMC Genomics 5 : 99.
67. WoolfeA, GoodsonM, GoodeDK, SnellP, McEwenGK, et al. (2005) Highly conserved non-coding sequences are associated with vertebrate development. PLoS Biol 3: e7.
68. VenkateshB, KirknessEF, LohYH, HalpernAL, LeeAP, et al. (2006) Ancient noncoding elements conserved in the human genome. Science 314 : 1892.
69. BejeranoG, PheasantM, MakuninI, StephenS, KentWJ, et al. (2004) Ultraconserved elements in the human genome. Science 304 : 1321–1325.
70. BlowMJ, McCulleyDJ, LiZ, ZhangT, AkiyamaJA, et al. (2010) ChIP-Seq identification of weakly conserved heart enhancers. Nat Genet 42 : 806–810.
71. SchmidtD, WilsonMD, BallesterB, SchwaliePC, BrownGD, et al. (2010) Five-vertebrate ChIP-seq reveals the evolutionary dynamics of transcription factor binding. Science 328 : 1036–1040.
72. LeeAP, KerkSY, TanYY, BrennerS, VenkateshB (2011) Ancient vertebrate conserved noncoding elements have been evolving rapidly in teleost fishes. Mol Biol Evol 28 : 1205–1215.
73. ChristoffelsA, KohEG, ChiaJM, BrennerS, AparicioS, et al. (2004) Fugu genome analysis provides evidence for a whole-genome duplication early during the evolution of ray-finned fishes. Mol Biol Evol 21 : 1146–1151.
74. HoeggS, BrinkmannH, TaylorJS, MeyerA (2004) Phylogenetic timing of the fish-specific genome duplication correlates with the diversification of teleost fish. J Mol Evol 59 : 190–203.
75. CrowKD, StadlerPF, LynchVJ, AmemiyaC, WagnerGP (2006) The “fish-specific” Hox cluster duplication is coincident with the origin of teleosts. Mol Biol Evol 23 : 121–136.
76. LaneyJD, BigginMD (1997) Zeste-mediated activation by an enhancer is independent of cooperative DNA binding in vivo. Proc Natl Acad Sci U S A 94 : 3602–3604.
77. CookPR (1999) The organization of replication and transcription. Science 284 : 1790–1795.
78. OuyangZ, ZhouQ, WongWH (2009) ChIP-Seq of transcription factors predicts absolute and differential gene expression in embryonic stem cells. Proc Natl Acad Sci U S A 106 : 21521–21526.
79. MullenAC, OrlandoDA, NewmanJJ, LovenJ, KumarRM, et al. (2011) Master transcription factors determine cell-type-specific responses to TGF-beta signaling. Cell 147 : 565–576.
80. LimLS, LohYH, ZhangW, LiY, ChenX, et al. (2007) Zic3 is required for maintenance of pluripotency in embryonic stem cells. Mol Biol Cell 18 : 1348–1358.
81. OrianA, van SteenselB, DelrowJ, BussemakerHJ, LiL, et al. (2003) Genomic binding by the Drosophila Myc, Max, Mad/Mnt transcription factor network. Genes Dev 17 : 1101–1114.
82. FernandezPC, FrankSR, WangL, SchroederM, LiuS, et al. (2003) Genomic targets of the human c-Myc protein. Genes Dev 17 : 1115–1129.
83. ZeitlingerJ, ZinzenRP, StarkA, KellisM, ZhangH, et al. (2007) Whole-genome ChIP-chip analysis of Dorsal, Twist, and Snail suggests integration of diverse patterning processes in the Drosophila embryo. Genes Dev 21 : 385–390.
84. SandmannT, GirardotC, BrehmeM, TongprasitW, StolcV, et al. (2007) A core transcriptional network for early mesoderm development in Drosophila melanogaster. Genes Dev 21 : 436–449.
85. RobertsonG, HirstM, BainbridgeM, BilenkyM, ZhaoY, et al. (2007) Genome-wide profiles of STAT1 DNA association using chromatin immunoprecipitation and massively parallel sequencing. Nat Methods 4 : 651–657.
86. CaoY, YaoZ, SarkarD, LawrenceM, SanchezGJ, et al. (2010) Genome-wide MyoD binding in skeletal muscle cells: a potential for broad cellular reprogramming. Dev Cell 18 : 662–674.
87. MacQuarrieKL, FongAP, MorseRH, TapscottSJ (2011) Genome-wide transcription factor binding: beyond direct target regulation. Trends Genet 27 : 141–148.
88. LiXY, ThomasS, SaboPJ, EisenMB, StamatoyannopoulosJA, et al. (2011) The role of chromatin accessibility in directing the widespread, overlapping patterns of Drosophila transcription factor binding. Genome Biol 12: R34.
89. FujiokaM, WuX, JaynesJB (2009) A chromatin insulator mediates transgene homing and very long-range enhancer-promoter communication. Development 136 : 3077–3087.
90. ChepelevI, WeiG, WangsaD, TangQ, ZhaoK (2012) Characterization of genome-wide enhancer-promoter interactions reveals co-expression of interacting genes and modes of higher order chromatin organization. Cell Res 22 : 490–503.
91. Carmany-RampeyA, SchierAF (2001) Single-cell internalization during zebrafish gastrulation. Curr Biol 11 : 1261–1265.
92. MyersDC, SepichDS, Solnica-KrezelL (2002) Convergence and extension in vertebrate gastrulae: cell movements according to or in search of identity? Trends Genet 18 : 447–455.
93. Solnica-KrezelL (2006) Gastrulation in zebrafish – all just about adhesion? Curr Opin Genet Dev 16 : 433–441.
94. RohdeLA, HeisenbergCP (2007) Zebrafish gastrulation: cell movements, signals, and mechanisms. Int Rev Cytol 261 : 159–192.
95. BisgroveBW, EssnerJJ, YostHJ (2000) Multiple pathways in the midline regulate concordant brain, heart and gut left-right asymmetry. Development 127 : 3567–3579.
96. DanosMC, YostHJ (1996) Role of notochord in specification of cardiac left-right orientation in zebrafish and Xenopus. Dev Biol 177 : 96–103.
97. MorganD, TurnpennyL, GoodshipJ, DaiW, MajumderK, et al. (1998) Inversin, a novel gene in the vertebrate left-right axis pathway, is partially deleted in the inv mouse. Nat Genet 20 : 149–156.
98. OttoEA, SchermerB, ObaraT, O'TooleJF, HillerKS, et al. (2003) Mutations in INVS encoding inversin cause nephronophthisis type 2, linking renal cystic disease to the function of primary cilia and left-right axis determination. Nat Genet 34 : 413–420.
99. OkadaY, TakedaS, TanakaY, Izpisua BelmonteJC, HirokawaN (2005) Mechanism of nodal flow: a conserved symmetry breaking event in left-right axis determination. Cell 121 : 633–644.
100. HashimotoM, ShinoharaK, WangJ, IkeuchiS, YoshibaS, et al. (2010) Planar polarization of node cells determines the rotational axis of node cilia. Nat Cell Biol 12 : 170–176.
101. WangG, CadwalladerAB, JangDS, TsangM, YostHJ, et al. (2011) The Rho kinase Rock2b establishes anteroposterior asymmetry of the ciliated Kupffer's vesicle in zebrafish. Development 138 : 45–54.
102. WatanabeD, SaijohY, NonakaS, SasakiG, IkawaY, et al. (2003) The left-right determinant Inversin is a component of node monocilia and other 9+0 cilia. Development 130 : 1725–1734.
103. May-SimeraHL, KaiM, HernandezV, OsbornDP, TadaM, et al. (2010) Bbs8, together with the planar cell polarity protein Vangl2, is required to establish left-right asymmetry in zebrafish. Dev Biol 345 : 215–225.
104. RossAJ, May-SimeraH, EichersER, KaiM, HillJ, et al. (2005) Disruption of Bardet-Biedl syndrome ciliary proteins perturbs planar cell polarity in vertebrates. Nat Genet 37 : 1135–1140.
105. HeisenbergCP, TadaM (2002) Wnt signalling: a moving picture emerges from van gogh. Curr Biol 12: R126–128.
106. YenHJ, TayehMK, MullinsRF, StoneEM, SheffieldVC, et al. (2006) Bardet-Biedl syndrome genes are important in retrograde intracellular trafficking and Kupffer's vesicle cilia function. Hum Mol Genet 15 : 667–677.
107. ArugaJ, TohmondaT, HommaS, MikoshibaK (2002) Zic1 promotes the expansion of dorsal neural progenitors in spinal cord by inhibiting neuronal differentiation. Dev Biol 244 : 329–341.
108. Westerfield M (2000) The zebrafish book. A guide for the laboratory use of zebrafish (Danio rerio). 4th edition. Eugene: Univ. of Oregon Press.
109. KimmelCB, BallardWW, KimmelSR, UllmannB, SchillingTF (1995) Stages of embryonic development of the zebrafish. Dev Dyn 203 : 253–310.
110. ValouevA, JohnsonDS, SundquistA, MedinaC, AntonE, et al. (2008) Genome-wide analysis of transcription factor binding sites based on ChIP-Seq data. Nat Methods 5 : 829–834.
111. Huang daW, ShermanBT, LempickiRA (2009) Systematic and integrative analysis of large gene lists using DAVID bioinformatics resources. Nat Protoc 4 : 44–57.
112. Huang daW, ShermanBT, LempickiRA (2009) Bioinformatics enrichment tools: paths toward the comprehensive functional analysis of large gene lists. Nucleic Acids Res 37 : 1–13.
113. BaileyTL, ElkanC (1994) Fitting a mixture model by expectation maximization to discover motifs in biopolymers. Proc Int Conf Intell Syst Mol Biol 2 : 28–36.
114. TusherVG, TibshiraniR, ChuG (2001) Significance analysis of microarrays applied to the ionizing radiation response. Proc Natl Acad Sci U S A 98 : 5116–5121.
115. DorskyRI, SheldahlLC, MoonRT (2002) A transgenic Lef1/beta-catenin-dependent reporter is expressed in spatially restricted domains throughout zebrafish development. Dev Biol 241 : 229–237.
Štítky
Genetika Reprodukční medicínaČlánek vyšel v časopise
PLOS Genetics
2013 Číslo 10
- Kazuistika – Perspektivy využití precizované medicíny v rámci personalizované specifické terapie onkologických pacientů
- Nobelova cena za chemii pro genetické nůžky: Objev, který změní naši budoucnost?
- Technologie na bázi RNA v klinické praxi: od přebarvených petúnií k terapii vzácných a dosud jen obtížně léčitelných chorob u lidí
- „Nepředstavovali jsme si, že náš výzkum povede přímo ke vzniku nových léků, dokonce ještě za našeho života“
- Bezplatné služby pro diagnostiku ATTRv amyloidózy pro kardiology
Nejčtenější v tomto čísle
- A GDF5 Point Mutation Strikes Twice - Causing BDA1 and SYNS2
- Dominant Mutations in Identify the Mlh1-Pms1 Endonuclease Active Site and an Exonuclease 1-Independent Mismatch Repair Pathway
- Eleven Candidate Susceptibility Genes for Common Familial Colorectal Cancer
- The Histone H3 K27 Methyltransferase KMT6 Regulates Development and Expression of Secondary Metabolite Gene Clusters
Zvyšte si kvalifikaci online z pohodlí domova
Mazová zátka a její řešení
nový kurzVšechny kurzy