
Human Intellectual Disability Genes Form Conserved Functional Modules in
Intellectual Disability (ID) disorders, defined by an IQ below 70, are genetically and phenotypically highly heterogeneous. Identification of common molecular pathways underlying these disorders is crucial for understanding the molecular basis of cognition and for the development of therapeutic intervention strategies. To systematically establish their functional connectivity, we used transgenic RNAi to target 270 ID gene orthologs in the Drosophila eye. Assessment of neuronal function in behavioral and electrophysiological assays and multiparametric morphological analysis identified phenotypes associated with knockdown of 180 ID gene orthologs. Most of these genotype-phenotype associations were novel. For example, we uncovered 16 genes that are required for basal neurotransmission and have not previously been implicated in this process in any system or organism. ID gene orthologs with morphological eye phenotypes, in contrast to genes without phenotypes, are relatively highly expressed in the human nervous system and are enriched for neuronal functions, suggesting that eye phenotyping can distinguish different classes of ID genes. Indeed, grouping genes by Drosophila phenotype uncovered 26 connected functional modules. Novel links between ID genes successfully predicted that MYCN, PIGV and UPF3B regulate synapse development. Drosophila phenotype groups show, in addition to ID, significant phenotypic similarity also in humans, indicating that functional modules are conserved. The combined data indicate that ID disorders, despite their extreme genetic diversity, are caused by disruption of a limited number of highly connected functional modules.
Published in the journal:
. PLoS Genet 9(10): e32767. doi:10.1371/journal.pgen.1003911
Category:
Research Article
doi:
https://doi.org/10.1371/journal.pgen.1003911
Summary
Intellectual Disability (ID) disorders, defined by an IQ below 70, are genetically and phenotypically highly heterogeneous. Identification of common molecular pathways underlying these disorders is crucial for understanding the molecular basis of cognition and for the development of therapeutic intervention strategies. To systematically establish their functional connectivity, we used transgenic RNAi to target 270 ID gene orthologs in the Drosophila eye. Assessment of neuronal function in behavioral and electrophysiological assays and multiparametric morphological analysis identified phenotypes associated with knockdown of 180 ID gene orthologs. Most of these genotype-phenotype associations were novel. For example, we uncovered 16 genes that are required for basal neurotransmission and have not previously been implicated in this process in any system or organism. ID gene orthologs with morphological eye phenotypes, in contrast to genes without phenotypes, are relatively highly expressed in the human nervous system and are enriched for neuronal functions, suggesting that eye phenotyping can distinguish different classes of ID genes. Indeed, grouping genes by Drosophila phenotype uncovered 26 connected functional modules. Novel links between ID genes successfully predicted that MYCN, PIGV and UPF3B regulate synapse development. Drosophila phenotype groups show, in addition to ID, significant phenotypic similarity also in humans, indicating that functional modules are conserved. The combined data indicate that ID disorders, despite their extreme genetic diversity, are caused by disruption of a limited number of highly connected functional modules.
Introduction
Intellectual Disability (ID) is defined by an IQ below 70, deficits in adaptive behavior and an onset before the age of 18. ID disorders are among the most common and important unmet challenges in health care due to their tremendous phenotypic and genetic heterogeneity [1], [2]. Many ID disorders are monogenic, and disease gene identification over the past decade has been very successful. More than 400 causative genes (referred to as ID genes) have been identified, providing unique stepping stones for understanding the molecular basis of cognition in health and disease. Some ID genes appear to work together in specific pathways and processes, such as Rho GTPase pathways, MAP kinase signalling and synaptic plasticity [3], [4]. This has led to the suggestion that ID genes highlight key molecular networks that regulate human cognition [1], [2], [5]–[7]. Such networks are of wide interest for both fundamental neuroscience and translational medicine, and can pave the way for developing treatment strategies [2]. However, their identification is limited by the paucity of available information on the function of most ID genes. Model organisms such as the mouse have effectively been used as experimental systems to gain insights into ID gene function and neuropathology [8]. Because such studies are time and cost intensive, ID research, whether in vitro or in vivo, has so far not moved beyond studying individual or small groups of genes. Novel approaches are required to allow functional studies to catch up with disease gene identification. We used Drosophila melanogaster as the model organism for this study. Genes, pathways, and regulatory networks are well-conserved between flies and humans [9]. Drosophila provides numerous approaches to investigate defects in neuronal function and behavior. Furthermore, fly models of selected ID disorders have already provided major insights into ID pathologies and have triggered the first therapeutic approaches [10], [11]. The efficiency of this organism and its available genome-wide toolboxes [12], [13] make Drosophila a powerful model to generate comparative phenotype datasets that can provide global insights into ID gene function and connectivity.
Here, we present a large-scale in vivo assessment of ID gene function and an in silico analysis of their Drosophila phenotypes and phenotype classes. We investigated the role of 270 evolutionarily conserved ID gene orthologs (referred to from here on as ‘Drosophila ID genes’) in the Drosophila compound eye, a highly organized array of ommatidia and photoreceptor neurons that allows for simultaneous assessment of neuronal function and physiology, and for multiparametric morphological analysis.
This comparative survey revealed a large number of novel functions for Drosophila ID genes including previously unappreciated regulatory roles in basal neurotransmission. It identified novel phenogroups in Drosophila that show phenotypic coherence in humans and molecular modules that can predict novel gene functions. Our study demonstrates that ID disorders converge on a limited number of highly connected functional modules.
Results
A Large Scale Screen of ID Gene Function in the Drosophila Eye
To generate novel insights into the neuronal and molecular basis of cognitive (dys)function, we set out to manipulate established monogenic causes of ID in humans using Drosophila as a model. At the start of this project we conducted a systematic, manually curated disease gene survey. Of the identified 390 ID genes, 285 were conserved in Drosophila (for curation criteria and orthology see Materials and Methods). 95% of these genes, 270 Drosophila ID genes, can be targeted with Drosophila transgenic conditional RNA interference (RNAi) lines from an established validated toolbox [12], [14], [15]. This approach is a suitable approximation to the human disease conditions since (partial) loss of gene function is thought to be the causative mechanism for more than 250 of the 270 ID genes investigated (see Materials and Methods and Table S1A). We used a total of 498 RNAi lines, including two independent RNAi constructs per gene whenever available (Table S1A). To maximize the reliability in our primary screen, we selected lines which exceed previously determined quality criteria that guaranteed high reproducibility (see Materials and Methods, discussion, and Neumüller et al. [15]). Our strategy to ablate Drosophila ID gene expression primarily in the developing eye, including the photoreceptor neurons, was directed at identifying i) Drosophila ID genes that, if perturbed, cause defects in neuronal function, ii) Drosophila ID genes that affect viability, and iii) Drosophila ID genes that control different aspects of eye morphology (Figure 1A). We reasoned that these three classes and their subcategories might break down the large number of Drosophila ID genes into phenogroups, containing genes with a coherent function. Systematic targeting of a defined, larger group of genes in the eye and phenotypic characterization of various phenotypes has to our knowledge not previously been reported. Thus the degree to which phenotypes would be obtained was unknown.

The fast phototaxis assay is an efficient and robust test for neuronal function. It is based on the fly's innate behavior to move towards a light source [16], critically depends on proper performance of photoreceptor neurons, and can be quantified using the Phototaxis Index (PI) (Figure S1A). We optimized the assay using known vision mutants and their corresponding RNAi lines (Figure S1B,C). Under the chosen screening conditions (GMR-Gal4; UAS-dicer2 driver line, 28°C) all proof of principle RNAi lines showed strong defects, phenocopying their mutant phenotypes (Figure 1B, Figure S1B,C), which validated the efficiency of our approach.
In parallel to phototaxis, Drosophila ID gene knockdown progeny were examined for morphological eye phenotypes. As proof of principle for this additional approach, we tested RNAi lines against two Drosophila ID genes with reported eye phenotypes: ubiquitin protein ligase 3a (ube3a), the Drosophila ortholog of UBE3A implicated in Angelman syndrome, and daughterless (da), the ortholog of TCF4 implicated in Pitt-Hopkins syndrome. RNAi lines against both genes resulted in the expected defects, rough eyes [17] and complete loss of interommatidial bristles [18], respectively (Figure 1C). Progeny of the GMR-Gal4; UAS-dicer2 driver crossed to the genetic background line of the RNAi lines served as controls in all experiments of our study. Controls showed no considerable eye phenotypes (see Materials and Methods) and wildtype-like performance in the phototaxis assay.
In our screen, RNAi against the majority of all Drosophila ID genes (180 genes, 67%) resulted in lethal, phototactic or morphologic phenotypes (Figure 1D, Table S1B,C). Knockdown of the remaining 90 Drosophila ID genes (33%) did not yield functional or morphological eye phenotypes. The identified phenotype groups are described below.
Essential Drosophila ID Genes
Eighteen Drosophila ID genes (7%) gave rise to (partial) lethality and are thus essential in the targeted tissues (Table S1B,C). The eye driver GMR-Gal4 has recently been reported to show some expression outside the eye, which likely accounts for the lethality that was already reported by others [12], [19], [20]. Expression of these 18 genes was subsequently knocked down specifically in neurons, using the pan-neuronal driver elav-Gal4 (Figure 1A, grey asterisk). Only ERCC2 (human gene symbol)/Xpd (Drosophila gene symbol) and TPI/Tpi did not show lethality when ablated in neurons. Sixteen of the 18 GMR-Gal4-induced lethal genes also showed 100% lethality before adult stages upon selective neuronal knockdown (Table S1B). Thus, 16 Drosophila ID genes that are essential in neurons were identified using this strategy.
Drosophila ID Genes Required for Different Aspects of Basal Neurotransmission
Ablating ID gene orthologs in the Drosophila eye and quantitatively assessing phototaxis yielded PIs between 1.1 and 5.9. Using a stringent cut-off of <4.0 to define phototaxis defects, we identified 25 phototaxis defective Drosophila ID genes (Figure 2A, Table S1B). Among these is the ortholog of ATP6V0A2, the vacuolar proton pumping ATPase subunit Vha100-1, mutations in which have been previously identified in an unbiased large scale phototaxis screen [21].

Electroretinograms (ERGs) were performed as a secondary screen to confirm that defects in phototaxis behavior are indeed caused by defective photoreceptor function and to further dissect the cause of defective vision in these ID models. ERGs are extracellular field recordings that measure the potential difference between the photoreceptor layer and the remainder of the fly body during light stimulation, revealing photoreceptor receptor transients (de - and repolarization) and synaptic communication (‘on’ and ‘off’ transients) [22]. Of the 24 Drosophila ID genes tested, we confirmed that 21 exhibited defective neuronal physiology. Of these, ATP6V0A2/Vha100-1 and SNAP29/usnp showed isolated synaptic defects characterized by normal receptor potentials but complete absence of ‘on’ and ‘off’ transients (Figure 2B). Two further Drosophila ID genes, DARS2 and GCH1, exhibited decreased amplitudes of receptor transients and reduced synaptic signalling, whereas the majority (17 of 21) of phototaxis hits were characterized by nearly absent depolarization and only residual synaptic communication (Figure 2B). In summary, we identified 21 Drosophila ID genes that are required either specifically for synaptic transmission or more broadly for basal neurotransmission and physiology. Only Vha100-1 has been previously demonstrated to be required for synaptic transmission in Drosophila photoreceptors. The majority of genes (16 of 21) had not been previously implicated in basal neurotransmission in any system or organism (Figure 2B, Table S2).
Histological Analysis of ERG Defective Drosophila ID Conditions
Internal eye architecture and the state of photoreceptors were monitored in order to obtain further insights into the cellular basis of the identified neurophysiological defects. Each wild-type ommatidium contains eight photoreceptors, organized in a stereotypical pattern (Figure 3A,B). Histological sections of ERG-defective Drosophila ID conditions detected a number of phenotypes (Figure 3, Table S1B). For example, knockdown of TBCE/tbce, implicated in hypoparathyroidism-retardation-dysmorphism syndrome, showed structural defects of developmental origin. R8 photoreceptors, normally located underneath photoreceptor 7, failed to be maintained in their appropriate proximal position and thus appeared in distal sections (Figure 3C). Moreover, rhabdomere extension towards the retina base, a process taking place during pupal development, failed in the majority of ommatidia (Figure 3C′) leading to distally accumulated “bulky” rhabdomeres (Figure 3C). This defect has recently been associated with regulators of the actin cytoskeleton that are linked to ID [23], [24]. In contrast, RNAi against several ERG defective Drosophila ID genes, including PEX7, ARFGEF2 and PAFAH1B1 caused neuronal degeneration of variable degrees, identifying a role for the encoded proteins in neuronal maintenance (Figure 3D–F). Thirteen of 21 ERG defective Drosophila ID conditions, including NKX2-1, PRPS1 and ATP6V0A2 knockdown animals, showed intact and properly organized photoreceptors (Figure 3G–I). Some of these conditions showed darker photoreceptor cytoplasm or pigment cell abnormalities (Figure 3G–I and Table S1B).

In summary, we identified genes required for neuronal development or maintenance among the ID orthologs that cause neurophysiological defects. In 20% of these cases the data confirm or extend previous findings. In the majority of instances (80%) these functions are novel (Figure 3, Table S2).
Eye Morphology Defects of Drosophila ID Genes
External eye morphology was systematically assessed in the primary screen to determine whether multiparametric phenotyping could identify which Drosophila ID genes work together in common developmental processes or molecular pathways. Thirteen phenotypic categories were identified: mildly rough, rough, partially fused ommatidia, fused ommatidia, fewer bristles, no bristles, stubble bristles, long bristles, necrosis, loss of pigmentation, small eye, wrinkled surface and dented surface (Figure 4A–M and Table S1B). 163 Drosophila ID genes showed at least one of these morphological phenotypes, which were classed as eye morphology defective. Mildly rough and rough phenotypes were the most numerous. Other defects occurred frequently in combination with these and/or with other phenotypes (Figure 4N). In all, RNAi-mediated knockdown of Drosophila ID genes in the eye generated a series of specific phenotype categories and identified a large number of genes with a role in the development of this tissue.

Interestingly, the frequency of morphological phenotypes among the phototaxis defective genes was very similar to their overall frequency in our screen. Thus, these phenotype classes do not significantly correlate (p = 0.13, hypergeometric test), which is also illustrated by the random distribution of morphologic phenotypes along the entire spectrum of phototactic performance (Figure 2A). We conclude that vision and external eye morphology do not depend on the same genetic/molecular machineries and provide a largely independent assessment of gene function.
Eye Morphology Phenotypes Characterize Genes Associated with Nervous System Expression, Development and Function
We next sought to determine whether Drosophila eye morphology defects could provide insights into conserved functional networks that underlie human ID disorders. To our knowledge, such a correlation has not previously been evaluated. Therefore, we first examined the expression, annotated functions and protein interactions, comparing EMD (Eye Morphology Defective) - and NED (No Eye Defect) - ID genes (classes indicated in Figure 1D; the terms EMD - and NED-ID genes refer to Drosophila genes throughout the text).
Based on EST data from 45 human tissues [25], the human orthologs of both EMD-ID and NED-ID genes were widely expressed. For each gene we determined the tissue in which its normalized expression is highest (normalized for overall expression per tissue; see Materials and Methods). We found that the largest fraction among EMD-ID orthologs (9.8%, 16 genes) had their highest normalized expression in human ‘nerve’ tissue. This was also, among all tissues, the tissue where EMD - and NED-ID gene orthologs differ the most, as only 2.2% (2 genes) of NED-ID orthologs had their highest expression in ‘nerve’ (4.4 fold enrichment EMD-ID over NED-ID, P = 0.046). In contrast, the tissue in which most NED-ID orthologs had their highest expression was parathyroid (11.1%, 10 genes) (Figure S2A).
EMD-ID genes were also enriched for nervous system-related phenotypes in FlyBase, such as neuroanatomy, neurophysiology and photoreceptor defects (Figure S2B) as well as for Gene Ontology (GO) terms and KEGG pathways related to neuronal processes in humans. In contrast, NED-ID genes were enriched for GO terms related to metabolic processes (Figure S2C,D). The frequencies of human postsynaptic density proteins (hPSD; 1458 proteins, ∼7% of human genes [25]) among human orthologs of EMD - versus NED-ID proteins were also compared. In general hPSD proteins were significantly enriched among all ID genes (3 fold, χ2, P = 3.65e-18, ID genes (58) vs. human genome (1458)) but to a different extent among the two eye phenotype-based classes of ID genes: 25% of human orthologs of EMD-ID genes encoded hPSD proteins (3.4 fold enriched vs. genome, 41 proteins, Table S3), compared to 13% of human orthologs of NED-ID genes (1.8 fold enriched vs. genome, 12 proteins, Table S3). hPSD proteins are thus enriched by ∼2 fold among human orthologs of EMD-ID genes relative to NED-ID genes (χ2, P = 0.04).
In summary, human orthologs of EMD-ID genes tend to be more specific for the nervous system than the NED-ID gene orthologs with respect to their expression at the RNA and protein levels and with respect to the pathways they are involved in. The above determined fly phenotypes, human gene expression and annotated functions were plotted in a circos diagram to provide a global view of ID gene properties and to illustrate the consistent asymmetry in this composite landscape of ID (Figure 5, segments 2–8; a zoomable electronic version of the circos is provided as Figure S3). Annotated genetic interactions (DroID) and protein-protein interactions (PPI; from HPRD) between ID genes were also retrieved and integrated (Figure 5, segments 1 and 9). Interestingly, ID gene-encoded proteins have more than three times as many PPIs with each other as random proteins (PIE = 3.1; p<0.0001; taking into account the systematic biases in PPI networks for intensely studied genes that are caused by their high number of measured interactions [26]). These data substantiate that ID genes operate in common pathways. Restricting the analysis to human EMD-ID gene orthologs increased this connectivity, not just relative to the PPI database (PIE = 5.8; p<0.0001), but also relative to all screened ID genes (PIE = 1.7; p = 0.003). NED-ID gene orthologs also showed increased connectivity (PIE = 8; p<0.0001) relative to random proteins from the PPI database. The different biology of EMD-ID versus NED-ID orthologs that we observed at the pathway level is therewith supported by an enrichment of protein interactions within each class. The finding that ID genes show a high connectivity is, given their heterogeneity, not trivial.

Molecular Connectivity, Modules and Biological Coherence of ID Genes
To shed light on the functional connectivity of ID, we further examined Drosophila genetic interactions, comprehensive protein interaction data (HPRD and human interologs) and co-purified protein complexes (DPIM) and integrated these connections with the phenotypes we obtained. Strikingly, connections among mildly rough and among rough ID genes were each 6 fold enriched over randomly chosen Drosophila ID genes (p<0.0001). Connections between long bristles genes showed 20 fold (p<0.002), and connections between other bristles phenotype categories 24 fold (p<0.001) enrichment relative to randomly chosen Drosophila ID genes. This modularity extends beyond the eye morphological phenotypes. Lethal genes showed an 18 fold enrichment (p<0.001), and the most enriched phenotype class, the ERG defective genes, reached 47 fold enrichment in homotypic interactions (p<0.002) (i.e. interactions between genes that fall into the same Drosophila phenotype category). Connections within the categories fused ommatidia, necrosis, loss of pigmentation, and small eye, wrinkled or dented surface have not yet been reported in any of the utilized databases. The identified enrichments in known connectivity validate the approach to map molecular modules in ID through Drosophila phenotyping.
We next mapped the phenotype-based homotypic ID modules that are underlying the determined enrichments in connectivity among our phenotype categories (see Materials and Methods). In total, we identified 26 functionally coherent ID modules composed of 100 Drosophila ID genes and 200 homotypic connections (Figure 6A and its high resolution image provided as Figure S4). For the remaining 170 ID genes (63%), no homotypic connections were annotated.

The Drosophila Long Bristles Phenogroup Successfully Predicts a Role for MYCN, PIGV and UPF3B in Synapse Development
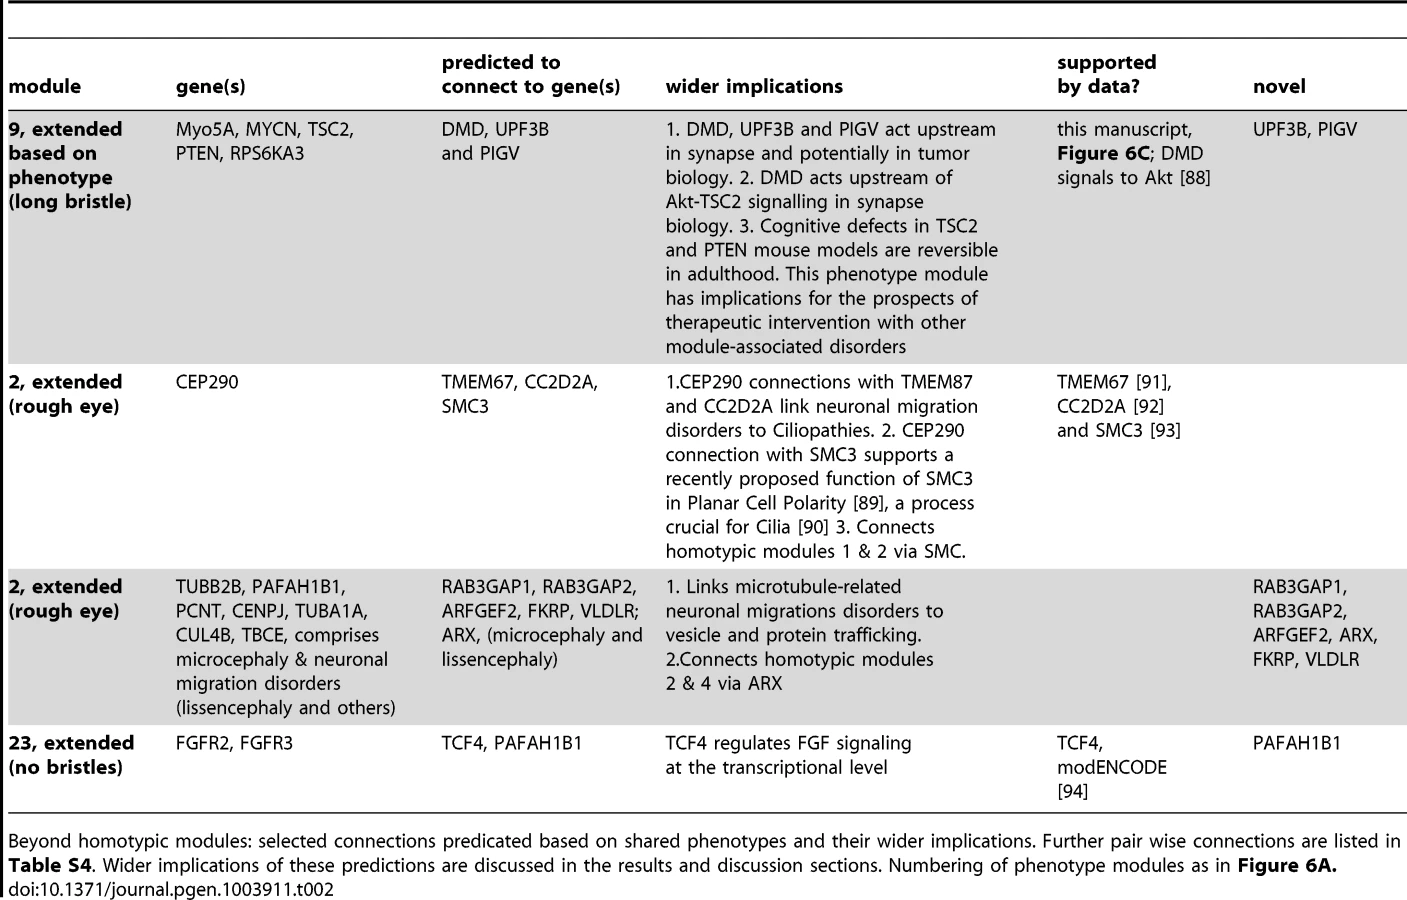
Since Drosophila phenogroups showed high enrichments in known connectivity, they should be able to accurately predict novel gene functions and phenotypically relevant connections. To test this hypothesis, we further investigated the previously undocumented phenotype of abnormally long bristles, which identified a group of eight Drosophila ID genes. Five of these genes, PTEN, TSC2, RPS6KA3, MYCN and Myo5A, form a connected module (Figure 6A,B, module 9) associated with cancer biology [27]–[29]. In addition, PTEN, TSC2, RPS6KA3 and Myo5A also play a role in synapse development and plasticity in post-mitotic neurons [4], [30]. Therefore our data suggested an unappreciated role for MYCN, the fifth protein in the module, in this process. To address this prediction, synapse development at the Drosophila larval Neuromuscular junction (NMJ) was quantified. The NMJ is a well-established model synapse that has already provided a number of fundamental insights into ID gene function and pathways [10], [24]. Pan-neuronal knockdown of MYCN in larvae caused abnormally small synapses (Figure 6C). We also predicted a role in synapse development for the remaining three long bristles genes PIGV, UPF3B and DMD (encoding dystrophin). Indeed, not only does loss of dystrophin affect synaptic transmission [31] and has recently been found to cause susceptibility to malignant tumors in mice [32], it also affects activity of Akt [33], a kinase that directly regulates TSC2. DMD may thus connect to the long bristles module and act upstream of Akt-TSC2 signalling in tumor and synapse biology. PIGV catalyzes a step in the GPI-anchor biosynthesis pathway, and UPF3B functions in nonsense-mediated mRNA decay (NMD). Both have not yet been implicated in synaptic development or cancer although other members of the PIG family and NMD factors have [34], [35]. Knockdown of PIGV and UPF3B, like knockdown of MYCN, caused a significant reduction in synaptic size (Figure 6C), consistently observed among RNAi lines. To address whether smaller synapses represent a phenotype that is common among Drosophila ID genes or whether these characterize the long bristles module more specifically, three further Drosophila ID gene sets of equal size were randomly selected from the modules and screened for synaptic growth defects. Of the three gene sets targeted by a total of 16 RNAi lines, only a single RNAi line caused a smaller synapse (6% vs. 100% of RNAi lines targeting long bristles genes; p<0.001, χ2) (Figure S5). A further single RNAi line in another gene set caused an increase in synaptic size (13% vs. 100% that cause any defect in synapse growth; p<0.01, χ2). No phenotypes were present in the third dataset, see Figure S5. Thus, Drosophila eye phenogroups can predict novel functions of Drosophila ID genes and connections between them. In addition to this experimental validation, a number of our predictions are further supported by targeted literature search (Figure 6B dashed lines, Table 1, 2 and S4, discussion). Further conclusions from our phenotype data and their suggested implications are indicated in Table 1 and 2. We conclude that our data add considerable information on ID gene functional connectivity, and provide a comprehensive, integrated picture of modular genotype-phenotype networks in our disease model.

Drosophila Phenotype Groups Show Phenotypic Similarity in Humans
Are the identified Drosophila phenotype groups relevant to humans? To test this, we asked whether the corresponding genes showed, in addition to ID, also other similar disease phenotypes. Using the Human Phenotype Ontology (HPO) database [36], we first determined that, relative to human orthologs of NED-ID genes, EMD-ID gene orthologs were enriched for morphological features of the head/neck (∼3 fold, 64 vs. 22 of top 200 features, p<10−6, χ2). In contrast, NED-ID gene phenotypes were enriched for disorders of metabolism and homeostasis (17 fold, 17 vs. 1 of top 200 features, p<10−3, χ2), which is consistent with the associated GO terms discussed above. We further inspected individual fly eye phenotype groups and determined their associated human mean phenotypic similarity scores [37]. This score reflects the degree of overlap between human disease features associated with each gene. To address the phenotypic similarity beyond ID, we excluded ID and all terms residing below it in the HPO hierarchy as features from the calculation of the similarity scores. Comparison of similarity scores in each phenotype group against the background expectation for all genes in the HPO database revealed that the phenotypic classes fused ommatidia, bristle phenotypes other than long bristles and necrosis phenotype classes showed no significant human phenotypic cohesion. In contrast, the remaining phenotype groups, mildly rough, rough, long bristles, loss of pigmentation, small eye and wrinkled or dented surface, lethal and ERG defective were each associated with significantly increased human phenotype similarity (Figure 6D). Moreover, NED-ID genes also showed highly significant coherence in their associated human phenotypes. This is consistent with their enrichment for disorders of metabolism/homeostasis and with the high connectivity among NED-ID genes, together validating them as an independent phenotype category and illustrating that in comparative functional studies also the absence of phenotypes can be informative.
Altogether, our findings demonstrate that Drosophila phenotype groups identify coherent disease phenotypes and highly connected functional modules among the large group of genetically heterogeneous ID disorders.
Discussion
The number of genes that are known to cause Intellectual Disability is growing rapidly. Some phenotypic overlap can be observed among ID disorders and a number of ID genes have been proposed to operate in joint molecular pathways. Despite these interesting observations, to date neither a comparative phenotype annotation for ID genes nor a systematic integration of the genotype-phenotype network spaces [38] has been attempted. Here we have combined large-scale phenotyping and bioinformatics to systematically generate and analyze phenotypes that are associated with 270 human ID gene orthologs in Drosophila.
Achievements and Limitations of the Chosen RNAi Approach
A previously validated transgenic RNAi library [12] was used as discovery toolbox in this study. Because our past work determined significant differences in knockdown levels induced by RNAi using this toolbox (20–60% of wt mRNA levels [39]–[42]) and because we consistently found morphological eye phenotypes with two independent RNAi constructs only for 54% of the investigated ID genes, it seems likely that a number of RNAi lines are not efficient enough to evoke phenotypes. To limit the impact of such false-negatives on our analyses, we included phenotypes caused by single RNAi lines. This strategy has been applied in previous RNAi screens using the same toolbox [14], [15], [43]. Although we cannot exclude the occurrence of false-positive and -negative findings on the single gene level, phototaxis and eye morphology proof of principle experiments were successful and reliably recapitulated previously reported mutant phenotypes (Figures 1D and S1). Twelve percent of Drosophila ID genes (33 genes) have annotated anatomical eye defects in Flybase. Most of these genes were reliably picked up in our screen (29 genes, 88%), indicating that the degree of false-negative hits is low (Table S5). High reproducibility of phenotypes was previously reported for RNAi lines with a high s19 specificity score of >0.85 [15]. In our screen, we were able to use lines with an s19 value of 0.98–1 in 97% of all cases (Table S1B), exceeding this standard.
There is evidence from the literature for (partial or complete) loss-of-function as the underlying disease mechanism in 93% of the ID genes/disorders investigated in our screen (see Table S1A). Therefore, knockdown by RNAi appears to represent a suitable approach to model most of the studied ID genes. For 6% of the investigated ID genes we found support for gain-of-function mechanisms. Most of these (affecting 9 of 15 genes) are activating mutations in the Ras-MAPK pathway. This may limit the conclusions that can be drawn for these genes from our phenotypes. Nonetheless, we note that loss of Ras-MAPK signalling also compromises cognitive functions in mouse and humans [4]. Our phenoclustering approach successfully grouped these nine Ras-MAPK components into a single phenotype module.
Close inspection of the determined homotypic modules (Figure 6A) showed that in few cases, genes that act in established common pathways or processes are divided over different modules due to their distinct Drosophila eye phenotypes. This is the case for NF1, a direct negative regulator of Ras proteins that does not group together with HRAS and KRAS genes (module 1), as well as for mitochondrial NDUF and peroxisomal PEX genes that are divided over different modules (5, 10 and 11, 20, respectively). Since the NED phenotype is involved, it is possible that some of these ‘splits’ are due to inefficiency of RNAi lines leading to false-negatives, as discussed above. However, others appear to reflect the biology of the genes/gene groups. For example, NF1, in contrast to the above discussed nine Ras-MAPK genes, is a negative regulator of Ras-MAPK signalling. It is therefore conceivable that its knockdown causes another phenotype (NED) than knockdown of the positive Ras-MAPK regulators (rough eye). A second negative regulator of this pathway, SPRED1, which has recently been found to directly interact with NF1 [44], is a NED gene as well. For the PEX genes, we would a priori have expected these to cluster together in our screen. It is worth noting though that the distribution of different PEX genes into phenotypic modules matches the molecular architecture of the peroxisomal machinery [45]. PEX1 and PEX6 (module 20) represent the two cytosolic AAA proteins that directly interact to form the peroxisomal export complex. In contrast, PEX10 and PEX12 (module 11) are both ring-finger proteins that directly interact with each other to form the ubiquitin ligase complex. This complex is required for matrix protein import and subsequent release of the cytosolic matrix protein receptor encoded by PEX5, the third PEX protein in module 11 [45]. In summary, the determined homotypic modules are unlikely to give an error-free and complete picture of biologically meaningful relations between the studied ID genes. However, the consistent properties of EMD - versus NED-ID genes, the high degree of known connectivity among our phenogroups, their increased phenotypic similarity in humans and the demonstrated validation of the predicted synapse phenotypes argue that false (negative and positive) discovery rates in this study are limited.
Novel Functions of Genes Implicated in Intellectual Disability Disorders
In our screen, we identified more than 160 Drosophila ID genes that give rise to aberrant eye morphology, of which only 17% have been described previously on Flybase (Table S5). Furthermore, we identified 16 Drosophila ID genes that were required in the eye and in neurons for fly viability. Nearly half of these act in transcription or glycosylation-related processes. A further 21 Drosophila ID genes were required specifically for synaptic transmission or, more broadly, for basal neurotransmission. Histological analyses revealed that seven of these genes were essential for neuronal maintenance, whereas the majority was associated with functional defects despite structurally intact photoreceptors, implying that they impact neuronal transmission directly. CG7830, for example, is orthologous to two human non-syndromic ID genes, TUSC3 and MAGT1. These two genes encode subunits of oligosaccharyltransferase complexes required for N-glycosylation [46], which have recently been found to possess Mg2+ transport activity [47]. In neurons, defects in TUSC3 and MAGT1-mediated Mg2+ homeostasis might thus directly impact Mg2+-dependent ion channels. All defects in basal neurotransmission that we identified in our study (Figure 2B) provide a cellular mechanism that can directly underlie cognitive deficits in patients.
Drosophila as a Model for Human Phenomics of Genetically Highly Heterogeneous Disorders
Phenomics, the phenotype correlate of genomics, is an emerging discipline in biomedical research [38], [48], [49]. Despite recently established adequate data depositories such as the HPO database, human phenomics lags behind genomics [48], limiting the recognition of genetic networks based on human phenotype data. Furthermore, the often small number of patients per genetic condition and the impact of environmental factors limit progress in human phenomics and are likely to remain bottlenecks in disease research. Comparative phenomic analyses in model organisms can contribute to the identification of evolutionarily conserved genotype-phenotype correlations in the human disease landscape.
Which animal phenotypes are relevant to ID disorders? Apart from defects of the nervous system such as the synapse, learning and memory defects [50], [51], we here show that also less complex phenotypes can be informative. Phenologs are defined as phenotypes enriched among orthologous genes in two organisms [52]. They can be used to unbiasedly identify and predict human disease models, even when the relationship between the phenotypes is not immediately obvious. This is illustrated by the predictive value of a specific yeast growth phenotype as model for mouse angiogenesis defects [52]. In Flybase, the available information on eye phenotypes is limited. However, the total fraction of annotated morphological eye phenotypes is three times higher among Drosophila ID genes than genome-wide (12.2% of Drosophila ID genes with annotated eye defects (Table S5) vs. 3.9% genome-wide, p = 1.01e-09, hypergeometric test). Thus, eye phenotypes are more likely to associate with Drosophila ID genes than with random genes, suggesting that to a certain degree they can serve as phenologs of human cognitive dysfunction. Furthermore, genes associated in fly with the same phenotype group show significant phenotypic similarity also in humans, validating Drosophila as a model for human disease phenomics of genetically highly heterogeneous disorders.
Functional Modules Underlying ID Disorders and Their Implications
Using the genotype-phenotype associations generated in this study, we found strong homotypic connectivity among ID genes. Integrating public interaction data with the generated Drosophila eye phenotypes led to novel insights in gene function and functional connectivity. In total, we detected more than two dozen homotypic modules. About half of these (14 of 26) are pairs. Thus, while informative, these clusters likely represent only a minority of all biologically relevant interactions. Some of the connections within modules are well established, such as the PPIs that delineate the Ras-MAP kinase signalling pathway at the core of the largest phenotype module (Figure 6A). Our phenotypes imply novel gene functions and functional connections within each of the established phenotype categories. The long bristles cluster successfully predicted that MYCN, PIGV and UPF3B are critical for synapse development. Other predictions remain to be tested experimentally, but a number of them are already supported by other studies (Table 1, 2 and S4). For example, despite lack of data in the utilized databases, the microtubule and neuronal migration-disorder related rough eye module two can be linked to other rough eye genes such as CC2D2A, TMEM67 and SMC3, and potentially to other rough eye genes such as Rab3GAP1, Rab3GAP2, ARFGEF2, FKRP, VLDLR and ARX as supported by shared human neuronal migration phenotypes (Figure 6B, dotted lines). CC2D2A - and TMEM67-associated ID disorders are ciliopathies, and apart from its established role in chromosome cohesion, SMC3 has been recently shown to be required for Planar Cell Polarity, a process underlying cilium formation [53], [54]. These data therefore point to an intimate connection between neuronal migration disorders and ciliopathies. Indeed, a recent paper reported that migrating interneurons display dynamic primary cilia that carry receptors for guidance cues, the dynamics of which are disturbed in a ciliopathy [55].
Another example is the fused ommatidia phenotype (Figure 3J′), which resembles a phenotype previously reported in the literature as “glossy”. This phenotype has been proposed to identify genes with mitochondrial function [56], which is required for synaptic energy supply, receptor trafficking and calcium buffering. Indeed, among the twelve Drosophila ID genes in this phenotype category are the fly orthologs of PPOX, SURF1 and DBT, three further genes with established mitochondrial function. Also ASL, a cytosolic enzyme of the urea cycle that partly takes place in mitochondria, gives rise to this phenotype. Four other fused ommatidia Drosophila ID genes encode regulators of transcription including MED12, a subunit of the mediator complex that in yeast has been shown to regulate transcription of genes with mitochondrial function [57]. In this context, it is important to note that functional connectivity between transcription factors and their target genes remains undetected in many databases, whereas this phenotype-based approach can identify or increase confidence in such relations. The “no bristles” category contains the Drosophila orthologs of FGFR2, FGFR3, PAFAH1B1 (encoding Lis1) and the transcription factor TCF4, and comprises only a single annotated connection (FGFR2, FGFR3, Figure 6A). However, ModENCODE data show that the TCF4 ortholog da targets the two Drosophila FGF receptor genes htl and btl [58](Figure 6B), supporting further functional connections within this mini-cluster. Given the number of ID genes that encode transcription regulators, disruption of gene regulatory networks that comprise several ID genes are likely to contribute to the aetiology of ID.
Translational Value of ID Modules
In the era of Next Generation Sequencing in human genomic research and diagnostics, the necessity to provide functional evidence of identified candidate disease genes is increasing exponentially. Here we have demonstrated that human disease phenomics in Drosophila is feasible, despite 1300 million years of evolutionary distance between the two species [59]. The identified genotype-phenotype modules, in combination with efficient fly phenotyping, should be applicable to facilitate identification of causative mutations among multiple DNA variants. Moreover, mapping molecular modules in ID provides a step towards network-based strategies that can target genetically heterogeneous patients with a common treatment. Recent research has demonstrated that cognitive defect in several animal models of ID are reversible in adulthood [60], [61]. Two of these genes, PTEN and TSC2, are part of the long bristles cluster, making other partners in this module attractive targets for genetic and pharmacologic rescue experiments and future clinical trials.
Materials and Methods
Human ID Genes and Orthology
ID genes were identified in the literature, in public and in-house databases, and manually curated by clinical specialists. Also conditions that might not be primarily regarded as ID syndromes (due to other prominent features or partial penetrance) were considered if independent genetic as well as independent clinical evidence for ID was found. Conditions with clinically or genetically low evidence or treatable metabolic conditions were not considered. To enrich for genes that act in neurodevelopmental processes underlying cognition, also genes associated with neurodegenerative manifestation (late onset), severe neurologic defects and early lethality were excluded. The orthologs of 390 ID genes (as of beginning of 2011) were determined using ENSEMBL's orthology classes (www.ensembl.org) and treefam annotations, including manual curation. One-to-one and one (fly)-to-many (human) orthologs were considered, identifying 285 fly orthologs. RNAi lines were available for 95% of these, which are subject of this study. In eight cases, two human paralogs are implicated in ID and have a common ancestor in Drosophila. Drosophila phenotypes and data associated with these were assigned to both human genes.
Proposed Disease Mechanisms
Of the 270 investigated human ID disorders/genes, 200 are recessive (OMIM, the Online Mendelian Inheritance in Men database), and 28 further ID genes are reported to be haploinsufficient [62]. For 24 of the remaining 42 ID genes, evidence for (partial) loss-of-function as the underlying mechanisms exist (Pubmed, summarized on OMIM), illustrating that for >93% of ID disorders the pathomechanism is (partial) loss-of-function. In a very few cases (4/270) no data are available that would allow conclusions about loss versus gain-of-function as ID underlying mechanism. Support for gain-of-function mechanisms accounts for 5% (14/270) of the investigated ID genes.
Fly Stocks and Breeding Conditions
Conditional knockdown of Drosophila ID genes was achieved with the UAS-GAL4 system [63], using a w; GMR-Gal4; UAS-dicer2 driver [12], [19] and UAS-RNAi lines [12]. UAS-RNAi lines, their genetic background controls (60000, 60100) and UAS-dicer2 (60009) were obtained from the Vienna Drosophila RNAi Centre (VDRC). GMR-Gal4 (1104), elav-Gal4; UAS-dicer2 (25750), nonA4b18 (125), norpA45 (9051), w*; sr1 ninaE17 es (5701) and w*; ort1 ninaE1 (1946) were obtained from the Bloomington Drosophila stock center (Indiana University). Crosses were cultured according to standard procedures and raised at 28°C unless indicated otherwise.
Quality Control Criteria of RNAi Lines
Information collected in previous RNAi screens [14], [15], [43] was utilized to select genetic tools (GB and KK collections, see www.vdrc.at). ID lines from the site-integrated KK library were included in the primary screen. These lines bear no risk for gene disruption at the integration locus, ensure high expression and represent independent constructs that do not overlap with those of the GB collection. They are also characterized by minimized off-targets, reflected in high s19 values (Table S1B). Including the potent KK library in our screen allowed us to use lines with highly specific s19 scores of 0.98–1 in 97% of all cases.
Phototaxis Assay and Index
A modified countercurrent apparatus was used to fractionate genotypes among six tubes, according to their visual activity (see Figure S1). The phototaxis index (PI) is calculated as ∑i*Ni)/N, where N is the number of flies, i is the tube number, and Ni is the number of flies in the ith tube. Average PI and standard deviation were calculated from three independent experiments on different test days. Assays were performed under standardized conditions, and progenies from control crosses served as internal controls. Populations of 40–70 flies, mixed sex, at the age of day 3–4 after eclosion and a walking time of 15 seconds were used. Based on the average PI of the control (PI = 5.2), and a maximal standard deviation of 1.2 per RNAi line, we defined a stringent cut-off of PI<4 to define a phototaxis hit.
Scoring of Eye Morphology Defects
Eye morphology defects were scored by two independent experimentators. Despite a reported effect of GMR-Gal4 driver constructs on eye development [64], our driver controls showed merely mildly rough phenotypes in a maximum of 10% of eyes. A mildly rough phenotype was therefore only scored if present in the majority (>90%) of knockdown eyes. No other eye phenotypes were observed in controls.
Scanning Electron Microscopy (SEM)
Three to four days old females of the appropriate genotype were fixed in 1% glutaraldehyde, dehydrated by an ethanol series (25, 50 and 75%), critically-point dried and mounted on aluminum stubs. Samples were coated in gold by sputter coating and afterwards examined with a JEOL 6310 SEM.
Histology
Heads from 3–4 days old female progenies raised at 25°C were prefixed for 30 min in 2% glutaraldehyde buffered with 0.1 M Sodium cacodylate pH 7.4, bisected and fixed for another 24 hours. Bisected heads were postfixed for 1 hour in 1% Osmium teroxide in Paladebuffer pH 7.4 with 1% Kaliumhexacyanoferrat (III)-Trihydrat, dehydrated in ethanol and propyleenoxide and embedded in a single drop of Epon. Semi thin, 1 µm thick transverse and longitudinal sections were stained with 1% Toluidine Blue.
ERGs
ERGs were performed as previously described [65]. Flies were tested at day one after eclosion. Per genotype eight to ten flies were recorded and the average of five representative recordings is shown.
Quantitative Evaluation of Drosophila Synapse Development
Segment 2, 3 and 4 muscle 4 Type 1b neuromuscular junctions (NMJs) of wandering L3 panneuronal knockdown larvae were analyzed after dissection, a 30 min fixation in 3.7% PFA and immunolabelling with an anti-discs large 1 antibody (anti-dlg1, supernatant, 1∶25) (Developmental Studies Hybridoma Bank, University of Iowa). NMJ pictures were obtained using a Leica automated brightfield multi-color epifluorescence microscope. Images were automatically processed and the synapse area was measured by an advanced in house-developed Fiji/ImageJ macro. Mutant synapses were compared to their proper genetic background controls. For the X-linked UPF3B RNAi line 31444 and its control, exclusive female knockdown animals were selected. UPF3B RNAi line 31445 was not available at the stock centre for retesting. In contrast, for AP1S2, NDUFS8 and CHD7 independent RNAi lines were available at the time of synapse evaluation and have been utilized. At least 16 synapses were analyzed per genotype. Random sets of Drosophila ID genes subjected to NMJ analysis were determined from homotypic modules using a PHP script-based random number generator. Constraints were set on the min and max values and previously generated numbers were excluded to avoid duplicates. Independent sets of specified size were generated for subsequent analysis.
Annotation of Fly Phenotypes
Drosophila ID genes were assigned to all phenotype categories that describe (an aspect of) the observed associated defects. Since RNAi induces variable knockdown that will in some cases not be sufficiently strong to evoke a loss-of-function phenotype, “single hit” genes were included in the further data analysis, as in previous Drosophila RNAi screens [14], [15], [43]. In any other scenario, one inefficient RNAi line would disqualify the efficient one, which would likely result in a large amount of false-negatives. For annotations of already known defects associated with EMD - and NED-ID or all Drosophila ID genes, the Drosophila genes annotated with defective phenotypic classes behavior, neuroanatomy, neurophysiology, behavior, photoreceptor, cell cycle and stress response phenotypes as well as with anatomy defective classes retina and photoreceptor cell were fetched from FlyBase (version march 2012) (www.flybase.org) [66]. A hypergeometric distribution test was carried out to check the enrichment of these phenotypes within EMD-ID and NED-ID genes against the background of (fly) phenotypes associated with all Drosophila genes that have orthologs in human.
Assessing Tissue Expression
EST profiles from cDNA libraries of 45 normal human tissues were retrieved from the NCBI UniGene database [67] (ftp://ftp.ncbi.nih.gov/repository/UniGene/Homo_sapiens/Hs.profiles.gz) and expression abundance for each gene across the tissues was calculated. Since average expression between tissues varied significantly, we ranked genes in each tissue according to their expression levels. Subsequently we determined for each gene the tissue of its highest normalized expression as the one in which the gene had its highest rank.
Gene Ontology Analysis
Overrepresentation of GO biological process and pathway terms for human EMD - and NED-ID gene orthologs against the human genome background data sets were identified using the Database for Annotation, Visualization and Integrated Discovery (DAVID) v6.7, web based program [68], [69].
Interaction Network Datasets and Analyses
Direct physical protein-protein interaction data sets (HPRD_Release9_041310.tar.gz) from the Human Protein Reference Database (HPRD [70]) were downloaded and used as the standard protein interaction data for our study. Human interologs [71] (containing interactions from HPRD, BioGRID, IntAct, MINT, and Reactome; version 2012_04), DPIM-coAP complex data (protein interactions determined in large-scale co-affinity purification screens, Drosophila Protein Interaction Mapping project [72] (DPIM; version 2012_04), and Drosophila Genetic interaction data (version 2012_04) were downloaded from DroID (http://www.droidb.org/) [73], [74]. Physical interaction enrichment (PIE) scores of human orthologs of EMD - and NED-ID genes were calculated against HPRD, using the PIE algorithm with a minor modification in the normalization factor [26] to account for biases in the number of reported interactions for disease genes. Interaction enrichment scores for the specific phenotype categories within EMD, for lethal and for ERG ID gene products represent the number of unique connections determined from the combined interaction data sets per phenotype (HPRD, human interologs, DPIM-coAP complex and genetic interactions) divided by the number of connections for randomly (10,000 times) chosen ID genes from the combined interaction data sets.
Circos Diagram
Circos-0.56, a freely available software package [75] was downloaded and used for the depiction of most phenotypes and significantly enriched features, determined as described above.
Phenotype-Based Homotypic ID Modules and Visualization
The combined interaction data sets (see ‘Interaction network datasets and analyses’ above) were loaded into and visualized with the Cytoscape v2.8.1 tool [76]. Different phenotypes were colored using the MultiColored Nodes plug-in v2.4.0 [77]. Homotypic phenotype modules were identified among the entire ID interactome using Cytoscape's v2.8.1 ‘create new network from attribute’ algorithm. The phenotype-based homotypic ID modules are defined as connected genes with shared phenotype. Thus, genes with a non-overlapping phenotype cannot be part of the same phenotype-based module.
Human Phenotypic Similarity
The Human Phenotype Ontology (HPO) [36] genes-to-phenotype mapping file, build 694, was downloaded from the HPO website (www.human-phenotype-ontology.org). This file maps genes to lists of standardized phenotypic features organized in a hierarchical structure (ontology). Phenotype similarity was determined based on these feature lists, using an adapted version [37] of a previously published algorithm [78] that takes the hierarchical structure into account. Basically, the human phenotypic similarity per gene pair was determined by calculating the correlation coefficient of the HPO feature vectors associated with each gene. The seven HPO features in the “Intellectual Disability” subtree were excluded from the feature vectors as the analyzed genes were selected based on this feature. Features were weighted according to their rarity and the number of features present in the vector. Before the feature vectors were compared, they were first supplemented with indirectly annotated features based on the feature hierarchy. This was accomplished by recursively adding parent features with progressively lower weights until the root of the feature hierarchy was reached. For each fly phenotype category, the mean pair-wise phenotypic similarity score was determined for all human genes associated with it. As a control, each set's score was compared with those of 1000 equal-sized sets of genes randomly sampled from the full list of HPO genes. For comparing the over-represented individual features of EMD-ID and NED-ID genes, we first identified the top 200 most significantly over-represented human phenotypic features for each gene set. This number was chosen to ensure that all considered features were over-represented at a corrected p-value threshold of 0.05 (Hypergeometric distribution; 206 and 563 features associated with NED-ID and EMD-ID genes respectively meet this threshold). Subsequently we determined what percentage of these specific features fall into the various top level HPO phenotypic categories, and compared these between EMD - and NED-ID genes.
Supporting Information
Zdroje
1. RopersHH (2010) Genetics of early onset cognitive impairment. Annu Rev Genomics Hum Genet 11 : 161–187.
2. van BokhovenH (2011) Genetic and Epigenetic Networks in Intellectual Disabilities. Annual Review of Genetics 45 : 81–104.
3. Nadif KasriN, Van AelstL (2008) Rho-linked genes and neurological disorders. Pflugers Arch 455 : 787–797.
4. KrabLC, GoordenSM, ElgersmaY (2008) Oncogenes on my mind: ERK and MTOR signaling in cognitive diseases. Trends Genet 24 : 498–510.
5. NajmabadiH, HuH, GarshasbiM, ZemojtelT, AbediniSS, et al. (2011) Deep sequencing reveals 50 novel genes for recessive cognitive disorders. Nature 478 : 57–63.
6. PavlowskyA, ChellyJ, BilluartP (2012) Emerging major synaptic signaling pathways involved in intellectual disability. Mol Psychiatry 17 : 682–693.
7. GilmanSR, IossifovI, LevyD, RonemusM, WiglerM, et al. (2011) Rare de novo variants associated with autism implicate a large functional network of genes involved in formation and function of synapses. Neuron 70 : 898–907.
8. EhningerD, LiW, FoxK, StrykerMP, SilvaAJ (2008) Reversing neurodevelopmental disorders in adults. Neuron 60 : 950–960.
9. BellenHJ, TongC, TsudaH (2010) 100 years of Drosophila research and its impact on vertebrate neuroscience: a history lesson for the future. Nat Rev Neurosci 11 : 514–522.
10. GattoCL, BroadieK (2011) Drosophila modeling of heritable neurodevelopmental disorders. Curr Opin Neurobiol 21 : 834–841.
11. KruegerDD, BearMF (2011) Toward fulfilling the promise of molecular medicine in fragile X syndrome. Annu Rev Med 62 : 411–429.
12. DietzlG, ChenD, SchnorrerF, SuKC, BarinovaY, et al. (2007) A genome-wide transgenic RNAi library for conditional gene inactivation in Drosophila. Nature 448 : 151–156.
13. MatthewsKA, KaufmanTC, GelbartWM (2005) Research resources for Drosophila: the expanding universe. Nat Rev Genet 6 : 179–193.
14. SchnorrerF, SchonbauerC, LangerCCH, DietzlG, NovatchkovaM, et al. (2010) Systematic genetic analysis of muscle morphogenesis and function in Drosophila. Nature 464 : 287–291.
15. Neumüller RalphA, RichterC, FischerA, NovatchkovaM, Neumüller KlausG, et al. (2011) Genome-Wide Analysis of Self-Renewal in Drosophila Neural Stem Cells by Transgenic RNAi. Cell Stem Cell 8 : 580–593.
16. BenzerS (1967) Behavioural mutants of Drosophila isolated by countercurrent distribution. Proc Natl Acad Sci U S A 58 : 1112–1119.
17. LuY, WangF, LiY, FerrisJ, LeeJA, et al. (2009) The Drosophila homologue of the Angelman syndrome ubiquitin ligase regulates the formation of terminal dendritic branches. Hum Mol Genet 18 : 454–462.
18. CadiganKM, JouAD, NusseR (2002) Wingless blocks bristle formation and morphogenetic furrow progression in the eye through repression of Daughterless. Development 129 : 3393–3402.
19. FreemanM (1996) Reiterative use of the EGF receptor triggers differentiation of all cell types in the Drosophila eye. Cell 87 : 651–660.
20. LiWZ, LiSL, ZhengHY, ZhangSP, XueL (2012) A broad expression profile of the GMR-GAL4 driver in Drosophila melanogaster. Genet Mol Res 11 : 1997–2002.
21. HiesingerPR, FayyazuddinA, MehtaSQ, RosenmundT, SchulzeKL, et al. (2005) The v-ATPase V0 subunit a1 is required for a late step in synaptic vesicle exocytosis in Drosophila. Cell 121 : 607–620.
22. Pak (2010) Why Drosophila to study phototransduction? J Neurogenet 24 : 55–66.
23. GalyA, SchenckA, SahinHB, QurashiA, SahelJA, et al. (2011) CYFIP dependent actin remodeling controls specific aspects of Drosophila eye morphogenesis. Dev Biol 359 : 37–46.
24. SchenckA, BardoniB, LangmannC, HardenN, MandelJL, et al. (2003) CYFIP/Sra-1 Controls Neuronal Connectivity in Drosophila and Links the Rac1 GTPase Pathway to the Fragile X Protein. Neuron 38 : 887–898.
25. BayesA, van de LagemaatLN, CollinsMO, CroningMDR, WhittleIR, et al. (2011) Characterization of the proteome, diseases and evolution of the human postsynaptic density. Nat Neurosci 14 : 19–21.
26. SamaIE, HuynenMA (2010) Measuring the physical cohesiveness of proteins using physical interaction enrichment. Bioinformatics 26 : 2737–2743.
27. JonesRG, ThompsonCB (2009) Tumor suppressors and cell metabolism: a recipe for cancer growth. Genes Dev 23 : 537–548.
28. ChoYY, YaoK, KimHG, KangBS, ZhengD, et al. (2007) Ribosomal S6 kinase 2 is a key regulator in tumor promoter induced cell transformation. Cancer Res 67 : 8104–8112.
29. LanL, HanH, ZuoH, ChenZ, DuY, et al. (2010) Upregulation of myosin Va by Snail is involved in cancer cell migration and metastasis. Int J Cancer 126 : 53–64.
30. TakagishiY, MurataY (2006) Myosin Va mutation in rats is an animal model for the human hereditary neurological disease, Griscelli syndrome type 1. Ann N Y Acad Sci 1086 : 66–80.
31. PilgramGS, PotikanondS, BainesRA, FradkinLG, NoordermeerJN (2010) The roles of the dystrophin-associated glycoprotein complex at the synapse. Mol Neurobiol 41 : 1–21.
32. SchmidtWM, UddinMH, DysekS, Moser-ThierK, PirkerC, et al. (2011) DNA damage, somatic aneuploidy, and malignant sarcoma susceptibility in muscular dystrophies. PLoS Genet 7: e1002042.
33. GlassDJ (2005) A signaling role for dystrophin: inhibiting skeletal muscle atrophy pathways. Cancer Cell 8 : 351–352.
34. NguyenLS, JollyL, ShoubridgeC, ChanWK, HuangL, et al. (2011) Transcriptome profiling of UPF3B/NMD-deficient lymphoblastoid cells from patients with various forms of intellectual disability. Mol Psychiatry 17 : 1103–15.
35. WuG, GuoZ, ChatterjeeA, HuangX, RubinE, et al. (2006) Overexpression of glycosylphosphatidylinositol (GPI) transamidase subunits phosphatidylinositol glycan class T and/or GPI anchor attachment 1 induces tumorigenesis and contributes to invasion in human breast cancer. Cancer Res 66 : 9829–9836.
36. RobinsonPN, KöhlerS, BauerS, SeelowD, HornD, et al. (2008) The Human Phenotype Ontology: A Tool for Annotating and Analyzing Human Hereditary Disease. The American Journal of Human Genetics 83 : 610–615.
37. OtiM, HuynenMA, BrunnerHG (2009) The biological coherence of human phenome databases. Am J Hum Genet 85 : 801–808.
38. OtiM, HuynenMA, BrunnerHG (2008) Phenome connections. Trends Genet 24 : 103–106.
39. van BonBWM, OortveldMAW, NijtmansLG, FenckovaM, NijhofB, et al. (2013) CEP89 is required for mitochondrial metabolism and neuronal function in man and fly. Hum Mol Genet 22 : 3138–3151.
40. WillemsenMH, NijhofB, FenckovaM, NillesenWM, BongersEMHF, et al. (2013) GATAD2B loss-of-function mutations cause a recognisable syndrome with intellectual disability and are associated with learning deficits and synaptic undergrowth in Drosophila. J Med Genet 50 : 507–514.
41. MukhopadhyayA, KramerJ, MerkxG, LugtenbergD, SmeetsD, et al. (2010) CDK19 is disrupted in a female patient with bilateral congenital retinal folds, microcephaly and mild mental retardation. Hum Genet 128 : 281–291.
42. CliffeST, KramerJM, HussainK, RobbenJH, de JongEK, et al. (2009) SLC29A3 gene is mutated in pigmented hypertrichosis with insulin-dependent diabetes mellitus syndrome and interacts with the insulin signaling pathway. Hum Mol Genet 18 : 2257–2265.
43. Mummery-WidmerJL, YamazakiM, StoegerT, NovatchkovaM, BhaleraoS, et al. (2009) Genome-wide analysis of Notch signalling in Drosophila by transgenic RNAi. Nature 458 : 987–992.
44. StoweIB, MercadoEL, StoweTR, BellEL, Oses-PrietoJA, et al. (2012) A shared molecular mechanism underlies the human rasopathies Legius syndrome and Neurofibromatosis-1. Genes Dev 26 : 1421–1426.
45. WaterhamHR, EbberinkMS (2012) Genetics and molecular basis of human peroxisome biogenesis disorders. Biochimica et Biophysica Acta (BBA) - Molecular Basis of Disease 1822 : 1430–1441.
46. MolinariF, FoulquierF, TarpeyPS, MorelleW, BoisselS, et al. (2008) Oligosaccharyltransferase-subunit mutations in nonsyndromic mental retardation. Am J Hum Genet 82 : 1150–1157.
47. ZhouH, ClaphamDE (2009) Mammalian MagT1 and TUSC3 are required for cellular magnesium uptake and vertebrate embryonic development. Proc Natl Acad Sci U S A 106 : 15750–15755.
48. HouleD, GovindarajuDR, OmholtS (2010) Phenomics: the next challenge. Nat Rev Genet 11 : 855–866.
49. BilderRM, SabbFW, CannonTD, LondonED, JentschJD, et al. (2009) Phenomics: the systematic study of phenotypes on a genome-wide scale. Neuroscience 164 : 30–42.
50. BolducFV, TullyT (2009) Fruit flies and intellectual disability. Fly (Austin) 3 : 91–104.
51. ZoghbiHY, BearMF (2012) Synaptic dysfunction in neurodevelopmental disorders associated with autism and intellectual disabilities. Cold Spring Harb Perspect Biol 4: pii: a009886.
52. McGaryKL, ParkTJ, WoodsJO, ChaHJ, WallingfordJB, et al. (2010) Systematic discovery of nonobvious human disease models through orthologous phenotypes. Proc Natl Acad Sci U S A 107 : 6544–6549.
53. MouriK, HoriuchiSY, UemuraT (2012) Cohesin controls planar cell polarity by regulating the level of the seven-pass transmembrane cadherin Flamingo. Genes Cells 17 : 509–524.
54. GrayRS, RoszkoI, Solnica-KrezelL (2011) Planar cell polarity: coordinating morphogenetic cell behaviors with embryonic polarity. Dev Cell 21 : 120–133.
55. HigginbothamH, EomTY, MarianiLE, BachledaA, HirtJ, et al. (2012) Arl13b in primary cilia regulates the migration and placement of interneurons in the developing cerebral cortex. Dev Cell 23 : 925–938.
56. LiaoTS, CallGB, GuptanP, CespedesA, MarshallJ, et al. (2006) An efficient genetic screen in Drosophila to identify nuclear-encoded genes with mitochondrial function. Genetics 174 : 525–533.
57. BeveJ, HuGZ, MyersLC, BalciunasD, WerngrenO, et al. (2005) The structural and functional role of Med5 in the yeast Mediator tail module. J Biol Chem 280 : 41366–41372.
58. RoyS, ErnstJ, KharchenkoPV, KheradpourP, NegreN, et al. (2010) Identification of functional elements and regulatory circuits by Drosophila modENCODE. Science 330 : 1787–1797.
59. ErwinDH, LaflammeM, TweedtSM, SperlingEA, PisaniD, et al. (2011) The Cambrian conundrum: early divergence and later ecological success in the early history of animals. Science 334 : 1091–1097.
60. SilvaAJ, EhningerD (2009) Adult reversal of cognitive phenotypes in neurodevelopmental disorders. J Neurodev Disord 1 : 150–157.
61. KramerJM, KochinkeK, OortveldMA, MarksH, KramerD, et al. (2011) Epigenetic regulation of learning and memory by Drosophila EHMT/G9a. PLoS Biol 9: e1000569.
62. DangVT, KassahnKS, MarcosAE, RaganMA (2008) Identification of human haploinsufficient genes and their genomic proximity to segmental duplications. Eur J Hum Genet 16 : 1350–1357.
63. BrandAH, PerrimonN (1993) Targeted gene expression as a means of altering cell fates and generating dominant phenotypes. Development 118 : 401–415.
64. KramerJM, StaveleyBE (2003) GAL4 causes developmental defects and apoptosis when expressed in the developing eye of Drosophila melanogaster. Genet Mol Res 2 : 43–47.
65. VerstrekenP, KohT-W, SchulzeKL, ZhaiRG, HiesingerPR, et al. (2003) Synaptojanin Is Recruited by Endophilin to Promote Synaptic Vesicle Uncoating. Neuron 40 : 733–748.
66. TweedieS, AshburnerM, FallsK, LeylandP, McQuiltonP, et al. (2009) FlyBase: enhancing Drosophila Gene Ontology annotations. Nucleic Acids Research 37: D555–D559.
67. BoguskiMS, SchulerGD (1995) ESTablishing a human transcript map. Nat Genet 10 : 369–371.
68. HuangDW, ShermanBT, LempickiRA (2008) Systematic and integrative analysis of large gene lists using DAVID bioinformatics resources. Nat Protocols 4 : 44–57.
69. HuangDW, ShermanBT, LempickiRA (2009) Bioinformatics enrichment tools: paths toward the comprehensive functional analysis of large gene lists. Nucleic Acids Research 37 : 1–13.
70. Keshava PrasadTS, GoelR, KandasamyK, KeerthikumarS, KumarS, et al. (2009) Human Protein Reference Database–2009 update. Nucleic Acids Research 37: D767–D772.
71. WilesAM, DodererM, RuanJ, GuTT, RaviD, et al. (2010) Building and analyzing protein interactome networks by cross-species comparisons. BMC Syst Biol 4 : 36.
72. GuruharshaKG, RualJ-F, ZhaiB, MintserisJ, VaidyaP, et al. (2011) A Protein Complex Network of Drosophila melanogaster. Cell 147 : 690–703.
73. MuraliT, PacificoS, YuJ, GuestS, RobertsGG (2010) DroID 2011: a comprehensive, integrated resource for protein, transcription factor, RNA and gene interactions for Drosophila. Nucleic Acids Res 39: D736–743.
74. YuJ, PacificoS, LiuG, FinleyRLJr (2008) DroID: the Drosophila Interactions Database, a comprehensive resource for annotated gene and protein interactions. BMC Genomics 9 : 461.
75. KrzywinskiM, ScheinJ, BirolI, ConnorsJ, GascoyneR, et al. (2009) Circos: an information aesthetic for comparative genomics. Genome Res 19 : 1639–1645.
76. SmootME, OnoK, RuscheinskiJ, WangP-L, IdekerT (2011) Cytoscape 2.8: new features for data integration and network visualization. Bioinformatics 27 : 431–432.
77. WarsowG, GreberB, FalkS, HarderC, SiatkowskiM, et al. (2010) ExprEssence - Revealing the essence of differential experimental data in the context of an interaction/regulation net-work. BMC Systems Biology 4 : 164.
78. van DrielMA, BruggemanJ, VriendG, BrunnerHG, LeunissenJAM (2006) A text-mining analysis of the human phenome. Eur J Hum Genet 14 : 535–542.
79. MelicharekDJ, RamirezLC, SinghS, ThompsonR, MarendaDR (2010) Kismet/CHD7 regulates axon morphology, memory and locomotion in a Drosophila model of CHARGE syndrome. Hum Mol Genet 19 : 4253–4264.
80. NewsomeTP, SchmidtS, DietzlG, KelemanK, ÅslingB, et al. (2000) Trio Combines with Dock to Regulate Pak Activity during Photoreceptor Axon Pathfinding in Drosophila. Cell 101 : 283–294.
81. Ben-ZviA, Ben-GigiL, YagilZ, LermanO, BeharO (2008) Semaphorin3A regulates axon growth independently of growth cone repulsion via modulation of TrkA signaling. Cellular Signalling 20 : 467–479.
82. KipreosET, LanderLE, WingJP, HeWW, HedgecockEM (1996) cul-1 Is Required for Cell Cycle Exit in C. elegans and Identifies a Novel Gene Family. Cell 85 : 829–839.
83. Endoh-YamagamiS, KarkarKM, MaySR, CobosI, ThwinMT, et al. (2010) A mutation in the pericentrin gene causes abnormal interneuron migration to the olfactory bulb in mice. Dev Biol 340 : 41–53.
84. JaglinXH, ChellyJ (2009) Tubulin-related cortical dysgeneses: microtubule dysfunction underlying neuronal migration defects. Trends in Genetics 25 : 555–566.
85. RosenbergerG, GalA, KutscheK (2005) αPIX Associates with Calpain 4, the Small Subunit of Calpain, and Has a Dual Role in Integrin-mediated Cell Spreading. Journal of Biological Chemistry 280 : 6879–6889.
86. EggertA, HoR, IkegakiN, LiuX-g, BrodeurGM (2000) Different effects of TrkA expression in neuroblastoma cell lines with or without MYCN amplification. Medical and Pediatric Oncology 35 : 623–627.
87. IraciN, DiolaitiD, PapaA, PorroA, ValliE, et al. (2011) A SP1/MIZ1/MYCN Repression Complex Recruits HDAC1 at the TRKA and p75NTR Promoters and Affects Neuroblastoma Malignancy by Inhibiting the Cell Response to NGF. Cancer Res 71 : 404–412.
88. GlassDJ (2005) A signaling role for dystrophin: Inhibiting skeletal muscle atrophy pathways. Cancer Cell 8 : 351–352.
89. MouriK, HoriuchiS-y, UemuraT (2012) Cohesin controls planar cell polarity by regulating the level of the seven-pass transmembrane cadherin Flamingo. Genes to Cells 17 : 509–524.
90. Gray RyanS, RoszkoI, Solnica-KrezelL (2011) Planar Cell Polarity: Coordinating Morphogenetic Cell Behaviors with Embryonic Polarity. Developmental Cell 21 : 120–133.
91. Garcia-GonzaloFR, CorbitKC, Sirerol-PiquerMS, RamaswamiG, OttoEA, et al. (2011) A transition zone complex regulates mammalian ciliogenesis and ciliary membrane composition. Nat Genet 43 : 776–784.
92. GordenNT, ArtsHH, ParisiMA, CoeneKLM, LetteboerSJF, et al. (2008) CC2D2A Is Mutated in Joubert Syndrome and Interacts with the Ciliopathy-Associated Basal Body Protein CEP290. The American Journal of Human Genetics 83 : 559–571.
93. ChangB, KhannaH, HawesN, JimenoD, HeS, et al. (2006) In-frame deletion in a novel centrosomal/ciliary protein CEP290/NPHP6 perturbs its interaction with RPGR and results in early-onset retinal degeneration in the rd16 mouse. Hum Mol Genet 15 : 1847–1857.
94. ConsortiumTm, RoyS, ErnstJ, KharchenkoPV, KheradpourP, et al. (2010) Identification of Functional Elements and Regulatory Circuits by Drosophila modENCODE. Science 330 : 1787–1797.
Štítky
Genetika Reprodukční medicínaČlánek vyšel v časopise
PLOS Genetics
2013 Číslo 10
- Kazuistika – Perspektivy využití precizované medicíny v rámci personalizované specifické terapie onkologických pacientů
- Nobelova cena za chemii pro genetické nůžky: Objev, který změní naši budoucnost?
- Technologie na bázi RNA v klinické praxi: od přebarvených petúnií k terapii vzácných a dosud jen obtížně léčitelných chorob u lidí
- „Nepředstavovali jsme si, že náš výzkum povede přímo ke vzniku nových léků, dokonce ještě za našeho života“
- Bezplatné služby pro diagnostiku ATTRv amyloidózy pro kardiology
Nejčtenější v tomto čísle
- A GDF5 Point Mutation Strikes Twice - Causing BDA1 and SYNS2
- Dominant Mutations in Identify the Mlh1-Pms1 Endonuclease Active Site and an Exonuclease 1-Independent Mismatch Repair Pathway
- Eleven Candidate Susceptibility Genes for Common Familial Colorectal Cancer
- The Histone H3 K27 Methyltransferase KMT6 Regulates Development and Expression of Secondary Metabolite Gene Clusters
Zvyšte si kvalifikaci online z pohodlí domova
Mazová zátka a její řešení
nový kurzVšechny kurzy