
Xbp1 Directs Global Repression of Budding Yeast Transcription during the Transition to Quiescence and Is Important for the Longevity and Reversibility of the Quiescent State
Pure populations of quiescent yeast can be obtained from stationary phase cultures that have ceased proliferation after exhausting glucose and other carbon sources from their environment. They are uniformly arrested in the G1 phase of the cell cycle, and display very high thermo-tolerance and longevity. We find that G1 arrest is initiated before all the glucose has been scavenged from the media. Maintaining G1 arrest requires transcriptional repression of the G1 cyclin, CLN3, by Xbp1. Xbp1 is induced as glucose is depleted and it is among the most abundant transcripts in quiescent cells. Xbp1 binds and represses CLN3 transcription and in the absence of Xbp1, or with extra copies of CLN3, cells undergo ectopic divisions and produce very small cells. The Rad53-mediated replication stress checkpoint reinforces the arrest and becomes essential when Cln3 is overproduced. The XBP1 transcript also undergoes metabolic oscillations under glucose limitation and we identified many additional transcripts that oscillate out of phase with XBP1 and have Xbp1 binding sites in their promoters. Further global analysis revealed that Xbp1 represses 15% of all yeast genes as they enter the quiescent state and over 500 of these transcripts contain Xbp1 binding sites in their promoters. Xbp1-repressed transcripts are highly enriched for genes involved in the regulation of cell growth, cell division and metabolism. Failure to repress some or all of these targets leads xbp1 cells to enter a permanent arrest or senescence with a shortened lifespan.
Published in the journal:
. PLoS Genet 9(10): e32767. doi:10.1371/journal.pgen.1003854
Category:
Research Article
doi:
https://doi.org/10.1371/journal.pgen.1003854
Summary
Pure populations of quiescent yeast can be obtained from stationary phase cultures that have ceased proliferation after exhausting glucose and other carbon sources from their environment. They are uniformly arrested in the G1 phase of the cell cycle, and display very high thermo-tolerance and longevity. We find that G1 arrest is initiated before all the glucose has been scavenged from the media. Maintaining G1 arrest requires transcriptional repression of the G1 cyclin, CLN3, by Xbp1. Xbp1 is induced as glucose is depleted and it is among the most abundant transcripts in quiescent cells. Xbp1 binds and represses CLN3 transcription and in the absence of Xbp1, or with extra copies of CLN3, cells undergo ectopic divisions and produce very small cells. The Rad53-mediated replication stress checkpoint reinforces the arrest and becomes essential when Cln3 is overproduced. The XBP1 transcript also undergoes metabolic oscillations under glucose limitation and we identified many additional transcripts that oscillate out of phase with XBP1 and have Xbp1 binding sites in their promoters. Further global analysis revealed that Xbp1 represses 15% of all yeast genes as they enter the quiescent state and over 500 of these transcripts contain Xbp1 binding sites in their promoters. Xbp1-repressed transcripts are highly enriched for genes involved in the regulation of cell growth, cell division and metabolism. Failure to repress some or all of these targets leads xbp1 cells to enter a permanent arrest or senescence with a shortened lifespan.
Introduction
Budding yeast that are grown in rich glucose-containing media and are allowed to naturally exhaust their carbon source undergo a series of changes that enable a significant fraction of the cells, primarily daughter cells, to enter a protective quiescent (Q) state [1]. As yeast cells transition to quiescence, they shift to respiration [2] and stockpile their glucose in the form of glycogen and trehalose [3], [4]. These Q cells are significantly denser than their nonquiescent (nonQ) siblings, which enables us to purify them by density sedimentation [1]. The ability to purify Q cells offers a unique opportunity to study this transition.
An important characteristic of all quiescent cells is that they arrest their cell cycle in G1. This requires the G1 to S transition to be stably halted by a mechanism that can be readily reversed when conditions permit. In cycling cells, progression through G1 into the next S phase involves two consecutive waves of G1 cyclin (Cln) expression. CLN3 is transcribed at the M/G1 border [5] and Cln3 associated with the cyclin-dependent kinase (Cdk) activates the transcription of the CLN1 and CLN2 cyclins and other genes that trigger budding and DNA replication [6]–[8]. If the fidelity or timing of S phase is disrupted, there are checkpoint proteins, including Rad53 and Rad9, which monitor incomplete or damaged DNA and delay cell division to allow for reparations [9].
Cln3/Cdk activity is rate limiting for the G1 to S transition during exponential growth. Excess Cln3 results in shorter G1 phases and smaller cells, while loss of Cln3 function prolongs G1 and results in larger cells [10], [11]. Previous studies have shown that the G1 cyclin Cln3, ectopically expressed during stationary phase from the UBI4 promoter, prevents G1 arrest and causes loss of viability [12]. Tetraploid cells also die in stationary phase and this inviability can be completely rescued by deletion of all four CLN3 genes [13]. These deleterious effects indicate that Cln3/Cdk must be tightly controlled during stationary phase and that its deregulation antagonizes entry into the Q state.
In this work, we demonstrate that G1 arrest is initiated before the diauxic shift (DS), which is when all the glucose has been scavenged from the media. CLN3 is a critical target of repression for G1 arrest and for the transition to quiescence. Rad53 checkpoint activity reinforces this arrest in wild type cells and becomes essential when Cln3 is overproduced. Xbp1 is also important for maintaining G1 arrest. Xbp1 is a repressor of CLN3 transcription [14], [15]. It is related to the Swi4/Mbp1 family of transcription factors, which are the DNA binding components of the yeast complexes paralogous to E2F/Dp1 in higher cells [7], [8]. As glucose is exhausted from the media, the XBP1 transcript is induced and it is among the most abundant transcripts in Q cells. Xbp1 binds and represses hundreds of genes, including CLN3 during the post-DS phase of growth. In the absence of Xbp1, cells undergo extra post-DS cell divisions and produce very small cells. These phenotypes are Cln3-dependent. xbp1 mutant Q cells are also defective in the maintenance of and recovery from the Q state. xbp1 Q cells maintain viability, but lose the ability to re-enter the cell cycle. Using Next Generation Sequencing [16], we have identified over 800 transcripts that are repressed three-fold or more by an Xbp1-dependent mechanism and 520 of these contain Xbp1 binding sites in their promoters. Xbp1 binds directly to all seven of the promoters we tested, in vivo, but only in post-DS cells. These findings indicate that Xbp1 is a global regulator specifically during the transition to quiescence. Xbp1's other targets include many genes involved in cell division, with a particular enrichment of genes required for cytokinesis. Many genes whose products localize to sites of polarized cell growth and are involved in cell wall remodeling are targeted by Xbp1. In addition, many metabolic and transport pathways are repressed by Xbp1.
Results
G1 arrest is initiated before the diauxic shift
Yeast cells spend most of their time in a non-dividing state triggered by nutrient depletion from their environment. Under the conditions we employ (see Methods), yeast undergo a highly reproducible transition from the logarithmic (log) phase of growth to stationary phase in response to carbon limitation. Figure 1 shows the average of four growth curves in which we monitored cell density, cell number and DNA content as prototrophic W303 cells grew from log phase to stationary phase in rich medium. The turbidity of the culture increases over this time course to an optical density (OD600) of about 24, but the cell number only doubles once after the DS, which occurs between the 12 and 14 hour time points. We have monitored the DNA content of these cells to determine what fraction of cells are in G1, S and G2/M over this time course. Interestingly, the 12 to 14 hour interval shows the sharpest increase in the percentage of cells in G1. This indicates that the signal to slow proliferation is occurring at or before the DS and cells respond by extending or arresting in G1. Figure 1D shows the DNA of wild type cells in log phase (8 hours), immediately after the DS, and one hour later. During log phase, the G1 (1N) and G2/M (2N) cells form two spots or peaks of high density by flow cytometry. The cells in S phase, with intermediate DNA content, are scattered between them and make up about 20% of the cells in the population. At the DS, the percentage of cells in G1 is already double that of log phase cells. This indicates that cells begin to slow the G1 to S transition before the diauxic shift. Also at the DS, we see a drop in the number of cells that are in early S phase (Figure 1D,) which is an indication that the initiation of new DNA synthesis ceases at this time. One hour after the DS, less than 3% of the cells are in S phase, and this pattern persists for at least 34 hours. We conclude that the signal to stop proliferation is received before the cells have scavenged all the glucose from the media and they respond by extending G1. The halt to DNA replication is correlated with and could be triggered by the DS.

Stable G1 arrest involves down-regulation of Cln3 by Xbp1
To determine how G1 arrest is accomplished, we have assessed the role of several key regulators of the G1 to S transition. Cln3/Cdk activity is rate limiting for the G1 to S transition during exponential growth. To investigate the effects of over-producing Cln3 on Q cell formation, we generated a prototrophic strain carrying five copies of the wild type CLN3 gene (5XCLN3). This strategy maintains all the regulatory features of the wild type CLN3 gene, while it increases the Cln3 expression level. We first verified that the 5XCLN3 construct produces about five-fold higher levels of CLN3 mRNA than wild type as cells grow from log to stationary phase (Figure 2A). To assess the impact of excess Cln3 on the transition to quiescence, we compared Q cell yield in 5XCLN3 cells to cln3 mutant and wild type cells. 5XCLN3 consistently reduces Q cell yield by half, and cln3 mutants increase Q cell production by at least 30%. This confirms that Cln3 activity is above wild type levels in the 5XCLN3 strain and that this excess Cln3 inhibits Q cell formation. It also suggests that cells enter the Q state from G1 and the longer they stay in G1 the more likely they are to achieve a successful transition into this state.

The CLN3 transcript level is high in rapidly cycling cells then it drops abruptly as cells enter stationary phase (Figure 2A). This is not unexpected, because the CLN3 promoter is cell cycle regulated [5], and it is activated by Azf1 in the presence of glucose [17], [18]. In addition, CLN3 is a target of the Xbp1 repressor, which is highly induced by glucose limitation [14].
Xbp1 is a transcriptional repressor that is not expressed during the log phase of growth, but it is induced by many forms of stress, including DNA damage and glucose limitation [14], [19]. When Xbp1 is ectopically produced in log phase cells, it binds to and represses the CLN3, CLN1 and CLB2 cyclin promoters [15]. Xbp1 overproducers also grow slowly and prolong the G1 phase of the cell cycle [14], [20]. This led us to ask if Xbp1 could be important for repressing CLN3 and halting cell division during the transition from log phase to quiescence. xbp1 and wild type cells are identical in size during logarithmic growth, however xbp1 cells are much smaller than wild type cells when grown to stationary phase (Figure 2B). This could be explained if xbp1 mutants continue proliferating under growth limiting conditions and the physical growth of the resulting cells is impaired. Figure 2C shows that this is the case. xbp1 cultures attain a higher cell number at stationary phase than do wild type cells, indicating that they undergo extra cell divisions. This can also be seen as a slower accumulation in G1 (Figure 2D). The xbp1 mutant reaches 80% G1 eight hours after wild type cells. If CLN3 is a critical target of Xbp1, we expected that the ectopic cell divisions, the small cell size, and the G1 arrest delay of xbp1 mutants would depend on the presence of Cln3. We have assayed these phenotypes in the xbp1cln3 double mutant. As predicted, xbp1cln3 cells are the same large size as cln3 cells (Figure 2B), and they undergo fewer cell divisions, as do cln3 cells (Figure 2C.) xbp1cln3 cells also display the same rate of accumulation in G1 that is seen in wild type cells (Figure 2D). This shows that these hyper-proliferative phenotypes of xbp1 are Cln3-dependent. We also expected that 5XCLN3 would share these xbp1 phenotypes. Figure 2B shows that 5XCLN3 cells are the same small size as xbp1 cells during post-diauxic growth, they undergo extra cell divisions like xbp1 (Figure 2C), and 5XCLN3 delays G1 arrest (Figure 2E.)
Rad53 checkpoint activity reinforces arrest and promotes Q cell formation
During logarithmic growth, accelerating the transition from G1 to S causes a sub-optimal S phase and such cells cannot survive without eliciting the replication stress checkpoint [21]–[23]. The fact that excess Cln3 only delays G1 arrest led us to wonder if the replication stress checkpoint also plays a role in restraining cell cycle progression under these conditions. To test this, we combined rad53-21, which lacks checkpoint activity [24] with 5XCLN3. These cells were grown from log phase into stationary phase and assayed for their ability to G1 arrest. Like 5XCLN3, rad53-21 alone has a modest G1 arrest defect. However, Rad53 is critically important for G1 arrest and Q cell formation when Cln3 is in excess. rad53-21 5XCLN3 cells divide more slowly and undergo the DS six hours later than wild type cells. They very gradually accumulate in G1, reaching 50% G1 about 30 hours later than wild type (Figure 2E). These cells also lose viability rapidly as they enter stationary phase (Figure 2F.) After seven days of growth 80% of the rad53-21 5XCLN3 cells were dead based on vital dye staining. rad53-21 5XCLN3 cells are also completely defective in Q cell formation. These results indicate that the excess Cln3 produced by the 5XCLN3 loci is toxic to nutrient-limited cells that do not have Rad53 checkpoint function. It is worth noting that this experiment was carried out at a constant pH in rich medium. Therefore, this loss of viability cannot be due to acidification, as it is in unbuffered, minimal media [25].
Reactive oxygen species (ROS) and DNA fragmentation has been associated with DNA damage and replication stress in yeast and metazoan cells [26], [27]. During log phase, 8% of the rad53-21 5XCLN3 cells were ROS positive (data not shown.) By day five, 43% of these cells contained ROS and 31% showed DNA fragmentation, as detected by TUNEL staining (Figure 2G). ROS was also detectable in 5XCLN3 and rad53-21 single mutants, but they showed no detectable TUNEL positive cells and high viability over this time course, which indicates that they were able to tolerate this level of ROS accumulation. However, the rad53-21 cells contained four times more ROS than wild type cells by day five (Figure 2G). This indicates that wild type cells also rely on Rad53 checkpoint activity during the transition to quiescence.
Rad53 is activated in response to both replicative stress and DNA damage. To see if DNA damage is involved, we combined 5XCLN3 with rad9, which is a DNA damage-specific checkpoint protein [28]–[30]. 5XCLN3 showed no toxicity in the absence of Rad9 (Figure 2F). We conclude that cells utilize the replicative stress checkpoint to reinforce cell cycle arrest during the transition to quiescence. Cells that fail to down-regulate CLN3 during this transition depend on this checkpoint for their survival. Checkpoint failure leads to apoptotic cell death.
Xbp1 binds the CLN3 promoter in vivo and represses its transcription in post-diauxic cells
Repression of CLN3 is important for the G1 arrest that is initiated by glucose limitation, and our data are consistent with Xbp1 playing a role in that process. However, when we combine xbp1 with rad53-21, there is no additive effect. The xbp1 rad53-21 is no more defective in G1 arrest then rad53-21 alone (Figure 2D). This suggests that Xbp1 may not repress CLN3 under these conditions. To directly assess the role of Xbp1 in CLN3 repression, we used chromatin immunoprecipitation and RNA Next Generation sequencing. Figure 3A (lanes 1 and 2) show that Xbp1 binding to the CLN3 promoter is undetectable in log phase cells, but it is clearly bound in cells harvested after 24 hours of growth. This can be explained by the fact that Xbp1 is induced by glucose limitation. Figure 3B shows the dramatic induction of XBP1 mRNA that begins before the diauxic shift (14 hours) and continues for 48 hours. It is also present at very high levels in Q cells purified from a seven day old culture. In fact, XBP1 ranks within the top 100 most abundant transcripts in Q cells. Figure 3C shows CLN3 mRNA levels over this same time course in wild type and xbp1 cells. The initial pre-DS drop in CLN3 mRNA still occurs, but we see a two to three-fold de-repression of CLN3 from 14 to 48 hours in the absence of Xbp1. It then drops to a very low level in Q cells, and that drop is also Xbp1-independent. This pattern suggests that there may be three distinct mechanisms for establishing and maintaining CLN3 repression and that Xbp1 plays a role in maintaining CLN3 repression during post-diauxic growth.

The fact that the pre-DS drop in CLN3 levels still occurs in xbp1 cells indicates that the initial signaling to slow proliferation is intact. Figure 2C and D also show that cell number and the fraction of xbp1 cells in G1 is very similar to wild type for the first 18 hours. Direct comparison of the FACS profiles of wild type (Figure 1D) and xbp1 cells (Figure 3D) shows that xbp1 cells halt S phase as well as wild type at the 14 hour time point, but by 20 hours a new S phase population has emerged (Figure 3D.) This S phase re-entry is also Cln3-dependent (data not shown.) In contrast, S phase cells are present at the DS and throughout this time course in the 5XCLN3 population (Figure 3E.) It is possible that either the timing or the extent of replication driven by 5XCLN3 makes these cells more dependent upon the Rad53 replication stress checkpoint for viability.
Xbp1 is important for the longevity and reversibility of the Q state
The high level of induction of XBP1 suggests that it may be a major regulator during post-diauxic growth and in Q cells. Two other key properties of Q cells are their ability to rapidly reverse their arrest upon re-feeding, and their longevity during prolonged intervals of arrest. Xbp1 Q cells are defective in both of these processes. Figure 4A shows the recovery cycle of wild type and xbp1 Q cells upon re-feeding. Wild type Q cells have a 90 minute delay, followed by a highly synchronous cell cycle as monitored by budding. xbp1 Q cells initiate budding 30 minutes later and only about half the cells participate. The very small xbp1 Q cells show no indication of budding at the 150 minute time point (Figure 4D.) These small cells initiate budding two hours after wild type Q cells begin to bud.
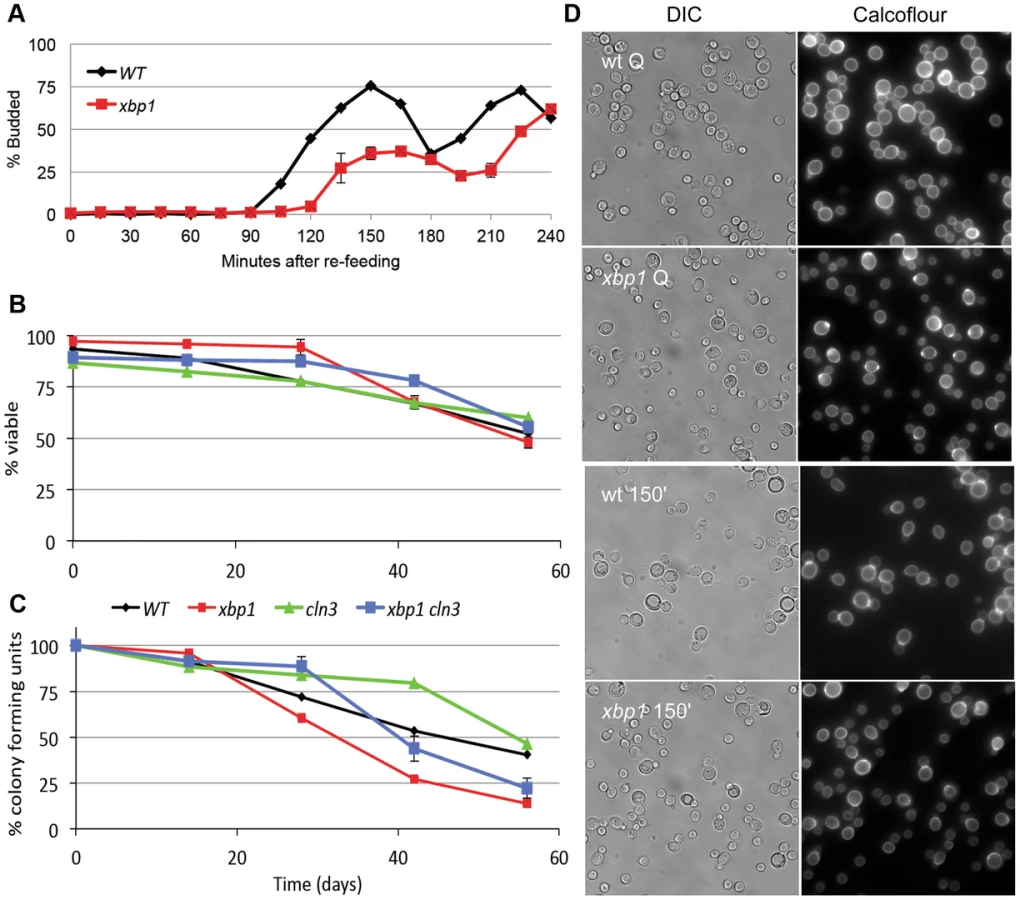
Q cell longevity is also compromised by xbp1. Figure 4B shows that xbp1 Q cells, suspended in water, retain wild type viability for at least 8 weeks, as assayed by vital dye exclusion. Q cells do not acidify the water over this time course, indicating that they are in a fundamentally different state than stationary phase cultures [25]. However, xbp1 Q cells lose the ability to form colonies more rapidly than wild type Q cells, indicating that they cannot maintain a reversible quiescent state (Figure 4C). After six weeks, 75% of xbp1 Q cells are viable, but only one-third of those can re-enter the cell cycle and form a colony. Interestingly, all of the viable cln3 Q cells can return to the cell cycle at this time point. This irreversible non-dividing state or senescence exhibited by xbp1 Q cells can be delayed, but it is not suppressed by deleting CLN3. This indicates that the premature senescence of xbp1 is not a Cln3-dependent phenotype. We conclude that Xbp1 also targets genes that influence the recovery and longevity of Q cells.
Xbp1 is a global repressor during the transition to quiescence
To see if Xbp1 performs a broader repressive function during the transition to quiescence, we looked for transcripts that are repressed when XBP1 is induced. XBP1 mRNA undergoes dramatic oscillations in cells that are synchronized to undergo metabolic and cell cycle oscillations by glucose limitation [31]. Xbp1's known targets (CLN3, CYS3, CLN1 and CLB2) also display metabolic oscillations, and peak out of phase with Xbp1. Using microarray and motif search tools [32]–[34], we identified ten transcripts that undergo metabolic oscillations out of phase with Xbp1 and that contain Xbp1 binding sites in their promoters. We verified that PIS1, DOG2, and CDC10 are bound in vivo by Xbp1 after the DS, just like CLN3 (Figure 3A). We then identified 100 transcripts whose profiles in the metabolic oscillation data set were most closely correlated with the average profile of CLN3, DOG2 and PIS1 (Supplementary Figure S1) [35]. Among those 100 genes, 54 contained Xbp1 binding sites (CTCGAG/A [14]) within 800 base pairs of their translational start sites. Three of these genes encode transcription factors (RCS1/AFT1, RFX1 and NRG2), which we also verified to be in vivo binding sites for Xbp1 by chromatin immunoprecipitation (Figure 3A).
To show that the repression of these transcripts is Xbp1-mediated and to identify other targets, we used our Next-Generation RNA sequencing [16] data to compare transcript levels of genes from wild type and xbp1 cells as they transit from log phase to stationary phase. CLN3 (Figure 3C), and all 54 of the transcripts we identified as having Xbp1 binding sites, were derepressed in one or more of the post-DS time points in the xbp1 mutant. We then identified over 800 transcripts (Supplementary Table S1) that are repressed by Xbp1, three-fold or more, in at least one of the post-DS time points. More than half (520) of these genes contained Xbp1 binding sites within the 800 base pairs upstream of their coding sequences. Figure 5A shows the consensus Xbp1 binding site derived from these 520 derepressed transcripts. We will refer to these 520 genes as direct targets of Xbp1. Figure 5B shows a dot plot comparison of all transcript levels in xbp1 and wild type cells. Direct Xbp1 targets (red dots) are not significantly affected by the absence of Xbp1 during log phase (8 hours). A few transcripts begin to rise in the xbp1 cells at the DS (14 hours), and this trend continues throughout the time course and in purified Q cells. Very few direct targets are down-regulated. This is consistent with our previous findings that Xbp1 functions as a repressor [14], [15], and expands its role as a global repressor specifically during post diauxic growth and quiescence.

Xbp1 expression is induced at 14 hours and remains high across this time course (Figure 3B), but both the levels and the timing of transcription of its targets vary widely. Figure 6 shows the transcript levels of the direct and indirect targets of Xbp1 that are elevated three-fold or greater during post-diauxic growth. Forty of these transcripts are elevated at least sixteen-fold. However, most reach their peak during a specific interval, which varies for each target gene. We speculate that this variation is due to differences in activation. If Xbp1 serves solely as a repressor, the expression of each one of its target genes would still depend on the expression and stability of its activator(s).

To look more closely at all Xbp1-mediated repression, we identified transcripts that are derepressed three-fold or greater at each time point (Table 1). Significant derepression is observed after 18 hours. The majority of these Xbp1-repressed transcripts are involved in biological regulation (p value 10–9). One third are localized to the cell periphery, but only nine are classified as cell wall proteins. 23 are localized to sites of polarized cell growth [36]. Several of these genes are involved in bud site selection or are components of the Cdc42-mediated cell polarization pathway. Components of the septin ring, which separates mother from daughter [37], the cohesion complex, which holds sister chromatids together, and components that facilitate chromosome segregation [38] are repressed by Xbp1 at 18 hours. Two cyclins (CLN3 and CLN1) that drive the G1 to S transition [6] and are known Xbp1 targets [14], [15] are elevated at this time point. Regulators of transcription are also affected. Among these are transcription factors that promote the G1 to S transition (SWI6 [39]), the S to G2/M transition (NDD1 [40], and others that induce alternative cell fates: filamentation (MSS11 and MGA1 [41]), and meiosis (IME1 [42]). Hence, Xbp1 promotes quiescence by repressing multiple targets involved in mitotic growth and by preventing cells from adopting other developmental fates.

After 24 hours of growth, 65 known genes are derepressed in the absence of Xbp1. At this time point, cell wall proteins are highly enriched. These include most of the daughter-specific genes [43]. Six gluconases and the chitinase Cts1, which are responsible for degrading the cell wall and chitin ring between mother and daughter to achieve cell separation [44] are targeted. In addition, cell division and specifically cytokinesis targets are highly enriched. Three late cycle cyclins (CLB4, CLB2 [45] and PCL9 [46]) are also targeted.
By 48 hours, nearly 10% of all genes (515) are derepressed in the absence of Xbp1. At this time point almost half of the known targeted genes are involved in metabolism and the other large class is involved in cell wall biogenesis. 45 cell cycle genes and 25 transcription regulators are also derepressed at this time point. Only one-third of these derepressed genes are also derepressed in Q cells. Xbp1 affects a more diverse group of genes in purified Q cells. Metabolic genes are the largest class. In addition, 42 genes involved in transmembrane transport, including five glucose transporters are repressed by Xbp1 in Q cells.
We also analyzed direct and indirect targets separately. What is striking is that direct and indirect targets are largely in the same pathways. At 18 and 24 hours, mitosis, cell cycle, cell division and cytokinesis are significantly enriched classes in both direct and indirect targets (Supplementary Table S2). At 48 hours, both direct and indirect targets are highly enriched for genes involved in metabolism and cell wall organization.
The dot plots of Figure 5 show that Xbp1 primarily serves as a repressor of transcription. Transcripts whose levels are under-represented by three-fold or more in the xbp1 mutant are rare until the 48 hour time point and in Q cells. However, at these two time points almost 500 transcripts fit this criterion. Unlike the derepressed transcripts, of which 60% are associated with Xbp1 binding sites, only one fifth of the down-regulated genes are near an Xbp1 binding site, which is about what is expected by chance. This is consistent with Xbp1 playing an indirect role at these promoters. To our surprise, there are only 14 transcripts that are under-represented both at 48 hours and in Q cells. At 48 hours, the under-represented transcripts are nearly all involved in ribosome biogenesis (90/257, p value 10–45) and nitrogen metabolism (156/257 p value 10–18). In Q cells, they are highly enriched for ribosomal proteins (47/129, p value 10–42) and genes involved in monosaccharide catabolism (16/129 p value 10–12). The ribosome biogenesis and ribosomal protein transcripts are tightly and coordinately regulated in response to nutrient conditions [47]. It is unclear how Xbp1 influences the expression of these genes. The striking lack of overlap between the transcripts that are under-represented in xbp1 cells at 48 hours versus purified Q cells suggests that these are fundamentally different states.
Discussion
In rich glucose-containing medium, yeast cells cease growth and division after about 48 hours due to carbon limitation. The resulting culture is a heterogeneous population of live and dead cells. Most of the daughter cells enter a quiescent state and can be purified due to their increased density [1]. Q cells develop unique characteristics including high thermo-tolerance [1] and high levels of glucose stored in the form of trehalose and glycogen [4]. The transition to quiescence does not occur when cells are abruptly deprived of glucose (Li et al, submitted), so there must be some cellular response to its waning supply that signals cells to stop proliferating, stockpile the remaining glucose and enter a quiescent state.
We are investigating the events that differentiate Q cells from nonQ cells and promote their longevity [48]. We find that G1 arrest is an early event in the transition to quiescence. There is a three-fold increase in the fraction of cells in G1 that occurs before glucose is depleted from the medium. At this point, referred to as the diauxic shift (DS), initiation of DNA synthesis is dramatically reduced and most of the cell division that occurs thereafter can be accounted for by the completion of cell cycles that were previously initiated. We have identified several key regulators that are important for achieving this arrest. We find that excess Cln3 activity, expressed from five integrated copies of the wild type CLN3 gene, interferes with Q cell formation, and cells lacking Cln3 produce more Q cells. Cells transitioning to quiescence with excess Cln3 accumulate in G1 more slowly than wild type cells, but they eventually arrest and remain viable due to the activation of the checkpoint kinase Rad53.
Rad53 is an effector of the DNA damage and replication stress checkpoints [49]. Rad9, which is specific to the DNA damage checkpoint [29], [30], is not required for the survival of 5XCLN3 cells, so we conclude that replicative stress, not DNA damage, triggers the checkpoint during the transition to quiescence. We detect delayed G1 arrest and increased ROS accumulation as nutrients become limiting, even in wild type cells carrying rad53-21. This suggests that replication stress occurs and this checkpoint pathway plays a role in restricting cell cycle progression during the wild type transition to quiescence. With excess Cln3, checkpoint function becomes essential and cells lacking it fail to arrest in G1 and undergo apoptosis. Related effects have been observed with excess cyclin E, and other activated oncogenes in higher cells [50], [51] and in yeast [26], [27], [52].
Our data indicate that CLN3 repression is mechanistically different before and after the DS, and that only its post-DS repression is Xbp1-dependent. The initial drop in CLN3 levels and the halt to S phase that we observe at the DS are Xbp1-independent. Only after the DS, the CLN3 promoter is bound and repressed by Xbp1. Cells lacking Xbp1 resume DNA replication and continue to divide after the DS, and this results in a significant population of very small cells. These phenotypes are Cln3-dependent. These data are consistent with Xbp1 playing a role in maintaining repression of CLN3 and G1 arrest as cells transition from growth to quiescence. However, unlike 5XCLN3, xbp1 mutants are not dependent on the Rad53 replication stress checkpoint for viability. We suspect that either the timing or the extent of derepression of CLN3 by xbp1 could explain the Rad53-independence of these cells. A third possibility is that Rad53 acts in the same pathway and upstream of Xbp1 to restrict cell cycle progression. Rad53 has been shown to increase the level of Xbp1 in response to DNA damage [19]. These possibilities are under investigation.
Xbp1 mutant Q cells remain viable, but they are profoundly delayed in cell cycle re-entry upon re-feeding. They are also short-lived as Q cells, entering an irreversible, senescent state more rapidly than wild type. We have not identified the genes responsible for these phenotypes because our data show that Xbp1 plays a global and continuous repressive role in cells as they transition from a dividing to a non-dividing quiescent state. We have identified 520 targets of Xbp1-mediated repression that contain Xbp1 binding sites in their promoters. All seven that we tested are direct in vivo binding sites for Xbp1. Binding is only detected after the DS, which explains why these targets were not identified in previous studies. None of the Xbp1 targets identified by genome-wide location analysis [53] are among the 520 targets we have identified, and only 5 of the 41 transcripts reported to be affected by an xbp1 deletion [54] are among the 822 transcripts that we find are derepressed after the DS. These differences emphasize the need to determine when a transcription factor is active and use those conditions to search for its targets. The consensus binding site we have derived from the 520 targets agrees with that which we initially identified by site selection [14] and that reported by [55].
XBP1 mRNA oscillates dramatically in cells that are undergoing yeast metabolic and cell cycle (YMC) oscillations [31], and we identified many Xbp1 targets by looking for its binding site in transcripts that oscillate out of phase with XBP1. YMC oscillations are achieved by growing the cells to maximum density, starving them for glucose, then restoring a limited amount of glucose, which is immediately imported and cannot be detected in the media [31], [56]. These conditions resemble the DS and they evoke the expression of genes that are induced by glucose starvation and stress, including XBP1. Cell division stops and storage carbohydrates accumulate. This is the quiescence-like phase of the YMC [4]. In the subsequent phase, XBP1 is turned off, and it's targets peak. Then, DNA replication takes place and cells divide. The striking parallels between the events associated with the transitions in and out of quiescence, and those associated with the YMC suggest that YMC oscillations may be the result of switching on and off the signal to arrest in G1 and enter quiescence. It also seems likely that the oscillation of XBP1 expression is responsible for the subsequent YMC oscillations of its many targets. One such verified target, CLN3, and many other cell cycle regulated transcripts have been shown to have different peak time or multiple peaks in the synchronized cell cycles induced by the YMC protocol [57], [58] compared to that of other cell cycle synchronization studies [59]–[61]. Our finding that a global repressor of CLN3 and 800 other transcripts is also oscillating during the YMC time course may explain some of those altered peak times.
Xbp1 negatively regulates the mRNA levels of 15% of yeast genes during post-diauxic growth. When Xbp1 was ectopically expressed during logarithmic growth, only a small number of Xbp1 targets were identified [14]. This suggests that Xbp1 may be more active in the post-diauxic state, either due to modification of Xbp1 or to the presence of co-factors that increase its activity or the accessibility of its targets. Among its many targets, Xbp1 represses the transcription of key activators of mitosis, meiosis, and filamentation. Repressing these genes may promote the quiescent state by reinforcing G1 arrest and by preventing cells from adopting alternative fates that are also triggered by nutrient limitation. Xbp1 also plays a major but complex role in the metabolic shifts that take place as cells shift from glycolysis to respiration to quiescence. Its many structural and regulatory targets involved in cell wall remodeling and cell division indicate that preventing growth is an active and continuous process in quiescent cells. Even basal expression of these genes may be deleterious to the stability of the quiescent state and/or to the orderly recovery from it.
It is striking that transcripts derepressed by xbp1 early in the transition to quiescence are largely cell cycle and growth regulators. At 18 hours, even the gene products associated with the cell periphery are largely sensors and regulators, rather then structural proteins. This is true of both direct and indirect targets. One possible explanation is that xbp1 mutant cells continue to divide during this interval. About 20% of Xbp1 targets are cell cycle regulated at the transcript level (data not shown). These transcripts are not made when cells stop dividing, so anything that promotes ectopic cell division would increase the transcription of these genes. However, only one-third of the 600 most cell cycle regulated transcripts [62] are elevated in the absence of Xbp1 and no particular class is enriched. If their elevated levels were due to continued cell divisions, all 600 would be elevated. We conclude that repression of these transcripts is an active Xbp1-mediated process, and the fact that half of them contain Xbp1 binding sites in their promoters is consistent with that conclusion. By 48 hours, hundreds of transcripts involved in metabolism and cell wall organization are affected. Again this is true of direct and indirect targets. At this point cell division has ceased, and transcriptional activators that promote cell division are likely to be inactive. Without these activators, loss of Xbp1-mediated repression may be of little consequence. However, house-keeping and metabolic genes may be constitutively active and require sustained repression in order to conserve resources. Our data indicate that Xbp1 provides the repression of these genes, perhaps through its recruitment of the histone deacetylase, Rpd3 [19].
We also looked for transcripts that were under-represented in the xbp1 mutant. These were prominent only in the last two time points and they do not show any enrichment for Xbp1 binding sites. This supports the view that Xbp1 functions primarily, if not solely, as a repressor. We expect that the reduced levels of these transcripts are an indirect effect of the many perturbations that arise in xbp1 cells where 15% of genes are expressed at a time when they should be off.
XBP1 mRNA is among the top 1% highest level transcripts in Q cells. Xbp1 has also been shown to be translationally up-regulated in response to both glucose and amino acid starvation [63]. These observations are consistent with Xbp1 serving as a global repressor of transcription as cells respond to nutrient depletion and transition to a non-dividing quiescent state. The longevity and recovery defects we observe for xbp1 mutant Q cells demonstrate the importance of this repression. Xbp1 shares homology within its DNA binding domain with four other S. cerevisiae transcription factors that specify cell fate. Swi4 and Mbp1 associate with Swi6 and serve as activators of mitotic growth [64]. Sok2 and Phd1 play opposing roles in pseudohyphal development [65]–[67]. Xbp1 plays a minor role in sporulation [15] and pseudohyphal development [68], and this work shows that it is an important global repressor during the transition to quiescence. This family of transcription factors is found only in fungi, and may be important targets for anti-fungal drugs. One of the Candida family members, Efg1, is critical for biofilm formation, which renders these pathogens drug-resistant [69]. We note that many Xbp1 targets are also known to affect virulence in bacterial and fungal pathogens. These include PMT1, 2, and 4 [70], ECM33 [71], SMI1 and FKS1 [72]. Understanding Xbp1's regulation and its role in defining the quiescent state may provide important insights with both medical and basic research implications.
Materials and Methods
Strains and growth conditions
The yeast strains were all derived from W303. The auxotrophic markers were corrected in all strains. The strains carrying five copies of CLN3 were generated by integrating additional copies of CLN3 at four different marker loci using the integrating vectors, pRS303-306 [73]. The wild type controls for these studies contain the same empty vectors integrated at the same locations. To generate the W303 prototroph, BY6500, the auxotrophic mutations were replaced with the wild-type sequence by homologous gene replacement and verified by PCR and sequencing. The checkpoint deficient rad53-21 mutant (Allen et al., 1994) was crossed into the W303 background above to generate BY6741 and subsequently crossed with the 5XCLN3 strain to generate BY6698. CLN3, XBP1 and RAD9 were deleted with KanMX as described [74].
Reproducible growth curves were obtained by patching cells from fresh plates onto YEP plus 2% glycerol and growing them overnight to eliminate petites. This patch was used to inoculate 5 ml YEPD, then a further 1/50 dilution was made and grown overnight. This culture was used to inoculate 25 ml YEPD in a 250 ml flask to an optical density (OD600) of 0.02 and allowed to grow at 30°C, shaking at 200 RPM. The diauxic shift was defined as the point at which no glucose was detected in the media, which was determined with glucose detection strips (GLU 300, Precision labs, Inc. West Chester, OH). Quiescent (Q) cells were purified from YEPD cultures that were seven days old using a 25 ml percoll density gradient [1] with minor modifications [48]. Q cell yield is calculated as the percentage of OD600 units loaded that sediment to the bottom nine ml of the gradient. Cell size and cell count was measured on a Z2 Beckman Coulter Counter. All time course data was collected in duplicate or triplicate, averaged and error bars are shown.
Viability and reproductive capacity
Cell viability was monitored using the FungaLight Yeast Viability Kit (Molecular Probes) according to the manufacturer's protocol and the percentage of live cells was plotted over time. Reproductive capacity was assayed as the ability to resume cell division and produce colonies. Serial dilutions were plated on YEPD plates in duplicate and the percentage of colony forming units (CFU) was plotted, using the CFU from the freshly harvested Q cell sample as 100%. The FungaLight and CFU viability data are averages from at least two independent experiments.
Cell imaging
Calcofluor staining of bud scars: Approximately 107 cells were collected and mixed with Calcofluor white M2R (Fluorescent brightener 28; Sigma) at a final concentration of 100 µg/ml. Cells were incubated at room temperature for 15 min in the dark then were washed twice with H2O. The stained cells were examined with a Nikon Eclipse E600 microscope with a Nikon Plan Apochromat 60XA/1.40 oil immersion objective and a UV-2E/C DAPI filter (excitation at 330–380 nm). Photomicrographs of cells were taken on a Photometrics Cascade 512B camera and analyzed with MetaMorph version 6.3r2 software (Molecular Devices, Sunnyvale, CA). TUNEL Assay: Cells were fixed with 4% paraformaldehyde at room temperature for 15 min, spun down at 5000 rpm for 5 min and washed once with 0.1 M potassium phosphate 1.2 M sorbitol buffer pH 7.5. Stationary phase cells were first resuspended in 100–200 µl fresh pretreatment buffer (1 M Sorbitol, 25 mM EDTA, 50 mM DTT, pH 8), and then pelleted in a microfuge at 2000 rpm for 3 min at room temperature. These cells were resuspended in 1 M sorbitol and pelleted as before. Cell walls were digested with 50 µg/ml Zymolyase 100T in 1 M Sorbitol buffer (pH 5.8) for 10–45 min at 30°C. Cells were pelleted at 2000 rpm for 3 min, gently washed and resuspended in 15 µl potassium phosphate/sorbitol buffer, transferred to 0.1% polylysine-coated wells of an eight well microscope slide and allowed to settle for 20 min at room temperature. The slide was washed twice with phosphate-buffered saline (PBS). Each well was incubated with 40 µl fresh permeabilization solution (0.1% Triton X-100 in a 0.1% sodium citrate solution) for 2 min on ice, then rinsed with PBS buffer. 15 µl TUNEL reaction mixture (In Situ Cell Death Detection Kit, AP, Roche) was added to each well, slides were covered and incubated for 60 min at 37°C, then rinsed twice with PBS. Cells were observed under the microscope with an FITC filter (excitation at 460–500 nm). 100–200 cells per sample were evaluated.
Flow cytometry
For flow cytometry, cells were fixed in 70% ethanol for two hours or overnight, washed once with water, then resuspended in .5 ml 50 mM Tris-HCl (pH 8.0) containing 0.2 mg/ml RNAse A and incubated at 37°C for four hours. These cells were spun down, resuspended in .5 ml 50 mM Tris-HCl (pH 7.5) containing 2 mg/ml Proteinase K, and incubated at 50°C for one hour. They were then spun down again and resuspended in .5 ml 50 mM Tris-HCl (pH 7.5) and stored at 4°C. Before analysis, they were sonicated, pelleted, and resuspended in .5 ml I.0 µM Sytox Green (Invitrogen). Percent of cells in G1, S or G2/M phase of the cell cycle were quantified with FlowJo V9.
For ROS assays, approximately 1×10⁶ cells were pelleted, gently washed with PBS, then resuspended in 1 mL PBS. 2.5 µL of a 10 mM carboxy-H2DCFDA (Invitrogen) stock solution was added and the cells were incubated for 30 minutes at 37°C. Cells were washed twice with PBS, resuspended in 1 mL 50 mM Tris-HCl pH 7.5. Cultures were then sonicated and 30,000 cells per sample were collected on a Fluorescence Activated Cell Sorter FACScan cytometer (BD Biosciences, San Jose, CA) and analyzed using Cell Quest software. FACS parameters were set at excitation and emission settings of 495 nm and 529 nm (filter FL-1), respectively. Average from two experiments is reported.
RNA measurements
To generate enough cells for RNA measurements during growth from log phase to stationary phase, 5 OD600 of cells were collected every 10 minutes, washed with RNA buffer (50 mM Tris•HCl pH 7.4, 100 mM NaCl, 10 mM EDTA) and frozen for later RNA purification. The levels of CLN3 and ACT1 mRNA were monitored by an S1 nuclease protection assay as previously described [61]. CLN3 and ACT1 transcript levels were measured in each sample of wild type and 5XCLN3 cells. The ACT1, though not invariant, was not affected by excess CLN3 so it could be used to normalize the RNA levels between the two strains.
Next-Generation RNA sequencing was carried out with RNA prepared as above from log phase cells, purified Q cells, and cells grown in YEPD to log phase (8 hours) the DS (14 hours), then 18, 24 and 48 hours. mRNA expression levels following polyA selection were assayed using the HiSeq 2000 next generation sequencing system from Illumina [16], with RNA libraries prepared according to the manufacturer's instructions. FASTQ sequence output files were generated, demultiplexed by the Illumina CASAVA software package and filtered to remove sequences with low read quality. Nucleotide fragments were paired-end sequenced.
The W303 reference genome in FASTA format and gene annotations in GFF were obtained from the Wellcome Trust Sanger Institute's SGRP group. Sequences from each read were mapped to the Saccharomyces cerevisiae W303 reference genome using the Tophat application, a fast splice junction mapper for RNA-Seq reads [75]. Representation of RNA from annotated genes were assessed using HTSeq, a Python package developed by Simon Anders at EMBL Heidelberg, with quantitative expression calculated proportional to the number of reads per length of the modeled exon (MRPKBME). Finally, differential gene representation between treatments were assessed using the R/Bioconductor package DESeq [76]. These data for differentially expressed genes are provided as Supplementary Table S3. The demultiplexed FASTQ files have been submitted to the National Center for Biotechnology Information Sequence Read Archive and are available there as accession SRA098245.
Chromatin immunoprecipitation
Cells carrying Xbp1 tagged with a Tandem Affinity Purification (TAP) tag [77] or a non-tagged Xbp1 were collected from log phase cultures and cultures that had been growing for 24 hours into stationary phase. Proteins were cross linked to DNA as described [78] and IgG agarose beads (Sigma A2909) were used to pull down in vivo binding sites. PCR primers used to amplify potential targets as well as an unregulated DNA (IRV) are provided as Supplementary Table S4.
Supporting Information
Zdroje
1. AllenC, ButtnerS, AragonAD, ThomasJA, MeirellesO, et al. (2006) Isolation of quiescent and nonquiescent cells from yeast stationary-phase cultures. J Cell Biol 174 (1) 89–100.
2. DavidsonGS, JoeRM, RoyS, MeirellesO, AllenCP, et al. (2011) The proteomics of quiescent and non-quiescent cell differentiation in yeast stationary-phase cultures. Mol Biol Cell 22 (7) 988–98.
3. LillieSH (1980) PringleJR (1980) Reserve carbohydrate metabolism in Saccharomyces cerevisiae: responses to nutrient limitation. J Bacteriol 143 (3) 1384–1394.
4. ShiL, SutterBM, YeX (2010) TuBP (2010) Trehalose Is a Key Determinant of the Quiescent Metabolic State That Fuels Cell Cycle Progression upon Return to Growth. Mol Biol Cell 21 : 1982–1990.
5. McInernyCJ, PartridgeJF, MikesellGE, CreemerDP (1997) BreedenLL (1997) A novel Mcm1-dependent element in the SWI4, CLN3, CDC6, and CDC47 promoters activates M/G1-specific transcription. Genes Dev 11 (10) 1277–1288.
6. TyersM, TokiwaG (1993) FutcherB (1993) Comparison of the Saccharomyces cerevisiae G1 cyclins: Cln3 may be an upstream activator of Cln1, Cln2 and other cyclins. EMBO J 12 : 1955–1968.
7. CostanzoM, NishikawaJL, TangX, MillmanJS, SchubO, et al. (2004) CDK activity antagonizes Whi5, an inhibitor of G1/S transcription in yeast. Cell 117 (7) 899–913.
8. de BruinRA, McDonaldWH, KalashnikovaTI, YatesJ (2004) Cln3 activates G1-specific transcription via phosphorylation of the SBF bound repressor Whi5. Cell 117 (7) 887–898.
9. ZegermanP (2009) DiffleyJF (2009) DNA replication as a target of the DNA damage checkpoint. DNA Repair (Amst) 8 (9) 1077–1088.
10. NashR, TokiwaG, AnandS, EricksonK (1988) FutcherAB (1988) The WHI1 gene of Saccharomyces cerevisiae tethers cell division to cell size and is a cyclin homolog. EMBO J 7 : 4335–4346.
11. CrossFR (1988) DAF1, a mutant gene affecting size control, pheromone arrest, and cell cycle kinetics of Saccharomyces cerevisiae. Mol Cell Biol 8 : 4675–4684.
12. BarbetNC, SchneiderU, HelliwellSB, StansfieldI, TuiteMF, et al. (1996) TOR controls translation initiation and early G1 progression in yeast. Mol Biol Cell 7 : 25–42.
13. AndalisAA, StorchovaZ, StylesC, GalitskiT, PellmanD, et al. (2004) Defects arising from whole-genome duplications in Saccharomyces cerevisiae. Genetics 167 (3) 1109–1121.
14. MaiB (1997) BreedenL (1997) Xbp1, a stress-induced transcriptional repressor of the saccharomyces cerevisiae Swi4/Mbp1 family. Mol Cell Biol 17 (11) 6491–6501.
15. MaiB (2000) BreedenL (2000) CLN1 and its repression by Xbp1 are important for efficient sporulation in budding yeast. Mol Cell Biol 20 : 478–487.
16. LiuL, LiY, LiS, HuN, HeY, et al. (2012) Comparison of next-generation sequencing systems. Journal of biomedicine & biotechnology 2012 : 251364.
17. NewcombLL, HallDD (2002) HeidemanW (2002) AZF1 is a glucose-dependent positive regulator of CLN3 transcription in Saccharomyces cerevisiae. Mol Cell Biol 22 (5) 1607–1614.
18. ParvizF, HallDD, MarkwardtDD (1998) HeidemanW (1998) Transcriptional Regulation of CLN3 Expression by Glucose in Saccharomyces cerevisiae. J Bacteriol 180 : 4508–4515.
19. TaoR, ChenH, GaoC, XueP, YangF, et al. (2011) Xbp1-mediated histone H4 deacetylation contributes to DNA double-strand break repair in yeast. Cell Res 1 (11) 1619–33.
20. SopkoR, HuangD, PrestonN, ChuaG, PappB, et al. (2006) Mapping pathways and phenotypes by systematic gene overexpression. Mol Cell 21 (3) 319–330.
21. TanakaS (2002) DiffleyJF (2002) Deregulated G1-cyclin expression induces genomic instability by preventing efficient pre-RC formation. Genes Dev 16 (20) 2639–2649.
22. SidorovaJ (2002) BreedenLL (2002) Precocious S-phase entry in budding yeast prolongs replicative state and increases dependence upon Rad53 for viability. Genetics 160 : 123–136.
23. VallenEA (1999) CrossFR (1999) Interaction Between the MEC1-Dependent DNA synthesis Checkpoint and G1 Cyclin Function in Saccaromyces Cerevisiae. Genetics 151 : 459–471.
24. AllenJB, ZhouZ, SiedeW, FriedbergEC (1994) ElledgeSJ (1994) The SAD1/RAD53 protein kinase controls multiple checkpoints and DNA damage-induced transcription in yeast. Genes & Dev 8 (20) 2401–2415.
25. BurtnerCR, MurakamiCJ, KennedyBK (2009) KaeberleinM (2009) A molecular mechanism of chronological aging in yeast. Cell Cycle 8 (8) 1256–1270.
26. WeinbergerM, RamachandranL, FengL, SharmaK, SunX, et al. (2005) Apoptosis in budding yeast caused by defects in initiation of DNA replication. J Cell Sci 118 (Pt 15) 3543–3553.
27. BurhansWC, WeinbergerM, MarchettiMA, RamachandranL, D'UrsoG, et al. (2003) Apoptosis-like yeast cell death in response to DNA damage and replication defects. Mutat Res 532 (1–2) 227–243.
28. WeinertTA, HartwellLH (1988) The RAD9 gene controls the cell cycle response to DNA damage in Saccharomyces cerevisiae. Science 241 (4863) 317–322.
29. SunZ, HsiaoJ, FayDS (1998) SternDF (1998) Rad53 FHA Domain Associated with Phosphorylated Rad9 in the DNA Damage Checkpoint. Science 281 : 272–274.
30. VialardJE, GilbertCS, GreenCM (1998) LowndesNF (1998) The Budding Yeast Rad9 Checkpoint Protein is Subjected to Mec1/Tel1-dependent hyperphosphorylation and interacts with Rad53 after DNA damage. EMBO J 17 : 5679–5688.
31. TuBP, KudlickiA, RowickaM (2005) McKnightSL (2005) Logic of the yeast metabolic cycle: temporal compartmentalization of cellular processes. Science 310 (5751) 1152–1158.
32. HibbsMA, HessDC, MyersCL, HuttenhowerC, LiK, et al. (2007) Exploring the functional landscape of gene expression: directed search of large microarray compendia. Bioinformatics 23 (20) 2692–2699.
33. GrundyWN, BaileyTL, ElkanCP (1997) BakerME (1997) Meta-MEME: motif-based hidden Markov models of protein families. Comput Appl Biosci 13 (4) 397–406.
34. van HeldenJ (2003) Regulatory sequence analysis tools. Nucleic Acids Res 31 (13) 3593–3596.
35. KudlickiA, RowickaM (2007) OtwinowskiZ (2007) SCEPTRANS: an online tool for analyzing periodic transcription in yeast. Bioinformatics 23 (12) 1559–1561.
36. BiE (2012) ParkHO (2012) Cell polarization and cytokinesis in budding yeast. Genetics 191 (2) 347–387.
37. McMurrayMA (2009) ThornerJ (2009) Septins: molecular partitioning and the generation of cellular asymmetry. Cell Div 4 : 18.
38. MehtaGD, RizviSM (2012) GhoshSK (2012) Cohesin: a guardian of genome integrity. Biochim Biophys Acta 1823 (8) 1324–1342.
39. BreedenL (1987) NasmythK (1987) Cell cycle control of the yeast HO gene: cis - and trans-acting regulators. Cell 48 : 389–397.
40. LoyCJ, LydallD (1999) SuranaU (1999) NDD1, a high-dosage suppressor of cdc28-1N, is essential for expression of a subset of late-S-phase-specific genes in Saccharomyces cerevisiae. Mol Cell Biol 19 : 3312–3327.
41. LorenzMC (1998) HeitmanJ (1998) Regulators of pseudohyphal differentiation in Saccharomyces cerevisiae identified through multicopy suppressor analysis in ammonium permease mutant strains. Genetics 150 (4) 1443–1457.
42. SmithHE, SuSS, NeigebornL, DriscollSE (1990) MitchellAP (1990) Role of IME1 expression in regulation of meiosis in Saccharomyces cerevisiae. Mol Cell Biol 10 (12) 6103–6113.
43. Colman-LernerA, ChinTE (2001) BrentR (2001) Yeast Cbk1 and Mob2 activate daughter-specific genetic programs to induce asymmetric cell fates. Cell 107 (6) 739–750.
44. OrleanP (2012) Architecture and Biosynthesis of the Saccharomyces cerevisiae Cell Wall. Genetics 192 (3) 775–818.
45. RichardsonH, LewDJ, HenzeM, SugimotK (1992) ReedSI (1992) Cyclin-B homologs in Saccharomyces cerevisiae function in S phase and in G2. Genes & Dev 6 : 2021–2034.
46. TennysonCN, LeeJ (1998) AndrewsBJ (1998) A role for the Pcl9-Pho85 cyclin-cdk complex at the M/G1 boundary in Saccharomyces cerevisiae. Mol Microbiol 28 (1) 69–79.
47. WarnerJR (1999) The economics of ribosome biosynthesis in yeast. TIBS 24 : 437–440.
48. LiL, LuY, QinLX, Bar-JosephZ, Werner-WashburneM, et al. (2009) Budding yeast SSD1-V regulates transcript levels of many longevity genes and extends chronological life span in purified quiescent cells. Mol Biol Cell 20 (17) 3851–3864.
49. JossenR (2013) BermejoR (2013) The DNA damage checkpoint response to replication stress: A Game of Forks. Frontiers in genetics 4 : 26.
50. Di MiccoR, FumagalliM, CicaleseA, PiccininS, GaspariniP, et al. (2006) Oncogene-induced senescence is a DNA damage response triggered by DNA hyper-replication. Nature 444 (7119) 638–642.
51. BartkovaJ, RezaeiN, LiontosM, KarakaidosP, KletsasD, et al. (2006) Oncogene-induced senescence is part of the tumorigenesis barrier imposed by DNA damage checkpoints. Nature 444 (7119) 633–637.
52. MadeoF, Carmona-GutierrezD, RingJ, ButtnerS, EisenbergT, et al. (2009) Caspase-dependent and caspase-independent cell death pathways in yeast. Biochem Biophys Res Commun 382 (2) 227–231.
53. HarbisonCT, GordonDB, LeeTI, RinaldiNJ, MacisaacKD, et al. (2004) Transcriptional regulatory code of a eukaryotic genome. Nature 431 (7004) 99–104.
54. ReimandJ, VaquerizasJM, ToddAE, ViloJ (2010) LuscombeNM (2010) Comprehensive reanalysis of transcription factor knockout expression data in Saccharomyces cerevisiae reveals many new targets. Nucleic Acids Res 38 (14) 4768–4777.
55. ZhuC, ByersKJ, McCordRP, ShiZ, BergerMF, et al. (2009) High-resolution DNA-binding specificity analysis of yeast transcription factors. Genome Res 19 (4) 556–566.
56. TuBP (2006) McKnightSL (2006) Metabolic cycles as an underlying basis of biological oscillations. Nat Rev Mol Cell Biol 7 (9) 696–701.
57. RowickaM, KudlickiA, TuBP (2007) OtwinowskiZ (2007) High-resolution timing of cell cycle-regulated gene expression. Proc Natl Acad Sci U S A 104 (43) 16892–16897.
58. ShiL (2013) TuBP (2013) Acetyl-CoA induces transcription of the key G1 cyclin CLN3 to promote entry into the cell division cycle in Saccharomyces cerevisiae. Proc Natl Acad Sci U S A 110 (18) 7318–23.
59. ChoRJ, CampbellMJ, WinzelerEA, SteinmetzL, ConwayA, et al. (1998) A genome-wide transcriptional analysis of the mitotic cell cycle. Mol Cell 2 : 65–73.
60. SpellmanPT, SherlockG, ZhangMQ, IyerVR, AndersK, et al. (1998) Comprehensive identification of cell cycle-regulated genes of the yeast Saccharomyces cerevisiae by microarray hybridization. Mol Biol Cell 9 (12) 3273–3297.
61. PramilaT, MilesS, GuhaThakurtaD, JemiloD (2002) BreedenLL (2002) Conserved homeodomain proteins interact with MADS box protein Mcm1 to restrict ECB-dependent transcription to the M/G1 phase of the cell cycle. Genes & Dev 16 : 3034–3045.
62. GranovskaiaMV, JensenLJ, RitchieME, ToedlingJ, NingY, et al. (2010) High-resolution transcription atlas of the mitotic cell cycle in budding yeast. Genome Biol 11 (3) R24.
63. CastelliLM, LuiJ, CampbellSG, RoweW, ZeefLA, et al. (2011) Glucose depletion inhibits translation initiation via eIF4A loss and subsequent 48S preinitiation complex accumulation, while the pentose phosphate pathway is coordinately up-regulated. Mol Biol Cell 22 (18) 3379–3393.
64. WittenbergC (2005) ReedSI (2005) Cell cycle-dependent transcription in yeast: promoters, transcription factors, and transcriptomes. Oncogene 24 (17) 2746–2755.
65. GimenoCJ (1994) FinkGR (1994) Induction of pseudohyphal growth by overexpression of PHD1, a Saccharomyces cerevisiae gene related to transcriptional regulators of fungal development. Mol Cell Biol 14 : 2100–2112.
66. PanX (2000) HeitmanJ (2000) Sok2 regulates yeast pseudohyphal differentiation via a transcription factor cascade that regulates cell-cell adhesion. Mol Cell Biol 20 (22) 8364–8372.
67. WardMP, GimenoCJ, FinkGR (1995) GarrettS (1995) SOK2 may regulate cyclic AMP-dependent protein kinase-stimulated growth and pseudohyphal development by repressing transcription. Mol Cell Biol 15 (12) 6854–6863.
68. MiledC, MannC (2001) FayeG (2001) Xbp1-Mediated Repression of CLB Gene Expression Contributes to the Modifications of Yeast Cell Morphology and Cell Cycle See during Nitrogen-Limited Growth. Mol Cell Biol 21 (11) 3714–3724.
69. NobileCJ, FoxEP, NettJE, SorrellsTR, MitrovichQM, et al. (2012) A recently evolved transcriptional network controls biofilm development in Candida albicans. Cell 148 (1–2) 126–138.
70. LengelerKB, TielkerD (2008) ErnstJF (2008) Protein-O-mannosyltransferases in virulence and development. Cell Mol Life Sci 65 (4) 528–544.
71. RouabhiaM, SemlaliA, ChandraJ, MukherjeeP, ChmielewskiW, et al. (2012) Disruption of the ECM33 gene in Candida albicans prevents biofilm formation, engineered human oral mucosa tissue damage and gingival cell necrosis/apoptosis. Mediators of inflammation 2012 : 398207.
72. NettJE, SanchezH, CainMT, RossKM (2011) AndesDR (2011) Interface of Candida albicans biofilm matrix-associated drug resistance and cell wall integrity regulation. Eukaryot Cell 10 (12) 1660–1669.
73. SikorskiRS (1989) HieterP (1989) A system of shuttle vectors and yeast host strains designed for efficient manipulation of DNA in Saccharomyces cerevisiae. Genetics 122 : 19–27.
74. LongtineMS, McKenzieAIII, DemariniDJ, ShahNG, WachA, et al. (1998) Additional modules for versatile and economical PCR-based gene deletion and modification in Saccharomyces cervisiae. Yeast 14 : 953–961.
75. TrapnellC, PachterL (2009) SalzbergSL (2009) TopHat: discovering splice junctions with RNA-Seq. Bioinformatics 25 (9) 1105–1111.
76. AndersS (2010) HuberW (2010) Differential expression analysis for sequence count data. Genome Biol 11 (10) R106.
77. RigautG, ShevchenkoA, RutzB, WilmM, MannM, et al. (1999) A generic protein purification method for protein complex characterization and proteome exploration. Nat Biotechnol 17 : 1030–1032.
78. EzhkovaE (2006) TanseyWP (2006) Chromatin immunoprecipitation to study protein-DNA interactions in budding yeast. Methods Mol Biol 313 : 225–244.
Štítky
Genetika Reprodukční medicínaČlánek vyšel v časopise
PLOS Genetics
2013 Číslo 10
- Kazuistika – Perspektivy využití precizované medicíny v rámci personalizované specifické terapie onkologických pacientů
- Nobelova cena za chemii pro genetické nůžky: Objev, který změní naši budoucnost?
- Technologie na bázi RNA v klinické praxi: od přebarvených petúnií k terapii vzácných a dosud jen obtížně léčitelných chorob u lidí
- „Nepředstavovali jsme si, že náš výzkum povede přímo ke vzniku nových léků, dokonce ještě za našeho života“
- Bezplatné služby pro diagnostiku ATTRv amyloidózy pro kardiology
Nejčtenější v tomto čísle
- A GDF5 Point Mutation Strikes Twice - Causing BDA1 and SYNS2
- Dominant Mutations in Identify the Mlh1-Pms1 Endonuclease Active Site and an Exonuclease 1-Independent Mismatch Repair Pathway
- Eleven Candidate Susceptibility Genes for Common Familial Colorectal Cancer
- The Histone H3 K27 Methyltransferase KMT6 Regulates Development and Expression of Secondary Metabolite Gene Clusters
Zvyšte si kvalifikaci online z pohodlí domova
Mazová zátka a její řešení
nový kurzVšechny kurzy