
The NSL Complex Regulates Housekeeping Genes in
MOF is the major histone H4 lysine 16-specific (H4K16) acetyltransferase in mammals and Drosophila. In flies, it is involved in the regulation of X-chromosomal and autosomal genes as part of the MSL and the NSL complexes, respectively. While the function of the MSL complex as a dosage compensation regulator is fairly well understood, the role of the NSL complex in gene regulation is still poorly characterized. Here we report a comprehensive ChIP–seq analysis of four NSL complex members (NSL1, NSL3, MBD-R2, and MCRS2) throughout the Drosophila melanogaster genome. Strikingly, the majority (85.5%) of NSL-bound genes are constitutively expressed across different cell types. We find that an increased abundance of the histone modifications H4K16ac, H3K4me2, H3K4me3, and H3K9ac in gene promoter regions is characteristic of NSL-targeted genes. Furthermore, we show that these genes have a well-defined nucleosome free region and broad transcription initiation patterns. Finally, by performing ChIP–seq analyses of RNA polymerase II (Pol II) in NSL1 - and NSL3-depleted cells, we demonstrate that both NSL proteins are required for efficient recruitment of Pol II to NSL target gene promoters. The observed Pol II reduction coincides with compromised binding of TBP and TFIIB to target promoters, indicating that the NSL complex is required for optimal recruitment of the pre-initiation complex on target genes. Moreover, genes that undergo the most dramatic loss of Pol II upon NSL knockdowns tend to be enriched in DNA Replication–related Element (DRE). Taken together, our findings show that the MOF-containing NSL complex acts as a major regulator of housekeeping genes in flies by modulating initiation of Pol II transcription.
Published in the journal:
. PLoS Genet 8(6): e32767. doi:10.1371/journal.pgen.1002736
Category:
Research Article
doi:
https://doi.org/10.1371/journal.pgen.1002736
Summary
MOF is the major histone H4 lysine 16-specific (H4K16) acetyltransferase in mammals and Drosophila. In flies, it is involved in the regulation of X-chromosomal and autosomal genes as part of the MSL and the NSL complexes, respectively. While the function of the MSL complex as a dosage compensation regulator is fairly well understood, the role of the NSL complex in gene regulation is still poorly characterized. Here we report a comprehensive ChIP–seq analysis of four NSL complex members (NSL1, NSL3, MBD-R2, and MCRS2) throughout the Drosophila melanogaster genome. Strikingly, the majority (85.5%) of NSL-bound genes are constitutively expressed across different cell types. We find that an increased abundance of the histone modifications H4K16ac, H3K4me2, H3K4me3, and H3K9ac in gene promoter regions is characteristic of NSL-targeted genes. Furthermore, we show that these genes have a well-defined nucleosome free region and broad transcription initiation patterns. Finally, by performing ChIP–seq analyses of RNA polymerase II (Pol II) in NSL1 - and NSL3-depleted cells, we demonstrate that both NSL proteins are required for efficient recruitment of Pol II to NSL target gene promoters. The observed Pol II reduction coincides with compromised binding of TBP and TFIIB to target promoters, indicating that the NSL complex is required for optimal recruitment of the pre-initiation complex on target genes. Moreover, genes that undergo the most dramatic loss of Pol II upon NSL knockdowns tend to be enriched in DNA Replication–related Element (DRE). Taken together, our findings show that the MOF-containing NSL complex acts as a major regulator of housekeeping genes in flies by modulating initiation of Pol II transcription.
Introduction
In the past decade, our understanding of eukaryotic transcriptional regulation has changed from the notion of a “generic entity that functions by a single universal mechanism” [1] to the acknowledgement of diversity in promoter types and functions. Indeed, eukaryotic transcription relies on a complex interplay between DNA binding motifs, covalent histone modifications, higher order chromatin structures and protein-protein interactions. For example, post-translational modifications of histones such as acetylation, methylation, phosphorylation, ubiquitinylation, and sumoylation are prominent mechanisms employed to help modify chromatin structure and are considered to be a prerequisite for the recruitment of general transcription factors (GTFs) (for review see [2], [3]). Histone acetylation can impact chromatin structure in several ways: it has been shown that acetylation at different lysine residues can be specifically recognized by distinct protein domains (e.g. bromodomains) [4], [5], which in turn recruit chromatin-remodeling factors. Alternatively, acetylation itself may also disrupt interactions between nucleosomes and thus cause chromatin decompaction [6], [7]. Both mechanisms can contribute to reduced nucleosome occupancies at transcriptional start sites (TSSs), thereby providing an open chromatin environment for GTF binding [8].
Histone acetyltransferases (HATs) and histone deacetylases (HDACs) work in concert to orchestrate a fine balance of acetylation. HATs can be classified into two predominant families: the GCN5-related N-acetyltransferase (GNAT) family (e.g. Gcn5 and p300) [9] and the Moz-Ybf2/Sas3-Sas2-Tip60 (MYST) family (e.g. Tip60 and MOF) [10]. These enzymes often function as part of multi-protein complexes, presumably to increase substrate-specificity and to impose tight regulation of their enzymatic activity. Moreover, mounting evidence suggests that a single HAT can often associate with more than one complex [11]. Gcn5, for example, is a member of both the SAGA and ATAC complexes [12], [13] that regulate different sets of inducible genes despite sharing the same HAT [14]–[18].
Similarly MOF, a MYST-HAT specific for H4K16 acetylation, is also a member of two distinct protein complexes in Drosophila and mammals: the Male-Specific Lethal (MSL) and the Non-Specific Lethal (NSL) complexes [19]–[21]. In Drosophila, the MSL complex is targeted to the transcribed regions of X-chromosomal genes where it mediates dosage compensation. The targeting mechanism and modes of action of the MSL complex have been studied extensively (for review see [22]–[24]). In contrast, details of the NSL complex have only recently started to emerge. Our previous work revealed that the NSL complex is composed of at least seven proteins: NSL1, NSL2, NSL3, MCRS2, MBD-R2, WDS and MOF [20], [21]. We have also shown that these proteins are essential for the viability and development of Drosophila and that they are required for the recruitment of MOF to the promoters of active genes [21], [25]. Using a reporter assay system, Becker and colleagues demonstrated that MOF displays greater potential for transcriptional activation as part of the NSL complex, than in the MSL complex [26]. Additionally, recent reports indicate that in mammals MOF fulfills different functions in the NSL and MSL complex, respectively. It has been shown, for example, that the mammalian NSL1/MOF sub-complex appears to have broader substrate specificity than the MSL1/MOF sub-complex, as it is also able to acetylate non-histone targets [27]. Despite these observations, our understanding of NSL complex targeting and its regulatory function is still limited. Since the complex is conserved from Drosophila to mammals [20], unraveling its mechanism of action will be crucial for a better understanding of transcriptional regulation in higher eukaryotes and its evolutionary plasticity.
In order to elucidate the principles that direct NSL targeting, here we have performed a detailed analysis of the NSL binding sites in the genome of Drosophila melanogaster. We tested whether the NSL complex binds differently in distinct cell types by comparing ChIP-seq profiles obtained from the salivary glands of third instar larvae and from the Schneider (S2) cell line; our analyses reveal that the repertoire of NSL-bound genes is highly similar between different cell types. Remarkably, by comparing NSL target genes with transcriptome data from 30 distinct developmental stages of Drosophila, we find that the NSL complex preferentially targets genes that are constitutively expressed, also referred to as housekeeping genes. Moreover, NSL-bound genes exhibit elevated levels of H3K4me2/3, H3K9ac and H4K16ac and display a distinctive arrangement of the nucleosome free region (NFR) as well as dispersed transcription initiation patterns. Going beyond the study of NSL complex localization, we could furthermore show that the NSL complex is required for optimal recruitment of Pol II and the pre-initiation complex to its target promoters. Finally, using a quantitative model of DNA-protein interaction affinities, we find that the presence of strong DRE motifs in NSL target promoters conveys an increased sensitivity for Pol II loss in cells lacking NSL1 or NSL3. Taken together, our observations reveal a unique promoter configuration that is indicative of NSL binding and establishes the NSL complex as an important transcriptional regulator of constitutively expressed genes in Drosophila.
Results/Discussion
NSL complex targets a core set of genes independently of cell type
Genome-wide mappings of two NSL components (NSL1 and MCRS2) were previously performed in the salivary glands of third instar larvae [21]. Here, in addition, we performed chromatin immunoprecipitation followed by high-throughput sequencing (ChIP-seq) analyses of two additional proteins, NSL3 and MBD-R2, using the Drosophila embryonic Schneider (S2) cell line. This strategy allowed us to study similarities and differences in DNA binding patterns of the NSL-complex members in tissues of different origins. Moreover, the use of S2 cells offered the possibility to directly compare our results with the publicly available data generated by the modENCODE project that uses the same cell type.
The four proteins displayed significant binding, ranging from 9,409 (NSL3) to 12,234 (MCRS2) genomic regions where peaks were detected (false-discovery rate <5%; statistics for individual proteins are provided in Table S1, for details on data processing see Materials and Methods). As shown in Figure S1A (dark and light blue columns), the majority of ChIP-seq peak summits localize within 800 bp of an annotated Transcription Start Site (TSS). The strongest binding signals (signified by high ChIP-seq tag counts) are observed within 200 bp of TSSs (Figure S1B, Figure 1A). We therefore focused our further analysis on NSL binding in TSS regions.

We defined a gene as NSL target when a ChIP-seq peak summit region (40 bp) was located within +/−200 bp of its TSS (see schematic representation, in Figure 1B). Using this criterion, we identified 4,233, 4,265, 5,435, and 5,321 promoters bound by NSL1, MCRS2, NSL3 and MBD-R2, respectively. Particularly in promoter-proximal regions, the binding profiles of NSL1, NSL3, MCRS2 and MBD-R2 are remarkably similar and also significantly overlap with previously published ChIP-chip profiles of WDS and MOF (Figure 1A). Despite the different developmental origins of the tissues used for the analysis of NSL1/MCRS2 and NSL3/MBD-R2, we observe that 78.7% (p-value<2.2 e-16; Fisher's exact test) of promoters with significant NSL signals are in common between the samples from S2 cells and larval salivary glands (Figure 1B). We identified a core set of 2,841 genes that are bound by all four NSL complex subunits, suggesting that the NSL proteins mostly operate as a single complex to regulate large numbers of genes in the Drosophila genome (Figure 1B, Figure S1C). Furthermore, ChIP followed by quantitative real time PCR (ChIP-qPCR) analysis of eight targets confirmed preferential binding of NSL proteins to the 5′-ends of genes (Figure 1C).
Given the similarity in binding between the subunits, subsequent analyses were based on the stringent core set of 2,841 genes that are bound by all four NSL proteins (thereafter called NSL-bound genes) unless otherwise indicated.
NSL complex targets are defined by an active chromatin state
We find that 68% and 66% of actively transcribed genes in S2 cells (based on expression analysis in [28]) are bound by NSL3 and MBD-R2, respectively (p-value<2.2e-16, Fisher's exact test); similar results were obtained for NSL1 and MCRS2 from salivary glands (Table S1, [21]). To assess the relationship between gene expression, chromatin state and NSL binding, we utilized the large set of histone modification data available from the modENCODE project (see Materials and Methods for accession numbers). Surprisingly, the patterns of histone acetylation and methylation markedly differed among expressed genes depending on the presence or absence of the NSL complex. While hallmarks of transcriptionally active promoters, H3K4me2, H3K4me3, H4K16ac and H3K9ac are present regardless of NSL binding, promoters that are bound by the NSL complex show an even greater enrichment of these marks compared with active promoters that lack NSL binding (Figure 2A). These enrichments of active histone marks cannot be explained by expression level differences between the two groups (Figure S2A).

The increased acetylation of H4K16 among NSL-bound genes is in agreement with the HAT activity of MOF. However, despite a recent report by Conaway and colleagues that showed that the human NSL/MOF complex can also catalyze H4K5 and H4K8 acetylation [19], we did not observe a similar enrichment of these histone marks on NSL-bound genes. One possible explanation is that the NSL/MOF complex in Drosophila may have different substrate-specificity for histone residues other than H4K16 compared with humans. Alternatively, since the H4K5 and H4K8 acetylation described above was detected using an in vitro system, these modifications may not arise from the primary activity of MOF in vivo. In summary, our results indicate that the NSL-complex-bound active genes are enriched for distinct sets of histone modifications when compared with active NSL-non-bound promoters.
To gain a more comprehensive understanding of the combinations of histone modifications found at NSL-bound promoters, we studied the distribution of NSL-bound and -non-bound promoters within the five principal chromatin types (chromatin colors) defined by the location maps of 53 chromatin proteins [29]. Within this model, the chromatin states “yellow” and “red” correspond to active genes, but differ in the combination of histone marks and chromatin binding proteins. Unexpectedly, we found a very significant enrichment of NSL-bound TSSs for the “yellow” chromatin state that is associated specifically with MRG15 and H3K36me3 (87.3% versus 18.2% for NSL-non-bound; p-value<2.2e-16; Fisher's exact test; see Figure 2B), but no comparable enrichment for the “red” chromatin state that is marked by chromatin proteins, such as Brahma, SU(VAR)2–10 and MED31 (9.7% of NSL-bound TSSs versus 8% of NSL-non-bound TSSs for “red”; Figure 2B). Our findings suggest the NSL complex as an additional, previously unknown marker of “yellow” chromatin while genes within “red” chromatin regions are expected to undergo NSL-independent transcriptional regulation.
A similar dominance for one specific state of active chromatin was observed when we repeated the analysis for the 9-chromatin-state model developed by Kharchenko and co-workers [30] (Figure 2C, Figure S2B), supporting the notion of the NSL complex as a regulator of a particular set of actively transcribed genes.
The NSL complex predominantly targets housekeeping genes
The results of the chromatin state analyses and the fact that most NSL binding appears to occur independently of the cell-type, prompted us to examine whether the complex displayed any association with housekeeping genes. To address this question, we defined a set of genes that are constitutively expressed throughout 30 distinct developmental stages of Drosophila [31] as our list of housekeeping genes (see Materials and Methods). We then generated heatmaps for Pol II and NSL binding centered on the TSSs of annotated genes [32] that were classified into three classes: constitutively expressed genes (see above), active genes but not expressed throughout all developmental stages of the fly [28], [31] and inactive genes. As shown in Figure 2D, the Pol II signal shows the anticipated enrichment downstream of the TSSs of active genes regardless of constitutive or tissue-specific expression. In striking contrast, the NSL binding profiles show a very prominent, almost exclusive enrichment around the TSSs of constitutively expressed genes but not among those active genes that show tissue-specific regulation. Accordingly, 91.6% of NSL3-bound genes, 89.6% of MBD-R2-bound genes and 85.5% of TSSs bound by all four NSLs concomitantly belong to the group of housekeeping genes (Table S1, inlay in Figure 2D). Conversely, out of 5,534 constitutively expressed genes, 4,950 (89.4%; p-value<2.2e-16, Fisher's exact test) were bound by at least one NSL protein (Figure S2C, S2D). This number is likely to be an underestimation as some of the constitutively expressed genes, which are classified as NSL-non-bound according to our strict criteria, also show detectable NSL protein signals (Figure S2E). Taken together, we concluded that the NSL complex preferentially binds to constitutively expressed genes.
NSL-bound promoters have dispersed transcription initiation patterns and distinct nucleosome organization
In addition to expression-based definitions of housekeeping genes, we wanted to test further correlations of NSL binding with characteristics of constitutively expressed genes. Earlier studies have revealed two basic types of Drosophila promoters based on the pattern of the transcriptional initiation: broad and peaked [33]–[36]. While broad promoters preferably belong to housekeeping genes, peaked promoters are associated with tissue-specific expression. Based on data from [35], we found that NSL-bound TSSs are predominantly associated with dispersed transcription initiation patterns (Figure 3A).
We next wanted to investigate whether the NSL-characteristic initiation patterns and histone modifications enrichments also connected to specific structural features of the chromatin. Genome-wide analyses of nucleosome-positioning have demonstrated that transcriptionally active genes display a distinct organization, consisting of a precisely located +1 nucleosome around 135 bp downstream of the TSS, a −1 nucleosome that is directly upstream of the TSS and a nucleosome free region (NFR) between them. Additionally, it has been shown that the nucleosome organization can vary quite dramatically depending on the promoter sequences and transcription initiation patterns [37], [38].
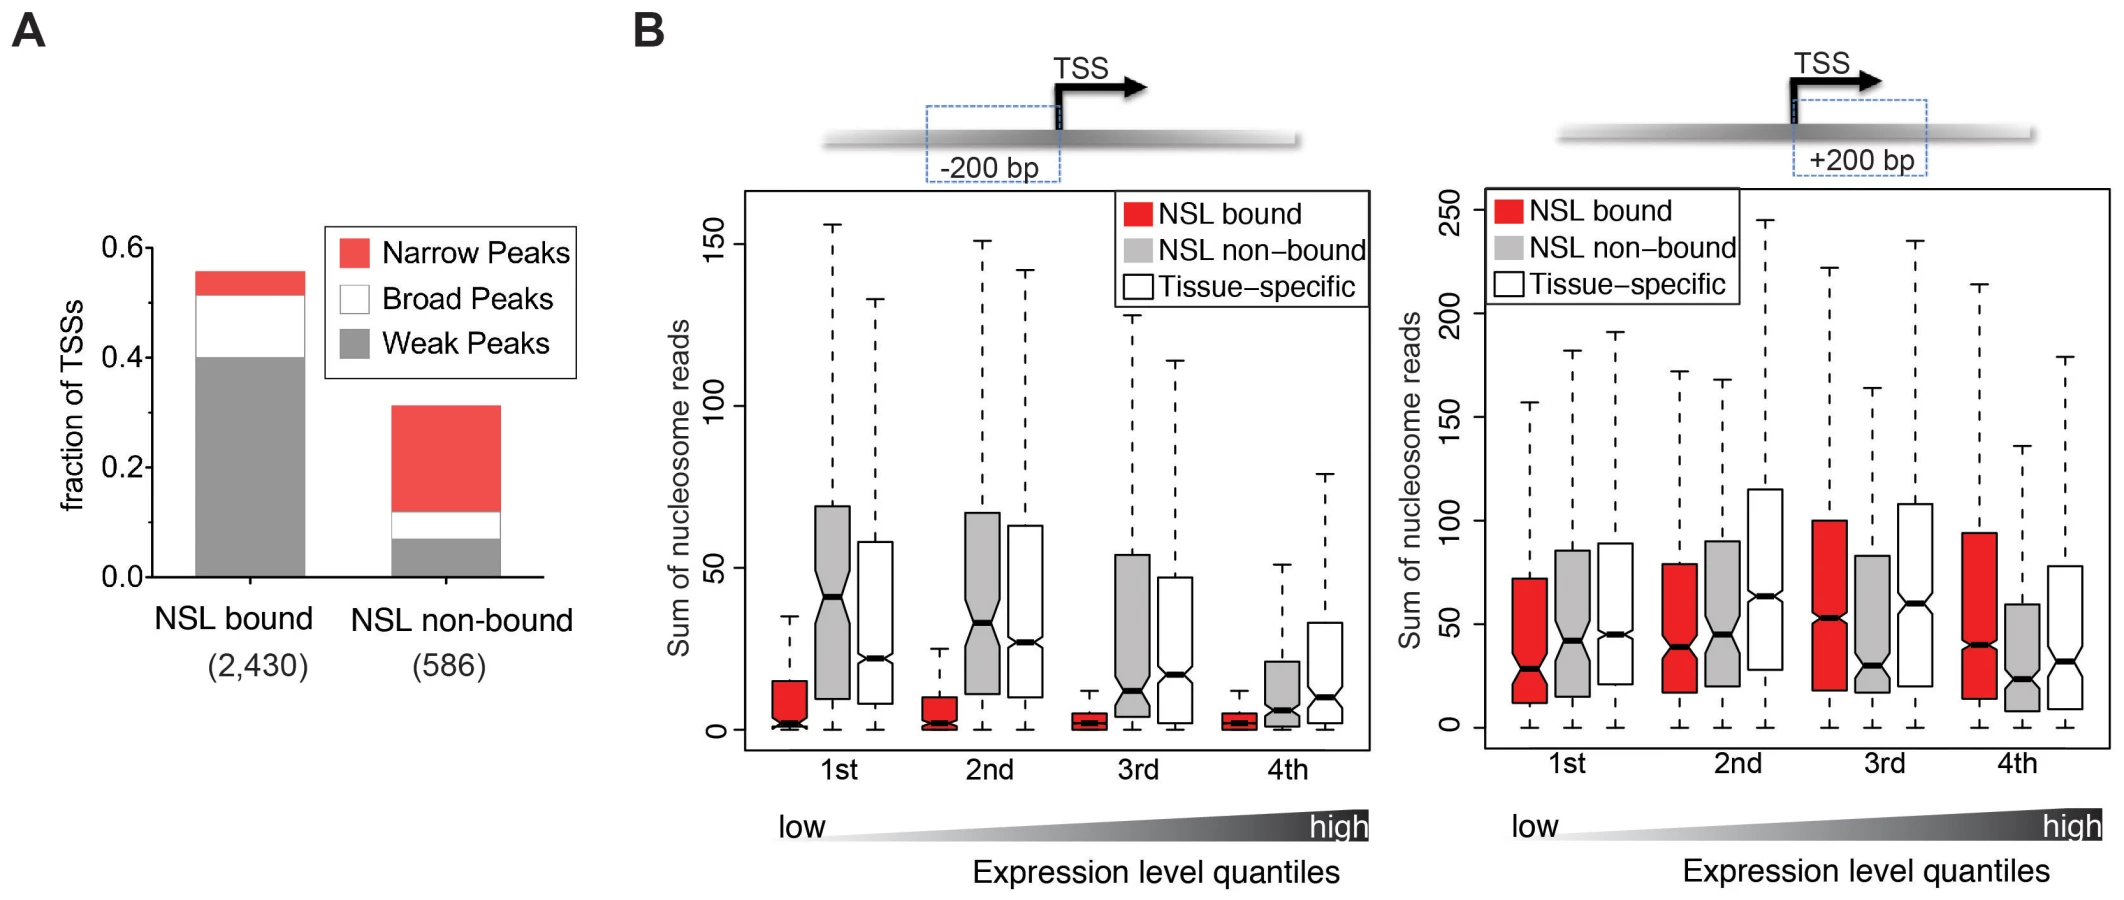
To assess whether NSL-bound promoters display a specialized nucleosome arrangement, we integrated a recently published map of nucleosome positions in S2 cells [38]. First, we examined the nucleosome occupancy for 4,950 constitutively expressed genes bound by at least one NSL protein, 717 constitutively expressed NSL-non-bound genes, and a set of 6,138 genes with tissue-specific expression (Figure S3; see Materials and Methods). For NSL-bound constitutively expressed genes we observe a well-defined nucleosome organization: Nucleosomes located within 200 bp upstream of the TSSs are strongly depleted while nucleosomes along the gene body are well positioned. In contrast, constitutively expressed genes not bound by the NSL complex (as well as tissue-specific genes) display a very different organization that is characterized by a less pronounced NFR and rather fuzzy positioning of the nucleosomes (Figure S3). This is in line with previous studies where more defined nucleosome positioning was associated with specific promoter sequences [37] and broad transcription initiation patterns [38].
The distinct nucleosome occupancies for NSL-bound genes prompted us to test if the observed difference in nucleosome positioning was related to gene expression levels. The analysis of the promoter proximal regions of NSL-bound, NSL-non-bound and tissue-specific genes revealed that the diminished nucleosome occupancy upstream of the TSS is, in fact, independent of the expression levels (Figure 3B).
NSL1 and NSL3 are required for efficient recruitment of Pol II on target promoters
Since the NSL complex predominately targets gene promoters, we next addressed whether its presence is important for the recruitment of RNA Polymerase II (Pol II). For this purpose, we first depleted NSL1, NSL3 and MBD-R2 in S2 cells by dsRNA-mediated depletion. The efficiency of the knockdown was assessed by Western blot analyses of nuclear or cytoplasmic extracts from the relevant cells (Figure S4A). Consistent with previous observations [21], NSL1 depletion had the most severe effect on the stability of NSL2, NSL3 and MCRS2. In contrast, MOF levels remained unaffected or at most showed a modest decrease upon MBD-R2 depletion. Interestingly, in comparison to the severe reduction of overall protein levels for NSL complex members, levels of Pol II, TBP and TFIIB showed almost no or only modest effects upon NSL1, NSL3 and MBD-R2 depletion.
We also assessed the quality of NSL1, NSL3 and MBD-R2 depletion by performing chromatin immunoprecipitation with NSL1, NSL3 and MBD-R2 antibodies in NSL-depleted versus control cells (dsRNA against GFP). Consistent with the Western blot analyses, the ChIP experiments revealed severe depletion of NSL1, NSL3 and MBD-R2 from target promoters (Figure S4B).
Following these quality criteria, we proceeded with genome-wide ChIP-seq analyses of Pol II in NSL1 - and NSL3 - depleted cells (Figure S5). As shown in Figure 4A, we obtained well-defined enrichments of Pol II binding at both the promoters and along the gene bodies of active genes in the GFP knockdown sample. The accumulation of Pol II at promoters is consistent with previous reports and indicative of widespread Pol II stalling [38]. When examining the global effects of the NSL knockdowns on Pol II levels, we observed a marked decrease in Pol II levels around transcription start sites (Figure 4B, 4C), particularly on genes that we had previously identified as bound by the NSL complex (Figure 4D). The loss of Pol II was even more pronounced in cells lacking NSL1 compared to those lacking NSL3. This effect could have been the consequence of different knockdown efficiencies of dsRNA against NSL1 and NSL3. Additionally, Western blot analyses of the individual NSL proteins revealed different effects of NSL1 and NSL3 depletion on NSL complex stability (see above and Figure S4A). Since protein levels of the other NSL complex members were either mildly affected or unaffected following the knockdown of NSL3, the remaining NSL complex members might have been able to partially continue transcriptional support in the absence of NSL3. This could explain the less severe effects of NSL3 depletion on Pol II binding compared to NSL1 depletion.

Regardless of the difference in the magnitude of Pol II reduction, both knockdowns showed greater effects on NSL-bound genes compared to NSL-non-bound active genes, suggesting that the NSL complex directly promotes the recruitment of Pol II to promoters of its target genes (Figure 4D, 4E). To assess whether the decrease of Pol II signal along the gene body could be attributed to elevated stalling of Pol II at the promoter, we calculated stalling indexes as described in [39] (see Materials and Methods). We could not detect a significant increase in the median stalling index (1.611 in GFP knockdown compared to 1.848 in NSL1 knockdown and 1.649 in NSL3 knockdown samples, p-value>0.1 as determined by Wilcoxon rank sum test, see Figure 4F). The unaffected stalling indexes suggest that NSL depletion does not interfere with the transition of Pol II from initiation to elongation. Taken together, these results strongly suggest that the NSL complex is required for efficient recruitment of Pol II at its target promoters.
NSL1, NSL3, and MBD-R2 are required for efficient recruitment of general transcription factors
Pol II recruitment to promoters is a multi-step process requiring the assembly of a functional pre-initiation complex (PIC). In the current model, the TFIID complex (containing TBP) first binds to core promoter regions where it is stabilized by TFIIA and TFIIB. TFIIF and Pol II are subsequently recruited to the core promoter by TFIIB [40], [41]. Since we had established a general role of the NSL complex for Pol II recruitment, we now sought to identify the specific initiation step that was affected by NSL depletion.
Our next step was to perform ChIP-qPCR studies of individual NSL target genes following the knockdown of NSL1, NSL3 or MBD-R2. The results revealed that both TBP and TFIIB binding was decreased at promoters, indicating an interruption in the early stage of PIC assembly (Figure 5). In contrast to NSL complex members, TBP and TFIIB protein levels did not show a severe reduction upon NSL1 and NSL3 knockdown (Figure S4A). Consistent with previous observations [21], we did not detect a major difference in H4K16ac levels upon NSL1, NSL3 or MBD-R2 knockdown, possibly due to remaining MOF protein, or slow turnover of H4K16ac or the nucleosomes (Figure S6). Taken together, these data suggests that NSL1, NSL3 and MBD-R2 are required for efficient recruitment of TBP/TFIIB to target promoters presumably for efficient PIC formation.

DRE and motif 1 are associated with Pol II loss caused by NSL depletion
Distinct classes of gene expression patterns, e.g. constitutive or tissue-specific gene expression, are associated with particular promoter DNA motifs. Yet, how the presence or absence of a DNA motif is translated into biological functions often remains elusive. Since the NSL complex preferentially binds housekeeping genes, we wanted to investigate putative underlying DNA motifs and associate them with the effects of NSL depletion on Pol II recruitment.
We first assessed which motifs were enriched in NSL target regions: The unbiased de novo motif finder MEME repeatedly identified four known core promoter elements within NSL peak regions: the E-box motif (CAGCTG), DRE (WATCGATW), the reverse complement of a motif resembling DMv2 (TGGYAACR [42]) and motif 1 (YGGTCCACTR [43]; Figure 6A, Figure S7). Applying a quantitative model of transcription factor binding affinities (TRAP) to the 10 well-known Drosophila core promoter motifs [43], [44], we detect a strong enrichment for DRE and E-box as well as Motifs 1, 6, 7, 8 in NSL-bound promoters compared with non-bound ones (p-values<0.0001, Wilcoxon rank sum test; Figure 6B, Figure S8). This is in complete concordance with previous genome-wide studies that suggested a preference of housekeeping genes for these motifs [34], [35].

We have shown that the NSL complex is crucial for Pol II recruitment to housekeeping genes. However, Figure 4E reveals variability in the extent of Pol II loss among genes with high NSL binding signals. This is in line with the observation published by Becker and colleagues [45]. One possible explanation could be that different core promoter motifs underlie the variable responses of NSL-bound genes to NSL loss. We thus assessed whether the motif strengths is associated with the impact of NSL depletion on Pol II recruitment. For this purpose, we stratified NSL-bound and –non-bound genes into three subsets according to the magnitude of Pol II loss on promoters and plotted the corresponding distribution densities for each motif's strength (Figure 6C, Figure S9).
Based on the equally strong enrichment of motif 1 and DRE (see Figure 6B) one might have expected a similar importance of these motifs for the function of the NSL complex. Interestingly, when we integrated the genome-wide Pol II binding data, we observed that DRE and motif 1 are associated with Pol II loss upon knockdown of NSL complex members in opposing manners: For the DRE motif we see a positive correlation between the levels of Pol II loss and the abundance of genes with high DRE TRAP scores. Motif 1, on the other hand, is mostly associated with genes that are least sensitive to Pol II loss after NSL depletion (light gray line in Figure 6C). For NSL-non-bound genes, neither DRE nor motif 1 show any enrichment in relation to Pol II loss. Enrichment of E-box and other core promoter motifs (except motif 7, Figure S9) do not exhibit a correlation with the sensitivity to NSL complex depletions.
In conclusion, our analysis demonstrates that NSL-bound promoters are enriched for core promoter motifs DRE, E-box and motif 1, 6, 7, 8 and depleted for TATA, Inr, DPE and MTE sequences. Even more importantly, the presence of DRE motifs is positively associated with the degree of responsiveness of NSL target genes to NSL complex depletion.
Summary
In this study, we have revealed that the majority of the NSL-complex-bound targets are housekeeping genes in Drosophila. While chromatin-modifying complexes that regulate tissue-specific genes, such as SAGA, polycomb and trithorax complexes, have been studied extensively, global regulators of housekeeping genes are poorly understood. To our knowledge, the NSL complex is the first identified major regulator of housekeeping genes which is consistent with a recently published study from Becker and colleagues [45].
The promoters of NSL target genes exhibit prominent enrichment of certain histone modifications (H4K16ac, H3K9ac, H3K4me2, H3K4me3) as well as specific core promoter elements (such as DRE, E-box and motif 1). Furthermore, these genes display distinct nucleosome occupancy and dispersed promoter configuration characterized by multiple transcription start sites. The correlation between these promoter characteristics (well-defined chromatin marks, TATA-less DNA sequences and broad initiation patterns) was previously identified for housekeeping genes in mammals and flies [36], but how these promoter features are translated into gene transcription had remained elusive. We now conclusively demonstrate that the NSL complex modulates transcription at the level of transcription initiation by facilitating pre-initiation complex loading onto promoters. Therefore, we propose that the NSL complex is a key trans-acting factor that bridges the promoter architecture, defined by the DNA sequence, histone marks and higher chromatin structures with transcription regulation of constitutive genes in Drosophila (Figure 7).

Excitingly, the enrichment of DNA motifs on NSL target gene promoters in combination with the genome-wide Pol II binding data has established functional links between the motifs enriched on housekeeping genes and the NSL-dependent Pol II binding to promoters. The abundance of DRE motifs, for example, was found to be positively associated with the magnitude of Pol II loss upon NSL knockdowns. The DRE binding factor (DREF) interacts tightly with TRF2 to modulate the transcription of DRE-containing promoters in a TATA-box-independent fashion [46]. It is tempting to speculate that the NSL complex might also cooperate with the TRF2 complex to facilitate transcription in a specific manner, rendering DRE-containing promoters more sensitive to NSL depletions. As the NSL-bound promoters are associated with a large variety of transcription factors, it will be of great interest to study whether the NSL complex communicates with different transcription regulators, perhaps making use of distinct mechanisms.
In contrast to DRE, motif 1 showed an opposing effect on Pol II recruitment to NSL-complex-bound genes as the presence of strong motif 1 sequences was associated with decreased Pol II loss upon NSL depletion. The mechanistic reasons for this remain unclear. However, one can envisage several possible scenarios. It is possible that motif 1 may recruit another transcription factor, which can also function to recruit the transcription machinery. Alternatively, the turnover of the transcription machinery might be slower on promoters containing strong motif 1 sequences. There is precedent for the transcription machinery having various turnover rates on different promoters. For example, in yeast, it has been shown that TBP turnover is faster on TATA-containing than on TATA-less promoters [47]. It is therefore possible that certain levels of the initiation complexes may still be maintained on motif-1-containing promoters, even though the recruitment of the transcription machinery will be compromised in the absence of NSL complex. Further work is required to understand the importance of sequence determinants for NSL complex recruitment and our analysis sets the grounds for targeted experiments in the future.
Taking MOF-mediated H4K16 acetylation into consideration, a putative role of the NSL complex might be to coordinate the opening of promoter architecture by histone acetylation and the assembly of PIC. Coupling of histone acetylation and PIC formation has been described before. For example, TAF1, a component of TFIID, is a histone aceyltransferase [48]. The SAGA complex, which contains Gcn5 and can acetylate H3K9, is reported to interact with TBP and other PIC components to regulate tissue-specific genes [49], [50] and the recruitment of P300 to the promoter and H3 acetylation have been shown to proceed binding of TFIID in a coordinated manner [51]. H4K16ac is also well-known for its role in transcription regulation of the male X chromosome, yet how H4K16 acetylation and PIC assembly are coordinated remains elusive. Interestingly, absence of the NSL complex does not severely abolish H4K16ac from target genes. Since the turnover of H4K16ac on target promoter is unknown, it remains possible that H4K16ac could remain for some time at the promoter after the NSL complex is depleted. Further studies will be crucial in unraveling the functional relevance of H4K16 acetylation and NSL complex function on housekeeping genes.
Materials and Methods
Chromatin immunoprecipitation (ChIP) and real-time PCR
Chromatin immunoprecipitation was carried out on S2 cells as previously described [21]. Fixed chromatin was sheared into 200 bp fragments and probed with antibodies against Drosophila TBP, TFIIB, Pol II, H4K16ac (sc8662, Santa Cruz), H4 (ab7311, Abcam), NSL1, MCRS2, NSL3 and MBD-R2 [21].
Real-time PCR validation was performed with SYBR-Green PCR master mix (Applied Biosystems) and an ABI7500 real-time PCR thermocycler (Applied Biosystems, Inc.). Recovery was determined as the amount of immunoprecipitated DNA relative to input DNA.
Deep sequencing of ChIP samples
Deep sequencing of NSL3 and MBD-R2 ChIP and input samples was carried out with the Illumina Genome Analyzer II, Pol II ChIP (from GFP-RNAi, NSL1-RNAi, NSL3-RNAi) and respective input samples were deep-sequenced with an Illumina HiSeq2000 machine according to manufacturer's instructions.
Mapping
The sequence reads from our earlier study of NSL binding in salivary glands [21] and the newly generated data from S2 cells were aligned to the D. melanogaster genome (dm3) using bowtie [52] with identical parameters. We allowed up to two mismatches and reported only the best alignments which could be aligned uniquely. We obtained 28,335,659 and 27,328,733 uniquely mapped reads for NSL3 and MBD-R2 respectively (input: 24,271,994 reads). The re-mapping of the NSL1 and MCRS2 data resulted in 7,622,096 and 9,405,874 unique reads (input: 6,168,473 reads).
From the samples sequenced with HiSeq 2000, we obtained between 120 to 135 million reads for Pol II ChIPs from S2 cells with knockdowns of NSL1, NSL3, and GFP and 50 to 60 million reads for the corresponding input samples. The correlations between the biological replicates of Pol II ChIP-seq reads from NSL1 and NSL3 knockdowns were excellent (Figure S5).
Peak calling
We used MACS Version 1.4.0rc2 on bed-files of mapped reads from the ChIP-seq experiments of NSL1, MCRS2, NSL3, MBD-R2, and an input control. We employed standard parameters for D. melanogaster (including model-building) and a p-value cut off of 10−5 [53]. We invoked PeakSplitter [54] as part of the MACS routine to obtain subpeak coordinates. For downstream analyses we used the subpeaks of peaks with a false discovery rate ≤5%. Unless noted otherwise, peak summit regions were henceforth defined as the 40 bp region surrounding a summit identified by PeakSplitter.
Previous ChIP-seq analyses of Pol II have revealed that there are at least two types of Pol II signals: a sharp peak around the TSS of genes that can be either expressed or stalled, and an additional wide-spread region of moderate enrichment over the body of genes which is associated with transcription elongation, pausing and termination. The composite nature of the Pol II signal is not captured optimally by MACS, therefore we normalized the read counts (per 25 bp bins) of the Pol II ChIP-seqs with the BioConductor package DESeq [55], calculated the log2 fold changes (log2FC) between library-size-normalized input and ChIP samples and applied a 400 bp sliding window to account for the fragment size obtained after sonication. To determine regions of significant Pol II enrichment we modeled the distribution of log2FC values based on negative log2FCs that are assumed to correspond to experimental noise. We calculated the threshold log2FC values for significant Pol II binding within the three different conditions at an FDR-value cut-off of 0.05 (method described in more detail in [56]). The threshold log2FCs were 0.64, 0.84 and 1.39 for Pol II signals from GFP-RNAi, NSL3-RNAi, and NSL1-RNAi, respectively.
Lists of genes and associated NSL peaks
The basis of our gene-focused analyses was the list of annotated genes from FlyBase (version 5.30). Genes that are active in S2 cells were obtained from [28]. Data from [31] was used for a list of constitutively active genes: 5,534 genes expressed above a significance threshold (set by [31]) in all 30 developmental stages of D. melanogaster were considered constitutively expressed (housekeeping genes). To identify genes that were active in S2 cells, but not constitutively expressed, the gene identifiers of the different lists were adapted with the help of the FlyBase ID converter tool and subsequently subtracted from each other.
Unless indicated otherwise, a TSS was defined NSL-bound when the 400 bp region surrounding the TSS overlapped with an NSL peak summit region. The scripts, BEDTool commands and Galaxy workflows used for these overlaps and analyses are available upon request [57], [58].
Calculation of Pol II stalling indexes
For the calculation of the stalling indexes we first applied stringent filters to the genes that were taken into account: we included only non-overlapping genes greater than 1,300 bp and with median Pol II signals above the threshold (see above) at the promoter region. Promoter regions were defined as TSS +/−200 bp, for the gene body regions we excluded 500 bp after the TSS and 500 bp before the transcription end site (TES) to avoid confounding effects of transcription initiation and termination. Based on previous reports by Muse et al. [39], the stalling index (SI) itself was calculated as follows: SI = log2(r (TSS)/r (gene body)) where r is the sum of Pol II ChIP-seq read counts that were adjusted by the input sample and normalized to the region's length.
Calculation of ΔPol II
To assess the change of Pol II upon NSL depletion in comparison to the GFP-RNAi control sample, ΔPol II was calculated as follows: ΔPol II = log2FC (NSL-RNAi)−log2FC (GFP-RNAi).
Graphical representations
We visualized the binding profiles of the NSL complex proteins with our locally installed GBrowser (Version 2.15), uploading normalized log2FCs and wiggle files from modEncode.
For the summary plots of the histone marks (Figure 2A), we extracted the log2FCs from publicly available ChIP-chip data: The 2,000 bp TSS regions were split into 100 bins and the average log2FCs were calculated for each bin and normalized to the corresponding H4 signals.
For the heatmaps shown in Figure 2D we divided the annotated genes (FlyBase version 5.30) into active and inactive in S2 cells [28]. Active genes were further classified as constitutively and not-constitutively transcribed according to [31] (see above). For each gene, we extracted the normalized log2FCs (ChIP/input) from our ChIP-seq data (NSL1, MCRS2, NSL3, MBD-R2) and published ChIP-chip data of Pol II [32] in 50 bp bins for 1,000 bp up - and downstream of the TSSs. The heatmaps were generated with R using the same scale for every individual image and maintaining the order of the underlying TSS lists to enable direct comparisons between the different binding profiles on the same genes. Mitochondrial genes were excluded.
For the heatmaps of Pol II and ΔPol II (Figure 4A, 4C) we used all D. melanogater genes except mitochondrial genes. The log2FC of Pol II from the GFP-RNAi sample and ΔPol II (see above) for NSL3-RNAi and NSL1-RNAi were extracted in 50 bp bins for the regions 500 bp up - and 1,500 bp downstream of each gene's TSS. Genes were sorted according to the cumulative signal within the displayed region as indicated in the respective figures and legends.
For the metagene profiles of Pol II and ΔPol II signals as shown in Figure 4B and 4D, gene bodies of non-overlapping, size-filtered genes were scaled to the same length; log2FCs (ChIP/input) were extracted accordingly. Venn diagrams were generated with Venny [59].
Nucleosome occupancy analysis
We measured nucleosome occupancy for constitutively expressed NSL-bound genes, constitutively expressed NSL-non-bound genes and tissue-specific genes in a 200 bp area surrounding their annotated TSSs (4,971, 717 and 6,138 genes respectively). Nucleosome maps for S2 cells were obtained from GEO (accession number: GSE22119 [38]). NSL-bound genes for this analysis were defined as those bound by any of the NSL1, NSL3, MCRS2 or MBD-R2 subunits. Constitutive genes were defined as in [31] (see above). Tissue-specific genes were selected as in [60] on the basis of the ‘gene scores’ derived from Affymetrix tiling arrays for 25 different cell lines and 30 developmental stages (modENCODE accession number: modENCODE_3305). In order to avoid any bias in nucleosome organization due to differences in gene expression levels, genes were stratified in quartiles according to their expression value (ArrayExpress: E-MEXP-150 [61]). Finally, for each gene, nucleosome occupancy was calculated as the sum of overlapping reads with a 200 bp area up - and downstream its TSS.
Nucleosome metaprofiles were calculated using the average sum of overlapping reads with 25 bp bins spanning the area 500 bp up - and 1000 bp downstream of the TSS of each gene.
MEME
We sorted the peaks identified by MACS and PeakSplitter according to their summits' tag counts and extracted the DNA sequences for a 100 bp region centered around them. The peak summits were analyzed by MEME [62] in subsequent analyses of 500 sequences each with the following parameters: revcomp, nmotifs = 3, minw = 6, maxw = 12, minsites = 10.
Motif enrichment: TRAP analysis
In addition to the de novo motif analysis by MEME, we studied sequence properties of NSL-targets using 10 motif matrices from the supplementary material of [43]. As transcription factors can bind to DNA with a range of affinities, we employed a biophysical model (TRAP [44], [63]) that predicts the binding affinity for a motif in a given sequence fragment. We refer to the logarithm of this number as the TRAP score that indicates the strength of the putative protein-DNA interaction for each Ohler motif within a region of interest. The TRAP score enables us to quantitatively assess the corresponding binding affinities, i.e. we do not rely on the binary classification of motif presence or absence. Instead we are able to compare the “protein binding capacity” of different regions of interest.
We applied the TRAP model to NSL binding sites and promoter regions, which we defined as +/−200 bp around the TSS. To assess the localization of the binding signals, more precisely, the TRAP score was calculated for sliding windows of 40 bp over this region. The average TRAP scores for each window were then compared between specific sets of promoters regions (NSL-targets and -non-targets).
To assess the relation between ΔPol II and the TRAP score (Figure 6C, Figure S9), we focused on the promoter regions of non-overlapping genes with median Pol II signal (log2FC) above the threshold value in GFP-RNAi and ΔPol II below 0 (i.e., loss of Pol II upon NSL knockdown). Tertiles based on ΔPol II were determined with the quantile function of R. We used a 100 bp window around the TSS for TRAP score calculation for all motifs except TATA (40 to 20 bp upstream of the TSS), Inr (TSS +/−20 bp), and DPE (20 to 40 bp downstream of the TSS). Density plots were generated with the R package ggplot2.
Chromatin state associations
We downloaded the bed-files with the genomic coordinates of the 9-state-chromatin model of [30] for S2 cells and the chromatin color model of [29] from modENCODE and identified the number of peak summits (2 bp) or TSSs intersecting with the different states. We also divided the peak summits into three groups according to their overlap with annotated TSSs: proximal (within +/−200 bp), peripheral (between +/−201–800 bp) and distal subpeaks (farther away than 800 bp).
Data from public repositories
For the analysis of histone marks and non-histone chromosome proteins, we downloaded the wiggle-files of ChIP-chip experiments on S2 cells from modEncode/Gene Expression Omnibus.
H3K4me3-S2: GSE20787
H3K4me2-S2: GSE23470
H4K16ac-S2: GSE20799
H3K27me2-TJ.S2: GSE27790
H3K9ac-S2: GSE20790
H4K5ac-S2: GSE20800
H3K18ac-S2. GSE20775
MOF_Q4145.S2: GSE27806
WDS_Q2691.S2: GSE 20835
H4: repset.4620571
Pol II: GSM463297
Nucleosome maps: GSE22119
S2 gene expression data for nucleosome occupancy: E-MEXP-1505 [61]
Primers used for qPCR
L = forward primer, R = reverse primer.
CG6506-pro-L: GCCGATGTTTACCGACAATC
CG6506-pro-R: CATGGTTGGTTATCGGGACT
CG6506-Mid-L: ATCCGTGCCTAATGATACCG
CG6506-Mid-R: ACGGTTGGTGTGAACCAAAT
CG6506-end-L: ACAGTCAGCTCCCAGCAGAT
CG6506-end-R: AAAGTGGCGTGAAAGTTGCT
Sec5-pro-L: GCTGCTCAGCAAGGAGACTT
Sec5-Pro-R: CGGACGAGCATAAAAAGAGC
Sec5-mid-L: GAACTCCCATTGGCGATAAA
Sec5-mid-R: AAATGTCTGGCGAAATGTCC
Sec5-end-L: ATCAACGGCTTCATCTTTCG
Sec5-end-R: GCGTTTTCTTCCATTTTCCA
ODSH-Pro-L: CCCATTTTTCCCACTGACTG
ODSH-Pro-R: GGCGCGTACAAATGAAAAAT
ODSH-Mid-L: AAGATCCGCTAAGCGATGAA
ODSH-Mid-R: GCCAGGAGTTGAAGTTGGTC
ODSH-End-L: AGGCTCTCGTGGGGTAAAAT
ODSH-End-R: GAGCTCACCGATTTGTTTCC
CG15011-pro-L: CAGCCCTGGTATTCGATGTT
CG15011-pro-R: CTCATCTTGGATCGGATCGT
CG15011-Mid-L: CCTGCCACAAGGAACACTTT
CG15011-Mid-R: AGCTGCAACAAGCACAAATG
CG15011-end-L: ACACGGTGTTCTTCCAGTCC
CG15011-end-R: CGCTAAGGAACGTCGAAATC
CG14872_Pro_L: AATCGAGACATTCAGGCACTC
CG14872_Pro_R: TTCCCACACTGAAAAATCCA
CG14872_Mid_L: AAGAGCTTGAACAGCGGAAC
CG14872_Mid_R: GATACGCAAACCGGCATC
CG14872_End_L: TCACGCTCTAAAACCCCAGA
CG14872_End_R: CAGTACGGCATGGGCAAC
Patj_Pro_L: GAGTGCATAGGAGAGGGTAAACA
Patj_Pro_R: GTGGCGTTGGCACACTTT
Patj_Mid_L:CGTCGGTCACCACAATGA
Patj_Mid_R: TTATCCGCCAAGGGTACAAC
Patj_End_L: ACGCGGTTGCTAACTAATGG
Patj_End_R: ACTTCTGGCATCGTTTCTGAC
tho2_Pro_L: CCTCGGATCAGGTGGTACA
tho2_Pro_R: GTCACACTGGCGGAACTAACT
tho2_Mid_L: GGCCACATCCGTGTTTATGT
tho2_Mid_R: GCCAAGACACACTCGTCCA
tho2_End_L: GCTTCACAATGCACGGAAC
tho2_End_R: GAGGAGCGGCAGTACATCA
Ent2_Pro_L: CGTAACGGCACCCCTCAA
Ent2_Pro_R: ACCGCACCGCACTACAAG
Ent2_Mid_L: CCGCCATCCTAGTGCTGCT
Ent2_Mid_R: GCTGCTCCGGCTAATGGT
Ent2_End_L: TCTCGTATCTGGGACCATTTT
Ent2_End_R: TCCCGGAACTGGTATTGAG
Bap170_Pro_L: CCTGCTCGTGAATGCAACT
Bap170_Pro_R: GTGGCGTGAATGGGAAAC
Bap170_Mid_L: ACCCCCAGCATTGTTCCT
Bap170_Mid_R: CTTTCCTCAGACGCCACTTC
Bap170_End_L: ATGAACCGACACACGACTGA
Bap170_End_R: GCCGTAGCCGAGTAGGTGA
Incenp_Pro_L: GTTCTTTCCCTTACCATTTTCC
Incenp_Pro_R: GTTCCCGCCACTACCATCT
Incenp_Mid_L: GAGGACGAGTCGGTGGAG
Incenp_Mid_R: TTGAAAAGCTCATGTGTACGG
Incenp_End_L: GCCACGTAAGGGGAGAGG
Incenp_End_R: GTTCGGGAATATCTGCTTTAGG
ns4_Pro_L: GAGATGCCAACTTGTAGGTGATT
ns4_Pro_R: AAATACATGCAGAGACAGGAGGT
ns4_Mid_L: GCAAGGTGGTCAGCGTTAGT
ns4_Mid_R: GACTAGACCGGGACAATCACA
ns4_End_L: GACAGCGAGGATGAAGACGA
ns4_End_R: CAGCAGAGCAAACACGTTCC
CG5098-Pro-L: GGTCTTGTTTATGGGCGAAA
CG5098-Pro-R: GAGGGAAAGGCGACCTAATC
CG5098-Mid-L: GATGAGCCTCCCAAAAATCA
CG5098-Mid-R: GGCTACTTTGGCTGCTATGC
CG5098-End-L: GGGCATTTCGTAATCCAAGA
CG5098-End-R: TTTGGGGAAGGGAACCTAAC
p5cr_Pro_L: CACACCAAAGCTCAGAGGAGT
p5cr_Pro_R: CCGATTGCATGGGCGTAG
p5cr_Mid_L: GCGAGGGCTGCACTGTTT
p5cr_Mid_R: TGGACTCGGGCACCTGTT
p5cr_End_L: ATGTAATCCCCCGGAACA
p5cr_End_R: GCAAGAAGGATCGGGAATAA
CG4406-pro-R: TATCGACGGTCACACTGCTC
CG4406-mid-L: CCTGGAACTTGAGGAATCCA
CG4406-mid-R: GGCAGCAATGTGCTCATCTA
CG4406-end-L: AGCTCGGAAGGAAACTGTGA
CG4406-end-R: GTGACCAAAAAGCCCTTCAA
RNAi in S2 cells
RNAi of S2 cells was performed as described previously [21]. All knockdown cells were transfected with 10 µg dsRNA against NSL1, NSL3, MBD-R2 or GFP using Lipofectamine RNAiMAX (Invitrogen) and were harvested after 6 days. EGFP control RNAi experiments were performed in parallel.
RNAi sequences used to generate dsRNA for the following genes
NSL1:
T7-NSL1 sense: 5′ - TTA ATA CGA CTC ACT ATA GGG AGA ATG GCC CCA GCG CTC ACA-3′
T7-NSL1 antisense: 5′ - TTA ATA CGA CTC ACT ATA GGG AGA TGA ACT TGT GGC CAC TGC C-3′
NSL3:
T7-NSL3 sense: 5′ - TTA ATA CGA CTC ACT ATA GGG AGA TCC TTG GCG ACT ACC TCA TC-3′
T7-NSL3 antisense: 5′ - TTA ATA CGA CTC ACT ATA GGG AGA GTA CCA TTT CGG CCC CTA GTG-3′
MBD-R2:
T7-MBD-R2 sense: 5′ - TTA ATA CGA CTC ACT ATA GGG AGA CGC TGG CCA CGT TTA TTA AG-3′
T7-MBD-R2 antisense: 5′ - TTA ATA CGA CTC ACT ATA GGG AGA TTG AAG AGA AAA AGC TTG TAC GG-3′
EGFP:
T7-EGFP sense: 5′-TA ATA CGA CTC ACT ATA GGG AGG ATG GTG AGC AAG G
T7-EGFP antisense: 5′-TA ATA CGA CTC ACT ATA GGG AGG ATC GCG CTT CTC G
Accession numbers
All ChIP seq data is available in the ArrayExpress database (http://www.ebi.ac.uk/arrayexpress/) with the accession numbers listed below.
NSL1 and MCRS2 ChIP-Seq from salivary glands: E-MTAB-214
NSL3 and MBD-R2 ChIP-Seq from S2 cells: E-MTAB-1085
Pol II ChIP-Seq from S2 cells (GFP-RNAi, NSL1-RNAi, NSL3-RNAi): E-MTAB-1084
Supporting Information
Zdroje
1. Juven-GershonTKadonagaJT 2010 Regulation of gene expression via the core promoter and the basal transcriptional machinery. Dev Biol 339 225 229
2. KouzaridesT 2007 Chromatin modifications and their function. Cell 128 693 705
3. YangXJSetoE 2007 HATs and HDACs: from structure, function and regulation to novel strategies for therapy and prevention. Oncogene 26 5310 5318
4. JacobsonRHLadurnerAGKingDSTjianR 2000 Structure and function of a human TAFII250 double bromodomain module. Science 288 1422 1425
5. RuthenburgAJLiHMilneTADewellSMcGintyRK 2011 Recognition of a mononucleosomal histone modification pattern by BPTF via multivalent interactions. Cell 145 692 706
6. LugerKMaderAWRichmondRKSargentDFRichmondTJ 1997 Crystal structure of the nucleosome core particle at 2.8 A resolution. Nature 389 251 260
7. Shogren-KnaakMIshiiHSunJMPazinMJDavieJR 2006 Histone H4-K16 acetylation controls chromatin structure and protein interactions. Science 311 844 847
8. ShahbazianMDGrunsteinM 2007 Functions of site-specific histone acetylation and deacetylation. Annu Rev Biochem 76 75 100
9. VettingMWLPSdCYuMHegdeSSMagnetS 2005 Structure and functions of the GNAT superfamily of acetyltransferases. Arch Biochem Biophys 433 212 226
10. UtleyRTCoteJ 2003 The MYST family of histone acetyltransferases. Curr Top Microbiol Immunol 274 203 236
11. LeeKKWorkmanJL 2007 Histone acetyltransferase complexes: one size doesn't fit all. Nat Rev Mol Cell Biol 8 284 295
12. GrantPASchieltzDPray-GrantMGStegerDJReeseJC 1998 A subset of TAF(II)s are integral components of the SAGA complex required for nucleosome acetylation and transcriptional stimulation. Cell 94 45 53
13. SuganumaTGutierrezJLLiBFlorensLSwansonSK 2008 ATAC is a double histone acetyltransferase complex that stimulates nucleosome sliding. Nat Struct Mol Biol 15 364 372
14. HuisingaKLPughBF 2004 A genome-wide housekeeping role for TFIID and a highly regulated stress-related role for SAGA in Saccharomyces cerevisiae. Mol Cell 13 573 585
15. LebedevaLANabirochkinaENKurshakovaMMRobertFKrasnovAN 2005 Occupancy of the Drosophila hsp70 promoter by a subset of basal transcription factors diminishes upon transcriptional activation. Proc Natl Acad Sci U S A 102 18087 18092
16. KrebsARDemmersJKarmodiyaKChangNCChangAC 2010 ATAC and Mediator coactivators form a stable complex and regulate a set of non-coding RNA genes. EMBO Rep 11 541 547
17. NagyZRissAFujiyamaSKrebsAOrpinellM 2010 The metazoan ATAC and SAGA coactivator HAT complexes regulate different sets of inducible target genes. Cell Mol Life Sci 67 611 628
18. SuganumaTMushegianASwansonSKAbmayrSMFlorensL 2010 The ATAC acetyltransferase complex coordinates MAP kinases to regulate JNK target genes. Cell 142 726 736
19. CaiYJinJSwansonSKColeMDChoiSH 2010 Subunit composition and substrate specificity of a MOF-containing histone acetyltransferase distinct from the male-specific lethal (MSL) complex. J Biol Chem 285 4268 4272
20. MendjanSTaipaleMKindJHolzHGebhardtP 2006 Nuclear pore components are involved in the transcriptional regulation of dosage compensation in Drosophila. Mol Cell 21 811 823
21. RajaSJCharapitsaIConradTVaquerizasJMGebhardtP 2010 The nonspecific lethal complex is a transcriptional regulator in Drosophila. Mol Cell 38 827 841
22. StraubTBeckerPB 2007 Dosage compensation: the beginning and end of generalization. Nat Rev Genet 8 47 57
23. HallacliEAkhtarA 2009 X chromosomal regulation in flies: when less is more. Chromosome Res 17 603 619
24. ConradTAkhtarA 2011 Dosage compensation in Drosophila melanogaster: epigenetic fine-tuning of chromosome-wide transcription. Nat Rev Genet 13 123 134
25. AndersenDSRajaSJColombaniJShawRLLangtonPF 2010 Drosophila MCRS2 associates with RNA polymerase II complexes to regulate transcription. Mol Cell Biol 30 4744 4755
26. PrestelMFellerCStraubTMitlohnerHBeckerPB 2010 The activation potential of MOF is constrained for dosage compensation. Mol Cell 38 815 826
27. LiXWuLCorsaCAKunkelSDouY 2009 Two mammalian MOF complexes regulate transcription activation by distinct mechanisms. Mol Cell 36 290 301
28. CherbasLWillinghamAZhangDYangLZouY 2011 The transcriptional diversity of 25 Drosophila cell lines. Genome Res 21 301 314
29. FilionGJvan BemmelJGBraunschweigUTalhoutWKindJ 2010 Systematic protein location mapping reveals five principal chromatin types in Drosophila cells. Cell 143 212 224
30. KharchenkoPVAlekseyenkoAASchwartzYBMinodaARiddleNC 2011 Comprehensive analysis of the chromatin landscape in Drosophila melanogaster. Nature 471 480 485
31. GraveleyBRBrooksANCarlsonJWDuffMOLandolinJM 2011 The developmental transcriptome of Drosophila melanogaster. Nature 471 473 479
32. NechaevSFargoDCdos SantosGLiuLGaoY 2010 Global analysis of short RNAs reveals widespread promoter-proximal stalling and arrest of Pol II in Drosophila. Science 327 335 338
33. RachEAYuanHYMajorosWHTomancakPOhlerU 2009 Motif composition, conservation and condition-specificity of single and alternative transcription start sites in the Drosophila genome. Genome Biol 10 R73
34. HoskinsRALandolinJMBrownJBSandlerJETakahashiH 2011 Genome-wide analysis of promoter architecture in Drosophila melanogaster. Genome Res 21 182 192
35. NiTCorcoranDLRachEASongSSpanaEP 2010 A paired-end sequencing strategy to map the complex landscape of transcription initiation. Nat Methods 7 521 527
36. RachEAWinterDRBenjaminAMCorcoranDLNiT 2011 Transcription initiation patterns indicate divergent strategies for gene regulation at the chromatin level. PLoS Genet 7 doi:10.1371/journal.pgen.1001274 e1001274
37. MavrichTNJiangCIoshikhesIPLiXVentersBJ 2008 Nucleosome organization in the Drosophila genome. Nature 453 358 362
38. GilchristDADos SantosGFargoDCXieBGaoY 2010 Pausing of RNA polymerase II disrupts DNA-specified nucleosome organization to enable precise gene regulation. Cell 143 540 551
39. MuseGWGilchristDANechaevSShahRParkerJS 2007 RNA polymerase is poised for activation across the genome. Nat Genet 39 1507 1511
40. Juven-GershonTHsuJYTheisenJWKadonagaJT 2008 The RNA polymerase II core promoter - the gateway to transcription. Curr Opin Cell Biol 20 253 259
41. PughBF 1996 Mechanisms of transcription complex assembly. Curr Opin Cell Biol 8 303 311
42. FitzGeraldPCSturgillDShyakhtenkoAOliverBVinsonC 2006 Comparative genomics of Drosophila and human core promoters. Genome Biol 7 R53
43. OhlerULiaoGCNiemannHRubinGM 2002 Computational analysis of core promoters in the Drosophila genome. Genome Biol 3 RESEARCH0087
44. Thomas-ChollierMHuftonAHeinigMO'KeeffeSMasriNE 2011 Transcription factor binding predictions using TRAP for the analysis of ChIP-seq data and regulatory SNPs. Nat Protoc 6 1860 1869
45. FellerCPrestelMHartmannHStraubTSodingJ 2012 The MOF-containing NSL complex associates globally with housekeeping genes, but activates only a defined subset. Nucleic Acids Res 40 1509 1522
46. HochheimerAZhouSZhengSHolmesMCTjianR 2002 TRF2 associates with DREF and directs promoter-selective gene expression in Drosophila. Nature 420 439 445
47. van WervenFJvan TeeffelenHAHolstegeFCTimmersHT 2009 Distinct promoter dynamics of the basal transcription factor TBP across the yeast genome. Nat Struct Mol Biol 16 1043 1048
48. MizzenCAYangXJKokuboTBrownellJEBannisterAJ 1996 The TAF(II)250 subunit of TFIID has histone acetyltransferase activity. Cell 87 1261 1270
49. SermwittayawongDTanS 2006 SAGA binds TBP via its Spt8 subunit in competition with DNA: implications for TBP recruitment. EMBO J 25 3791 3800
50. WarfieldLRanishJAHahnS 2004 Positive and negative functions of the SAGA complex mediated through interaction of Spt8 with TBP and the N-terminal domain of TFIIA. Genes Dev 18 1022 1034
51. BlackJCChoiJELombardoSRCareyM 2006 A mechanism for coordinating chromatin modification and preinitiation complex assembly. Mol Cell 23 809 818
52. LangmeadBTrapnellCPopMSalzbergSL 2009 Ultrafast and memory-efficient alignment of short DNA sequences to the human genome. Genome Biol 10 R25
53. ZhangYLiuTMeyerCAEeckhouteJJohnsonDS 2008 Model-based analysis of ChIP-Seq (MACS). Genome Biol 9 R137
54. Salmon-DivonMDvingeHTammojaKBertoneP 2010 PeakAnalyzer: genome-wide annotation of chromatin binding and modification loci. BMC Bioinformatics 11 415
55. AndersSHuberW 2010 Differential expression analysis for sequence count data. Genome Biol 11 R106
56. ConradTCavalliFMHolzHHallacliEKindJ 2012 The MOF chromobarrel domain controls genome-wide H4K16 acetylation and spreading of the MSL complex. Dev Cell 22 610 624
57. GoecksJNekrutenkoATaylorJ 2010 Galaxy: a comprehensive approach for supporting accessible, reproducible, and transparent computational research in the life sciences. Genome Biol 11 R86
58. QuinlanARHallIM 2010 BEDTools: a flexible suite of utilities for comparing genomic features. Bioinformatics 26 841 842
59. OliverosJC 2007 VENNY. An interactive tool for comparing lists with Venn Diagrams
60. VaquerizasJMKummerfeldSKTeichmannSALuscombeNM 2009 A census of human transcription factors: function, expression and evolution. Nat Rev Genet 10 252 263
61. KindJVaquerizasJMGebhardtPGentzelMLuscombeNM 2008 Genome-wide analysis reveals MOF as a key regulator of dosage compensation and gene expression in Drosophila. Cell 133 813 828
62. BaileyTLWilliamsNMislehCLiWW 2006 MEME: discovering and analyzing DNA and protein sequence motifs. Nucleic Acids Res 34 W369 373
63. RoiderHGMankeTO'KeeffeSVingronMHaasSA 2009 PASTAA: identifying transcription factors associated with sets of co-regulated genes. Bioinformatics 25 435 442
64. BaileyTLElkanC 1994 Fitting a mixture model by expectation maximization to discover motifs in biopolymers. Proc Int Conf Intell Syst Mol Biol 2 28 36
65. TomancakPBermanBPBeatonAWeiszmannRKwanE 2007 Global analysis of patterns of gene expression during Drosophila embryogenesis. Genome Biol 8 R145
Štítky
Genetika Reprodukční medicínaČlánek vyšel v časopise
PLOS Genetics
2012 Číslo 6
- Kazuistika – Perspektivy využití precizované medicíny v rámci personalizované specifické terapie onkologických pacientů
- Nobelova cena za chemii pro genetické nůžky: Objev, který změní naši budoucnost?
- Technologie na bázi RNA v klinické praxi: od přebarvených petúnií k terapii vzácných a dosud jen obtížně léčitelných chorob u lidí
- „Nepředstavovali jsme si, že náš výzkum povede přímo ke vzniku nových léků, dokonce ještě za našeho života“
- Bezplatné služby pro diagnostiku ATTRv amyloidózy pro kardiology
Nejčtenější v tomto čísle
- Rumors of Its Disassembly Have Been Greatly Exaggerated: The Secret Life of the Synaptonemal Complex at the Centromeres
- The NSL Complex Regulates Housekeeping Genes in
- Tipping the Balance in the Powerhouse of the Cell to “Protect” Colorectal Cancer
- Interplay between Synaptonemal Complex, Homologous Recombination, and Centromeres during Mammalian Meiosis
Zvyšte si kvalifikaci online z pohodlí domova
Mazová zátka a její řešení
nový kurzVšechny kurzy