
Adaptive Introgression across Species Boundaries in Butterflies
It is widely documented that hybridisation occurs between many closely related species, but the importance of introgression in adaptive evolution remains unclear, especially in animals. Here, we have examined the role of introgressive hybridisation in transferring adaptations between mimetic Heliconius butterflies, taking advantage of the recent identification of a gene regulating red wing patterns in this genus. By sequencing regions both linked and unlinked to the red colour locus, we found a region that displays an almost perfect genotype by phenotype association across four species, H. melpomene, H. cydno, H. timareta, and H. heurippa. This particular segment is located 70 kb downstream of the red colour specification gene optix, and coalescent analysis indicates repeated introgression of adaptive alleles from H. melpomene into the H. cydno species clade. Our analytical methods complement recent genome scale data for the same region and suggest adaptive introgression has a crucial role in generating adaptive wing colour diversity in this group of butterflies.
Published in the journal:
. PLoS Genet 8(6): e32767. doi:10.1371/journal.pgen.1002752
Category:
Research Article
doi:
https://doi.org/10.1371/journal.pgen.1002752
Summary
It is widely documented that hybridisation occurs between many closely related species, but the importance of introgression in adaptive evolution remains unclear, especially in animals. Here, we have examined the role of introgressive hybridisation in transferring adaptations between mimetic Heliconius butterflies, taking advantage of the recent identification of a gene regulating red wing patterns in this genus. By sequencing regions both linked and unlinked to the red colour locus, we found a region that displays an almost perfect genotype by phenotype association across four species, H. melpomene, H. cydno, H. timareta, and H. heurippa. This particular segment is located 70 kb downstream of the red colour specification gene optix, and coalescent analysis indicates repeated introgression of adaptive alleles from H. melpomene into the H. cydno species clade. Our analytical methods complement recent genome scale data for the same region and suggest adaptive introgression has a crucial role in generating adaptive wing colour diversity in this group of butterflies.
Introduction
Closely related species often hybridise through incomplete barriers to gene flow, but the evolutionary consequences of such genetic interchange remain a matter of debate [1], [2], [3], [4], [5], [6]. This is primarily because hybridisation is considered unlikely to introduce useful genetic variation [1], [4], [5], [7]. Alleles that cross species boundaries may be neutral in their effects [7] or, perhaps most commonly, natural selection will prevent the introgression of foreign genetic material into a genetic background that is already well adapted [8]. However, sometimes, introgression may be favoured if the region gained confers advantages to the recipient species [5]. Although such favourable gene combinations may be produced only rarely, they might still contribute important variation for adaptive change. Importantly, hybridisation is a potential source of novel alleles already tested by natural selection that would be unlikely to arise through mutation alone.
In organisms other than bacteria, evidence for adaptive introgression in nature is scarce [9], [10]. Nonetheless, several remarkable examples in plants have demonstrated adaptive introgression, for example in transferring herbivore resistance in Helianthus [5], flood tolerance in Iris [11] and the gene controlling rayed flowers in Senecio vulgaris [12]. In animals, examples include adaptive introgression of melanism from domestic dogs into North American wolves [13] and warfarin pesticide resistance in European house mice, gained from the Algerian mouse [14]. Nonetheless, these examples all represent a single instance of transfer of a trait, often in association with environments showing significant levels of human intervention. A more pervasive role for introgression in recent adaptive radiations has been postulated, for example in Darwin's finches and sailfins [15], [16], but convincing genetic evidence for introgression of specific adaptive traits is still missing in these systems.
Heliconius butterflies display a striking radiation in adaptive wing patterns, facilitated by Müllerian mimicry between distantly related species and coupled with divergence between closely related species [17]. These butterflies frequently hybridise across species boundaries [18], [19], and it has been hypothesised that introgression might play an important role in speciation and adaptive radiation. In particular two closely related species groups, Heliconius melpomene and Heliconius cydno are known to hybridise occasionally, and genetic evidence indicates a low level of ongoing gene flow [20], [21]. H. melpomene has radiated into almost 30 geographical colour pattern races across Central and South America [22], broadly falling into two main phenotypes, which we here refer to as the red-banded type (presence of a red band or patch in the forewing controlled by the B allele, regardless of hind wing phenotype) and the rays type (orange forewing basal patch and orange rays in the hind wing). The sister clade to H. melpomene includes the species Heliconius cydno, H. pachinus, H. timareta and H. heurippa, jointly referred to hereafter as the H. cydno clade [23]. The former two species are typically black with white or yellow elements [22], while the latter two species exhibit patterns similar to those of H. melpomene [23], [24]. We have previously suggested that the presence of red phenotype elements in these H. cydno affiliates, that is H. heurippa and H. timareta, could be the result of the acquisition of mimicry colour patterns via adaptive introgression from H. melpomene [3], [19], [24], and in the case of H. heurippa have provided DNA sequence evidence in support of this transfer [25]. However, these phenotypic patterns could also be explained if red variants were either ancestral, with multiple subsequent trait losses in the H. cydno clade, or if they had independent origins in both H. melpomene and the red H. cydno affiliates, specifically H. timareta and H. heurippa [26].
In H. melpomene the HmB locus controls variation in red colour patterns [27], [28], a trait under strong natural selection [29], [30]. Genomic analysis of this region has identified clear peaks of genetic divergence between adjacent races of H. melpomene associated with variation in red phenotypes [25], [28], [31]. In H. melpomene, the strongest divergence lies in a non-coding region in between a kinesin gene and the transcription factor optix [31]. The latter is the strongest candidate gene so far for the red locus [32], and its expression shows a perfect association with red wing colour elements in a wide range of geographical races of H. melpomene and its co-mimics H. erato, prefiguring in both species the forewing red band, the dennis orange patch and the hind wing rays [32].
Having such information provides an excellent opportunity to explicitly test the introgression hypothesis for red wing patterns across the broader H. melpomene/H. cydno species complex. Here, we specifically examine the phylogenetic history of divergent and convergent colour pattern races of H. melpomene, H. cydno, H. timareta and H. heurippa and ask how this history varies between loci linked and unlinked to colour pattern. The data allows us to understand the origins of adaptive colouration and ask whether similar wing patterns have multiple independent origins, or arose once within the complex and crossed species boundaries. Thus, we provide an explicit test of the hypothesis that hybridisation has repeatedly contributed to an adaptive radiation. This study was carried out alongside a genome-wide study of a subset of the taxa included here [33]. The analyses presented here on smaller gene regions, sequenced across a much larger set of taxa, permit a different set of analytical tools to be used to test for the extent and direction of introgression.
Results
We analysed 221 haplotypes from nine loci (Table S1), sampled from 111 individuals in five species (Figure 1). Three loci (the mitochondrial fragment COI and nuclear GAPDH and Hsp90) were unlinked to colour pattern, whereas the remaining six loci were sampled across the genomic interval modulating red pattern variation, specifically where the highest genetic divergence peaks associated with variation in red phenotypes have been found in H. melpomene [31]. Analysis of molecular variance in the mitochondrial fragment COI showed population structure largely explained by species relationships (∼47%) and geography (∼30%) but less by colour phenotype (Table 1). Phylogenetic analysis supports three monophyletic clades: (i) H. cydno-H. timareta, (ii) H. melpomene from the Pacific and the Atlantic coast, and (iii) H. melpomene from the Amazonas and the Andes (Figure 2).


In previous studies, nuclear markers showed varying degrees of clustering by species, with some loci showing mutual monophyly between the H. melpomene and H. cydno clade species, while others showed substantial allele sharing among species [20], [34]. Here, both unlinked nuclear markers (GAPDH and Hsp90) showed little population structure either by colour phenotype, species or geography (Table 1) with only about 15% of the variation explained by species and much less by colour pattern phenotype (Table 1). This result was corroborated by phylogenetic analysis (Figure 2), where similar alleles were spread broadly among species, wing pattern phenotypes, and across major biogeographic boundaries. Even among some loci within the red pattern interval, for instance kinesin and Hm01012, there was a poor correspondence with either species boundaries, geography or colour pattern, with each factor explaining less than 10% of the molecular variation at these markers (Table 1). Similarly, phylogenies of these two markers did not exhibit clear clustering by any of these categories (Figure 3).

Other markers across the red locus showed an increasing tendency to partition variation by colour pattern phenotype. Coding sequence of the transcription factor optix clustered most of the red-banded phenotypes of H. melpomene together, but H. melpomene individuals with rayed phenotypes were scattered across the genealogy. Optix also failed to show a clear phenotype association for H. timareta and H. heurippa (Figure 3). Nonetheless, colour pattern explained 28% of the variation within optix alleles (Table 1). A similar result was observed at HmB449k and HmB520k, which were 75 kb downstream and 2 kb upstream from optix, respectively, in the red interval (Table 1). Both loci grouped H. melpomene red-banded phenotypes into a monophyletic lineage (Figure 3), but failed to show a phenotype association in H. heurippa, H. timareta and rayed H. melpomene.
HmB453k was the striking exception to these patterns and showed strong population structure based on colour phenotype when analysed both by Neighbour-Joining and Maximum Likelihood (Figure 3, Figure 4). Over 60% of the segregating variation at this locus was explained by colour pattern phenotype (Table 1). Moreover, the allelic genealogy of this locus clearly defined three major clades, which largely corresponded to three major colour pattern phenotypes (Figure 4). The first clade contained red-banded type taxa (H. melpomene, H. timareta subsp. nov from Peru and H. heurippa), the second grouped rayed species (H. melpomene, H. timareta florencia and H. timareta contigua), and the third containing the species with no dorsal red wing colouration (H. cydno, H. timareta subsp. nov from Colombia and H. timareta timareta). Strikingly, individuals of the polymorphic population of H. timareta from eastern Ecuador were separated by phenotype, with rayed and non-rayed individuals sampled from the same locality falling into their respective phenotypic clades.

There were some exceptions to the complete clustering by phenotype in HmB453k (Figure 4). For example, the east Andean race, H. m. plesseni possesses white and red spots on the forewing and is typically considered a red-banded pattern. However, here all individuals from this race form a distinct monophyletic group on the HmB453k genealogy (Figure 4). This perhaps indicates that this phenotype shows an independent origin as compared to other red-banded patterns, consistent with its distinct white and red band phenotype. In addition, six haplotypes from the rayed race H. m. malleti did not cluster in the same clade as other rayed individuals, but similarly formed a separate monophyletic clade nested within the broader genealogy (Figure 4). This might also represent an independent origin of rayed phenotypes within H. melpomene, but is perhaps more likely a result of recombination between the HmB453k marker and nearby functional sites.
In order to address alternative explanations for the strong colour pattern signal within the HmB453k genealogy [26], we tested three alternative tree topologies for this fragment. The first alternate topology assumed that mtDNA topology correctly reflected the relationship among the three species; the second, a topology that considers independent phenotypic convergence in H. melpomene, H. timareta and H. heurippa and the third, a topology where H. melpomene constitutes a red polymorphic ancestral taxon and H. cydno/H.timareta/H.heurippa are derived with multiple losses of red patterns (Figure S1). According to the Shimodaira–Hasegawa (SH) test, the ML tree was better supported than any of the three alternative topologies (p<0.05 in all cases) [35]. These same three alternative tree topologies (Figure S1) were also tested against a ‘perfect’ ML HmB453k genealogy where the non-clustering alleles of H. m. malleti and H. m. plesseni were removed. In this case, again the SH test showed that the ML tree was better than any of the three alternatives (p<0.05 in all cases). Thus, we can rule out the alternative hypotheses proposed for pattern sharing across this group, namely multiple independent origins of red patterns, or ancestral red patterns subsequently lost multiple times [26].
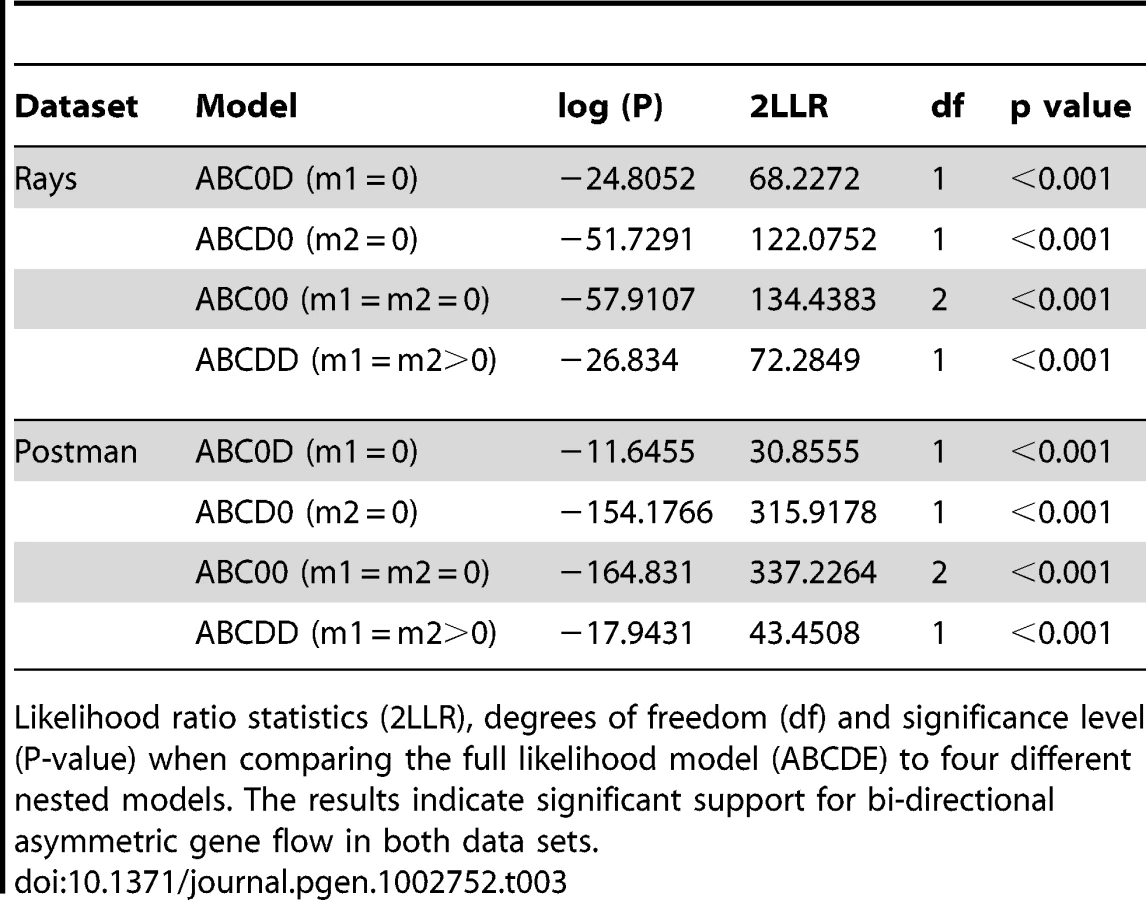
To determine whether introgression is the cause of the shared DNA sequence variation observed among species, we applied the Isolation with Migration model in H. melpomene, H. timareta and H. heurippa using the program IM [36]. In order to obtain non-recombining blocks of sequence for this analysis, the taxa were separated into rayed and red-banded groups (see methods). In both datasets, IM estimated a population size of H. timareta smaller than that of H. melpomene (Table S3) and a time of divergence between these two species of ∼700,000 years. Maximum-likelihood estimates for introgression (2Nm), in general showed evidence of gene flow between species in the four markers analysed (Table 2). Models invoking gene flow in both directions were a significantly better fit than any model with no gene flow in any or in both directions (Table 3, models ABC0D, ABCD0, ABC00). We also found evidence for significant asymmetry in gene flow, as the model with unequal gene flow between species was significantly better than the model with similar gene flow in both directions (Table 3, model ABCDD).

When gene flow parameters were estimated for individual genes, nuclear genes Hsp90 and GAPDH, together with the mitochondrial fragment COI, showed evidence for ongoing gene flow between the study species (Table 2). However, the fragment HmB453k was the only marker consistently showing the strongest unidirectional introgression from H. melpomene to H. timareta in both phenotype datasets, thus suggesting that HmB453k alleles of H. timareta are derived from those of H. melpomene (Figure 5). Most notably in the rayed data set, this marker showed the highest magnitude of gene flow seen at any of the markers (Table 2). As the HmB453k fragment is located in the genomic region controlling the red wing phenotypes that is known to be under selection, one of the IM model assumptions is violated. Previous IM analysis on simulated scenarios with divergent selection in early stages of divergence have showed underestimated gene flow rates (2Nm) [37]. It could be argued therefore, that if selection is having an effect on our estimates we might be underestimating migration rates.

To further explore and confirm the signatures of introgression between these species we also used a linkage disequilibrium (LD) test for gene flow [38].
Briefly, the difference (x = DSS−DSX) between the magnitude of LD among all pairs of shared polymorphisms (DSS; Disequilibrium Shared-Shared) and that among all pairs of sites for which one member is a shared polymorphism and the other is an exclusive polymorphism (DSX; Disequilibrium Shared-Exclusive), is indicative of whether or not polymorphisms in the populations are the result of gene flow (positive x value) or retained ancestral polymorphism (negative x value) [38]. This because polymorphisms that are shared due to ancestral polymorphism are expected to be older on average, having more time to recombine and break down associations, than polymorphisms acquired via post-divergence gene flow [38].
We applied this test to the same phenotypic groups analysed with IM, and additionally, to pairs of H. melpomene and H. timareta populations found in sympatry. In general, the LD analysis showed values consistently positive across all comparisons and loci (Table 4), suggesting onging gene flow between H. melpomene and H. timareta. Notably, HmB453k was the only locus with significant gene flow in both the phenotypic and sympatric datasets, where H. timareta was always the recipient species (highest positive value) of H. melpomene alleles (p<0.001, Table 4). This analysis therefore provides strong confirmation of the IM results.

Discussion
Adaptive novelty can arise de novo from mutations, from standing variation within populations or through gene flow among related populations or species, and the relative importance of these factors remains an open question in evolutionary biology. In Heliconius butterflies, the recent identification of the optix transcription factor as the locus of selection for red wing phenotypes offers the opportunity to address this question [32]. In a parallel study, we demonstrated that the distantly related H. melpomene and H. erato radiations use independently derived optix alleles to generate mimetic red patterns, implicating de novo mutations at the same locus [39]. Here, in contrast, we show that mimicry between more closely related species has involved multiple instances of allele sharing through adaptive introgression. Thus, the allelic variants that fuel adaptation do not necessarily need to be generated de novo, but can also be derived from introgression, accelerating the evolutionary process.
In this and previous studies, putatively neutral markers have shown that H. melpomene and the H. cydno clade are two distinct species assemblages that occasionally exchange genes [20], [21], [40]. Despite evidence for gene flow at neutral markers, H. melpomene and the H. cydno clade species often coexist in Central America and the Andes, and are ‘good’ species with distinct ecologies and strong barriers to gene flow, including both strong pre - and post-mating isolation [22], [41], [42], [43]. Here, we also found pervasive gene flow among H. melpomene, H. timareta and H. heurippa, similar to that previously observed in comparisons involving H. melpomene and H. cydno [21], [40]. The gene flow observed at markers unlinked to the wing pattern locus is bi-directional and not correlated with any obvious phenotypic trait. In contrast, the HmB453k marker, located within the red colour locus in a non-coding region downstream of optix, shows a striking association with wing phenotype and unidirectional introgression from H. melpomene to H. timareta.
The functional sites driving phenotypic variation within Heliconius are almost certainly cis-regulatory elements of optix and perhaps other adjacent protein coding regions, which act as a phenotypic switch for red pattern elements [32]. Notably, optix shows no amino acid substitutions between divergent colour pattern forms of the same species or between convergent forms of distantly related species [32]. To date, HmB453k shows the strongest association with wing pattern phenotype, much stronger than kinesin, which showed evidence for adaptive introgression of red phenotypes into H. heurippa [25], and even stronger than the optix coding region [32]. The strong signal we observe at HmB453k argues that it must be very close to the functional region(s) regulating colour pattern variation. Nonetheless, the fact that two races (H. m. plesseni and H. m. malleti) do not fall into the expected clades in this marker, might suggest that HmB453k does not itself contain functional sites. It is also likely that multiple functional sites across the genomic region control different aspects of the phenotype. Indeed, linkage disequilibrium analysis shows at least three sites in optix and HmB453k that consistently co-segregate (Figure S2), and in general there is substantial linkage disequilibrium across the HmB locus.
The lack of a strong association at the kinesin locus was surprising given the strong association seen at this locus in our previous study of H. heurippa, albeit with a much more taxonomically restricted sample [25]. However, we have considerably smaller sequence coverage of kinesin here, which might affect the signal we recovered from this gene. We believe that the previous study identified a genuine signal of introgression, but that the functional sites controlling the phenotype, which are likely to be regulatory in nature, are located in the non-coding sequence between kinesin and optix. Unpublished expression data indicate that there is evidence for functional involvement of both genes in wing pattern specification (Pardo-Diaz, unpublished data).
Previous criticism of the hypothesis of adaptive introgression in Heliconius and these species in particular, has focused on two alternative hypotheses, that either red variants were ancestral, with multiple subsequent trait losses, or that they have independent origins in these closely related lineages [26]. We have explicitly ruled out these alternatives, both by coalescent analysis using IM and LD analysis that indicate strong and significant evidence for directional gene flow, and by tree topology tests. In addition, it could also be hypothesised that natural selection might drive independent and convergent evolution of the sequence variants seen in the HmB453k region, if these were directly responsible for regulation of optix expression. Under this hypothesis however, one would expect multiple divergent haplotypes to be associated with this region in the surrounding sequence. Instead, we clearly observe a single haplotype at the centre of the associated region, with a decline in association with genetic distance, consistent with a single origin for each phenotype in this clade.
Alongside a parallel study involving a complete genomic sampling of the red colour region in a subset of the taxa used here [33], our data provide the first evidence for adaptive introgression driven by mimicry in Heliconius. The introgression previously documented in H. heurippa established a novel non-mimetic phenotype in eastern Colombia [24], [25]. In contrast, the additional cases of introgression documented here represent convergence due to mimicry selection, rather than establishment of an entirely novel pattern, albeit with a common genetic origin for the shared patterns. The direction of the asymmetrical gene flow is consistent with mimicry theory. First, H. melpomene is generally more locally abundant in the eastern Andes as compared to H. timareta (CJ, pers. obs.), so mimicry theory would predict that rare species should experience stronger selection to converge onto abundant models. Thus it seems likely that H. timareta adopted the local H. melpomene wing pattern, rather than vice-versa. Second, H. cydno and its co-mimics H. sapho and H. eleuchia are almost entirely restricted to the western side of the Andes [44]. One plausible scenario is therefore that the ancestors of H. timareta migrated along the eastern slope of the Andes and were faced with the absence of a white/yellow co-mimic. It seems likely that this imposed an additional selection pressure to mimic H. melpomene and H. erato instead. This eventually led to the establishment of H. timareta as a replacement of H. cydno distributed along the eastern slopes of the Andes in sympatry with H. melpomene.
The data provide evidence for multiple independent introgression events. H. t. florencia shares a rayed pattern with its co-mimic, H. m. malleti, in south-eastern Colombia [45], while the very different phenotype of the red-banded race H. t. ssp. nov. is mimetic with H. m. amaryllis in the Tarapoto region of Peru. A likely additional case is represented by the polymorphic population of H. timareta in Ecuador. Although the rayed phenotype in this population may share a common origin with that of H. t. florencia in Colombia, their distribution is disjunct, separated by the red banded H. tristero found in Mocoa, Colombia. Thus, the acquisition of red patterns by H. timareta has been driven by natural selection for mimicry, and has occurred multiple times (at least once for each red colour element) in the last 700,000 years.
The introgression of regions controlling red wing colouration from H. melpomene to the H. cydno clade has facilitated mimicry and has also played a role in speciation. In H. heurippa the red/yellow hybrid pattern is used as mating cue, which contributes to reproductive isolation from its closest relatives [24], [25], [46]. Although barriers to gene flow within H. timareta have not been investigated, it is possible that similar isolation might be found between red-banded and rayed races of this species, such that these might represent incipient species generated through hybridisation.
In this and previous work we are beginning to piece together a more complete picture of the history of this complex adaptive radiation. It seems likely that the red-banded pattern in H. erato spread and diversified early in the history of the radiation, followed by emergence of the H. erato rayed pattern that spread across Amazonia interrupting the geographical continuity of the ancestral red-banded phenotype [39]. In the H. melpomene lineage there was a speciation event in which H. cydno colonised the yellow/white phenotypic niche to mimic the H. eleuchia and H. sapho clade, and H. melpomene diversified to mimic the phylogenetically distant H. erato [39]. Reproductive isolation between the species is partly due to colour pattern mate choice, which arose between closely related taxa such as H. melpomene and H. cydno. Then divergence of the H. timareta/heurippa lineage from the rest of H. cydno, around 700,000 years ago, arose as a result of adaptive introgression of wing patterning alleles from H. melpomene in the eastern Andes.
In summary, we provide evidence that contributes to resolving the longstanding debate over the evolutionary importance of hybridisation in animals. Our data allow statistical tests for the incidence of introgression based on both coalescent patterns and linkage disequilibrium, with consistent results, and indicate the direction of introgression. The results imply that interspecific hybridisation facilitates adaptability and diversification, not only when the selection pressure is human-mediated, but also allows the colonisation of either empty or under-utilised fitness peaks in animal adaptive radiations. In other adaptive radiations such as Darwin's finches [15], Daphnia waterfleas [47] and African cichlids [48], rapid diversification may similarly be mediated by introgression [1]. The evolutionary impact of such transfers might be higher if the traits interchanged are also involved in reproductive isolation, thus contributing to speciation.
Materials and Methods
Sampling, amplification, and DNA sequencing
Our sample set consisted of 111 individuals from 4 different species, namely H. melpomene, H. cydno, H. timareta and H. heurippa (Table S1). In total 14 races of H. melpomene, 8 races of H. cydno, 5 races of H. timareta and one of H. heurippa were sampled covering most of the geographic distribution of each species from Central to South America (Figure 1). H. numata was included as outgroup. DNA was extracted using the QIAGEN DNeasy 96 Blood & Tissue Kit. One mitochondrial and eight nuclear fragments (Table S2) were amplified with QIAGEN Taq DNA Polymerase, purified using ExoSAP and sequenced with ABI Big Dye Terminator. Two of the nuclear markers are unlinked to the HmB red locus whereas the remaining six are all located across the region (Table S2). From these colour-linked fragments, optix and kinesin have previously been implicated in red wing pattern determination. The remaining four were identified as regions under divergent selection with high levels of population differentiation associated with red colouration [31].
Sequences were aligned and cleaned using Codon Code Aligner. Haplotype inference for heterozygous calls was conducted with the PHASE algorithm implemented in DNAsp v5.10.01 [49], with 5000 iterations and allowing for recombination. Inferred haplotypes with a confidence higher than 95% were accepted. In the case of the fragments HmB449k and HmB453k cloning was necessary due to the presence of considerable indel variation. PCR products of these two markers were ligated into the pGEM-T easy vector and five to ten clones per individual were selected and sequenced. Sequences were deposited in GenBank under accession numbers JX003980–JX005837.
Phylogenetic reconstruction
For each fragment, phased haplotypes were used to construct phylogenetic trees using the Neighbour-Joining method under the P model of uncorrected distance in PAUP* 4.0b10. Node support in the resulting trees was estimated by 1000 bootstrap replicates using a heuristic search. To confirm the phylogenetic groupings obtained by Neighbour-Joining for HmB453K, a maximum likelihood phylogeny was also constructed with PhyML [50], using the GTR+I+G substitution model selected by Modeltest [51] and with branch support values obtained by 1000 bootstrap replicates. The stability of the inferred phylogeny for HmB453k was examined using the Shimodaira-Hasegawa test (SH test) [35] in PAUP* 4.0b10. For all phylogenetic inferences trees were rooted with H. numata as outgroup.
Genetic structure analysis
Analysis of molecular variance (AMOVA) with 1000 permutations, implemented in ARLEQUIN v.3.5 [52], was used to assess population structure by species, geography and phenotype. For species, four groups were set, corresponding to H. melpomene, H. cydno, H. timareta and H. heurippa. In the geography analysis, haplotypes were grouped into six geographic regions: (i) the Guiana shield, (ii) Amazon, (iii) Pacific, (iv) East Andes foothills, (v) Cauca Valley and (vi) Magdalena Valley. These geographic clustering matches the biogeographic provinces (i) Humid Guyana, (ii) Napo+Imeri, (iii) Choco+Wester Ecuador+Arid Ecuador, (iv) North Andean Paramo, (v) Cauca and (vi) Magdalena defined by Morrone [53]. When compared by phenotype, haplotypes were grouped in three groups: the red-banded type [presence of red forewing band], the rayed type [presence of orange rays in the hind wing] and the non-red type [absence of any dorsal red element on the wings]. The outgroup H. numata was excluded from these analyses.
Analysis of gene flow with the Isolation with Migration (IM) model
In order to estimate the role and direction of historical gene flow between H. melpomene and H. timareta (H. heurippa was included in H. timareta for the purposes of this analysis), we used the Isolation-Migration (IM) Bayesian model [36]. IM uses Markov chain Monte Carlo (MCMC) sampling to obtain maximum-likelihood estimates of six parameters: current population sizes, ancestral population size, rates of migration between two populations (m1 and m2) and the timing of divergence (t). IM assumes both free recombination between loci and no recombination within them, therefore the software SITES [54] was used to select genetic blocks with no recombination within each locus. To fulfill the assumption of free recombination between loci, only the unlinked colour loci and one of the fragments linked to red colouration [HmB453k] were selected for this analysis. We ran IM on two modified datasets for each species pair: (i) H. melpomene rayed type-H. timareta and (ii) H. melpomene red-banded -[H. heurippa and H. timareta]. These groups constituted the maximal units in which we could get enough data without recombination, with the rayed dataset being a block of 379 bp and the postman dataset one of 313 bp. Unfortunately, pairwise comparisons involving all the species' alleles were not possible nor were comparisons involving species in parapatry because such groupings contained small non-recombining blocks that lacked enough informative sites. However, since our main interest was to determine the direction and magnitude of introgression (m) within phenotypes, these datasets are sufficient for addressing this question. For all datasets, after searching for the parameter range using preliminary runs, 30 million steps were sampled from the primary chain after a 300,000 burn-in period under the HKY model with 10 chains per set. Mixing properties of the MCMC were assessed by visual inspection of the parameter trend plots and by examining that the effective sample size (ESS) was higher than 50, as recommended [36], [37].
To get biologically meaningful units of gene flow, the maximum likelihood estimates and 90% highest posterior density (HPD) interval for the migration rates (m) were converted into the effective number of gene migrations received by a population per generation (2Nm, in Table 2). For this conversion, we used a generation time of 35 days and a mutation rate per gene calculated with the calibration time proposed by Wahlberg et al. for Nymphalidae [55] coupled with the divergence between the melpomene/cydno clade per locus estimated with the software SITES. Our estimates of mutation rate per locus per year were: 6.2×10⁻⁶ for COI, 7.1×10⁻⁸ for GAPDH, 1.2×10⁻⁶ for Hsp90 and 3.4×10⁻⁵ for HmB453k.
We finally compared the model including all six parameters to simpler demographic models in order to statistically test the hypothesis of zero or equal gene flow between populations (m1 = 0, m2 = 0, m1 = m2 = 0, m1 = m2>0). These analyses were conducted using IMa [36] by running the initial M-mode output with identical settings in the L-mode and sampling 5×10⁵ genealogies.
Analysis of gene flow based on linkage disequilibrium (LD) patterns
We further tested the presence, significance and direction of gene flow per locus between H. melpomene and H. timareta using a method based on linkage disequilibrium (LD) developed by Machado et al in 2002 [38]. In this test, a positive difference between the LD among all pairs of shared polymorphisms (DSS) and the LD among all pairs of sites for which one member is a shared polymorphism and the other is an exclusive polymorphism (DSX), is indicative of gene flow. The magnitude of the difference directly measures the direction of the introgression, with the species with the highest positive value being the recipient [38]. The same phenotypic datasets used in the IM analysis and also groups of species in complete sympatry, were subjected to independent runs, each of them with 30000 simulations. The input files were prepared with the program SITES [56] calculating D' as a measure of linkage disequilibrium (as suggested by Machado et. al [38]) and analysing linkage disequilibrium among shared polymorphism between groups (by choosing the -s and -p options in the LD string).
Analysis of linkage disequilibrium on the HmB locus
Linkage disequilibrium across the HmB region was calculated for all populations using the software MIDAS [57] only considering sites with allele frequency higher than 5%, and visualised with the R package LDheatmap [58].
Supporting Information
Zdroje
1. SeehausenO 2004 Hybridization and adaptive radiation. Trends Ecol Evol 19 198 207 doi:110.1016/j.tree.2004.1001.1003
2. ArnoldMLMartinNH 2009 Adaptation by introgression. J Biol 8 doi:10.1186/jbiol1176 82
3. MalletJ 2007 Hybrid speciation. Nature 446 279 283 doi:210.1038/nature05706
4. ArnoldMLBulgerMRBurkeJMHempelALWilliamsJH 1999 Natural hybridization: how low can you go and still be important? Ecology 80 371 381
5. WhitneyKDRandellRARiesebergLH 2006 Adaptive introgression of herbivore resistance traits in the weedy sunflower Helianthus annuus. Amer Nat 167 794 807 doi:710.1086/504606
6. MalletJ 2005 Hybridization as an invasion of the genome. Trends Ecol Evol 20 229 237 doi:210.1016/j.tree.2005.1002.1010
7. CastricVBechsgaardJSchierupMHVekemansX 2008 Repeated adaptive introgression at a gene under multiallelic balancing selection. PLoS Genet 4 doi:1000110.1001371/journal.pgen.1000168 e1000168
8. RiesebergLHLinderCRSeilerGJ 1995 Chromosomal and genic barriers to introgression in Helianthus. Genetics 141 1163 1171
9. OchmanHLawrenceJGGroismanEA 2000 Lateral gene transfer and the nature of bacterial innovation. Nature 405 299 304 doi:210.1038/35012500
10. RiesebergL 2011 Adaptive introgression: the seeds of resistance. Curr Biol 21 R581 R583 doi:510.1016/j.cub.2011.1006.1038
11. MartinNHBouckACArnoldML 2006 Detecting adaptive trait introgression between Iris fulva and I. brevicaulis in highly selective field conditions. Genetics 172 2481 2489 doi:2410.1534/genetics.2105.053538
12. KimMCuiM-LCubasPGilliesALeeK 2008 Regulatory genes control a key morphological and ecological trait transferred between species. Science 322 1116 1119 doi:1110.1126/science.1164371
13. AndersonTMvonHoldtBMCandilleSIMusianiMGrecoC 2009 Molecular and evolutionary history of melanism in North American gray wolves. Science 323 1339 1343 doi:1310.1126/science.1165448
14. SongYEndepolsSKlemannNRichterDMatuschkaF-R 2011 Adaptive introgression of anticoagulant rodent poison resistance by hybridization between old world mice. Curr Biol 21 1296 1301 doi:1210.1016/j.cub.2011.1206.1043
15. GrantBGrantP 2008 Fission and fusion of Darwin's finches populations. Phil Trans R Soc B 363 2821 2829 doi:2810.1098/rstb.2008.0051
16. HerderFNolteAPfaenderJSchwarzerJHadiatyR 2005 Adaptive radiation and hybridization in Wallace's Dreamponds: evidence from sailfin silversides in the Malili Lakes of Sulawesi. Proc R Soc B 273 2209 2217 doi:2210.1098/rspb.2006.3558
17. MalletJGilbertLE 1995 Why are there so many mimicry rings? Correlations between habitat, behaviour and mimicry in Heliconius butterflies. Biol J Linnean Soc 55 159 180 doi:150.1111/j.1095-8312.1995.tb01057.x
18. MalletJBeltranMNeukirchenWLinaresM 2007 Natural hybridization in heliconiine butterflies: the species boundary as a continuum. BMC Evol Biol 7 doi:10.1186/1471-2148-1187-1128 28
19. GilbertLE 2003 Adaptive novelty through introgression in Heliconius wing patterns: evidence for shared genetic “tool box” from synthetic hybrid zones and a theory of diversification. Ecology and evolution taking flight: butterflies as model systems. Chicago, IL: University of Chicago Press. 281 318 pp
20. BullVBeltránMJigginsCDMcMillanOWBerminghamE 2006 Polyphyly and gene flow between non-sibling Heliconius species. BMC Biology 4 doi:10.1186/1741-7007-1184-1111 11
21. KronforstMRYoungLGBlumeLMGilbertLE 2006 Multilocus analyses of admixture and introgression among hybridizing Heliconius butterflies. Evolution 60 1254 1268 doi:1210.1554/1206-1005.1251
22. JigginsC 2008 Ecological speciation in mimetic butterflies. BioScience 58 541 548 doi:510.1641/B580610
23. BeltranMJigginsCDBrowerAVZBerminghamEMalletJ 2007 Do pollen feeding, pupal-mating and larval gregariousness have a single origin in Heliconius butterflies? Inferences from multilocus DNA sequence data. Biol J Linnean Soc 92 221 239 doi:210.1111/j.1095-8312.2007.00830.x
24. MavarezJSalazarCABerminghamESalcedoCJigginsCD 2006 Speciation by hybridization in Heliconius butterflies. Nature 441 868 871 doi:810.1038/nature04738
25. SalazarCBaxterSWPardo-DiazCWuGSurridgeA 2010 Genetic evidence for hybrid trait speciation in Heliconius butterflies. PLoS Genet 6 doi:1000910.1001371/journal.pgen.1000930 e1000930
26. BrowerAVZ 2010 Hybrid speciation in Heliconius butterflies? A review and critique of the evidence. Genetica 139 589 609 doi:510.1007/s10709-10010-19530-10704
27. BaxterSWPapaRChamberlainNHumphraySJJoronM 2008 Convergent evolution in the genetic basis of Müllerian mimicry in Heliconius butterflies. Genetics 180 1567 1577 doi:1510.1534/genetics.1107.082982
28. BaxterSWNadeauNJMarojaLSWilkinsonPCountermanBA 2010 Genomic hotspots for adaptation: the population genetics of Müllerian mimicry in the Heliconius melpomene clade. PLoS Genet 6 doi:1000710.1001371/journal.pgen.1000794 e1000794
29. SheppardPRTurnerJRGBensonWWSingerMC 1985 Genetics and the evolution of Müellerian mimicry in Heliconius butterflies. Phil Trans R Soc B 308 443 610 doi:410.1098/rstb.1985.0066
30. MalletJJoronM 1999 Evolution of diversity in warning color and mimicry: polymorphisms, shifting balance, and speciation. Annu Rev Ecol Syst 30 201 233
31. NadeauNJWhibleyAJonesRDaveyJDasmahapatraKK 2012 Genomic islands of divergence in hybridizing Heliconius butterflies identified by large-scale targeted sequencing. Phil Trans R Soc B 367 343 353 doi:310.1098/rstb.2011.0198
32. ReedRDPapaRMartinAHinesHMCountermanBA 2011 Optix drives the repeated convergent evolution of butterfly wing pattern mimicry. Science 333 1137 1141 doi:1110.1126/science.1208227
33. The Heliconius Genome Consortium (In press) A butterfly genome reveals promiscuous exchange of mimicry adaptations among species. Nature
34. BeltranMJigginsCDBullVLinaresMMalletJ 2002 Phylogenetic discordance at the species boundary: comparative gene genealogies among rapidly radiating Heliconius butterflies. Mol Biol Evol 19 2176 2190
35. ShimodairaHHesegawaM 1999 Multiple comparisons of Log-Likelihoods with applications to phylogenetic inference. Mol Biol Evol 16 114
36. HeyJNielsenR 2004 Multilocus methods for estimating population sizes, migration rates and divergence time, with applications to the divergence of Drosophila pseudoobscura and D. persimilis. Genetics 167 747 760 doi:710.1534/genetics.1103.024182
37. StrasburgJRiesebergL 2010 How robust are “isolation with migration” analyses to violations of the IM model? A simulation study. Mol Biol Evol 27 297 310 doi:210.1093/molbev/msp1233
38. MachadoCAKlimanRMMarkertJAHeyJ 2002 Inferring the history of speciation from multilocus DNA sequence data: the case of Drosophila pseudoobscura and close relatives. Mol Biol Evol 19 472 488
39. HinesHMCountermanBAPapaRAlbuquerque de MouraPCardosoMZ 2011 A wing patterning gene redefines the mimetic history of Heliconius butterflies. Proceedings of the National Academy of Sciences of the United States of America 108 19666 19671 doi:19610.11073/pnas.1110096108
40. SalazarCJigginsCDTaylorJEKronforstMRLinaresM 2008 Gene flow and the genealogical history of Heliconius heurippa. BMC Evol Biol 8 doi:110.1186/1471 132
41. JigginsCDNaisbitRECoeRLMalletJ 2001 Reproductive isolation caused by colour pattern mimicry. Nature 411 302 305 doi:310.1038/35077075
42. NaisbitREJigginsCDMalletJ 2001 Disruptive sexual selection against hybrids contributes to speciation between Heliconius cydno and Heliconius melpomene. Proc R Soc B 268 1849 1854 doi:1810.1098/rspb.2001.1753
43. NaisbitREJigginsCDLinaresMSalazarCMalletJ 2002 Hybrid Sterility, Haldane's Rule and Speciation in Heliconius cydno and H. melpomene. Genetics 161 1517 1526
44. RosserNPhillimoreABHuertasBWillmottKRMalletJ 2012 Testing historical explanations for gradients in species richness in heliconiine butterflies of tropical America. Biological journal of the linnean society 105 479 497 doi:410.1111/j.1095-8312.2011.01814.x
45. GiraldoNSalazarCJigginsCDBerminghamELinaresM 2008 Two sisters in the same dress: Heliconius cryptic species. BMC Evol Biol 8 doi:10.1186/1471-2148-1188-1324
46. MeloMCSalazarCJigginsCDLinaresM 2009 Assortative mating preferences among hybrids offers a route to hybrid speciation. Evolution 63 1660 1665 doi:1610.1111/j.1558-5646.2009.00633.x
47. FryerG 1991 Functional morphology and the adaptiveaadiation of the Daphniidae (Branchiopoda: Anomopoda). Phil Trans R Soc B 331 1 99 doi:10.1098/rstb.1991.0001
48. SeehausenOAlphenJJMvWitteF 1997 Cichlid fish diversity threatened by eutrophication that curbs sexual selection. Science 277 1808 1811 doi:1810.1126/science.1277.5333.1808
49. LibradoPRozasJ 2009 DnaSP v5: a software for comprehensive analysis of DNA polymorphism data. Bioinformatics 25 1451 1452 doi:1410.1093/bioinformatics/btp1187
50. GuindonSDufayardJ-FoLefortVAnisimovaMHordijkW 2010 New algorithms and methods to estimate maximum-likelihood phylogenies: assessing the performance of PhyML 3.0. Syst Biol 59 307 321 doi:310.1093/sysbio/syq1010
51. PosadaDCrandallKA 1998 MODELTEST: testing the model of DNA substitution. Bioinformatics 14 817 818
52. ExcoffierLLavalGSchneiderS 2005 Arlequin (version 3.0): An integrated software package for population genetics data analysis. Evol Bioinform Online 1 47 50
53. MorroneJJ 2006 Biogeographic areas and transition zones of Latin America and the caribbean islands based on panbiogeographic and cladistic analyses of the entomofauna. Annual Review of Entomology 51 467 494 doi:410.1146/annurev.ento.1150.071803.130447
54. HeyJWakeleyJ 1997 A Coalescent Estimator of the Population Recombination Rate. Genetics 145 833 846
55. WahlbergNLeneveuJKodandaramaiahUPeñaCNylinS 2009 Nymphalid butterflies diversify following near demise at the Cretaceous/Tertiary boundary. Proc R Soc B 276 4295 4302 doi:4210.1098/rspb.2009.1303
56. HeyJWakeleyJ 1997 A coalescent estimator of the population recombination rate. Genetics 145 833 846
57. GauntTRRodriguezSZapataCDayIN 2006 MIDAS: software for analysis and visualisation of interallelic disequilibrium between multiallelic markers. BMC Bioinformatics 7 doi:210.1186/1471-2105-1187-1227 227
58. ShinJHBlaySMcNeneyBGrahamJ 2006 LDheatmap: an R function for graphical display of pairwise linkage disequilibria between single nucleotide polymorphisms. J Stat Softw 16
Štítky
Genetika Reprodukční medicínaČlánek vyšel v časopise
PLOS Genetics
2012 Číslo 6
- Kazuistika – Perspektivy využití precizované medicíny v rámci personalizované specifické terapie onkologických pacientů
- Nobelova cena za chemii pro genetické nůžky: Objev, který změní naši budoucnost?
- Technologie na bázi RNA v klinické praxi: od přebarvených petúnií k terapii vzácných a dosud jen obtížně léčitelných chorob u lidí
- „Nepředstavovali jsme si, že náš výzkum povede přímo ke vzniku nových léků, dokonce ještě za našeho života“
- Bezplatné služby pro diagnostiku ATTRv amyloidózy pro kardiology
Nejčtenější v tomto čísle
- Rumors of Its Disassembly Have Been Greatly Exaggerated: The Secret Life of the Synaptonemal Complex at the Centromeres
- The NSL Complex Regulates Housekeeping Genes in
- Tipping the Balance in the Powerhouse of the Cell to “Protect” Colorectal Cancer
- Interplay between Synaptonemal Complex, Homologous Recombination, and Centromeres during Mammalian Meiosis
Zvyšte si kvalifikaci online z pohodlí domova
Mazová zátka a její řešení
nový kurzVšechny kurzy