
Extensive Evolutionary Changes in Regulatory Element Activity during Human Origins Are Associated with Altered Gene Expression and Positive Selection
Understanding the molecular basis for phenotypic differences between humans and other primates remains an outstanding challenge. Mutations in non-coding regulatory DNA that alter gene expression have been hypothesized as a key driver of these phenotypic differences. This has been supported by differential gene expression analyses in general, but not by the identification of specific regulatory elements responsible for changes in transcription and phenotype. To identify the genetic source of regulatory differences, we mapped DNaseI hypersensitive (DHS) sites, which mark all types of active gene regulatory elements, genome-wide in the same cell type isolated from human, chimpanzee, and macaque. Most DHS sites were conserved among all three species, as expected based on their central role in regulating transcription. However, we found evidence that several hundred DHS sites were gained or lost on the lineages leading to modern human and chimpanzee. Species-specific DHS site gains are enriched near differentially expressed genes, are positively correlated with increased transcription, show evidence of branch-specific positive selection, and overlap with active chromatin marks. Species-specific sequence differences in transcription factor motifs found within these DHS sites are linked with species-specific changes in chromatin accessibility. Together, these indicate that the regulatory elements identified here are genetic contributors to transcriptional and phenotypic differences among primate species.
Published in the journal:
. PLoS Genet 8(6): e32767. doi:10.1371/journal.pgen.1002789
Category:
Research Article
doi:
https://doi.org/10.1371/journal.pgen.1002789
Summary
Understanding the molecular basis for phenotypic differences between humans and other primates remains an outstanding challenge. Mutations in non-coding regulatory DNA that alter gene expression have been hypothesized as a key driver of these phenotypic differences. This has been supported by differential gene expression analyses in general, but not by the identification of specific regulatory elements responsible for changes in transcription and phenotype. To identify the genetic source of regulatory differences, we mapped DNaseI hypersensitive (DHS) sites, which mark all types of active gene regulatory elements, genome-wide in the same cell type isolated from human, chimpanzee, and macaque. Most DHS sites were conserved among all three species, as expected based on their central role in regulating transcription. However, we found evidence that several hundred DHS sites were gained or lost on the lineages leading to modern human and chimpanzee. Species-specific DHS site gains are enriched near differentially expressed genes, are positively correlated with increased transcription, show evidence of branch-specific positive selection, and overlap with active chromatin marks. Species-specific sequence differences in transcription factor motifs found within these DHS sites are linked with species-specific changes in chromatin accessibility. Together, these indicate that the regulatory elements identified here are genetic contributors to transcriptional and phenotypic differences among primate species.
Introduction
Understanding the molecular basis of phenotypic differences between humans and other primates has been a priority in medicine, behavior, and evolution research [1]–[3]. The genetic basis for these differences can now be explored genome-wide due in part to the rising number of completely sequenced primate genomes. However, finding genotype-phenotype connections is difficult since the vast majority of sequence changes do not contribute to phenotypic differences across species. It was hypothesized over 40 years ago that phenotypic differences between humans and our closest primate relatives are shaped largely by changes in non-coding regulatory elements [4]. Variation in gene regulation have been indirectly confirmed by studying gene expression differences across matched cell or tissue types isolated from different primates [5]–[12], but these studies have failed to pinpoint the regulatory elements responsible for these changes [13]. Genome-wide scans of non-coding DNA sequences under branch-specific positive selection have identified putative regulatory elements that have undergone functional changes [14]–[16]. These studies identified hundreds of regulatory regions with evidence of accelerated sequence substitution during human origins, possibly reflecting adaptive changes in gene regulation. Scans for selection do not, however, provide information about the functional or trait consequences of these evolutionary changes.
Understanding the relationship between mutation, natural selection, and variation in gene regulation is an important goal in evolutionary genomics. Heritable differences in gene expression must have a genetic basis, but exactly what sequence variants have led to these differences are largely unknown. In this study, we used changes in chromatin configuration to better understand this genotype-phenotype relationship. We identified evolutionary conserved and altered regulatory element activity by performing genome-wide DNase-seq [17], [18] in primary skin fibroblasts and lymphoblastoid cell lines (LCLs) isolated from three human and three chimpanzee individuals (Figure 1a and Table S1). Each DNase-seq experiment identifies nucleosome-depleted DNaseI hypersensitive (DHS) sites that mark all types of regulatory elements, including promoters, enhancers, silencers, insulators, and locus control regions. The comprehensiveness of this assay is supported by ChIP experiments for active histone marks, p300, CTCF, and other transcription factors [19]–[21]. In addition to human and chimpanzee, we performed DNase-seq on fibroblasts from three Rhesus macaque individuals to polarize human-chimpanzee chromatin differences and to distinguish between gains and losses of regulatory elements on the human and chimpanzee branches (EBV-derived lymphoblastoid cells are not available for this species). We also performed Digital Gene Expression sequence (DGE-seq) experiments using the same cell cultures to simultaneously compare levels of mRNA abundance [7], [22]. Analyses of these data provide insights into the relationship between evolutionary changes in regulatory elements, their tissue-specific activity, and the resulting functional consequences in gene expression.

Results
DNase-seq identifies species-specific DHS sites
To directly compare DNase-seq data generated from human and non-human primate fibroblast and lymphoblastoid cell line (LCL) samples, we mapped all data to the human genome (build hg19). Non-human DNase-seq sequences were first aligned to their native primate genome and then converted to human coordinates using liftOver [23] (Figure 1a). We limited analyses to high confidence orthologous regions of the human, chimp, and macaque genomes to eliminate potential artifacts due to mis-aligned, missing sequence, or CNVs (Materials and Methods). Comparisons across individuals within a species and against tiling array DNase-chip [24], [25] data generated from the same material supported data accuracy and reproducibility (Materials and Methods and Table S2). DNase-seq signals from individuals within a species were more highly correlated than signals from different species (Figure 1b). Human and chimpanzee DNase-seq signals from fibroblasts were better correlated than human and macaque signals as expected since human and chimp share a more recent common ancestor. Chromatin structure differed more in cell types (fibroblasts vs. LCLs) from the same species than in the same cell-type across different species (Figure 1b). For example, human and chimpanzee fibroblast DNase-seq signals are more similar than human fibroblast and human LCL DNase-seq signals. The same correlation patterns were also found in gene expression data generated from the same samples (Figure 1c).
We identified genomic regions exhibiting significant differences in DNase-seq signal between species [26] (Materials and Methods). Data from macaque samples were used to classify regions as DHS gains or DHS losses on the human or chimpanzee branch (Materials and Methods). More specifically, we defined a human DHS gain as a region with significantly more DNase-seq signal in human than in either chimpanzee or macaque (Figure 2a), and a human DHS loss as a region with significantly less DNase-seq signal in human than in either chimpanzee or macaque (Figure 2b). In essence, these data identify regulatory regions that originated or disappeared in fibroblasts during human origins. Chimpanzee DHS gains and DHS losses were similarly defined (Figure S1). For approximately 90% of gains, a corresponding DHS site was completely absent in all three individuals from each of the other species (Figure 2f). For the remaining sites, DHS sites were annotated in multiple species, but a consistently higher DNase-seq signal was present in one species compared to the others (data not shown). We found that the majority of the human DHS gains (72–79%) and chimpanzee DHS losses (73–74%), and a minority of the human DHS losses (11–27%) and chimpanzee DHS gains (8–17%), overlapped a DHS site found in one or more of three independently derived human fibroblasts (Figure 3a, Table S3). We also found similar trends comparing six independently derived LCLs analyzed by our group (Figure 3b, Table S4), and 20 independently derived human fibroblast samples analyzed by another ENCODE group (Figure S2a-S2b) [27], [28]. These provide evidence that the identified DHS gains and losses represent significant and reproducible functional changes between species. Fibroblasts have been shown to have specific expression profiles associated with different biopsy locations [29], [30]. We note that DHS gains and losses are not enriched around these genes (Materials and Methods).


Identified DHS gains (Figure 2a) and losses (Figure 2b) deviated in sequence read depth from the general chromatin spectrum (Figure 2c). To more directly compare DHS gains and losses with sites that do not change between species, we also identified a set of DHS regions with similar DNase-seq signal intensity across all three species, which we call Common DHS regions (Figure 2d, Materials and Methods, Supplemental data file 1 in Dataset S1). Using a false discovery rate (FDR) of 1%, we detected 836 human DHS gains, 286 human DHS losses, 676 chimpanzee DHS gains, 211 chimpanzee DHS losses, and 1259 Common regions (Supplemental data file 1 in Dataset S1). The higher number of DHS gains compared to DHS losses could be due to purifying selection, or more simply may be related to the asymmetry in their detection criteria (see Materials and Methods for a more complete discussion). True species-specific DHS gains and losses could not be identified in LCLs due to the lack of macaque EBV-derived LCL samples. However, we identified 103 DHS sites with higher DNase-seq signals in human (LCL human DHS gain), 181 DHS sites with lower signals in human (LCL human DHS loss), and 1583 DHS sites with similar signals in both (LCL common DHS; Supplemental data file 1 in Dataset S1).
Similar numbers of gains and losses were found when comparing chimpanzee DNase-seq data to data from an independent set of human fibroblasts and LCLs at the same FDR (Figure S3a–S3b). Furthermore, only 66 differential open chromatin sites were detected when comparing human fibroblast data to additional independently derived human fibroblasts. Likewise, only 1 differential DHS site was detected when comparing human LCLs to additional independently derived human LCLs. This is less than 1% of all differential open chromatin sites when comparing human vs. chimpanzee, indicating a low false positive rate (Figure S3a–S3b).
Species-specific DHS sites are cell type–specific
As part of the ENCyclopedia Of DNA Elements (ENCODE) project [31], we have generated DNase-seq data from 27 diverse human cell types [32] (Table S3, Crawford unpublished ENCODE data). We determined the overlap of our identified DHS gains and losses in fibroblasts with DHS sites in these other human cell types. Seven hundred and sixty-seven (92%) fibroblast human DHS gains were found in at least one of three other independently derived human skin fibroblast ENCODE cell lines from normal (Fibrobl) and diseased individuals (Parkinson's: FibroP; Progeria: ProgFib) supporting the reproducibility of these data (Figure 4a, Figure S3a). Additionally, human DHS gains showed a high level of overlap with some, but not all, non-fibroblast human cell types (Figure 4a, Table S4, Figures S4, S5). This suggests that DHS gains are largely cell-type specific. Few human DHS losses were identified as a DHS site in any of the other human cell types (Figure 4b and Figures S4, S5). In contrast, Common DHS sites were detected in most other human cell types (Figure 4c and Figures S4, S5) suggesting DHS sites active among all three primates have more general roles in regulating transcription. Similar trends were seen when comparing LCL human DHS gain/loss/common regions (Table S5). This suggests Common DHS sites mark DHS sites present in most or all non-human primate cell types, as can be seen for chimp lymphoblast DHS sites (Figure S6i). Expected chimp and macaque DNase signal intensity are detected in orthologous regions (Figure 4d–4f). Similar to previous analysis of cell-type specific DHS sites [32], we found species-specific gains and losses of DHS sites depleted in promoter regions relative to Common DHS sites and enriched in distal intergenic regions and within introns (Figure 2e).

We also compared chimpanzee DHS gains and losses to DNase-seq results from a diverse set of 27 human cell types. We found that chimpanzee DHS gains did not largely overlap with DHS sites from any of the 27 human cell types (5–23%, Figure S6a, Table S4) while chimpanzee DHS losses were more likely to overlap human DHS sites, especially those from human fibroblasts (73%, Figure S6b, Table S4). Thus, comparisons to diverse cell types indicate that Common DHS sites have been selectively maintained through millions of years of primate evolution suggesting a role in housekeeping function. In contrast, more recently evolved DHS sites unique to humans and chimpanzees are likely functional in a small fraction of cell types with related functions.
Species-specific DHS sites are associated with biological function
Species-specific DHS sites were compared to cell-type matched human ChIP-seq data for multiple active histone marks and transcription factor binding sites. We found that human-only DHS sites were better associated with these marks compared to chimpanzee-only DHS sites (Figure 5). This enrichment was highest for H3K4me1, H3K4me2, H3K4me3, and H3K27ac, consistent with chromatin marks predictive of enhancers [20], [33] (Figure 5, Table S6). H3K4 methylation signals were detected in a higher percentage of LCL human DHS gains compared to Common DHS sites, while CTCF, a known insulator protein, is enriched in LCL Common DHS sites (Figure 5, Table S6). The combination of adjacent chromatin marks and their location relative to genes (Figure 2e) provides further evidence that species-specific regulatory elements are functional. These data suggest most regulatory elements gained or lost after the human-chimpanzee divergence are preferentially associated with enhancers, while Common regions are preferentially associated with promoters and insulators.

Species-specific DHS sites are near genes that exhibit species-specific expression
We expect species-specific DHS sites that contribute to phenotypic differences would be located near genes differentially expressed across species. To test this, we measured the proximity of fibroblast DHS site gains and losses to genes with variable expression (Figure 1a). From matched fibroblast expression data, we used edgeR [26] analysis to identify 1047 human upregulated genes, 881 human downregulated genes, 785 chimpanzee upregulated genes and 788 chimpanzee downregulated genes (Supplemental data file 1 in Dataset S1). Human DHS gains were significantly enriched (permutation test, P value = 0.00039) near genes with increased expression in human and depleted (P = 0.008) near genes with decreased expression in human (Figure 6a–6b). Similarly, human DHS losses were enriched (P = 0.008) near genes downregulated in humans and depleted (P = 0.002) near genes upregulated in humans (Figure 6b). The same relationships between DNase-seq signal and expression held true for chimpanzee (Figure 6b, and Table S7). Analogously, we found that significantly upregulated genes were more likely to be near chromatin gains and downregulated genes near chromatin losses in each species compared to genes similarly expressed in both species (Figure S7a–S7b, Table S8, Materials and Methods). These results support a direct role for species-specific DHS site differences in species-specific gene regulation. The direction of these correlations indicate that DHS site gains and losses are more commonly associated with enhancers than repressors. The LCL DNase-seq and expression data from human and chimp show a similar trend (Figure S8).

Many species-specific expression differences were not readily explained by the presence of a nearby species-specific DHS site. For example, though statistically, genes upregulated in human were enriched near human DHS gains, this was true for only 58 of 1182 higher expressed genes (Figure 6a, Table S7). This may be partially explained by our strict definition of human DHS gains. Also, long-range interactions may confound the simple way we assigned DHS sites to the nearest gene. Future studies involving chromatin conformation capture (e.g., 3C, 4C, 5C) could be used to better map DHS sites to target gene(s). Lastly, expression differences between species may result from transcription factor binding characteristics that do not alter chromatin structure. Comparative ChIP-seq studies for specific transcription factors will be necessary to determine the extent of this phenomenon.
We conducted gene ontology enrichment analysis for both species-specific DHS sites using GREAT [34] and differentially expressed genes using GO (http://david.abcc.ncifcrf.gov/), but did not find many highly enriched categories in either analysis (Table S9). This indicates that chromatin gains and losses occur near many different types of unrelated genes representing a broad spectrum of gene ontologies.
Species-specific DHS sites show evolutionary selection and constraint
The functional interpretations of Common and species-specific DHS sites outlined above naturally lead to predictions about the operation of natural selection. We used HyPhy [35] to test for signatures of positive selection within DHS gains and DHS losses on either the human or chimpanzee lineage [15], [16] (Materials and Methods). Consistent with a functional change unique to humans, both human DHS gains and losses showed significantly more evidence for positive selection on the human branch than on the chimpanzee branch (Mann-Whitney P = 0.03 for gains and P = 0.0009 for losses, Figure 6c, Table S10). Similarly, both chimpanzee DHS gains and losses showed increased positive selection on the chimp branch (P = 0.002 for gains and P = 0.0004 for losses, Figure 6c, Table S10). Signatures of selection for Common DHS sites were not significant on either branch. These results provide evidence that positive selection contributes to species-specific changes in chromatin, both gains and losses, and in the altered use and activity of gene regulatory elements.
Despite this connection with evolutionary pressures, only two DHS gains or losses in fibroblasts overlap previously defined human accelerated conserved non-coding sequences (HACNSs), chimpanzee accelerated conserved non-coding sequences (CACNSs), or human accelerated regions (HARs; Table S11) [14], [36]–[38]. More generally, few DHS sites from any human cell type we have analyzed, including embryonic stem cells, correspond to genomic regions of accelerated turnover (Table S11e). This lack of overlap may be due to the absence of DNase-seq data from specific developmental cell types since HACNSs, CACNSs, and HARs have been associated with developmental gene regulation, or to regions of accelerated turnover representing a different type of genetic element not detected by DNase mapping.
We examined sequence conservation in DHS gains, losses, and Common sites using evolutionarily constrained regions defined by PhastCons [14], [39] and GERP [40] algorithms with Genome Structure Correction (GSC) overlap test statistic [19], [41], [42]. By PhastCons analysis, we found that Common DHS sites were the most conserved, a characteristic of regions under negative selection (Figure S9). Common regions also had the greatest overlap with evolutionarily conserved elements, as defined by GERP (Figure 6d; Materials and Methods). The presence of Common DHS sites in most human cell types (Figure 4c) with presumably greater functional demands may contribute to their higher conservation levels relative to gains and losses. Additionally, losses in both species were more conserved and overlapped more with conserved elements than gains (Figure S9) suggestive of relaxed selection and positive selection, respectively. These trends held true even when noncoding genomic regions were partitioned based on their relationship to genes (promoter, intron, intergenic; Figure 6d). In general, higher degree of conservation within specific regions of the genome can result from local differences either in mutation rate or selection [43]. Given that localized decreases in mutation rate below background are unusual, our data suggest that sequence conservation within Common DHS sites is primarily driven by negative selection to maintain function.
A large fraction of DHS gains (∼70%), losses (∼60%), and Common (∼40%) sites did not overlap any highly conserved elements (Figure 6d). Thus, many DHS sites present in all three species, and possibly many or all of 27 human cell types, are not highly conserved. Understanding how these regions function in all species and cell types without high sequence conservation poses an interesting challenge for evolutionary genomics.
DHS gains near DHS losses are potential binding site turn-over regions
Previous studies have shown that individual transcription factor binding sites (TFBS) “turn over” rapidly during evolution [44]–[46]. Transposon-mediated shifts in the position of enhancers have also been documented between mouse and human [47]. While these showed evidence of TFBS positional change, the turnover of entire DHS sites have not been shown previously. We identified ten possible instances of regulatory-element shuffling where a human DHS gain maps near (<50 kb) a human DHS loss (Figure S10). These regions were found near genes associated with obesity (MCR4, Figure S11), imprinting (GNAS, Figure S12), and glial cell formation (METRNL, Figure S13). We also found cases of nearby (<50 kb) human and chimpanzee DHS sites that were independently gained (Figure S14, Figure S10). One region mapped within an intron of the SRGAP2 gene (Figure S14), which is involved in neuronal guidance during brain development. Overall, the number of DHS gains and losses that mapped within close proximity to each other was not largely enriched or depleted based on randomized permutation tests, thus we cannot disprove that these findings are due to chance observations. Further detailed functional analyses are needed to determine the biological significance, if any, of these closely mapped regulatory changes.
DHS sites are found in genomic segments deleted in the human or chimp lineage
Our analyses above focused exclusively on DHS sites mapped to genome sequences shared between all three primate species. Recently, segments of DNA broadly conserved among mammals were found deleted specifically in the human (hCONDELs) or chimpanzee (cCONDELs) genome [48]. It has been proposed that these largely gene-desert regions contain regulatory elements that contribute to species-specific phenotypes [41]. We found human and chimp DHS sites mapped to 6% of cCONDELs and 11% of hCONDELs supporting their role in species-specific gene expression (Table S11). Many human fibroblast DHS sites that overlap cCONDELs were also present in other human cell types (Figure S15) indicating that some CONDELs contain regulatory elements with pleiotropic consequences.
Specific motifs may confer species-specific DHS sites
We analyzed TFBS motifs found within DHS gain, loss, and common sites across species to identify motifs associated with differences in hypersensitivity. To quantify differences, we determined log ratios of the best position weight matrix (PWM) score in a DHS site between species (Materials and Methods). Most motif scores from the JASPAR database were distributed evenly between species (log ratio near zero) indicating no species-specificity trend for that motif (Supplemental data file 2 and 3 in Dataset S1). However, log ratios of AP1 motif scores deviated from zero and correlated with species-specific DHS sites (Figure 7). For example, in human DHS gains, AP1 motif match scores were higher in the human sequences and lower in the orthologous regions in chimp and macaque (Figure 7a). In contrast, AP1 motif scores in human DHS losses were higher overall in both chimpanzee and macaque sequences compared to human (Figure 7b). Common regions showed even distributions of AP1 motif scores across all three species (Figure 7c). This trend was also found in chimpanzee where chimp DHS gains had higher AP1 motif scores in chimp sequences compared to orthologous regions from human and macaque (Figure 7d), and chimpanzee DHS losses had higher AP1 motif scores in human and macaque (Figure 7e). In a representative human DHS gain, we see that the human allele results in a better match to the canonical AP1 motif than the non-human primate alleles (Figure 7f).
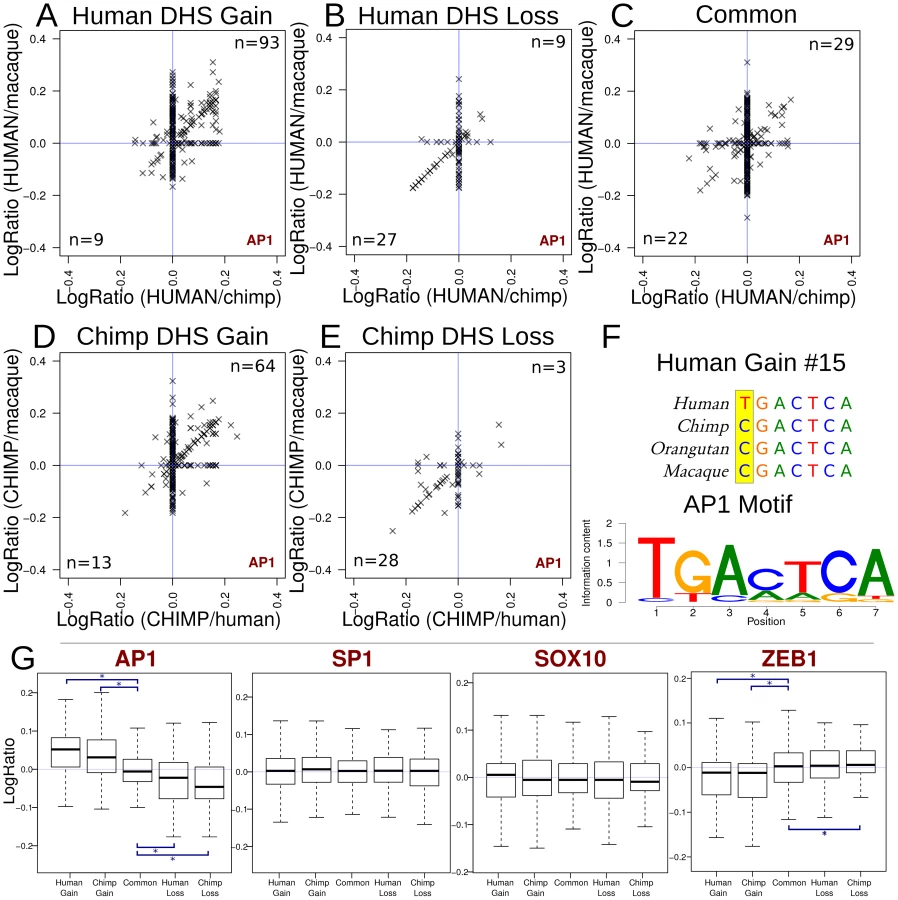
These results suggest species-specific sequence changes within the AP1 motif promote hypersensitivity in some species-specific DHS sites in the human, chimp, and macaque genomes. AP1 was the clearest example of this from motifs represented in JASPAR (Figure 7g, Supplemental data files 2–3 in Dataset S1). Other transcription factors may be acting similarly, but less frequently. For example, we also found that ZNF354C (Supplemental data file 3 in Dataset S1, page 81) and NFE2L2 (Supplemental data file 3 in Dataset S1, page 108) showed similar trends to AP1. In these cases, motif scores positively correlated with the presence of a species-specific DHS sites. In contrast, ZEB1 displayed the opposite trend where higher motif scores correlated with the lack of a species-specific DHS site (Figure 7g and Supplemental data file 3 in Dataset S1, page 65). While the mechanism is not yet clear, our findings and ZEB1's known role as repressor [49] is suggestive of its ability to induce a closed chromatin state via binding to CtBP and HDAC [50].
Discussion
Precise measurements of transcript abundance enabled by RNA-seq experiments have revealed extensive differences in gene expression among closely related species [51] with 10–20% of transcripts within a given tissue found differentially expressed between humans and chimpanzees [12], [22]. Many transcripts are tissue-specific, and given the relatively small number of cell types explored, the total number of differentially expressed genes is likely to be considerably larger. An important goal of molecular evolution research is to understand how differences in transcript abundance have evolved, both because the changes are extensive and because some may underlie the origin of functionally significant traits [13], [52], [53].
Most gene expression differences across species likely have a genetic basis, but it is difficult to relate expression changes to variation in genome sequences. While many non-coding sequence differences are unlikely to impact transcription, for the subset that do, it is often not clear what genes are directly affected. In addition, a non-coding regulatory mutation may only affect gene expression in a subset of tissues or developmental stages, so many functional consequences have gone unrecognized given the limited number of studies performed thus far. Further complicating analysis, transcription is influenced by environmental factors and by epigenetic modifications. But the lack of a complete regulatory element map across species and tissues is perhaps the most important impediment to understanding gene expression differences in terms of genome sequence evolution. Changes in transcript abundance may be caused by genetic differences within individual regulatory elements in cis that affect transcription factor binding affinity [54], or within transcription factors that affect binding to many regulatory elements in trans. Even when the genetic basis is known to be in cis, there is no reliable method for identifying the causal mutations from sequence comparisons. As a result, distributions of positive and negative selection genome-wide correlate poorly with changes in transcript abundance [12], [55], [56].
In this study, we showed that analyzing chromatin accessibility using DNase-seq provides a powerful approach to link genome sequence changes to species - and tissue-specific differences in gene expression. Chromatin accessible DHS sites have three properties that make them especially valuable for evolutionary analyses of gene expression [17], [18]. First, DHS sites identify all known functional classes of regulatory elements, including core promoters, enhancers, repressors, boundary elements, and locus control regions, thus revealing all cis components of transcription through a single genome-wide assay. Second, DHS sites are only found when a regulatory element is active or poised, which means that DNase-seq can be used to identify evolutionary changes in tissue - and developmental stage-specific regulatory elements. And third, DHS sites represent only ∼2% of the genome, making it possible to focus analyses on regions that are involved in transcriptional regulation and ignore regions that are not.
We performed DNase-seq on fibroblasts from three primate species and identified more than two thousand regulatory elements apparently gained or lost since the divergence of humans and chimpanzees. Turnover of regulatory elements was enriched near genes that display species-specific expression differences, indicating that gains and losses in DHS sites have functional consequences on transcript abundance. To our knowledge, this is the first evidence correlating changes in DNase chromatin accessibility and gene expression across species at a genome-wide scale. We found most expression differences occurred without a detectable change in a nearby regulatory element. One possibility is that mutations within DHS sites affect transcription factor binding without causing large changes in overall chromatin accessibility. Future experiments are needed to identify the specific sequence changes that regulate expression at long distances and/or via post-transcriptional mRNA stability mechanisms.
Most regulatory element changes occurred within intergenic regions and introns and were predominantly associated with cell type-specific DHS sites. These results are consistent with expected differences in the extent of pleiotropy: loss of core promoter elements will more likely affect transcription in many tissues and stages of development, while loss of distal enhancers will more likely affect transcription in a subset of tissues. Lower rates of change in core promoter elements and in regulatory elements actively utilized in multiple tissues suggest negative selection is operating to maintain regulatory elements with more critical functions.
Analysis of the DNA sequences within regulatory elements provides evidence for the operation of natural selection within these elements. Sequence within DHS sites utilized across all three species show lower rates of substitution than surrounding DNA, which is a proxy for neutral evolution by drift, consistent with negative selection operating to maintain their function. In contrast, regulatory element gains on the human and chimpanzee branches have significantly elevated rates of substitution, consistent with positive selection for altered function, while regulatory element losses show slightly elevated rates, perhaps due to relaxed selection. Explicit tests for positive selection using branch-specific likelihood ratio tests [16] reveal that the highest association is with regulatory element gains and the lowest with common regulatory elements utilized in all three species. Thus, the genome-wide distribution of both negative and positive selection within regulatory elements correlates in predicted ways with the evolutionary conservation and change in their function. Although we are not aware of any previous evidence for such a relationship, it seems likely in principle that the operation of natural selection is often tied to gains, losses, and conservation of regulatory elements. Most instances of inferred positive selection we identified do not overlap previously described HARs [14] or HACNs [36] highlighting that our DHS gains and losses represent a novel set of differential regulatory elements may have played a role in adaptation during human evolution.
Many studies have documented evolutionary gains and losses of individual transcription factor binding sites or H3K4me3 histone marks among related species [44]–[46], [57], but this is the first evidence showing gains and losses of entire DHS sites. Since we only examined two cell types and applied conservative identification criteria, the full extent of regulatory element changes between humans and chimpanzees is likely to be considerably greater than we report. Nonetheless, the instances of turnover we identified suggest regulatory element gains and losses are a common class of functional change within evolving genomes.
We show that sequence differences among species within particular motifs may result in species-specific DHS sites, which suggests one way non-coding regulatory variants can alter chromatin structure. In particular, mutations that produce better matches to the activator protein 1 (AP1) motif on either the human or chimpanzee genome correlate with the presence of species-specific DHS sites, a result detected in human DHS gains and losses as well as chimpanzee gains and losses. Sequence changes increasing the affinity for AP1 motif more likely drive species-specific changes in chromatin structure rather than species-specific coding mutations within the AP1 components, FOS and JUN proteins, altering the sequence-binding preference of AP1. Since only a minority of species-specific DHS gains and losses has differential AP1 motif scores (Figure 7), this indicates the majority of factors that govern species-specific DHS sites remain to be discovered. AP1 has been implicated in many aspects of cellular function ranging from proliferation, transformation, differentiation, oncogenesis, apoptosis, hormone activation, to tumor suppression [58]–[61]. We provide evidence that other factors act similarly to AP1 or in the opposite direction as repressors, such as ZEB1. Mapping DHS sites across a more diverse set of primate samples, as well as using additional de novo motif discovery and performing ChIP-seq to reveal binding sites, will be an important part of identifying additional factors that confer changes in chromatin structure across species.
Materials and Methods
Cell types and tissue culture
We obtained two cell types from Coriell for this study: skin fibroblast cells and lymphoblastoid cell lines (LCLs). Primary skin fibroblast cells from three human, three chimpanzee, and three macaque individuals. LCLs, which are B cells immortalized with Epstein-Barr Virus, were obtained from the same three human and three chimpanzee individuals that fibroblasts were isolated from (Table S1). EBV does not reliably transfect macaque lymphocyte cells, so matched macaque LCLs cells were not available for this study. Importantly, other recent genome-wide studies that used macaque LCLs were of B-Lymphocyte cells transformed with rhesus herpes papio virus, a close relative of human EBV [57]. Cells from all species were grown in standard growth media. Fibroblast growth media consisted of Gibco's MEM (10370-021), L-Glutamine (25030-081), Pen/Strep (15140-122), and 10% FBS (Hyclone SH30070). LCLs growth media consisted of Gibco's RPMI (21870) media with L-Glutamine, Pen/Strep, and 15% FBS. We harvested fifty million cells for each individual biological replicate and allocated 35 million cells for DNase assays (DNase-seq and DNase-chip), 10 million for genomic DNA (used as control for DNase-chip array hybridization), and 5 million for RNA DGE-seq expression analysis.
DNaseI HS library preparation
DNase-seq libraries we generated as previously described [17], [18] and sequenced via Illumina's GAII sequencer. DNase-chip library preparations, used for validation of our DNase-seq results were performed as previously described [24], [25] and were hybridized to 1% ENCODE Nimblegen arrays [19]. Custom arrays were designed to cover the orthologous regions from chimpanzee and macaque. DNase-chip array intensities were compiled and significant DHS sites were called using ChIPOTle [62] (P<0.000001 peak cutoff).
DNase-seq aligned to native genomes and lifted to hg19
DNase-seq data generated from each species was aligned to the native genome (human hg19, chimpanzee panTro2, and macaque rheMac2) using BWA [63]. To directly compare three different primate species requires that they be aligned to a single reference sequence. Because both the chimpanzee (panTro2) and macaque (rheMac2) reference sequences were built from the existing human reference, we converted all sequences to human coordinates. To do this, we converted each 20-mer DNase-seq sequence from panTro2 or rheMac2 to hg19 with liftOver [23], using a match setting of 80 percent. After conversion to hg19 coordinates, we used F-seq [64] to identify DNaseI hypersensitive (DHS) sites. The F-seq scores from the top 100,000 peaks from each sample were used to determine how well chromatin openness correlates among all 15 samples (Figure 1). This analysis uses a pairwise Pearson correlation to compare the similarity among samples.
Identifying species-specific hypersensitive sites and filters to eliminate liftOver artifacts and CNVs
We used the bioconductor edgeR package to define species-specific hypersensitive regions [26]. EdgeR is designed to detect differences in count data among groups of samples. Briefly, it compares within-group variances to between-group variances using a negative binomial model, and selects entries with significant between-group differences. It was designed for differential expression data such as DGE-seq or RNA-seq, but it is similarly applicable to read counts generated by DNase-seq. One key advantage of edgeR is a normalization procedure specifically designed for high-throughput sequencing studies [26].
To locate significant differences in DNase-seq signal between species, we first identified the union set of the top 100,000 DHS sites (as scored by F-seq) from all 15 samples (9 fibroblasts and 6 LCLs). We used bx-python (https://bitbucket.org/james_taylor/bx-python) to analyze the data. We divided these regions into windows, attempting to maximize the resolution of the windows while minimizing the number of windows required:
Defining windows
We divided the union set into overlapping windows of 300 bp. DHS sites smaller than 300 bp were expanded to 300 bp. Regions larger than 300 bp were tiled with overlapping windows; the overlap varies depending on the size of the hypersensitive region to tile. We start by finding the number of windows that would fit completely inside the defined HS site using the default overlap (100 bp). If these windows discard fewer than 10% of the bases on each edge of the HS site, we tile the site using these windows, because the initial peak calls tend to run a bit wide. If using the default overlap would cause us to lose more than this edge threshold (10%), we add another window and adjust the overlap so the windows exactly cover the entire HS region. These windows cover almost all of the HS bases in the original, while minimizing the number of non-HS bases considered for the downstream analysis. After defining the windows, we liftOver each window back to chimp and macaque and discard any windows that don't map. We also eliminated any windows mapping to the Y chromosome, because we have female samples. This resulted in ∼1.2 million windows across all DHS sites (Supplemental data file 4 in Dataset S1).
Zero counts filter
We next counted the number of reads (DNase cuts) that mapped within each window for each sample. To be certain to compare only regions that are actually found in all 3 primates, we omitted any windows that did not have at least one read count in at least one individual from each species. We believe this is a reasonable filter since there is a basal level of DNase digestion throughout the genome, and regions without any mapping reads in one species are likely caused by alignment ambiguities (such reads are lost in the liftOver process) or reference problems.
Significant differences
We then used edgeR to call windows with significantly different counts in each pairwise comparison at a false discovery rate of 1%. This defined species-specific HS windows. For example, to define human-fibroblast-specific (human DHS gain) regions, we selected any windows with significantly more counts in humans compared (pairwise) to both chimp and macaque fibroblasts. We then merged any significant neighboring windows.
Reciprocal liftOver filter
To confirm that DNase sites detected in only a single species were not due to a liftOver artifact or copy-number variation (CNV), we performed a reciprocal liftOver. Reciprocal liftOver discards regions that do not map 1∶1 between species assemblies. After defining a species-specific or Common DHS sites (Common DHS described below) in human coordinates, we the lifted these windows back to panTro2 or rheMac2. We then compared number of reads from the original native genome alignment to the read count on the lifted (hg19) reference. We found that, in general, these scores correlate well. However, some windows differ in counts on each reference, indicates liftOver artifacts or CNVs. Windows with native counts exceeding the reference counts could result from counts from the native assembly being lifted to multiple places on hg19. Likewise, windows with more reads on hg19 than on the equivalent native assembly could be caused by several regions from the native genome lifting to a single location on hg19. Since these may possibly artificially appear as chromatin gains or losses, we filter out these scenarios by requiring that the number of reads on hg19 for chimp/macaque data be within 10% of the number of reads on the native assembly.
Sharp peaks and assembly filters
Some regions mapped to areas in the genome that are clear artifacts, most likely CNVs. These artifacts are expanses where one of the species has much higher levels of hypersensitivity than the others, and are often located near centromeres or telomeres. A DHS resulting from a massive expansion in one of our samples compared to reference genome appears as a large (kb to Mb-scale) DHS site encompassing the entire CNV and/or DHS sites that cluster closely together. We manually curated a list of such areas and filtered data mapping within these regions (Assembly filter). We also eliminate abnormally sharp peaks, which are likely caused by PCR artifacts, reference assembly inaccuracies, or small differences in copy number between our samples and the reference genomes. If any 30 bp window within a region contains 75% or more of the reads in the entire region, these regions are filtered out as “sharp peaks”. Ultimately, we confirmed the regions by visually inspecting many using both the Integrative Genomics Viewer (IGV) [65] and the UCSC Genome Browser [23]. These filters apply to DHS gains, losses, and common regions.
Addressing the confounding effects of skin biopsy location and Fibroblast heterogeneity
Chang et al. (2002) showed that human skin - and non-skin - fibroblast samples collected from different locations along the body plane showed notable differences in transcriptional profiles [29]. Aware of this issue, we made an effort to use fibroblast cultures made from only skin samples and from the same region of the upper arm. All 3 replicates of macaque Fibroblasts and one human Fibroblast were confirmed from Coriell to be from skin biopsies from the upper arm (the other two locations were unknown). Since our analysis poses a strict requirement of DHS sites to be present in all three human individuals to be called a human DHS gain, having at least one human sample with the biopsy site confirmed to be from the upper arm ensures that the human gains are not a result of human DHS gains being a result of, for example, all human fibroblasts isolated from lower leg. Likewise, to be called a human chromatin loss, DHS sites have to be absent in all three human samples (but present in all chimp and macaque samples); this biopsy location bias is again mitigated by at least one human sample being from the upper arm.
The Yerkes National Primate Center, from where the chimpanzee skin fibroblasts were obtained from, unfortunately do not document the exact location of biopsy. While the standardized skin punch protocol calls for the location of the skin biopsies to be from the ear pinna (personal communication with Fawn Conner-Stroud from Yerkes), we cannot be 100% sure that the samples were isolated from this location. As described above, human DHS losses are a result of signal being present in all three chimpanzee and macaque samples, supporting that these regions are not due to chimp biopsy location. We also want to reiterate that our skin fibroblast results are highly similar in LCL lines that are all uniformly derived from blood samples.
We find that none of our chromatin gains and losses overlap the Hox genes described in the Chang et al., 2002 paper [29]. In addition, a more recent analysis by Rinn et al. [30], using more comprehensive microarrays and more biopsy sites, identified 337 expression array probes (299 unique genes) that were shown to be highly associated with five different general biopsy site locations. We have compared this list of genes to both species-specific chromatin gains/losses, as well as species-specific gene expression, and find <3% of the species-specific and common DHS overlap with the 299 position specific genes. Similarly, species-specific and commonly expressed genes also show <3% overlap (Table S12).
Identifying DNaseI hypersensitive sites in all species (“Common” sites)
In order ensure that our tests for selection were meaningful, we wanted to compare chromatin gains and losses with a set of regions that were open in all species. Rather than simply choose DHS sites that have the highest scores, we wanted to mirror the level of hypersensitivity to that of the species-specific regions. This is important because species-specific DHS sites are not necessarily the strongest DHS sites. We also wanted to select a set of regions similar in size to our sets of gains and losses to retain computational tractability.
To select a set of matched Common DHS sites, we required that each window be similarly open in all 9 samples from all 3 species. To be considered “similarly open” in a given sample, the number of counts must lie between the 20% and 80% quantiles for that sample in the corresponding species-specific regions. For example, we used the human DHS gains identified by edgeR to define the distribution for each of the three human samples, and similarly for chimp and macaque. As such, our set of Common regions is the set of all windows with DNase counts within this range for each of the 9 samples (Figure 2d). To reduce the number of Common regions we found to the most representative set (those that most closely match the average signal intensity of the differential DHS sites), we narrowed the quantiles until we found a set of around one thousand Common regions, which we reasoned would be a sufficient number to examine summary statistics. To ensure that our results are not biased for a specific set of Common regions, we repeated our experiments on a significantly larger set (∼11,000) of Common DHS sites using less stringent criteria (10%–90% quantile). This larger set is even more enriched for promoter regions but does not change our conclusions (data not shown).
After identifying an initial set of potential Common DHS sites, we filtered out any that appeared to be “appendages” to other hypersensitive sites. Without this step, many Common DHS sites would map to the edge of a strong hypersensitive sites. To ensure that a Common DHS site is a standalone DHS site, we examined the neighboring windows surrounding the initial set of Common DHS sites. If a Common DHS site window contained fewer than 80% of the number of reads in the adjacent window on either side, we filtered it out as most likely an “appendage” to a stronger DHS site. This resulted in a final list of 1259 Common DHS sites matched in intensity to the species-specific DHS sites. We also ran this filter on DHS gains and losses, and found that very few of the gains (3–5%) and losses (3–8%) get flagged as “appendages.” Of these, many of them are flagged as a result of FDR threshold issues that simply didn't quite highlight a neighboring window, and we would actually still consider this a legitimate gain region. Because gain/loss appendages are relatively rare and are largely due to threshold issues, we elected to retain them in our final list.
Why are there more species-specific increases than decreases?
In every comparison, we reported more species-specific gains than losses. The most important factor in determining the size of these lists is the level of significance we set by choosing a FDR. To obtain lists that match in length, we could simply adjust the FDR value for the lists to yield about the same number of regions. Instead, we decided to keep the FDR constant and select varying numbers of DHS sites for each category.
However, it is still constructive to consider the disparity. In other words, “at a constant FDR (1%), why are there more species-specific increases than decreases?” This is possibly a result of purifying selection. Because DHS sites are regulatory (and therefore tend to be conserved), a loss of a DHS site probably confers a fitness disadvantage. In this case, we would expect to see more gains than losses.
It is also possible that the prevalence of increases is simply a result of the way we constructed the significance test. A DHS site is a sparse signal (there are more “closed” regions than “open” regions). Combined this with the asymmetry of the evolutionary tree: the chimp and human are more similar to each other than either is to the macaque. A human-specific increase requires both macaque and chimp to be closed (the default), while a human-specific decrease requires both macaque and chimp to be open. This latter scenario will happen less often because the relationship between chimp and human is closer than either to the macaque.
In short, the greater number of gains than losses in our analysis may reflect purifying selection on DHS sites; however, it may also simply be a result of the way we constructed the test, particularly due to using an outgroup species to polarize the chromatin structure changes.
Testing for selection
We tested for evidence of positive selection using the DHS sites indicated as DHS gains, losses, and commons defined by edgeR and common analyses (see above). A branch model test [66] in HYPHY [35] was used to assess evidence for positive selection on each the human and chimp branches. HYPHY uses a likelihood ratio test to compare two opposing models. For the null hypothesis, we specified a composite model that allowed for negative selection, neutral evolution, or relaxed constraint specifically on the branch of interest (i.e. the human branch), with negative or neutral evolution across the rest of the tree. The alternative hypothesis modeled positive selection only on the branch of interest, with negative or neutral evolution on the rest of the tree. For each region, HYPHY performed a likelihood ratio test comparing these hypotheses and output a P value that can be interpreted as a level of evidence for positive selection. In order to test the likelihood of either the null or alternative hypothesis, we specify both the alignment of the region of interest, as well as a background sequence alignment assumed to be evolving neutrally [67]. For the alignment of the region of interest, we used alignments of human, chimp, macaque, and orangutan precomputed at UCSC. For the background sequence, we collected a separate set of local introns for each region to test, following Haygood et al. [16]. To define these background alignments, we started with the UCSC knownGene definition of intron annotations, and then filtered out all first introns, splice junctions, and hypersensitive sites (in any of the 15 samples in this study). In this way, we aimed to select sequences that are evolving neutrally. After defining this set of neutral introns, we used an expanding window centered on the region of interest to collect introns in a region up to 100 kb surrounding the center. We added introns to this collection sequentially as the window expanded until we reached an alignment of 2000 nucleotides. If we were unable to find 2 kb of background introns within 100 kb of sequence, we discarded these regions (this happens rarely). Introns are commonly assumed to be evolving neutrally [43], [68], particularly when our filtering steps are taken into account; however, there are still likely to be regulatory sequences present in our background model, either due to sequences containing DNaseI HS sites in other cell types not tested or due to unannotated or mis-annotated transcripts. In order to further correct for this possibility, we performed each likelihood-ratio test 50 times, using 50 different bootstrapped versions of the background model. We then averaged these P values to assign a final P value for each region. This method has the effect of possibly discarding any elements under selection in some of the bootstrap replicates, increasing our ability to detect positive selection even if we inadvertently chose some background regions under selection. To test significance, for a given set of regions (e.g. human DHS gains) we ordered the P values for selection on both hg19 and panTro2, then did a Mann-Whitney test to see if one branch has higher P values than the other (Table S10).
The fibroblast DHS sites where we can polarize the differences using macaque all have significant differences in the direction we expect, while the Common regions do not have significant differences. In the LCLs, where we are unable to polarize (no macaque LCLs were available), we do not detect a significant difference. This is likely due to a combination of two categories (gains and losses) that have competing selection (i.e. LCL human DHS loss = human DHS loss+chimpanzee DHS gain).
Testing for evolutionary constraint
We calculated the observed fraction of overlaps between DHS sites and evolutionarily constrained regions using constrained regions defined by the Genome Evolutionary Rate Profiling (GERP) method [40] executed on Enredo, Pecan, Ortheus (EPO) [69], [70] 33-way alignments. EPO alignments and GERP regions are available for download at the Ensembl browser (http://ensembl.org). We then constructed a null distribution of the fraction of expected overlaps by using the conservative Genome Structure Correction (GSC) methodology described previously [19], [41], [42]. We performed 1000 randomizations and calculated the mean and standard deviation from the null distribution to assess the statistical significance of the observed overlap (Figure 6d).
We also used PhastCons to explore degree of sequence conservation. For each region, we extracted the mean and max PhastCons score from the primate PhastCons table at UCSC. We then compared the distribution of these scores across the regions to see how sequence conservation is related to hypersensitivity conservation (Figure S9).
Expression analysis using digital gene expression (DGE-seq)
Total RNA purified from 5–10 million cells harvested from the same cell culture used for DNase-seq were also used to generate DGE-seq expression libraries as previously described [12], [71]. Polyadenylated RNA is captured for enrichment of mRNA and the oligo dT primer is used to make cDNA. Briefly, DGE-seq is similar to Serial Analysis of Gene Expression (SAGE) where mRNA abundance is assessed via counting short sequences of their cDNA at specific restriction site locations. These DGE-seq libraries were sequenced using Illumina's GAII sequencer, and averaged 10 million 20mer sequences for each sample, which were then aligned to the samples' native reference sequence using BWA. We used EdgeR to detect differences in tag counts across species by comparing intra-species variances to inter-species variances using a negative binomial model, and selects expressed genes with significant between-species differences [26].
Cross-species correlation of genome-wide expression
Unlike the analysis performed for comparing cross-species DHS sites, we did not liftOver any non-human expression sequences to human. Instead, we simply compared the DGE-seq sequence counts that aligned to exonic regions within each species' native sequence alignment (Supplemental data file 5 in Dataset S1). Because of the high level of homology of the exonic regions between the 3 primate species, we directly compared tag count numbers between each of the orthologous genes. For the genome-wide expression correlation comparison (Figure 1), we normalized tag counts using edgeR to calculate the total library size for each sample and adjusting the tag counts accordingly so that relative differences between the depth of the sequencing reads did not influence the results. Next, we filtered out genes that did not have at least 10 combined tag counts between all of the samples to decrease the noise associated with genes that fall below the meaningful level as recommended for edgeR. Following these filters, we compared the Spearman correlation values between all of the samples and plotted the results as a heatmap with hierarchical clustering to show similarities within and between species and tissue types.
Identification of differentially expressed genes between species
Using edgeR, we identified genes that were significantly differentially expressed between the 3 primate species. Comparisons between species were performed on a pairwise manner comparing 3 individuals of one species against 3 individuals from a second species. The same normalization method and filters used in the expression correlation analysis was also used prior to defining the differentially expressed genes. Differential gene expression was defined as genes having a P value cutoff of 0.05. Using the Macaque expression result as an outgroup, we identified genes that displayed high or low expression specifically on the human and chimp branch. For example, genes we defined as highly expressed in human (human upregulated genes) are differentially expressed in both human/chimp and human/macaque comparisons, but not differentially expressed in the chimp/macaque comparison. Similar criteria were used to identify genes that display low expression in human compared to chimp and macaque (human downregulated genes).
Correlation of species-specific DHS site gains and losses with species-specific gene expression gains and losses
To firmly establish the connection between differential chromatin and differential expression, we tested for significance in overlap in both directions: First, we tested if differential DHS sites tend to be located near differentially expressed genes, and second, we tested if differentially expressed genes tend to have differential DHS sites nearby.
Comparing differential DNase-seq signal to differential gene expression
We compared human DHS gain, human DHS loss, chimpanzee DHS gain, and chimpanzee DHS loss regions to species-specific genes (e.g., human upregulated/downregulated genes, etc.). We first assigned each DHS site its nearest gene, then intersected these with each differential expression set. The number of overlaps for every pairwise combination of DHS sites vs. differentially expressed genes are shown in Table S5a. We calculated P values by permuting (100,000 times) the set of all expressed Fibroblast genes, randomly selecting the number of genes for each comparison, and intersecting those random sets with the genes nearest species-specific DHS sites (Table S7b–S7c). This established a null distribution of overlaps in random intersects.
Comparing differential gene expression to differential DHS sites
To establish the connection in the opposite direction, we did a similar analysis in the reverse direction. Using the UCSC knownGene table, we merged all isoform coordinates for each gene and found all DHS sites within a surrounding 20 kb window. We calculated pairwise overlaps of DHS sites between each differential DHS site list and these lists of all nearby DHS sites. If a gene contained a differential DHS site within 20 kb, it was counted as a match. The number of overlaps for every pairwise combination of sites near differentially expressed genes vs. differential DHS sites are shown in Table S6a. We then permuted genes similar to above (1,000 times), located all nearby DHS sites, and tested for overlap to create a null distribution of overlap count (Table S8b–S8c).
Identification of mutations in motifs associated with species-specific DHS sites
To connect sequence changes to species-specific DHS sites, we compared JASPAR motif scores across species. We first extracted the orthologous DNA sequences for human, chimpanzee, and macaque for each of our DHS gain, loss, and common sites. We scanned and scored each of these sequences for all the position weight matrices (PWMs) in the JASPAR database. We scored a sequence for a given PWM as the highest motif score anywhere in that sequence. This resulted in a region-by-motif matrix of scores; each score is the highest score for each motif/sequence combination. To compare species, we took the log ratio of scores (human/chimp, human/macaque, and chimp/macaque). Where this score is 0, the highest score does not differ between species. Deviations from 0 indicate the direction of improvement in motif match (in a human/chimp comparison, a positive number means the best match in the human sequence scored higher than the best match in the chimp sequence). After calculating these scores and each pairwise log-ratio, we plotted the log-ratios (Supplemental data files 2–3 in Dataset S1 and Figure 7) to examine trends. We calculated the pairwise log-ratios for multiple species comparisons and plotted these on different axis to check whether increases over one species correlate with increases over the other. In these two-dimensional plots, each axis quantifies a different pairwise species relationship. Points that cluster in the upper-right quadrant have higher scores than either of the other species; points that cluster in the lower-left have lower scores. The most interesting variation in these plots is whether the points congregate in the upper-right or lower left. To assess significance, we project each data point onto the y = x line to reduce the dimensionality to 1. We then used the Wilcoxson rank-sum test to compare each distribution to the distribution of the common regions (Figure 7g and Supplemental data file 3 in Dataset S1).
Supporting Information
Zdroje
1. RobertsonM 2010 The evolution of gene regulation, the RNA universe, and the vexed questions of artefact and noise. BMC Biol 8 97
2. OlsonMVVarkiA 2003 Sequencing the chimpanzee genome: insights into human evolution and disease. Nat Rev Genet 4 20 28
3. SholtisSJNoonanJP 2010 Gene regulation and the origins of human biological uniqueness. Trends Genet 26 110 118
4. KingMCWilsonAC 1975 Evolution at two levels in humans and chimpanzees. Science 188 107 116
5. CaceresMLachuerJZapalaMARedmondJCKudoL 2003 Elevated gene expression levels distinguish human from non-human primate brains. Proc Natl Acad Sci U S A 100 13030 13035
6. KhaitovichPHellmannIEnardWNowickKLeinweberM 2005 Parallel patterns of evolution in the genomes and transcriptomes of humans and chimpanzees. Science 309 1850 1854
7. GiladYOshlackASmythGKSpeedTPWhiteKP 2006 Expression profiling in primates reveals a rapid evolution of human transcription factors. Nature 440 242 245
8. EnardWKhaitovichPKloseJZollnerSHeissigF 2002 Intra - and interspecific variation in primate gene expression patterns. Science 296 340 343
9. BlekhmanRMarioniJCZumboPStephensMGiladY 2010 Sex-specific and lineage-specific alternative splicing in primates. Genome Res 20 180 189
10. SomelMFranzHYanZLorencAGuoS 2009 Transcriptional neoteny in the human brain. Proc Natl Acad Sci U S A 106 5743 5748
11. XuAGHeLLiZXuYLiM 2010 Intergenic and repeat transcription in human, chimpanzee and macaque brains measured by RNA-Seq. PLoS Comput Biol 6 e1000843 doi:10.1371/journal.pcbi.1000843
12. BabbittCCFedrigoOPfefferleADBoyleAPHorvathJE 2010 Both noncoding and protein-coding RNAs contribute to gene expression evolution in the primate brain. Genome Biol Evol 2 67 79
13. CarrollSB 2008 Evo-devo and an expanding evolutionary synthesis: a genetic theory of morphological evolution. Cell 134 25 36
14. PollardKSSalamaSRKingBKernADDreszerT 2006 Forces shaping the fastest evolving regions in the human genome. PLoS Genet 2 e168 doi:10.1371/journal.pgen.0020168
15. PrabhakarSPoulinFShoukryMAfzalVRubinEM 2006 Close sequence comparisons are sufficient to identify human cis-regulatory elements. Genome Res 16 855 863
16. HaygoodRFedrigoOHansonBYokoyamaKDWrayGA 2007 Promoter regions of many neural - and nutrition-related genes have experienced positive selection during human evolution. Nat Genet 39 1140 1144
17. BoyleAPDavisSShulhaHPMeltzerPMarguliesEH 2008 High-Resolution Mapping and Characterization of Open Chromatin across the Genome. Cell 132 311 322
18. SongLCrawfordGE 2010 DNase-seq: a high-resolution technique for mapping active gene regulatory elements across the genome from mammalian cells. Cold Spring Harb Protoc 2010: pdb prot5384
19. ConsortiumE 2007 Identification and analysis of functional elements in 1% of the human genome by the ENCODE pilot project. Nature 447 799 816
20. HeintzmanNDStuartRKHonGFuYChingCW 2007 Distinct and predictive chromatin signatures of transcriptional promoters and enhancers in the human genome. Nat Genet 39 311 318
21. XiHShulhaHPLinJMValesTRFuY 2007 Identification and characterization of cell type-specific and ubiquitous chromatin regulatory structures in the human genome. PLoS Genet 3 e136 doi:10.1371/journal.pgen.0030136
22. BlekhmanROshlackAChabotAESmythGKGiladY 2008 Gene regulation in primates evolves under tissue-specific selection pressures. PLoS Genet 4 e1000271 doi:10.1371/journal.pgen.1000271
23. HinrichsASKarolchikDBaertschRBarberGPBejeranoG 2006 The UCSC Genome Browser Database: update 2006. Nucleic Acids Res 34 D590 598
24. CrawfordGEDavisSScacheriPCRenaudGHalawiMJ 2006 DNase-chip: a high-resolution method to identify DNase I hypersensitive sites using tiled microarrays. Nat Meth 3 503 509
25. ShibataYCrawfordGE 2009 Mapping regulatory elements by DNaseI hypersensitivity chip (DNase-Chip). Methods Mol Biol 556 177 190
26. RobinsonMDMcCarthyDJSmythGK 2010 edgeR: a Bioconductor package for differential expression analysis of digital gene expression data. Bioinformatics 26 139 140
27. SaboPJHawrylyczMWallaceJCHumbertRYuM 2004 Discovery of functional noncoding elements by digital analysis of chromatin structure. Proc Natl Acad Sci U S A 101 16837 16842
28. SaboPJKuehnMSThurmanRJohnsonBEJohnsonEM 2006 Genome-scale mapping of DNase I sensitivity in vivo using tiling DNA microarrays. Nat Methods 3 511 518
29. ChangHYChiJTDudoitSBondreCvan de RijnM 2002 Diversity, topographic differentiation, and positional memory in human fibroblasts. Proc Natl Acad Sci U S A 99 12877 12882
30. RinnJLBondreCGladstoneHBBrownPOChangHY 2006 Anatomic demarcation by positional variation in fibroblast gene expression programs. PLoS Genet 2 e119 doi:10.1371/journal.pgen.0020119
31. ConsortiumE 2011 A User's Guide to the Encyclopedia of DNA Elements (ENCODE). PLoS Biol 9 e1001046 doi:10.1371/journal.pbio.1001046
32. SongLZhangZGrasfederLLBoyleAPGiresiPG 2011 Open chromatin defined by DNaseI and FAIRE identifies regulatory elements that shape cell-type identity. Genome Res 21 1757 1767
33. ErnstJKheradpourPMikkelsenTSShoreshNWardLD 2011 Mapping and analysis of chromatin state dynamics in nine human cell types. Nature 473 43 49
34. McLeanCYBristorDHillerMClarkeSLSchaarBT 2010 GREAT improves functional interpretation of cis-regulatory regions. Nat Biotechnol 28 495 501
35. PondSLFrostSDMuseSV 2005 HyPhy: hypothesis testing using phylogenies. Bioinformatics 21 676 679
36. PrabhakarSNoonanJPPaaboSRubinEM 2006 Accelerated evolution of conserved noncoding sequences in humans. Science 314 786
37. PrabhakarSViselAAkiyamaJAShoukryMLewisKD 2008 Human-specific gain of function in a developmental enhancer. Science 321 1346 1350
38. PollardKSSalamaSRLambertNLambotMACoppensS 2006 An RNA gene expressed during cortical development evolved rapidly in humans. Nature 443 167 172
39. SiepelABejeranoGPedersenJSHinrichsASHouM 2005 Evolutionarily conserved elements in vertebrate, insect, worm, and yeast genomes. Genome Res 15 1034 1050
40. CooperGMStoneEAAsimenosGGreenEDBatzoglouS 2005 Distribution and intensity of constraint in mammalian genomic sequence. Genome Res 15 901 913
41. ParkerSCHansenLAbaanHOTulliusTDMarguliesEH 2009 Local DNA topography correlates with functional noncoding regions of the human genome. Science 324 389 392
42. BickelPJBoleyNBrownJBHuangHZhangNR 2010 Subsampling methods for genomic inference. The Annals of Applied Statistics 4 1660 1697
43. GraurDLiW-H 2000 Fundamentals of molecular evolution Sunderland, Mass. Sinauer Associates xiv, 481 p.
44. BradleyRKLiXYTrapnellCDavidsonSPachterL 2010 Binding site turnover produces pervasive quantitative changes in transcription factor binding between closely related Drosophila species. PLoS Biol 8 e1000343 doi:10.1371/journal.pbio.1000343
45. SchmidtDWilsonMDBallesterBSchwaliePCBrownGD 2010 Five-vertebrate ChIP-seq reveals the evolutionary dynamics of transcription factor binding. Science 328 1036 1040
46. OdomDTDowellRDJacobsenESGordonWDanfordTW 2007 Tissue-specific transcriptional regulation has diverged significantly between human and mouse. Nat Genet 39 730 732
47. MikkelsenTSXuZZhangXWangLGimbleJM 2010 Comparative epigenomic analysis of murine and human adipogenesis. Cell 143 156 169
48. McLeanCYRenoPLPollenAABassanAICapelliniTD 2011 Human-specific loss of regulatory DNA and the evolution of human-specific traits. Nature 471 216 219
49. PapadopoulouVPostigoASanchez-TilloEPorterACWagnerSD 2010 ZEB1 and CtBP form a repressive complex at a distal promoter element of the BCL6 locus. Biochem J 427 541 550
50. ZhangCLMcKinseyTALuJROlsonEN 2001 Association of COOH-terminal-binding protein (CtBP) and MEF2-interacting transcription repressor (MITR) contributes to transcriptional repression of the MEF2 transcription factor. J Biol Chem 276 35 39
51. BrawandDSoumillonMNecsuleaAJulienPCsardiG 2011 The evolution of gene expression levels in mammalian organs. Nature 478 343 348
52. WrayGA 2006 The evolution of embryonic gene expression in sea urchins. Integr Comp Biol 46 233 242
53. OrgogozoVMuroNMSternDL 2007 Variation in fiber number of a male-specific muscle between Drosophila species: a genetic and developmental analysis. Evol Dev 9 368 377
54. DegnerJFPaiAAPique-RegiRVeyrierasJBGaffneyDJ 2012 DNase I sensitivity QTLs are a major determinant of human expression variation. Nature 482 390 394
55. HollowayAKLawniczakMKMezeyJGBegunDJJonesCD 2007 Adaptive gene expression divergence inferred from population genomics. PLoS Genet 3 e187 doi:10.1371/journal.pgen.0030187
56. GoodJMHaydenCAWheelerTJ 2006 Adaptive protein evolution and regulatory divergence in Drosophila. Mol Biol Evol 23 1101 1103
57. CainCEBlekhmanRMarioniJCGiladY 2011 Gene expression differences among primates are associated with changes in a histone epigenetic modification. Genetics 187 1225 1234
58. ShaulianEKarinM 2002 AP-1 as a regulator of cell life and death. Nat Cell Biol 4 E131 136
59. KaramouzisMVKonstantinopoulosPAPapavassiliouAG 2007 The activator protein-1 transcription factor in respiratory epithelium carcinogenesis. Mol Cancer Res 5 109 120
60. EferlRWagnerEF 2003 AP-1: a double-edged sword in tumorigenesis. Nat Rev Cancer 3 859 868
61. BiddieSCJohnSSaboPJThurmanREJohnsonTA 2011 Transcription factor AP1 potentiates chromatin accessibility and glucocorticoid receptor binding. Mol Cell 43 145 155
62. BuckMJNobelABLiebJD 2005 ChIPOTle: a user-friendly tool for the analysis of ChIP-chip data. Genome Biol 6 R97
63. LiHDurbinR 2009 Fast and accurate short read alignment with Burrows-Wheeler transform. Bioinformatics 25 1754 1760
64. BoyleAPGuinneyJCrawfordGEFureyTS 2008 F-Seq: a feature density estimator for high-throughput sequence tags. Bioinformatics 24 2537 2538
65. RobinsonJTThorvaldsdottirHWincklerWGuttmanMLanderES 2011 Integrative genomics viewer. Nat Biotechnol 29 24 26
66. ZhangJNielsenRYangZ 2005 Evaluation of an improved branch-site likelihood method for detecting positive selection at the molecular level. Mol Biol Evol 22 2472 2479
67. WongWSNielsenR 2004 Detecting selection in noncoding regions of nucleotide sequences. Genetics 167 949 958
68. GilbertW 1978 Why genes in pieces? Nature 271 501
69. PatenBHerreroJBealKFitzgeraldSBirneyE 2008 Enredo and Pecan: genome-wide mammalian consistency-based multiple alignment with paralogs. Genome Res 18 1814 1828
70. PatenBHerreroJFitzgeraldSBealKFlicekP 2008 Genome-wide nucleotide-level mammalian ancestor reconstruction. Genome Res 18 1829 1843
71. t HoenPAAriyurekYThygesenHHVreugdenhilEVossenRH 2008 Deep sequencing-based expression analysis shows major advances in robustness, resolution and inter-lab portability over five microarray platforms. Nucleic Acids Res 36 e141
Štítky
Genetika Reprodukční medicínaČlánek vyšel v časopise
PLOS Genetics
2012 Číslo 6
- Kazuistika – Perspektivy využití precizované medicíny v rámci personalizované specifické terapie onkologických pacientů
- Nobelova cena za chemii pro genetické nůžky: Objev, který změní naši budoucnost?
- Technologie na bázi RNA v klinické praxi: od přebarvených petúnií k terapii vzácných a dosud jen obtížně léčitelných chorob u lidí
- „Nepředstavovali jsme si, že náš výzkum povede přímo ke vzniku nových léků, dokonce ještě za našeho života“
- Bezplatné služby pro diagnostiku ATTRv amyloidózy pro kardiology
Nejčtenější v tomto čísle
- Rumors of Its Disassembly Have Been Greatly Exaggerated: The Secret Life of the Synaptonemal Complex at the Centromeres
- The NSL Complex Regulates Housekeeping Genes in
- Tipping the Balance in the Powerhouse of the Cell to “Protect” Colorectal Cancer
- Interplay between Synaptonemal Complex, Homologous Recombination, and Centromeres during Mammalian Meiosis
Zvyšte si kvalifikaci online z pohodlí domova
Mazová zátka a její řešení
nový kurzVšechny kurzy