
Fitness Landscape Transformation through a Single Amino Acid Change in the Rho Terminator
Regulatory networks allow organisms to match adaptive behavior to the complex and dynamic contingencies of their native habitats. Upon a sudden transition to a novel environment, the mismatch between the native behavior and the new niche provides selective pressure for adaptive evolution through mutations in elements that control gene expression. In the case of core components of cellular regulation and metabolism, with broad control over diverse biological processes, such mutations may have substantial pleiotropic consequences. Through extensive phenotypic analyses, we have characterized the systems-level consequences of one such mutation (rho*) in the global transcriptional terminator Rho of Escherichia coli. We find that a single amino acid change in Rho results in a massive change in the fitness landscape of the cell, with widely discrepant fitness consequences of identical single locus perturbations in rho* versus rhoWT backgrounds. Our observations reveal the extent to which a single regulatory mutation can transform the entire fitness landscape of the cell, causing a massive change in the interpretation of individual mutations and altering the evolutionary trajectories which may be accessible to a bacterial population.
Published in the journal:
. PLoS Genet 8(5): e32767. doi:10.1371/journal.pgen.1002744
Category:
Research Article
doi:
https://doi.org/10.1371/journal.pgen.1002744
Summary
Regulatory networks allow organisms to match adaptive behavior to the complex and dynamic contingencies of their native habitats. Upon a sudden transition to a novel environment, the mismatch between the native behavior and the new niche provides selective pressure for adaptive evolution through mutations in elements that control gene expression. In the case of core components of cellular regulation and metabolism, with broad control over diverse biological processes, such mutations may have substantial pleiotropic consequences. Through extensive phenotypic analyses, we have characterized the systems-level consequences of one such mutation (rho*) in the global transcriptional terminator Rho of Escherichia coli. We find that a single amino acid change in Rho results in a massive change in the fitness landscape of the cell, with widely discrepant fitness consequences of identical single locus perturbations in rho* versus rhoWT backgrounds. Our observations reveal the extent to which a single regulatory mutation can transform the entire fitness landscape of the cell, causing a massive change in the interpretation of individual mutations and altering the evolutionary trajectories which may be accessible to a bacterial population.
Introduction
Rho-dependent termination is a crucial component of transcriptional regulation in bacteria, and is estimated to terminate approximately half of the transcripts present in E. coli [1], [2]. Recent studies have shown that this type of transcription termination is particularly prevalent in prophage and other horizontally acquired DNA, thus insulating the cell from the deleterious expression of such elements [3], [4]. Rho has also been shown to safeguard genomic integrity by reducing co-directional collisions between transcriptional and replication machinery [5], [6]. The rho* allele was initially identified in a set of short-term laboratory evolution experiments as a major modifier of ethanol tolerance in E. coli MG1655 [7]. This allele contains a missense mutation (F62L) in the RNA binding domain of Rho, which has been previously shown to cause a 20% higher read-through of the termination site tR1 [8], and raise the dissociation constant for (rC)10 by a factor of four [8]. The ethanol tolerance caused by rho* can be traced to overexpression of a few loci (namely the prpBCDE and cadBA operons [9]), which are also among the transcriptional units strongly affected by chemical inhibition of Rho-dependent termination [3]. Mutations to rho have also been observed in several other laboratory evolution experiments [10]–[13], although the nature of their contribution to fitness in those cases is unclear.
Given the pervasive effects on transcription throughout the genome caused by short term inhibition of Rho-dependent termination [3], [4], we sought to determine the full breadth of effects of rho*, both on cellular phenotype and on secondary mutations at other loci. We found widespread effects from both classes; rho* significantly alters cellular fitness in the presence of a variety of nutrient sources and antibiotics, and shows epistatic interactions with mutations at ∼5% of other loci in the genome. Our results illustrate that mutations to rho*, and presumably other central components of the transcriptional apparatus, facilitate the rapid generation of broad phenotypic diversity in bacteria, with significant consequences for the evolution of populations under stress.
Results
rho* causes diverse, bidirectional changes in transcript levels
Based on the biological function of Rho, one naturally expects that rho* cells will show increased transcription immediately downstream of Rho-dependent termination sites. Indeed, measurements of transcript abundances [3] and RNA polymerase occupancy [4] have recently shown that after short-term inhibition of Rho-dependent termination using the compound bicyclomycin (BCM), hundreds of transcriptional readthrough events are apparent throughout the E. coli genome, with significant over-representation of recently and horizontally acquired genomic regions. In order to assess the effects of rho* on transcriptional output during balanced growth, we performed transcriptional profiling comparing WT and rho* cells using tiling microarrays (raw data available at the Gene Expression Omnibus; Accession GSE32022). We then identified genomic regions showing significant differences in transcript levels between the two genetic backgrounds (Bonferroni-corrected p<0.01 and greater than twofold change in representation; see Text S1, Section 1.6). We found a total of 2535 probes (out of 92794 positions) showing significant differences, located in 1281 genes and 433 intergenic regions; a few example loci are shown in Figure S1. We identified the most significantly perturbed genes in rho* by flagging all cases for which the median WT:rho* expression ratio for all sense-stranded probes in a given gene indicated a greater than 1.5-fold change in expression level; using this threshold, 155 genes were overexpressed and 44 underexpressed in rho*. The presence of such a substantial underexpressed fraction again illustrates the presence of indirect effects of rho* on the genetic regulatory network, whereas the overexpressed fraction likely represents a combination of genes overexpressed directly due to transcriptional readthrough and those altered due to regulatory perturbations. Consistent with this interpretation, probes which are significantly overexpressed in rho* cells relative to WT show 1.3-fold enriched overlap with a set of prophages, insertion sequences, and K-12 specific elements (the MDS42 deletion sites [14]; p = 0.011 by random permutation of site locations). Probes overexpressed in WT cells, in contrast, show no significant correlation with MDS42 deletion sites (1.2-fold depletion; p = 0.198).
It is also notable that of the probes identified as significantly overexpressed in rho* cells relative to rhoWT, 82% of those overlapping genes were on the antisense strand (cf. 55% for those underexpressed in rho*; see Figure S2A). A recent RNA-seq study showed the presence of pervasive antisense transcription throughout the E. coli genome [15], which the authors presume to be limited in extent primarily by Rho-dependent termination [15]. In addition, Peters and coworkers identified 24 novel antisense transcripts appearing in BCM-treated cells [4], more directly illustrating a role for Rho-dependent termination in at least some cases. In order to assess the effects of rho* on previously identified antisense transcripts, we compared the log-ratios of transcript levels in rho* vs rhoWT cells along a series of windows centered at 50 bp increments downstream of the 1,005 antisense transcription start sites identified by Dornenburg et al. [15]. As seen in Figure S2B, a significant increase in transcription is apparent in rho* cells along the first several hundred bp of these antisense transcripts, illustrating a major mechanism through which rho* likely alters cellular physiology. Furthermore, this analysis does not capture the effects on antisense transcripts which are at undetectable levels in rhoWT cells (and thus would have been missed from the Dornenburg study).
In order to obtain a pathway-level view of the changes in gene expression caused by rho*, we applied iPAGE [16] to identify gene ontology (GO) pathways which share significant mutual information with the log-ratio of rho* vs. WT RNA from microarray experiments (see Text S1, Section 1.7 for details). In all, 19 non-redundant GO terms show significant mutual information with the expression profile for sense-strand RNA and 10 non-redundant GO terms for the antisense profile (out of 1340 present in the annotation set [17], using a threshold of p<0.0001). The changes in expression patterns for a few example pathways of particular interest are shown in Figure 1A, and the full set of significantly perturbed GO terms is shown in Figure S3. These changes in expression affect a variety of cellular pathways including diverse aspects of metabolism and regulation; for example, genes involved in transcriptional attenuation and post-transcriptional regulation were over-expressed in the rho* background, which may represent a regulatory coping strategy for minimizing the deleterious effects of transcriptional read-through. For the most part, however, the fitness consequences (if any) of these broad-reaching expression modifications were not readily identifiable.

rho* shows direct fitness effects under a wide variety of conditions
In order to measure the extent to which the altered gene expression state of rho* MG1655 cells affects their fitness in different environments, we compared the growth of these cells to that of wild type cells in the presence of a variety of nutrient conditions and antibiotics (see Text S1, Section 1.2 for details). We identified 22 conditions (shown in Figure 1B and Table 1) in which the relative fitness of WT and rho* differed significantly from that in our reference condition (glucose minimal media), with 8 conditions favoring WT and 14 favoring rho* cells (we use steady-state growth rate as a proxy for fitness unless otherwise noted; see Section 2 of Text S1, Table S1, and Figure S4 for a discussion of other relevant quantities). The number and nature of these discovered environments show that the regulatory perturbations caused by the rho* mutation functionally modify a variety of pathways in the cell. In some cases the fitness differences between WT and rho* cells can be directly explained by modified gene expression. For example, the pathway-level analysis in Figure 1A shows that pathways involved in oxidative metabolism are under-expressed in the rho* background, which may explain their increased aminoglycoside resistance [18]. Most conditions showing fitness differences, however, defy such simple explanations.

rho* interacts with secondary mutations throughout the genome
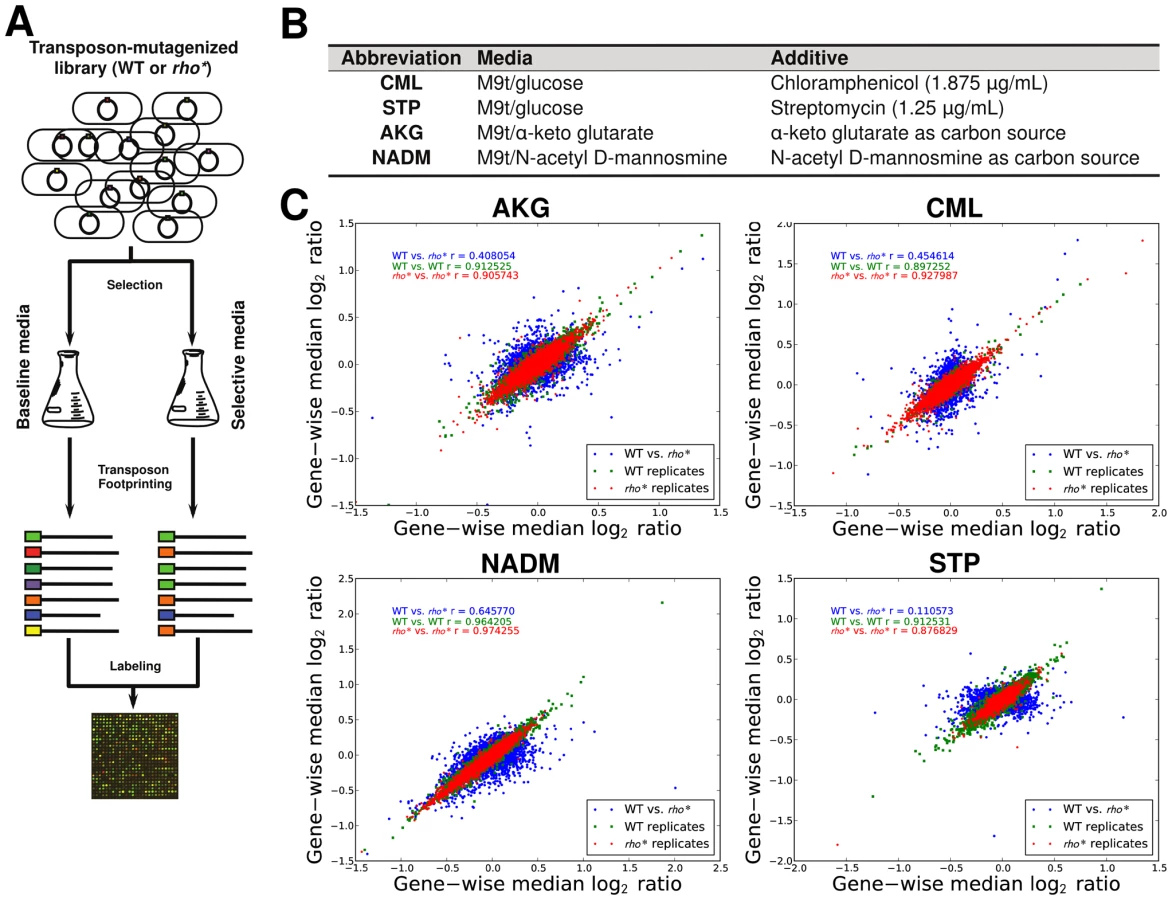
The varied, pleiotropic effects of rho* on fitness under different growth conditions suggested that the rho* mutation may also result in global changes in the fitness landscape, altering the effects of any additional mutations. To test for such changes, we used fitness profiling of transposon-mutagenized libraries [19] to create coarse-grained representations of the fitness landscape under four conditions (a schematic of the procedure is shown in Figure 2A–2B and detailed methods are provided in Text S1, Section 1.5; raw data are available from the Gene Expression Omnibus, Accession GSE32022). For a given condition, a modified fitness landscape implies that there are loci whose fitness consequences are different in rhoWT and rho* backgrounds. These loci, in turn, provide insight into the specific mechanisms through which rho* alters the cell's regulatory and physiological state (we provide more detailed analysis of several such cases, including follow-up experiments on knockout strains, in Text S1, Section 3; see also Figures S5 and S6 and Table S2). Similar patterns emerged in all four conditions tested: both the WT and rho* fitness profiles show hundreds of sites at which transposon insertions lead to significant changes in fitness, with the majority unique to one genetic background or the other (see Table S3). Comparisons of the distributions of selection scores between WT and rho* cells in each condition are shown in Figure 2C; the low correlations between scores of genes in the two genetic backgrounds under all four conditions indicate that the fitness consequences of secondary mutations are heavily dependent on the genotype at the rho locus, whereas correlations between replicates from the same genetic background under each condition are quite high. The overlaps of loci and pathways with significant fitness effects in the two backgrounds are shown in Figure 3; in all four cases, a common core of loci exists which strongly contributes to fitness in both the rhoWT and rho* backgrounds, but the majority (>70%) are unique to one background or the other. This indicates that the effects of these mutations are in fact strongly altered by the rho* allele. Consistently, in Figure 4 we show examples of several loci where significant epistasis between rho* and a secondary mutation was observed in defined strains during follow-up experiments (details of the epistasis experiments and calculations are given in Text S1, Section 4; see also Tables S4 and S5).


The genetic basis of laboratory-evolved ethanol tolerance provides an example of the reshaping of the fitness landscape by rho*. In the course of the experiments reported here, we found that rho* alone is insufficient to confer the levels of ethanol tolerance observed in the evolved strain from [7]. Instead, using global linkage analysis, we found that an epistatic interaction between rho* and rpsL* (a nonsense mutation in the S12 ribosomal protein RpsL) provides a substantial portion of the increase in ethanol tolerance (see Section 5 of Text S1, Figures S7 and S8, and Table S6 for further details). Relative growth rates for all combinations of wild type and identified mutant alleles of rho* and rpsL* are shown in Figure 5. Whereas the rpsL*/rho* double mutant showed a maximum growth rate of 1.01 doublings/hour in the presence of 5.5% ethanol, rho*/rpsLWT cells grew at 0.85 doublings/hour, and both rhoWT/rpsLWT and rhoWT/rpsL* cells showed no or negligible growth. Conversely, in LB alone the double mutant was less fit than all other allelic combinations (despite the beneficial effects of rho* in isolation.). Thus, rho* shows a positive epistatic interactions with rpsL* in ethanol-containing media and a negative epistatic interaction in the absence of ethanol.

Discussion
The wholesale reworking of the cell's fitness landscape due to rho* illustrates its potential to open evolutionary paths that would not otherwise be accessible. rho* provides both direct fitness effects and broadly varying (and often positive) epistatic relationships with perturbations at other loci, allowing it to provide benefits early in an evolutionary trajectory while at the same time providing a different, and frequently larger, profile of possible adaptive secondary mutations (see Tables S3 and S7). The interaction between rho* and rpsL* described above represents one such case: rho* itself provides a beneficial fitness effect in the presence of ethanol, and also exhibits positive epistasis with a mutation at the rpsL locus. A more general schematic is shown in Figure 6: the fitness effects of mutations throughout the genome are strongly influenced by the genotype at rho (and presumably other core transcriptional proteins as well), making some secondary mutations more or less beneficial than they would be otherwise (Figure 6, genotype B). Mutations such as rho* can also both provide a fitness benefit relative to the wild type under common growth conditions, and reveal higher fitness genotypes upon exposure to stress conditions (Figure 6, genotype C). rho* is expected to exert its effects simply by altering transcription (in this case primarily by allowing expression of regions which would not otherwise be transcribed); we thus expect that mutations to other core components of the cell's transcriptional machinery, or to other broadly influential regulators, would show similar levels of evolutionary and phenotypic leverage.

In support of this view, mutations to rho [10]–[13], RNA polymerase [11], [13], [20]–[23] and DNA supercoiling proteins [24]–[26] have frequently been observed in a variety of other recent directed evolution experiments. In a few cases, specific epistatic interactions involving these core transcriptional components were found to shape the future adaptive trajectory of populations. For example, Applebee and coworkers [23] found that in a set of E. coli populations evolved to grow efficiently in glycerol minimal media, RNA polymerase mutations arising earlier in the evolutionary trajectories showed positive epistasis with subsequent glpK mutations (and possibly mutations to dapF and murE as well). Similarly, in analyzing populations from an extremely long-term evolution experiment, Woods et al. [26] found the presence of two variant topA alleles in competition; of these, the allele present in the subsequently evolved strain had a less positive direct effect on fitness, but also showed positive epistasis with a secondary mutation at spoT that yielded an overall higher fitness phenotype. In general, these previous studies have not, however, fully explored the full breadth of both direct phenotypic and epistatic effects of the housekeeping mutations that they identified.
Because the primary effect of a hypomorphic rho allele such as rho* is to allow expression of regions of the genome that would not typically be expressed (see above; also [3], [4]), we thus see that the impairment of a system setting baseline boundaries for gene expression can in fact bring forth beneficial, but normally hidden, phenotypes. The concept that robustness to the effects of mutations may facilitate adaptive evolution by allowing the accumulation of genetic diversity that can be subsequently released by a single perturbation, has been proposed repeatedly in the theoretical literature. Wagner [27] discussed the “neutral space" of a biological system – a range of equivalent solutions to a given condition – and notes that the presence of diversity within the neutral space allows variation that may be useful under subsequently encountered conditions. Draghi et al. [28] illustrated precisely this phenomenon more quantitatively using a computational model, showing that intermediate levels of robustness (modeled as the probability of a given mutation being neutral) accelerated the adaptation of populations by providing a reservoir of phenotypically neutral genetic diversity, including variants that could be adaptive under changing conditions. More recently, in modeling tradeoffs involved in the regulation of translational readthrough, Rajon and Masel [29] found bistable solutions which required either global regulation to reduce readthrough rates, or a combination of higher readthrough rates but reduced incidence of deleterious products upon readthrough; the high readthrough rate solution was found to be more evolvable by allowing the accumulation of non-deleterious genetic diversity downstream of translational stop sites, which can subsequently be incorporated through a single mutation to the stop codon.
The behavior of rho* is also reminiscent of two phenomena related to the core translational machinery of yeast. Jarosz et al. [30] recently showed that the chaperone Hsp90 acts to suppress the effects of genetic variation occurring naturally between yeast strains; temperature stress or chemical inhibition of Hsp90 yielded a wide variety of phenotypic changes among ∼100 different yeast strains under 100 low-level stress conditions, frequently with differing signs of effect on fitness for different strains under the same condition. Furthermore, the authors found that Hsp90 in fact shows epistatic interactions with 20% of naturally occurring genetic variations between the strains under consideration. Similar phenomena have been observed for the yeast prion state [PSI+] [31]–[33], where (as with rho*) an alteration in the behavior of a regulatory protein gives rise to a highly pleiotropic phenotype which may be harmful or beneficial under a variety of conditions, interacts strongly with the precise genetic background of the cell in question, and appears to exert its effects by causing ectopic expression of sequences which are generally silent. The comparison between both mechanisms in yeast and rho* must not be taken too far, as there are also substantial differences, most notably in that Hsp90 and [PSI+] act post-transcriptionally, [PSI+] in particular represents an epigenetic rather than genetic mechanism, and both the prion states and Hsp90 relaxation have been shown to be encouraged by environmental stress [30], [34], whereas no similar mechanism would be expected to mutate core housekeeping genes in stressed E. coli cells preferentially. Nevertheless, the effects of both yeast mechanisms, and bacterial rho mutations, illustrate that microorganisms possess the genetic potential to grow under a broader array of conditions than their regulatory logic allows, that some of the hidden potential may be unlocked through perturbations of core regulatory proteins, and that even a single such perturbation may unleash a wide variety of positive or negative effects and interactions with other loci throughout the genome.
Taken together, our findings illustrate that a single amino acid substitution in the global transcriptional terminator Rho leads to a wholly different regulatory and phenotypic state, in which gene expression is globally altered and cellular fitness in a broad variety of environments has changed. The same mutation also dramatically alters the fitness landscape with regard to other genetic variations, making accessible a number of beneficial secondary mutations that are otherwise neutral or deleterious. The set of states reachable through rho* or other point mutations of core regulatory proteins comprise a previously underappreciated reservoir of additional phenotypes accessible to bacterial populations under selective conditions. These findings imply a role for mutations to regulators such as rho both as evolutionary catalysts, by making a variety of secondary mutations more favorable than they would be in the parental strain, and as evolutionary capacitors [35], by allowing silently accumulating genetic diversity to take effect rapidly upon changes in gene regulation. The full extent to which this capacity of core housekeeping and regulatory proteins is used during evolutionary trajectories, and the identity of the complete set of genes showing such broadly influential behavior, are not yet clear. It is also intriguing to speculate that classical global regulators may also show similarly diverse effects, either upon genetic perturbation or as a response to environmental signals, given that the number of genes substantially perturbed by rho* (∼200) is comparable to the number directly or indirectly affected by each global regulator (e.g., CRP, IHF, or FNR) [36].
Materials and Methods
A complete listing of strains in the present study, including abbreviations used throughout the text, is given in Table S8, and PCR primers are shown in Table S9. The E. coli K12 strain MG1655 [37] (ATCC strain 700926) provides the genetic background for all experiments reported here. For measurement of transcript abundances, cells were grown to mid-log phase in M9t/glucose, and RNA extracted using total RNA purification kit (Norgen Biotek, Cat 17200). After poly-A tailing, the extracted WT and rho* RNA were separately labeled, pooled, and then hybridized to Agilent custom arrays tiling the whole genome at 50 bp intervals, alternating between strands. Transposon mutagenized libraries were prepared as described by Girgis et al. [19]. Selections were carried out for 16 hours in 25 mL of either selective or reference media, and genomic DNA isolated using a DNeasy Blood and Tissue Kit (Qiagen). The transposon footprinting and labeling protocol for quantifying relative fitness under different conditions is described by Girgis et al. [18]. Bacterial growth curves were measured in Costar 96-well clear polystyrene plates, using either a Biotek Synergy MX or Powerwave XS2 plate reader (Biotek; Winooski, VT). Plates were incubated at 37°C with continuous shaking, and optical density (OD) reads at 600 nm taken every 10 minutes. Abbreviations for nutrient sources and antibiotics are given in Table S10. Complete methodological details are provided in Section 1 of Text S1, as well as Figure S9.
Supporting Information
Zdroje
1. BurmannBMSchweimerKLuoXWahlMCStittBL 2010 A NusE∶NusG complex links transcription and translation. Science 328 501 504
2. EpshteinVDuttaDWadeJNudlerE 2010 An allosteric mechanism of Rho-dependent transcription termination. Nature 463 245 249
3. CardinaleCJWashburnRSTadigotlaVRBrownLMGottesmanME 2008 Termination factor Rho and its cofactors NusA and NusG silence foreign DNA in E. coli. Science 320 935 938
4. PetersJMMooneyRAKuanPFRowlandJLKelesS 2009 Rho directs widespread termination of intragenic and stable RNA transcription. Proc Natl Acad Sci USA
5. WashburnRSGottesmanME 2010 Transcription termination maintains chromosome integrity. Proc Natl Acad Sci USA
6. DuttaDShatalinKEpshteinVGottesmanMENudlerE 2011 Linking rna polymerase backtracking to genome instability in E. coli. Cell 146 533 543
7. GoodarziHHottesAKTavazoieS 2009 Global discovery of adaptive mutations. Nat Methods 6 581 583
8. MartinezAOppermanTRichardsonJP 1996 Mutational analysis and secondary structure model of the RNP1-like sequence motif of transcription termination factor Rho. J Mol Biol 257 895 908
9. GoodarziHBennettBDAminiSReavesMLHottesAK 2010 Regulatory and metabolic rewiring during laboratory evolution of ethanol tolerance in E. coli. Mol Syst Biol 6 378
10. ConradTMLewisNEPalssonBO 2011 Microbial laboratory evolution in the era of genome-scale science. Mol Syst Biol 7 509
11. ConradTMJoyceARApplebeeMKBarrettCLXieB 2009 Whole-genome resequencing of Escherichia coli K-12 MG1655 undergoing short-term laboratory evolution in lactate minimal media reveals flexible selection of adaptive mutations. Genome Biol 10 R118
12. KishimotoTIijimaLTatsumiMOnoNOyakeA 2010 Transition from positive to neutral in mutation fixation along with continuing rising fitness in thermal adaptive evolution. PLoS Genet 6 e1001164 doi:10.1371/journal.pgen.1001164
13. TenaillonORodrguez-VerdugoAGautRLMcDonaldPBennettAF 2012 The molecular diversity of adaptive convergence. Science 335 457 461
14. PósfaiGPlunkettGFehérTFrischDKeilGM 2006 Emergent properties of reduced-genome Escherichia coli. Science 312 1044 1046
15. DornenburgJEDevitaAMPalumboMJWadeJT 2010 Widespread antisense transcription in escherichia coli. MBio 1
16. GoodarziHElementoOTavazoieS 2009 Revealing global regulatory perturbations across human cancers. Mol Cell 36 900 911
17. AshburnerMBallCABlakeJABotsteinDButlerH 2000 Gene ontology: tool for the unification of biology. the Gene Ontology Consortium. Nat Genet 25 25 29
18. GirgisHSHottesAKTavazoieS 2009 Genetic architecture of intrinsic antibiotic susceptibility. PLoS ONE 4 e5629 doi:10.1371/journal.pone.0005629
19. GirgisHSLiuYRyuWSTavazoieS 2007 A comprehensive genetic characterization of bacterial motility. PLoS Genet 3 e154 doi:10.1371/journal.pgen.0030154
20. HerringCDRaghunathanAHonischCPatelTApplebeeMK 2006 Comparative genome sequencing of escherichia coli allows observation of bacterial evolution on a laboratory timescale. Nat Genet 38 1406 1412
21. ConradTMFrazierMJoyceARChoBKKnightEM 2010 Rna polymerase mutants found through adaptive evolution reprogram escherichia coli for optimal growth in minimal media. Proc Natl Acad Sci U S A 107 20500 20505
22. MurphyHCashelM 2003 Isolation of rna polymerase suppressors of a (p)ppgpp deficiency. Methods Enzymol 371 596 601
23. ApplebeeMKHerrgardMJPalssonBO 2008 Impact of individual mutations on increased fitness in adaptively evolved strains of escherichia coli. J Bacteriol 190 5087 5094
24. PhilippeNCrozatELenskiRESchneiderD 2007 Evolution of global regulatory networks during a long-term experiment with Escherichia coli. Bioessays 29 846 860
25. CrozatEPhilippeNLenskiREGeiselmannJSchneiderD 2005 Long-term experimental evolution in escherichia coli. xii. dna topology as a key target of selection. Genetics 169 523 532
26. WoodsRJBarrickJECooperTFShresthaUKauthMR 2011 Second-order selection for evolvability in a large escherichia coli population. Science 331 1433 1436
27. WagnerA 2005 Robustness and Evolvability in Living Systems (Princeton Studies in Complexity) Princeton University Press
28. DraghiJAParsonsTLWagnerGPPlotkinJB 2010 Mutational robustness can facilitate adaptation. Nature 463 353 355
29. RajonEMaselJ 2011 Evolution of molecular error rates and the consequences for evolvability. Proc Natl Acad Sci U S A 108 1082 1087
30. JaroszDFTaipaleMLindquistS 2010 Protein homeostasis and the phenotypic manifestation of genetic diversity: principles and mechanisms. Annu Rev Genet 44 189 216
31. ShorterJLindquistS 2005 Prions as adaptive conduits of memory and inheritance. Nat Rev Genet 6 435 450
32. HalfmannRLindquistS 2010 Epigenetics in the extreme: prions and the inheritance of environmentally acquired traits. Science 330 629 632
33. HalfmannRAlbertiSLindquistS 2010 Prions, protein homeostasis, and phenotypic diversity. Trends Cell Biol 20 125 133
34. TyedmersJMadariagaMLLindquistS 2008 Prion switching in response to environmental stress. PLoS Biol 6 e294 doi:10.1371/journal.pbio.0060294
35. TrueHLLindquistSL 2000 A yeast prion provides a mechanism for genetic variation and phenotypic diversity. Nature 407 477 483
36. Gama-CastroSSalgadoHPeralta-GilMSantos-ZavaletaAMuniz-RascadoL 2011 RegulonDB version 7.0: transcriptional regulation of Escherichia coli K-12 integrated within genetic sensory response units (Gensor Units). Nucl Acids Res 39 D98 D105
37. BlattnerFRPlunkettGBlochCAPernaNTBurlandV 1997 The complete genome sequence of Escherichia coli K-12. Science 277 1453 1462
Štítky
Genetika Reprodukční medicínaČlánek vyšel v časopise
PLOS Genetics
2012 Číslo 5
- Kazuistika – Perspektivy využití precizované medicíny v rámci personalizované specifické terapie onkologických pacientů
- Nobelova cena za chemii pro genetické nůžky: Objev, který změní naši budoucnost?
- Technologie na bázi RNA v klinické praxi: od přebarvených petúnií k terapii vzácných a dosud jen obtížně léčitelných chorob u lidí
- „Nepředstavovali jsme si, že náš výzkum povede přímo ke vzniku nových léků, dokonce ještě za našeho života“
- Bezplatné služby pro diagnostiku ATTRv amyloidózy pro kardiology
Nejčtenější v tomto čísle
- Inactivation of a Novel FGF23 Regulator, FAM20C, Leads to Hypophosphatemic Rickets in Mice
- Genome-Wide Association of Pericardial Fat Identifies a Unique Locus for Ectopic Fat
- Slowing Replication in Preparation for Reduction
- An Essential Role for Katanin p80 and Microtubule Severing in Male Gamete Production
Zvyšte si kvalifikaci online z pohodlí domova
Mazová zátka a její řešení
nový kurzVšechny kurzy