
Genome-Wide Association of Pericardial Fat Identifies a Unique Locus for Ectopic Fat
Pericardial fat is a localized fat depot associated with coronary artery calcium and myocardial infarction. We hypothesized that genetic loci would be associated with pericardial fat independent of other body fat depots. Pericardial fat was quantified in 5,487 individuals of European ancestry from the Framingham Heart Study (FHS) and the Multi-Ethnic Study of Atherosclerosis (MESA). Genotyping was performed using standard arrays and imputed to ∼2.5 million Hapmap SNPs. Each study performed a genome-wide association analysis of pericardial fat adjusted for age, sex, weight, and height. A weighted z-score meta-analysis was conducted, and validation was obtained in an additional 3,602 multi-ethnic individuals from the MESA study. We identified a genome-wide significant signal in our primary meta-analysis at rs10198628 near TRIB2 (MAF 0.49, p = 2.7×10-08). This SNP was not associated with visceral fat (p = 0.17) or body mass index (p = 0.38), although we observed direction-consistent, nominal significance with visceral fat adjusted for BMI (p = 0.01) in the Framingham Heart Study. Our findings were robust among African ancestry (n = 1,442, p = 0.001), Hispanic (n = 1,399, p = 0.004), and Chinese (n = 761, p = 0.007) participants from the MESA study, with a combined p-value of 5.4E-14. We observed TRIB2 gene expression in the pericardial fat of mice. rs10198628 near TRIB2 is associated with pericardial fat but not measures of generalized or visceral adiposity, reinforcing the concept that there are unique genetic underpinnings to ectopic fat distribution.
Published in the journal:
. PLoS Genet 8(5): e32767. doi:10.1371/journal.pgen.1002705
Category:
Research Article
doi:
https://doi.org/10.1371/journal.pgen.1002705
Summary
Pericardial fat is a localized fat depot associated with coronary artery calcium and myocardial infarction. We hypothesized that genetic loci would be associated with pericardial fat independent of other body fat depots. Pericardial fat was quantified in 5,487 individuals of European ancestry from the Framingham Heart Study (FHS) and the Multi-Ethnic Study of Atherosclerosis (MESA). Genotyping was performed using standard arrays and imputed to ∼2.5 million Hapmap SNPs. Each study performed a genome-wide association analysis of pericardial fat adjusted for age, sex, weight, and height. A weighted z-score meta-analysis was conducted, and validation was obtained in an additional 3,602 multi-ethnic individuals from the MESA study. We identified a genome-wide significant signal in our primary meta-analysis at rs10198628 near TRIB2 (MAF 0.49, p = 2.7×10-08). This SNP was not associated with visceral fat (p = 0.17) or body mass index (p = 0.38), although we observed direction-consistent, nominal significance with visceral fat adjusted for BMI (p = 0.01) in the Framingham Heart Study. Our findings were robust among African ancestry (n = 1,442, p = 0.001), Hispanic (n = 1,399, p = 0.004), and Chinese (n = 761, p = 0.007) participants from the MESA study, with a combined p-value of 5.4E-14. We observed TRIB2 gene expression in the pericardial fat of mice. rs10198628 near TRIB2 is associated with pericardial fat but not measures of generalized or visceral adiposity, reinforcing the concept that there are unique genetic underpinnings to ectopic fat distribution.
Introduction
Obesity is a heterogeneous condition, and its attendant metabolic sequelae may not be adequately captured by using traditional metrics of generalized adiposity [1]. In part, this is because different fat depots may be associated with differential metabolic risk. For example, visceral abdominal fat is thought to be a unique pathogenic fat depot [2], [3].
Ectopic fat depots, defined as fat depots in non-classical locations [4], may mediate vascular disease due to their local toxic effect on nearby anatomic structures. We and others have shown that pericardial fat, defined as fat surrounding the heart and attendant structures, but not visceral fat, is associated with coronary artery calcification and coronary heart disease [5], [6]. The hypothesized local toxic effect of pericardial fat is supported by experimental research demonstrating perivascular inflammation [7] and smooth muscle cell proliferation [8].
Prior studies have shown that measures of generalized adiposity, including body mass index, are heritable [9]. In addition, more recent work has demonstrated that markers of body fat distribution, including waist-hip-ratio [10], subcutaneous and abdominal visceral fat [3], and fatty liver [11] also have a heritable component. Recent large scale genome-wide association studies (GWAS) have identified genomic loci for indices of body fat distribution that are independent of BMI [11]–[13], further supporting the concept that unique genetic variants exist that are associated with ectopic fat depots. To explore this further, we conducted a GWAS of pericardial fat to determine whether genetic loci are associated with the propensity to store fat around the heart.
Results
Study Sample Characteristics
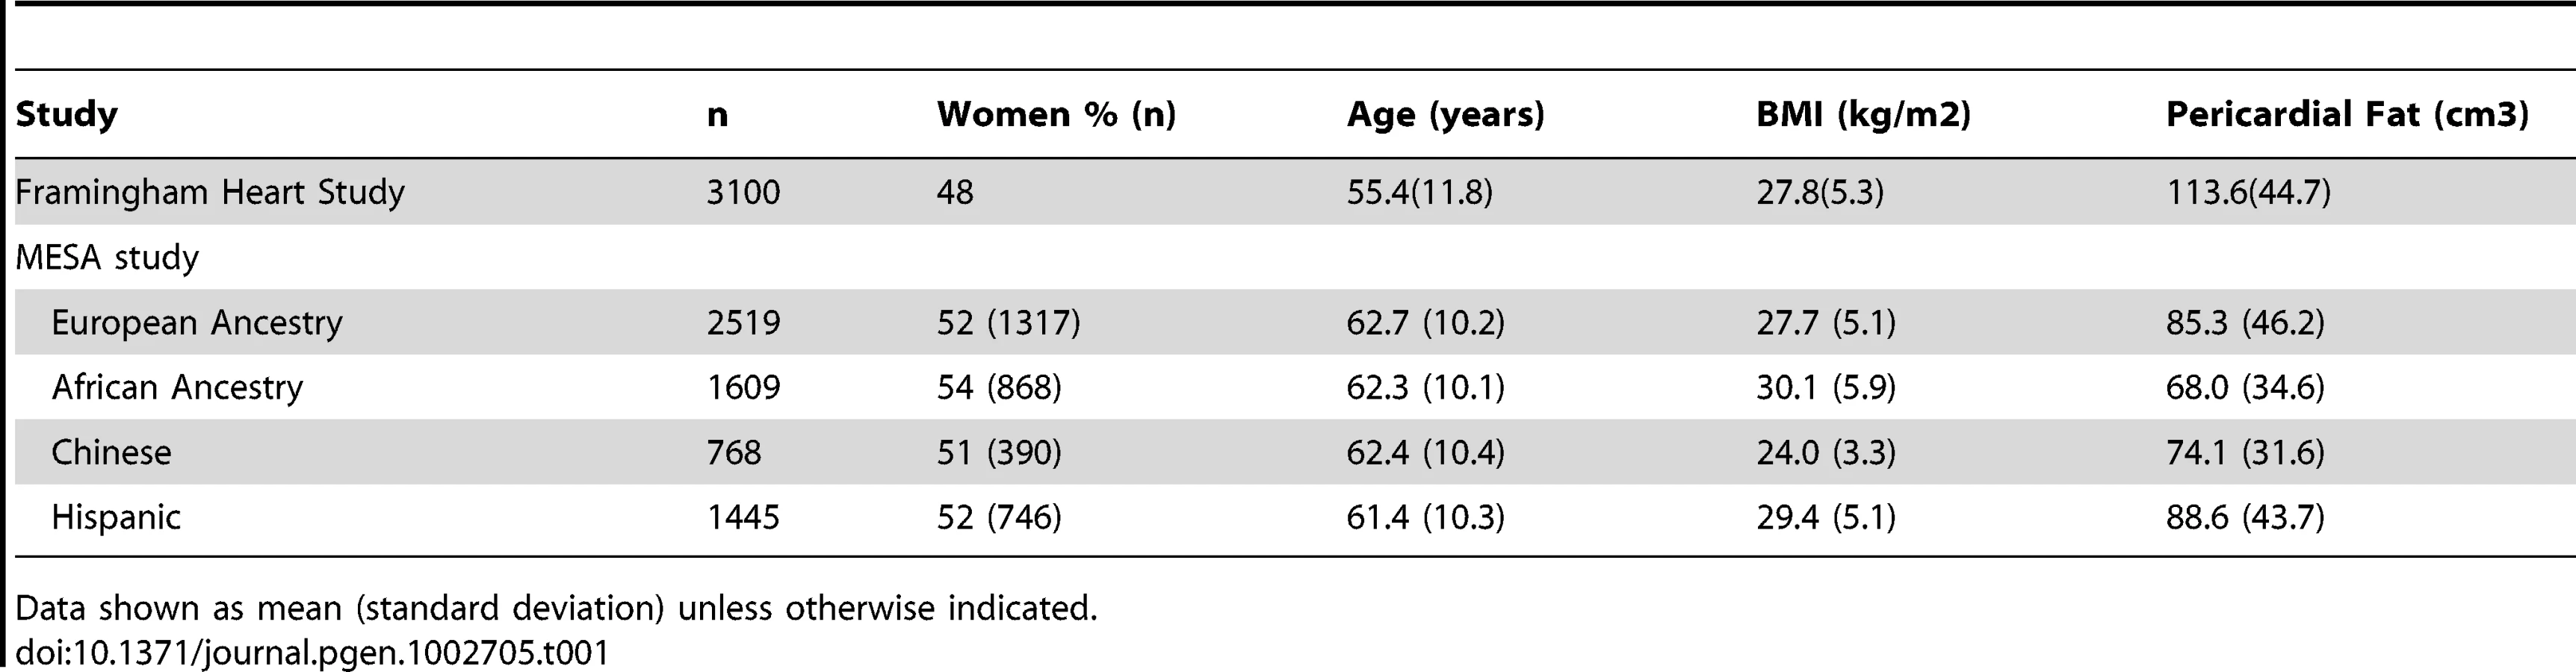
The study sample characteristics are shown in Table 1 and Table S1. The mean age ranged from 55 years in the Framingham Heart Study to 62 years in MESA. In the MESA cohort, mean pericardial fat differed significantly between race/ethnicity groups. Compared to European Americans, mean pericardial fat was significantly lower in African Americans (P = 1.1E-38) and Chinese Americans (P = 4.8E-11), and was higher in Hispanic Americans (p = 0.02).
Heritability Analyses and Genetic Correlations
The heritability (h2) of pericardial fat in the Framingham Heart Study was 50%. Upon additional adjustment for height and weight, the h2 was 52%.
We also calculated genetic correlations between pericardial fat, visceral fat (VAT), and BMI in the Framingham Heart Study. Genetic correlations between pericardial fat and VAT were 0.57; between pericardial fat and BMI 0.41, and between VAT and BMI 0.75. In all cases, we confirmed that there are genes that are associated with pair-wise comparisons of all three traits (all p-values<1.7*10E-15 for overlapping genetic correlations), although our results also suggest that not all genes are shared (all p-values<1.4*10E-22 for non-overlapping genetic correlations).
GWAS Results of Meta-Analysis of the Framingham Heart Study and the MESA Study
The quantile-quantile plot (Figure S1) of GWAS of 5487 individuals of European ancestry demonstrated deviation from the null with no evidence of population stratification (lambda 0.99). The Manhattan plot (Figure S2) shows a genome-wide significant locus on chromosome 2 (p = 2.7E-08). The lead SNP (MAF 0.49) is rs10198628 located ∼80 kb upstream from the TRIB2 gene. Per copy of the A allele, pericardial fat volumes were 4.4 cm3 lower in the Framingham Heart Study and 3.6 cm3 lower in MESA. All SNPs with p-values<1E-04 are shown in Table S2. We observed no evidence for a sex interaction for rs10198628 (p = 0.33). The variance of pericardial fat explained by the lead SNP in the Framingham Heart Study was 0.5% and 0.3% in MESA.
Stage 2 Validation
We performed validation in a multi-ethnic sample of African ancestry (n = 1442, β = 3.31, p = 0.001), Hispanic (n = 1399, β = 3.62, p = 0.004), and Chinese (n = 761, β = 4.56, p = 0.007) participants from the MESA study, with a combined Stage 1 and Stage 2 p-value of 5.4E-14 (Figure 1A and Figure 1B).

Associations with Other Fat Depots
To assess whether rs10198628 is specific to pericardial fat, we assessed its associations with other fat depots (Table 2). We observed no association with body mass index from the GIANT consortium (p = 0.38) [14] or with visceral or subcutaneous fat from the Framingham Heart Study (p = 0.17 and 0.34, respectively). We observed nominal direction-consistent associations with waist-hip-ratio adjusted for body mass index from the GIANT consortium (p = 0.01) [12] and with visceral fat adjusted for body mass index in the Framingham Heart Study (p = 0.01).

Associations of Previously Published Loci for Body Fat Distribution and BMI with Pericardial Fat
We tested whether previously published SNPs in association with waist-hip-ratio adjusted for BMI [12] and BMI [14] are associated with pericardial fat in our meta-analysis dataset (Tables S4 and S5). Among the 14 well-validated SNPs for body fat distribution, we observed direction-consistent associations with CPEB4, a gene involved in cell survival [15]. Among SNPs associated with BMI, we observed nominal direction-consistent associations with FTO; no other associations were observed.
Associations with Subclinical Atherosclerosis and Cardiovascular Disease Traits
Because of the proposed locally toxic effect of pericardial fat and cardiovascular disease outcomes, we evaluated the association of rs10198628 with several CVD phenotypes. We observed nominal, direction-consistent associations with carotid intimal medial thickness from the MESA individuals of European ancestry (n = 2505, p = 0.04), but we observed no association with myocardial infarction from the CARDIoGRAM consortium (p = 0.37, OR 1.01 [95% CI 0.985–1.04], n = 81929) [16] or with coronary artery calcification from the MESA study (p = 0.25, n = 2527).
Association of Validated Coronary Heart Disease SNPs in the Pericardial Fat GWAS
We performed a look-up of 25 validated SNPs for coronary heart disease from the CARDIoGRAM consortium (Table S3) [16], and found that rs12190287 at TCF21 was associated with pericardial fat in a direction-consistent fashion (p = 0.0019). No additional SNPs met the bonferroni corrected p-value threshold of p<0.002 (0.05/25).
Gene Expression
We queried available human gene expression genetics data (see Methods) and identified eQTL associations with TRB2 in omental adipose (rs890069, 1.79e-9) [42] and two independent subcutaneous adipose samples (rs4669887, 3.62e-9; rs12616457, 1.28e-6) [41], [42]. All of these variants are in LD with our lead SNP rs10198628 (rs890069, rs4669887, rs1261657 have r2 0.38, 0.38 and 0.51 with rs10198629, respectively).
Next, we tested for gene expression in multiple subcutaneous (inguinal, axillary, and gluteal) and visceral (epididymal, retroperitoneal, mesenteric, omental) adipose depots as well as classical brown, pericardial, and perivascular adipose tissue which were dissected from high-fat fed male mice. mRNA expression levels of the adipocyte markers aP2 and PPARγ2 were comparable across all adipose depots. Trib2 was expressed in pericardial adipose tissue, as well as all of the other adipose depots surveyed (Figure S3). Expression in pericardial adipose tissue was comparable to that in other adipose depots. Lipin 1 is another annotated gene near our lead SNP. It was also expressed in pericardial adipose tissue, as well as all other depots surveyed. Furthermore, expression in pericardial adipose tissue was comparable to that in other adipose depots.
Discussion
Principal Findings
We have identified a SNP near the TRIB2 locus that is associated with pericardial fat but not with body mass index or visceral abdominal fat. This SNP is also associated with pericardial fat in a multi-ethnic sample consisting of individuals of European, African, Hispanic, and Chinese ancestry. Finally, we identified a nearby eQTL, suggesting the potential for altered gene expression associated with our top SNP, or a correlated variant.
An important question of our work is whether rs10198628 is uniquely associated with pericardial fat, or merely represents a manifestation of generalized adiposity. Our results suggest that this SNP is unique in its association with pericardial fat, given its strong association with pericardial fat in our stage 1 and stage 2 analysis. In contrast, this SNP was not associated with visceral abdominal fat, an ectopic fat depot that is correlated with pericardial fat. Further, we observed no association with our lead SNP and body mass index in more than 100,000 individuals from the GIANT consortium. We note that we observed nominal significance with our lead SNP with VAT-adjusted-for-BMI and waist-hip-ratio-adjusted for BMI, traits representing fat distribution.
Gene expression analysis in mice showed that Trb2 is expressed in all adipose depots. Expression was not enriched in any depot. Confirmation that Trb2 is expressed in adipose tissue supports a functional role for this gene product in this tissue. Future studies are needed to investigate the specific function of Trb2 in adipose tissue, and in particular in pericardial fat. Finally, although our lead SNP is closest to Trb2, it is also possible that this is part of a regulatory region for another gene.
In the Context of the Current Literature
Prior genome-wide association studies have primarily used easily-obtainable anthropometric measurements to estimate body fat distribution [12], [13]. While these studies benefit from concomitant enhanced power, the lack of detailed phenotyping renders the precise meaning of the measurement uncertain. In the current study, we have made use of well-validated measurements of pericardial fat that have been previously associated with coronary artery calcium [5], [17], myocardial infarction [6], [18], measurements of left ventricular structure and function [19], and carotid intimal medial thickness [20]. In this context, we sought to examine our lead SNP with coronary calcium, coronary heart disease, and carotid intimal medial thickness. Given the modest epidemiologic associations that have been observed in concert with the relatively small genetic effect sizes that are typical of GWAS, it is not surprising that we observed only nominal associations with carotid intimal medial thickness.
Our findings are also notable for some enrichment of association with a SNP in TCF21, previously identified in association with coronary heart disease in CARDIoGRAM [16]. TCF21 encodes a transcription factor of the basic helix-loop-helix family and is a molecular marker of white adipose tissue [21]. TCF21 is expressed in the epicardium of the developing zebrafish, and is associated with perivascular cells but not cardiomyocytes [22]. This is relevant given the anatomic location of pericardial fat and thus rendering it a form of perivascular fat surrounding the coronary arteries.
Potential Mechanisms
Our lead SNP is located about 80 kb downstream from TRIB2. TRIB2 is the tribbles homolog 2 gene, part of the Tribbles gene family. TRIB2 expression has been shown to be elevated in lung cancer, and has been found to induce apoptosis through downregulation of the transcription factor CCAAT/enhancer-binding protein alpha (C/EBPα) [23]. Via this mechanism, TRIB2 may also suppress adipocyte differentiation via AKt inhibition and C/EBPα degradation [24]. TRIB2 has also been associated with hematologic abnormalities including acute myelogenous leukemia [25]. TRIB2 has also been shown to be a regulator of the inflammatory activity of monocytes [26], suggesting a possible mechanism by which it may link low density lipoprotein cholesterol to plaque formation. TRB1 and TRB3 have both been linked to obesity and related phenotypes, with TRIB1 gene expression linked to adipose tissue inflammation [27] and TRB3 gene expression associated with insulin resistance [28].
Our lead SNP also lies near the LPIN1 gene, a compelling candidate gene that has previously been identified in association with lipodystrophy syndromes [29]. While it is tempting to implicate this gene in our association analyses, it is notable that only rare, not common variants have been detected in human populations in association with lipodystrophic phenotypes [30]. In addition, our best SNP in the LIPN1 gene has a p-value = 0.03, rendering it less likely. Finally, our lead SNP is ∼1 MB from LPIN1.
Strengths and Limitations
Strengths of our study include the well-characterized pericardial fat data present in both the Framingham Heart Study and the MESA Study. An additional strength is the extension of our findings to multi-ethnic populations, underscoring the generalizability of this finding. Typical of GWAS, we have identified an associated locus, but the causal variant and gene remains unidentified. Limitations include the relatively modest sample size of our study, leading to relatively low power to detect small effects. While our finding that rs12190287 at TCF21 was associated with pericardial fat in a direction-consistent fashion, we are unable to perform a formal mediation analysis.
Implications
These findings support the concept that unique genetic variants exist in association with different ectopic fat depots. These findings are important because they suggest that different ectopic fat depots may each have their own unique genetic signature that is independent of generalized adiposity. Future work should focus on identifying the molecular mechanisms that link these genomic loci to ectopic fat depots, as this could ultimately lead to the identification of novel pathways and new therapeutic targets.
Conclusions
A SNP near TRIB2 is associated with pericardial fat but not measures of generalized or visceral adiposity, reinforcing the concept that there are unique genetic underpinnings to ectopic fat distribution.
Methods
Phenotype Definition
Pericardial fat was measured on CT using protocols determined by the participating studies, as described in the Study-Specific Methods. Sex-specific residuals were created, with adjustment for age, height, and weight, as well as principal components derived from genotypes denoting population stratification where necessary.
Heritability Analyses
Heritability of pericardial fat was calculated in the Framingham Heart Study using standard methods. Sex-and-cohort specific residuals were created and then pooled for analysis using variance components analysis (SOLAR) [31].
Genetic Correlations with Other Adiposity Traits
We used SOLAR [31] to calculate pair-wise genetic correlations between pericardial fat, visceral fat, and BMI in the Framingham Heart Study. We used residuals adjusted for age and sex. We tested two separate hypotheses: RhoG = 0 is the test for overlapping genetic correlations, whereas RhoG = 1 is the test for non-overlapping genetic correlations.
Discovery Analyses
Table S1 and the study specific methods describe the genotyping that was conducted. Quality-control filters were used to exclude low-quality samples or SNPs. Each study imputed ∼2.5 million Phase 2 HapMap SNPs based on CEU samples; allelic dosage was used in the analysis.
Each cohort separately conducted the regression analysis, using an additive genetic effect model with accounting for family structure when necessary. Next, we conducted a fixed effects weighted Z-score meta-analysis given possible differences in phenotype scaling between the participating studies using METAL [32]. Statistical significance was considered when SNPs reached a meta-analysis P value≤5×10⁻⁸ [33]. Discovery analyses were performed on European ancestry participants. SNPs were filtered at a minor allele frequency<2% and an imputation quality score<0.3.
Stage 2 Analysis
We conducted Stage 2 validation using non-white ethnic samples from the MESA study. Statistical significance was achieved when a direction-consistent p-value was at least p<0.05.
Analyses of Related Phenotypes
For our lead SNP, we performed look-up in the publically available GIANT datasets [12], [14]. We also obtained specific look-up results in the CARDIoGRAM (for coronary heart disease) [16] and MESA (for coronary artery calcification and carotid intimal medial thickness).
We also tested whether the 25 previously-identified SNPs for coronary heart disease from the CARDIoGRAM consortium [16] were associated with pericardial fat. To determine statistical significance, we used the false discovery rate q-value; SNPs with q-value<0.05 were considered statistically significant using the QVALUE package in R [34].
Interaction Testing
We tested for a formal sex interaction of rs10198628. Each study computed the interaction regression coefficient, standard error, and p-value. For the sex interaction, we included, age, height, weight, and any principal components (and study center) that were used in the original discovery analysis. We additionally added rs10198628 and the cross-product rs10198628*sex. Interaction terms were meta-analyzed using the weighted z-score approach.
Variance Explained
We calculated the variance explained using the following formula: 2*MAF*(1−MAF)*(((beta)∧2)/((SD)∧2)).
eSNP Analysis
We searched for eQTLs in a region bounded by the LIPN1 and TRIB2 genes using expression SNP (eSNP) datasets availably publically or via collaboration including lymphocytes [35], leukocytes [36], leukocytes from patients with Celiac disease [37], lymphoblastoid cell lines (LCL) from children with asthma [38], HapMap LCL from 3 populations [39], a separate study on HapMap CEU LCL [40], peripheral blood monocytes [41], [42], subcutaneous and omental adipose tissue [43], [44], and blood samples [43], 2 studies on brain cortex [41], [45], three large studies of brain regions including prefrontal cortex, visual cortex and cerebellum (Emilsson, personal communication), liver [44], [46], osteoblasts [47], skin [48], and additional fibroblast, T cell and LCL samples [49]. Statistical significance was considered using the association with gene transcript levels as originally described.
Gene Expression
Adipose tissue was dissected from male C57Bl/6J mice (Jackson Labs) (n = 4) following 20 weeks of ad libitum feeding with a 60% high-fat diet (Research Diets, New Brunswick NJ). High fat feeding was used because many adipose depots (such as pericardial fat) are either not visible or extremely limited in size in standard chow fed mice. Animals were sacrificed and adipose tissues were dissected and frozen in liquid nitrogen. The following adipose depots were dissected: inguinal, axillary, gluteal, brown adipose, epididymal, retroperitoneal, mesenteric, omental, pericardial, and perivascular. All animal experiments were done according to procedures approved by the Institutional Animal Care and Use Committee of Beth Israel Deaconess Medical Center.
Total RNA was isolated using TRIzol (Invitrogen, Carlsbad, CA) combined with RNeasy mini-columns, (Qiagen, Valencia, CA) according to the manufacturer's instructions. For real-time PCR analysis, cDNA was synthesized from RNA using the high capacity cDNA synthesis kit (ABI, Carlsbad, CA). cDNA was used in quantitative PCR containing SYBR-green dye (ABI). mRNA expression levels for each gene were normalized to TBP. Quantitative PCR was performed using an ABI-7900HT PCR machine.
In addition to Lipin 1 and Trb2, the expression of the adipocyte markers aP2 and PPARγ2 were also measured. The primer sequences were as follows: aP2, forward 5′ CAT CAG CGT AAA TGG GGA TT 3′ reverse 5′ CCG CCA TCT AGG GTT ATG AT 3′; Lipin 1, forward 5′ CGT ACG TGC GGC TCT GCG AA 3′ reverse 5′ GCT CGG TCG CGT CAA GCT GA 3′; PPARγ2, forward 5′ GCA TGG TGC CTT CGC TGA 3′ reverse 5′ TGG CAT CTC TGT GTC AAC CAT G 3′; TBP, forward 5′ CCC CTT GTA CCC TTC ACC AAT 3′ reverse 5′ GAA GCT GCG GTA CAA TTC CAG 3′; Trib2, forward 5′ CCC GCC CGA GAC TCC GAA CT 3′ reverse 5′ GCA CAG CGC GGA AAA CGT GG 3′.
Study-Specific Information
Framingham Heart Study
The Framingham Heart Study began in 1948 with the enrollment of the Original Cohort [50]. In 1971, the 5,124 participants were enrolled as part of the Offspring Cohort. Finally, in 2002, the Third Generation cohort was enrolled (n = 4095) [51]. Participants for the present study were derived from the Framingham Heart Study Multi-detector Computed Tomography (MDCT) Sub-Study. Briefly, from June 2002 to April 2005, 3529 participants (2111 Third Generation, 1418 Offspring participants) underwent MDCT.
Framingham Heart Study participants underwent MDCT utilizing 8-slice MDCT in a supine position (LightSpeed Ultra, General Electric, Milwaukee, WI). On average, 48 contiguous 2.5 mm slices of the heart were acquired with prospectively ECG triggered CT scanning protocol (120 kVp, 400 mA, temporal resolution 330 ms).
We measured pericardial fat tissue volumes (cm3) with a dedicated offline workstation (Aquarius 3D Workstation, TeraRecon Inc., San Mateo, CA) based on the principle that absolute Hounsfield Units (HU) values correspond to tissue property. Thus, we set a predefined image display (window width −195 to −45 HU; window center −120 HU) to identify pixels that correspond with adipose tissue. Pericardial fat was measured across the complete available imaging volume in cm3.
We used a semi-automatic segmentation technique which required the reader to manually trace the pericardium. We defined pericardial fat volume as adipose tissue located within the pericardial sac. Using a random sample of 100 participants, intra-reader (ICC 0.97) and inter-reader (ICC 0.95) reproducibility was excellent [5].
Framingham Heart Study participants also underwent eight-slice MDCT imaging of the abdomen with twenty-five contiguous five mm thick slices (120 kVp, 400 mA, gantry rotation time 500 ms, table feed 3∶1) acquired 125 mm beyond the level of S1. Subcutaneous and visceral adipose tissue volumes (SAT and VAT) were assessed as previously described, with excellent inter-class correlations for VAT (0.992) and SAT (0.997) [52].
The Phase II CEU HapMap panel was used a reference to impute genotypes to roughly 2.5 million HapMap SNPs; details can be found in Table S1. MACH v1.0.15/16 (http://www.sph.umich.edu/csg/abecasis/MACH/) was used along with 200 (101 Men and 99 Women) biologically independent individuals in order to establish parameter estimates. We then used these estimates to infer gene dosage. Imputed genotypes were expressed as allelic dosage (which is a decimal value ranging from 0–2).
Linear mixed effects regression modeling was used in order to account for pedigree structure (R lme and kinship package). Given that we observed association with the first principal component (estimated using Eigenstrat [53]), we included this component in our regression models.
MESA
The Multi-Ethnic Study of Atherosclerosis (MESA) is a National Heart, Lung and Blood Institute-sponsored, population-based investigation of subclinical cardiovascular disease and its progression [54]. In brief, a total of 6,809 individuals, aged 45 to 84 years, were recruited from six US communities (Baltimore City and County, MD; Chicago, IL; Forsyth County, NC; Los Angeles County, CA; New York, NY; and St. Paul, MN) between July 2000 and August 2002.
All MESA participants underwent baseline cardiac CT scans at baseline, which were analyzed for pericardial fat volume (cm3). Cardiac CT scans were performed either with an ECG-triggered (at 80% of the RR interval) electron-beam scanner (Chicago, Los Angeles, and New York field centers; Imatron C-150, Imatron) or with prospectively ECG-triggered scan acquisition at 50% of the RR interval with a multidetector system that acquired 4 simultaneous 2.5-mm slices for each cardiac cycle in a sequential or axial scan mode (Baltimore, Forsyth Country, and St. Paul field centers; Lightspeed, General Electric or Volume Zoom, Siemens). Three experienced CT analysts measured pericardial fat volume on the previously obtained images of the heart. For pericardial fat volume, slices within 15 mm above and 30 mm below the superior extent of the left main coronary artery were included. This region of the heart was selected because it includes the pericardial fat located around the proximal coronary arteries (left main coronary, left anterior descending, right coronary, and circumflex arteries). The anterior border of the volume was defined by the chest wall and the posterior border by the aorta and the bronchus. Volume Analysis software (GE Healthcare, Waukesha, WI) was used to discern fat from other tissues with a threshold of −190 to −30 Hounsfield units. The volume was the sum of all voxels containing fat. Our measure of pericardial fat volume was highly correlated with total volume of pericardial fat volume in a random subset of 10 Diabetes Heart Study participants (correlation coefficient: 0.93; p<0.0001). A random sample of 80 MESA participants was selected and their CT scans were reread. The intra-class correlation coefficients of intra-reader and inter-reader reliability were 0.99 and 0.89 for pericardial fat [6].
Coronary artery calcium was also assessed using the cardiac CT scans at baseline [55]. Briefly, we used the reader–work station interface to calibrate each tomographic image according to the estimated attenuation of the calcium phantom and then identified and quantified the coronary calcium in each image. We than calculated the coronary calcium score (Agatston score) for each scan. Intraobserver and interobserver agreement was excellent (kappa statistics, 0.93 and 0.90, respectively).
Carotid intimal medial thickness (IMT) measures were obtained at baseline using ultrasound imaging of the carotid arteries that was performed using a GE scanner. Using videotaped scans, we performed a centralized interpretation of the data. IMT was measured between lumen-intima and media-adventitia interfaces of near and far walls of the common carotid artery (the 1 cm segment proximal to the bifurcation) and the internal carotid artery (including the bifurcation and 1 cm distal to the bifurcation). A maximum IMT for each of these two segments was standardized (by subtraction of the MESA population mean and division by its standard deviation), and the mean of the standardized IMT for the common and the internal carotid maxima was used in analysis [56].
MESA participants provided consent for genotyping and had DNA extracted at the time of baseline enrollment between 2000–2002. Genotyping was performed at the Broad Institute of Harvard and MIT (Boston, Massachusetts, USA) and at the Affymetrix Laboratory (Santa Clara, CA, USA) using the Affymetric Genome-Wide Human SNP Array 6.0 (Affymetrix, Santa Clara, California, USA). Genotype results were imputed to 2.5 million SNPs using IMPUTE v.2.1.0 software (http://mathgen.stats.ox.ac.uk/impute/impute.html) [57]. Participant-specific quality controls included filters for call rate and number of Mendelian errors per individual. SNP-specific quality controls included filters for call rate and heterozygosity.
Linear regression modeling was used with adjustment for age, sex, weight, and height. The first principal component (estimated using Eigenstrat [53]) was included in our regression models.
Supporting Information
Zdroje
1. CornierMADespresJPDavisNGrossniklausDAKleinS 2011 Assessing Adiposity: A Scientific Statement From the American Heart Association. Circulation
2. BjorntorpP 1991 Metabolic implications of body fat distribution. Diabetes Care 14 1132 1143
3. FoxCSMassaroJMHoffmannUPouKMMaurovich-HorvatP 2007 Abdominal visceral and subcutaneous adipose tissue compartments: association with metabolic risk factors in the Framingham Heart Study. Circulation 116 39 48
4. MontaniJPCarrollJFDwyerTMAnticVYangZ 2004 Ectopic fat storage in heart, blood vessels and kidneys in the pathogenesis of cardiovascular diseases. Int J Obes Relat Metab Disord 28 Suppl 4 S58 S65
5. RositoGAMassaroJMHoffmannURubergFLMahabadiAA 2008 Pericardial fat, visceral abdominal fat, cardiovascular disease risk factors, and vascular calcification in a community-based sample: the Framingham Heart Study. Circulation 117 605 613
6. DingJHsuFCHarrisTBLiuYKritchevskySB 2009 The association of pericardial fat with incident coronary heart disease: the Multi-Ethnic Study of Atherosclerosis (MESA). Am J Clin Nutr 90 499 504
7. HenrichotEJuge-AubryCEPerninAPacheJCVelebitV 2005 Production of chemokines by perivascular adipose tissue: a role in the pathogenesis of atherosclerosis? Arterioscler Thromb Vasc Biol 25 2594 2599
8. BarandierCMontaniJPYangZ 2005 Mature adipocytes and perivascular adipose tissue stimulate vascular smooth muscle cell proliferation: effects of aging and obesity. Am J Physiol Heart Circ Physiol 289 H1807 H1813
9. AtwoodLDHeard-CostaNLCupplesLAJaquishCEWilsonPW 2002 Genomewide Linkage Analysis of Body Mass Index across 28 Years of the Framingham Heart Study. Am J Hum Genet 71 1044 1050
10. SellersTADrinkardCRichSSPotterJDJefferyRW 1994 Familial aggregation and heritability of waist-to-hip ratio in adult women: the Iowa Women's Health Study. Int J Obes Relat Metab Disord 18 607 613
11. SpeliotesEKYerges-ArmstrongLMWuJHernaezRKimLJ 2011 Genome-wide association analysis identifies variants associated with nonalcoholic fatty liver disease that have distinct effects on metabolic traits. PLoS Genet 7 e1001324 doi:10.1371/journal.pgen.1001324
12. HeidIMJacksonAURandallJCWinklerTWQiL 2010 Meta-analysis identifies 13 new loci associated with waist-hip ratio and reveals sexual dimorphism in the genetic basis of fat distribution. Nat Genet 42 949 960
13. KilpelainenTOZillikensMCStancakovaAFinucaneFMRiedJS 2011 Genetic variation near IRS1 associates with reduced adiposity and an impaired metabolic profile. Nat Genet 43 753 760
14. SpeliotesEKWillerCJBerndtSIMondaKLThorleifssonG 2010 Association analyses of 249,796 individuals reveal 18 new loci associated with body mass index. Nat Genet 42 937 948
15. KanMCOruganty-DasACooper-MorganAJinGSwangerSA 2010 CPEB4 is a cell survival protein retained in the nucleus upon ischemia or endoplasmic reticulum calcium depletion. Mol Cell Biol 30 5658 5671
16. SchunkertHKonigIRKathiresanSReillyMPAssimesTL 2011 Large-scale association analysis identifies 13 new susceptibility loci for coronary artery disease. Nat Genet 43 333 338
17. DingJKritchevskySBHarrisTBBurkeGLDetranoRC 2008 The association of pericardial fat with calcified coronary plaque. Obesity (Silver Spring) 16 1914 1919
18. MahabadiAAMassaroJMRositoGALevyDMurabitoJM 2009 Association of pericardial fat, intrathoracic fat, and visceral abdominal fat with cardiovascular disease burden: the Framingham Heart Study. Eur Heart J 30 850 856
19. FoxCSGonaPHoffmannUPorterSASaltonCJ 2009 Pericardial fat, intrathoracic fat, and measures of left ventricular structure and function: the Framingham Heart Study. Circulation 119 1586 1591
20. SolimanEZDingJHsuFCCarrJJPolakJF 2010 Association between carotid intima-media thickness and pericardial fat in the Multi-Ethnic Study of Atherosclerosis (MESA). J Stroke Cerebrovasc Dis 19 58 65
21. WaldenTBHansenIRTimmonsJACannonBNedergaardJ 2011 Recruited versus nonrecruited molecular signatures of brown, “brite” and white adipose tissues. Am J Physiol Endocrinol Metab
22. KikuchiKGuptaVWangJHoldwayJEWillsAA 2011 tcf21+ epicardial cells adopt non-myocardial fates during zebrafish heart development and regeneration. Development 138 2895 2902
23. GrandinettiKBStevensTAHaSSalamoneRJWalkerJR 2011 Overexpression of TRIB2 in human lung cancers contributes to tumorigenesis through downregulation of C/EBPalpha. Oncogene 30 3328 3335
24. NaikiTSaijouEMiyaokaYSekineKMiyajimaA 2007 TRB2, a mouse Tribbles ortholog, suppresses adipocyte differentiation by inhibiting AKT and C/EBPbeta. J Biol Chem 282 24075 24082
25. DedhiaPHKeeshanKUljonSXuLVegaME 2010 Differential ability of Tribbles family members to promote degradation of C/EBPalpha and induce acute myelogenous leukemia. Blood 116 1321 1328
26. EderKGuanHSungHYWardJAngyalA 2008 Tribbles-2 is a novel regulator of inflammatory activation of monocytes. Int Immunol 20 1543 1550
27. OstertagAJonesARoseAJLiebertMKleinsorgS 2010 Control of adipose tissue inflammation through TRB1. Diabetes 59 1991 2000
28. BiXPTanHWXingSSWangZHTangMX 2008 Overexpression of TRB3 gene in adipose tissue of rats with high fructose-induced metabolic syndrome. Endocr J 55 747 752
29. PhanJReueK 2005 Lipin, a lipodystrophy and obesity gene. Cell Metab 1 73 83
30. FawcettKAGrimseyNLoosRJWheelerEDalyA 2008 Evaluating the role of LPIN1 variation in insulin resistance, body weight, and human lipodystrophy in U.K. Populations. Diabetes 57 2527 2533
31. AlmasyLBlangeroJ 1998 Multipoint quantitative-trait linkage analysis in general pedigrees. Am J Hum Genet 62 1198 1211
32. WillerCJLiYAbecasisGR 2010 METAL: fast and efficient meta-analysis of genomewide association scans. Bioinformatics 26 2190 2191
33. Pe'erIYelenskyRAltshulerDDalyMJ 2008 Estimation of the multiple testing burden for genomewide association studies of nearly all common variants. Genet Epidemiol 32 381 385
34. StoreyJDTibshiraniR 2003 Statistical significance for genomewide studies. Proc Natl Acad Sci U S A 100 9440 9445
35. GoringHHCurranJEJohnsonMPDyerTDCharlesworthJ 2007 Discovery of expression QTLs using large-scale transcriptional profiling in human lymphocytes. Nat Genet 39 1208 1216
36. IdaghdourYCzikaWShiannaKVLeeSHVisscherPM 2010 Geographical genomics of human leukocyte gene expression variation in southern Morocco. Nat Genet 42 62 67
37. HeapGATrynkaGJansenRCBruinenbergMSwertzMA 2009 Complex nature of SNP genotype effects on gene expression in primary human leucocytes. BMC Med Genomics 2 1
38. DixonALLiangLMoffattMFChenWHeathS 2007 A genome-wide association study of global gene expression. Nat Genet 39 1202 1207
39. StrangerBENicaACForrestMSDimasABirdCP 2007 Population genomics of human gene expression. Nat Genet 39 1217 1224
40. KwanTBenovoyDDiasCGurdSProvencherC 2008 Genome-wide analysis of transcript isoform variation in humans. Nat Genet 40 225 231
41. HeinzenELGeDCroninKDMaiaJMShiannaKV 2008 Tissue-specific genetic control of splicing: implications for the study of complex traits. PLoS Biol 6 e1 doi:10.1371/journal.pbio.0060001
42. ZellerTWildPSzymczakSRotivalMSchillertA 2010 Genetics and beyond–the transcriptome of human monocytes and disease susceptibility. PLoS ONE 5 e10693 doi:10.1371/journal.pone.0010693
43. EmilssonVThorleifssonGZhangBLeonardsonASZinkF 2008 Genetics of gene expression and its effect on disease. Nature 452 423 428
44. GreenawaltDMDobrinRChudinEHatoumIJSuverC 2011 A survey of the genetics of stomach, liver, and adipose gene expression from a morbidly obese cohort. Genome Res 21 1008 1016
45. WebsterJAGibbsJRClarkeJRayMZhangW 2009 Genetic control of human brain transcript expression in Alzheimer disease. Am J Hum Genet 84 445 458
46. SchadtEEMolonyCChudinEHaoKYangX 2008 Mapping the genetic architecture of gene expression in human liver. PLoS Biol 6 e107 doi:10.1371/journal.pbio.0060107
47. GrundbergEKwanTGeBLamKCKokaV 2009 Population genomics in a disease targeted primary cell model. Genome Res 19 1942 1952
48. DingJGudjonssonJELiangLStuartPELiY 2010 Gene expression in skin and lymphoblastoid cells: Refined statistical method reveals extensive overlap in cis-eQTL signals. Am J Hum Genet 87 779 789
49. DimasASDeutschSStrangerBEMontgomerySBBorelC 2009 Common regulatory variation impacts gene expression in a cell type-dependent manner. Science 325 1246 1250
50. DawberTRMeadorsGFMooreFE 1951 Epidemiologic approaches to heart disease: the Framingham study. Am J Publich Health 41 279 286
51. SplanskyGLCoreyDYangQAtwoodLDCupplesLA 2007 The Third Generation Cohort of the National Heart, Lung, and Blood Institute's Framingham Heart Study: design, recruitment, and initial examination. Am J Epidemiol 165 1328 1335
52. Maurovich-HorvatPMassaroJFoxCSMoselewskiFO'DonnellCJ 2007 Comparison of anthropometric, area - and volume-based assessment of abdominal subcutaneous and visceral adipose tissue volumes using multi-detector computed tomography. Int J Obes (Lond) 31 500 506
53. PriceALPattersonNJPlengeRMWeinblattMEShadickNA 2006 Principal components analysis corrects for stratification in genome-wide association studies. Nat Genet 38 904 909
54. BildDEBluemkeDABurkeGLDetranoRez RouxAV 2002 Multi-ethnic study of atherosclerosis: objectives and design. Am J Epidemiol 156 871 881
55. DetranoRGuerciADCarrJJBildDEBurkeG 2008 Coronary calcium as a predictor of coronary events in four racial or ethnic groups. N Engl J Med 358 1336 1345
56. SharrettARDingJCriquiMHSaadMFLiuK 2006 Smoking, diabetes, and blood cholesterol differ in their associations with subclinical atherosclerosis: the Multiethnic Study of Atherosclerosis (MESA). Atherosclerosis 186 441 447
57. HowieBNDonnellyPMarchiniJ 2009 A flexible and accurate genotype imputation method for the next generation of genome-wide association studies. PLoS Genet 5 e1000529 doi:10.1371/journal.pgen.1000529
Štítky
Genetika Reprodukční medicínaČlánek vyšel v časopise
PLOS Genetics
2012 Číslo 5
- Kazuistika – Perspektivy využití precizované medicíny v rámci personalizované specifické terapie onkologických pacientů
- Nobelova cena za chemii pro genetické nůžky: Objev, který změní naši budoucnost?
- Technologie na bázi RNA v klinické praxi: od přebarvených petúnií k terapii vzácných a dosud jen obtížně léčitelných chorob u lidí
- „Nepředstavovali jsme si, že náš výzkum povede přímo ke vzniku nových léků, dokonce ještě za našeho života“
- Bezplatné služby pro diagnostiku ATTRv amyloidózy pro kardiology
Nejčtenější v tomto čísle
- Inactivation of a Novel FGF23 Regulator, FAM20C, Leads to Hypophosphatemic Rickets in Mice
- Genome-Wide Association of Pericardial Fat Identifies a Unique Locus for Ectopic Fat
- Slowing Replication in Preparation for Reduction
- An Essential Role for Katanin p80 and Microtubule Severing in Male Gamete Production
Zvyšte si kvalifikaci online z pohodlí domova
Mazová zátka a její řešení
nový kurzVšechny kurzy