
Stratifying Type 2 Diabetes Cases by BMI Identifies Genetic Risk Variants in and Enrichment for Risk Variants in Lean Compared to Obese Cases
Common diseases such as type 2 diabetes are phenotypically heterogeneous. Obesity is a major risk factor for type 2 diabetes, but patients vary appreciably in body mass index. We hypothesized that the genetic predisposition to the disease may be different in lean (BMI<25 Kg/m2) compared to obese cases (BMI≥30 Kg/m2). We performed two case-control genome-wide studies using two accepted cut-offs for defining individuals as overweight or obese. We used 2,112 lean type 2 diabetes cases (BMI<25 kg/m2) or 4,123 obese cases (BMI≥30 kg/m2), and 54,412 un-stratified controls. Replication was performed in 2,881 lean cases or 8,702 obese cases, and 18,957 un-stratified controls. To assess the effects of known signals, we tested the individual and combined effects of SNPs representing 36 type 2 diabetes loci. After combining data from discovery and replication datasets, we identified two signals not previously reported in Europeans. A variant (rs8090011) in the LAMA1 gene was associated with type 2 diabetes in lean cases (P = 8.4×10⁻⁹, OR = 1.13 [95% CI 1.09–1.18]), and this association was stronger than that in obese cases (P = 0.04, OR = 1.03 [95% CI 1.00–1.06]). A variant in HMG20A—previously identified in South Asians but not Europeans—was associated with type 2 diabetes in obese cases (P = 1.3×10⁻⁸, OR = 1.11 [95% CI 1.07–1.15]), although this association was not significantly stronger than that in lean cases (P = 0.02, OR = 1.09 [95% CI 1.02–1.17]). For 36 known type 2 diabetes loci, 29 had a larger odds ratio in the lean compared to obese (binomial P = 0.0002). In the lean analysis, we observed a weighted per-risk allele OR = 1.13 [95% CI 1.10–1.17], P = 3.2×10⁻¹⁴. This was larger than the same model fitted in the obese analysis where the OR = 1.06 [95% CI 1.05–1.08], P = 2.2×10⁻¹⁶. This study provides evidence that stratification of type 2 diabetes cases by BMI may help identify additional risk variants and that lean cases may have a stronger genetic predisposition to type 2 diabetes.
Published in the journal:
. PLoS Genet 8(5): e32767. doi:10.1371/journal.pgen.1002741
Category:
Research Article
doi:
https://doi.org/10.1371/journal.pgen.1002741
Summary
Common diseases such as type 2 diabetes are phenotypically heterogeneous. Obesity is a major risk factor for type 2 diabetes, but patients vary appreciably in body mass index. We hypothesized that the genetic predisposition to the disease may be different in lean (BMI<25 Kg/m2) compared to obese cases (BMI≥30 Kg/m2). We performed two case-control genome-wide studies using two accepted cut-offs for defining individuals as overweight or obese. We used 2,112 lean type 2 diabetes cases (BMI<25 kg/m2) or 4,123 obese cases (BMI≥30 kg/m2), and 54,412 un-stratified controls. Replication was performed in 2,881 lean cases or 8,702 obese cases, and 18,957 un-stratified controls. To assess the effects of known signals, we tested the individual and combined effects of SNPs representing 36 type 2 diabetes loci. After combining data from discovery and replication datasets, we identified two signals not previously reported in Europeans. A variant (rs8090011) in the LAMA1 gene was associated with type 2 diabetes in lean cases (P = 8.4×10⁻⁹, OR = 1.13 [95% CI 1.09–1.18]), and this association was stronger than that in obese cases (P = 0.04, OR = 1.03 [95% CI 1.00–1.06]). A variant in HMG20A—previously identified in South Asians but not Europeans—was associated with type 2 diabetes in obese cases (P = 1.3×10⁻⁸, OR = 1.11 [95% CI 1.07–1.15]), although this association was not significantly stronger than that in lean cases (P = 0.02, OR = 1.09 [95% CI 1.02–1.17]). For 36 known type 2 diabetes loci, 29 had a larger odds ratio in the lean compared to obese (binomial P = 0.0002). In the lean analysis, we observed a weighted per-risk allele OR = 1.13 [95% CI 1.10–1.17], P = 3.2×10⁻¹⁴. This was larger than the same model fitted in the obese analysis where the OR = 1.06 [95% CI 1.05–1.08], P = 2.2×10⁻¹⁶. This study provides evidence that stratification of type 2 diabetes cases by BMI may help identify additional risk variants and that lean cases may have a stronger genetic predisposition to type 2 diabetes.
Introduction
Common diseases such as type 2 diabetes are highly phenotypically heterogeneous. Few studies have performed genome wide association studies in subsets of patients defined by more stringent phenotypic characteristics. It is possible that reducing the heterogeneity of disease cases may increase power to detect associations over and above the loss of power resulting from reduced numbers. To address these questions we hypothesized that the genetic predisposition to Type 2 diabetes may be different in two strata of cases defined by well-accepted cut-offs for body mass index, the strongest known risk factor for type 2 diabetes.
Genome-wide association (GWA) studies have identified ∼50 independent loci robustly associated with type 2 diabetes [1], [2], [3], [4], [5], [6], [7]. These studies have highlighted new candidate pathways involved in the disease [8], [9], identified overlap with monogenic forms of the disease [1], and provided genetic links with correlated phenotypes [10], [11].
The GWA studies of type 2 diabetes have not so far provided a greatly improved understanding of the clinical heterogeneity of the disease. Type 2 diabetes cases vary appreciably in their clinical characteristics, particularly age of diagnosis and body mass index (BMI). There is also a group of patients who may present with evidence of an autoimmune component to their diabetes, but who are not insulin dependent [12]. In contrast, the identification of the genetic component to monogenic forms of diabetes has often explained the clinical heterogeneity observed [13].
Previous studies have provided some evidence of genetic heterogeneity between non-obese and obese type 2 diabetic cases [14], [15], [16], [17]. For example, the variant with the strongest effect on type 2 diabetes risk, in TCF7L2, has a stronger effect in non-obese cases (odds ratio = 1.53 [0.37–1.71] compared to obese cases (OR = 1.21 [1.09–1.35]) [14]. The effect of FTO variation on type 2 diabetes risk depends on how cases and controls are ascertained by BMI status, but this was expected given FTO's known primary effect on BMI. In the most recent GWA studies of type 2 diabetes [1], risk variants tended to have stronger effects in non-obese compared to obese individuals – of 30 loci examined, 23 showed stronger associations in non-obese compared to obese individuals.
We designed the present study in an attempt to understand better the genetic heterogeneity of type 2 diabetes. Type 2 diabetes GWA studies tend to be enriched with cases with stronger family histories and lower average BMIs compared to community based studies. Nevertheless, there is a wide spectrum of BMI amongst type 2 diabetes cases used in GWA studies, with more cases being obese than lean. In this study we tested the hypothesis that we would identify new genetic variants by limiting the clinical heterogeneity of type 2 diabetes. By stratifying cases by their BMI status and performing separate GWA studies for each strata of BMI we identified two signals of association not previously reported in the largest GWA studies in Europeans [1], although one signal has been identified in a South Asian study [7]. In addition we confirmed with additional data that the majority of known type 2 diabetes genetic associations have stronger effects in lean type 2 diabetic cases compared to obese cases.
Methods
Descriptions of all cases are available in Table 1, and combined with control details in Tables S1 and S2. Our study was designed to limit the clinical heterogeneity of type 2 diabetes by stratification on BMI, whilst also using the largest sample sizes available:

Study design—choice of strata
To test the hypothesis that we would identify new variants associated with type 2 diabetes in different BMI strata, we used the following study design. We used two separate strata of type 2 diabetes cases defined by the two arbitrary, but well established, cut-offs for classifying people as overweight or obese. The first stratum consisted of non-overweight cases, here defined as “lean” (BMI<25 kg/m2). The second strata consisted of obese cases (BMI≥30 kg/m2). For each stratum we used all controls, not selected on BMI to increase statistical power and provide a more robust estimate of the population allele frequency. We did not correct for BMI as BMI was not available in all controls. To check whether or not associations were being driven primarily by effects on BMI we assessed novel variants in an existing GWA studies of BMI using 123,865 individuals from the GIANT consortium [18]. Finally, we performed sensitivity analyses, confirming our findings by stratifying controls by BMI as well as cases.
Study design—choice of studies
We chose to include the largest set of studies available. These studies differed in the proportion of total cases defined as lean (8.4–30.4%), the proportion of total cases defined as obese (21.2–77.8%, plus one GWA study, DGDG, that only selected non-obese cases). Some studies were specifically designed as case control studies and some as case-cohort studies, and we note that the extent of phenotyping performed to exclude autoimmune processes was different across studies, ranging from not requiring insulin treatment in the first year of diagnosis and GAD autoantibody negative, to general practitioner diagnosis of type 2 diabetes.
Descriptions of the participating studies are available in the most recent DIAGRAM manuscript [1], with summary statistics also presented in Table 1 and in Tables S1 and S2. The two discovery GWA study meta-analyses comprised 2112 lean type 2 diabetes cases or 4123 obese type 2 diabetes cases, compared against up to 54,412 controls. For a subset of SNPs available on the Metabochip (a custom Illumina iSelect SNP array that included the SNPs identified by GWA studies for several diseases and traits including type 2 diabetes loci) we included data from an additional 263 lean type 2 diabetes cases, 1735 obese type 2 diabetes cases, and 3691 controls from the GoDARTs study [19].
GWA study methodology
With the exception of the BMI-stratification of cases, the meta-analyses, individual study quality control, and analytical methods were the same as those recently reported [1]. A genomic control inflation factor was calculated for each study for each analysis, and their test statistics were adjusted accordingly. Inverse-variance fixed effect meta-analyses were performed on imputed SNP datasets, testing for an additive genetic effect. All single point effect estimates are given with their [95% confidence intervals (CI)]. Only autosomal SNPs with imputation quality scores >0.5 and a minor allele frequency >1% were included from each study. A SNP was excluded from the meta-analysed dataset if it was present in less than half of the studies. Given the use of two strata, we used a p-value threshold of 2.5×10⁻⁸ as the criterion for genome-wide significance.
Follow-up studies—replication of novel associations in lean and obese GWA studies
An additional 4 studies, totalling 2881 lean cases, 8702 obese cases, and 18957 controls were available for de novo genotyping of SNPs (Table S2). For the DGDG replication, all polymorphisms were genotyped using the KASPar system (KBiosciences). For Malmo CC, ADDITION-Ely, and Norfolk Diabetes Case Control Study (NDCCS), Taqman assay genotyping was performed. For all four studies genotyping success rate was >95%, the genotyping error rate was 0% based on re-genotyping of 384 individuals, and all SNPs were in Hardy-Weinberg equilibrium (P>0.05). We re-performed the inverse-variance weighted meta-analysis for the replication SNPs using data from all the discovery and replication datasets.
Association of variants with BMI
To test whether or not type 2 diabetes associations could be primarily driven by effects on BMI, we assessed the association of novel SNPs with BMI using data from the GIANT consortium consisting of 123,865 individuals.
Association of variants in case-only analyses
There are two possible reasons why a variant may be associated with type 2 diabetes in a stratified sample compared to using all data. First, the variant may have a genuinely larger effect in that stratum compared to the overall sample. Second, chance will influence which SNPs are most strongly associated in different subsets of data. To distinguish between these two possibilities we performed a case only analysis in which we tested whether variants associated with lean or obese type 2 diabetes were also associated with BMI within type 2 diabetes cases. We analysed BMI as a quantitative trait in cases from the GWA studies and meta-analysed the summary statistics. If a variant is genuinely associated with type 2 diabetes with stronger effects in the lean stratum, for example, we would expect the risk allele to be associated with lower BMI within cases. This phenomenon was previously reported for the variant in TCF7L2 [14].
Continuous glycaemic measures
SNP association statistics on glyacemic traits in healthy individuals were provided by the Meta-Analyses of Glucose and Insulin-related traits Consortium (MAGIC). Phenotypes available were fasting insulin (N = 38,238, fasting glucose (N = 46,186), beta-cell function (HOMA-B, N = 36,466), insulin resistance (HOMA-IR, N = 37,037), HbA1C (N = 46,368) and 2 hour glucose (N = 15,234) after an oral glucose challenge. All traits are naturally log transformed, besides fasting glucose, 2 hour glucose and HbA1c. The studies and methodology for these GWA study data are described in their recent publications [2], [20], [21] and available online at www.magicinvestigators.org. We also had access to data from joint meta-analyses of SNP and SNPxBMI interaction on fasting glucose (N = 58,074), insulin (N = 51,570), and 2-hr glucose (N = 15,141), also provided by MAGIC (Manning et al, in press).
eQTL assessment
Identified SNPs were searched against a collected database of expression SNP (eQTL) results including a range of tissues [22], [23], [24], [25], [26], [27], [28], [29], [30], [31], [32], [33], [34], [35], [36], [37], [38].
Testing the role of known SNPs in lean and obese individuals
In addition to identifying new loci, we tested the impact of BMI stratification on SNPs previously identified as associated with type 2 diabetes. We calculated the individual SNP association statistics using the lean and obese meta-analyses described above.
To assess the effects of combining information from all known type 2 diabetes SNPs, we next used a single study, the GoDARTs [19] study, independent from the discovery GWA studies. In GoDARTs there were a total of 263 lean type 2 diabetes cases, 1735 obese type 2 diabetes cases, and 3691 controls. Known SNPs (N = 36 on the metabochip) were defined as those reaching genome-wide significance in studies using samples of European descent (excluding FTO due to primary effect on BMI, and DUSP9 not present on the chip) [1], [2], [3]. We also combined the 36 SNPs into a single allele count model. This analysis consisted of a logistic regression model comparing the count of an individual's type 2 diabetes risk alleles, against case-control status. Each risk allele count was weighted by the point estimate effect size of that SNP from the DIAGRAM meta-analysis [1]. We repeated this analysis using stratified controls (BMI<25 kg/m2 versus lean cases and BMI≥30 kg/m2 versus obese cases) instead of all controls. Finally, individuals were binned into quintiles based on their weighted allele score and per-quintile odds ratios calculated.
Results
Genome-wide association in lean type 2 diabetic individuals
Three independent association signals reached P<2.5×10⁻⁸ in the lean case genome wide meta-analysis (Table 2). Two represented previously reported loci - TCF7L2 (OR = 1.58 [1.47–1.68], P = 2×10−40) and CDKAL1 (OR = 1.26 [1.17–1.35], P = 7×10⁻¹⁰). One novel locus reached genome-wide significance, lead SNP positioned ∼25 kb from the HLA-DQA2 gene (OR = 1.3 [1.19–1.42], P = 1×10⁻⁸). Three further independent signals reached P<5×10⁻⁷, two of which were previously identified (SNPs in or near ADCY5, OR = 1.25 [1.15–1.35] P = 6×10⁻⁸, and SLC30A8, OR = 1.23 [1.15–1.33] P = 4×10⁻⁸) and one of which was novel (SNPs in LAMA1, OR = 1.22 [1.12–1.30] P = 1×10⁻⁷). Rs numbers are given in Table 2.

Genome-wide association in obese type 2 diabetic individuals
In the obese case genome wide meta-analysis, five signals reached genome-wide significance (Table 2), all in or near known loci TCF7L2, FTO, CDKAL1, HHEX, and IGF2BP2. A further three signals reached P<5×10⁻⁷; SNPs in or near the MC4R gene (previously associated with BMI), and two other signals; in HMG20A (previously reported in South Asians -OR = 1.14 [1.09–1.19] P = 2×10⁻⁷) and in ANKS1A (OR = 1.3 [1.18–1.43] P = 5×10⁻⁷).
Follow-up of putative novel signals
We sought to replicate the signals reaching P<5×10⁻⁷ not previously reported in Europeans. SNPs representing the LAMA1 (rs8090011), HLA-DQA2 (rs3916765), HMG20A (rs7178572), and ANKS1A (rs16896390) signals were genotyped in up to 2,881 lean cases, 8,702 obese cases and 18,957 control individuals. Combined discovery and follow-up association statistics for these SNPs are shown in Table 2. In the lean case analysis, the LAMA1 variant was associated with type 2 diabetes (combined P = 8.4×10⁻⁹, OR = 1.13 [1.09–1.18], total lean cases N = 4,993, controls = 70,515) compared to an OR = 1.03 [1.00–1.06] in the obese case analysis (Figure 1 and Figure 2). In the obese case analysis, the HMG20A signal was associated with type 2 diabetes (combined P = 1.3×10⁻⁸, OR = 1.11 [1.07–1.15], total obese cases N = 8,583, controls = 62,063) compared to an OR = 1.09 [1.02–1.17], P = 0.015, in the lean analysis (Figure 3 and Figure 4). In previously published studies including 8,130 cases not stratified by BMI [1], the LAMA1 and HMG20A variants reached only nominal levels of significance of P = 0.002 (OR = 1.07 [1.03–1.12]) and P = 0.003, OR = 1.07 [1.02–1.12] respectively (both in the same directions as reported here).


Considering a random-effects model [39] for both LAMA1 and HMG20A signals gave similar evidence for association (LAMA1 lean analysis: P = 5×10⁻¹⁰, obese analysis: P = 0.02; HMG20A lean analysis: P = 0.04, obese analysis: P = 2.7×10⁻⁸). Evidence for association at the HLA-DQA2 and ANKS1A signals was reduced when follow-up data were included.
Association of variants with BMI
We next attempted to understand further the associations between SNPs in the LAMA1 and HMG20A loci and lean and obese type 2 diabetes cases respectively. Our study design, together with the associations between the FTO and MC4R variants in the obese strata, suggested that variants that primarily operate through BMI could drive our newly identified associations. We therefore assessed the two signals in the existing GWA studies of BMI performed by the GIANT study and consisting of 123,865 individuals [18]. The LAMA1 SNP was not associated with BMI (P = 0.19) whilst the type 2 diabetes risk allele at the HMG20A SNP was nominally associated with increased BMI (P = 0.02).
Association of variants with BMI within cases only
If the associations at the LAMA1 and HMG20A loci are genuinely stronger in one strata of diabetic cases compared to the other, we should observe an association of those variants with BMI within cases only. This phenomenon has previously been reported for the variants in TCF7L2[14]. The LAMA1 type 2 diabetes risk allele was associated with lower BMI within cases alone (P = 2×10⁻⁶ when analysing BMI as a quantitative trait in 26,366 cases), a result consistent with its association being stronger in the lean case analysis. The HMG20A risk allele showed no evidence of association (P>0.05).
Association of variants with continuous glycaemic measures
Next we used data from MAGIC to assess potential roles of variants in normal glycaemia. The SNP representing the novel LAMA1 association showed no association with fasting glucose (P = 0.48, beta(se) = 0.0027(0.004) N = 46,186), fasting insulin (P = 0.87, beta(se) = 0.0006(0.004) N = 38,238), HbA1C (P = 0.19, beta(se) = 0.005(0.004) N = 46,368), 2-hour glucose response (P = 0.43, beta(se) = −0.016(0.02), N = 15,234), or any of the SNP×BMI-interaction models. However, LAMA1 isn't unique amongst type 2 diabetes loci in showing no effect on glycemic traits in the MAGIC study.
The HMG20A diabetes risk allele was associated with higher fasting glucose (P = 0.04, beta(se) = 0.008(0.004), N = 46,186), higher HbA1C (P = 0.002, beta(se) = 0.01(0.004), N = 46,368) and higher fasting glucose after accounting for BMI and SNPxBMI interaction (P = 0.008, N = 58,074).
Association of variants with cis gene expression levels
In an attempt to gain further insight into likely functional genes in the LAMA1 and HMG20A loci, we tested the lead SNPs at for association in a number of eQTL datasets. Tissues tested included various blood, brain, liver and fat samples (see Methods). Only ‘cis’ associations were considered (eQTL effects on a transcript within 1 Mb of the signal SNPs). The rs7178572 SNP in the HMG20A region was significantly associated with mRNA expression levels of HMG20A in the liver (P = 4×10⁻⁵), supported by two separate expression probes, and was the strongest known regional SNP for both the liver eQTL and type 2 diabetes. No other study-wide significant results were observed (N = 14 tissues, 24 datasets/analyses).
Evidence that genetic variants associated with type 2 diabetes have different effects between lean and obese cases
For each of 36 published type 2 diabetes loci (identified in European studies and available on the metabochip) we compared the effect sizes between the lean and obese GWA study meta-analyses (Table 3). Among the 36 independent variants, 29 had a larger point estimate odds ratio in the lean analysis compared to the obese analysis (binomial test of 29/36 versus 50% under the null hypothesis of no difference, P = 0.0002). We next assessed the combined effect of these SNPs in a case control study independent of the GWA studies - GoDARTs (Figure 5). In the lean stratum, we observed a weighted per-risk allele OR = 1.13 [1.10–1.17], P = 3.2×10⁻¹⁴. This was larger than the same model fitted in the obese strata where the OR = 1.06 [1.05–1.08], P = 2.2×10⁻¹⁶. Results were very similar when stratifying the controls as well as the cases by BMI: lean weighted per risk-allele OR = 1.13 [1.09–1.17]; obese weighted per risk-allele OR = 1.08 [1.05–1.10] (heterogeneity of odds ratios P = 0.036). We also observed a difference between lean and obese cases when removing controls and fitting a regression model of lean cases vs obese cases (P = 0.0001). None of these 36 variants were associated with BMI in 28,000–32,000 individuals from GIANT [1], [2].
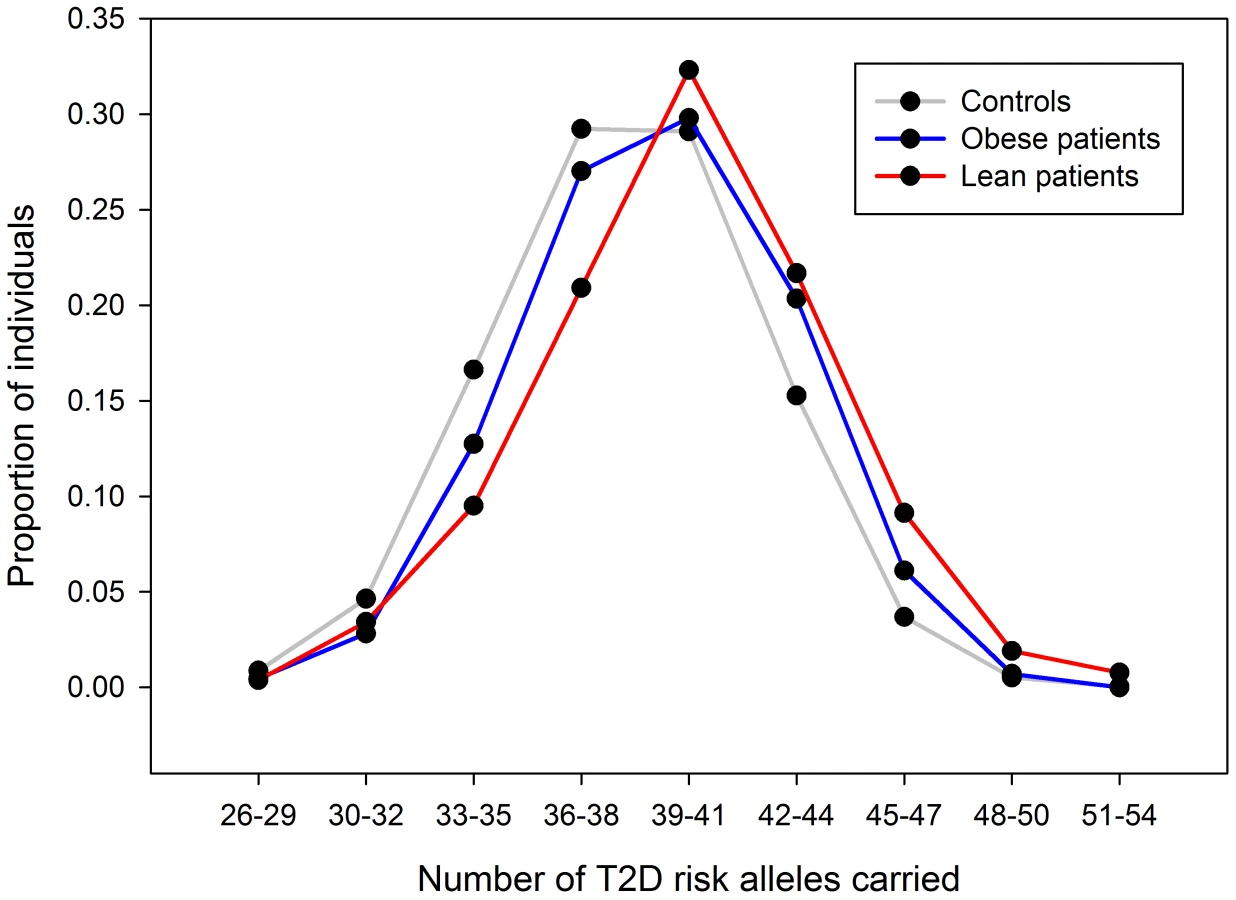

We next divided the case/control samples into risk quintiles, based on the number of risk alleles they carry, weighted by the relative effect sizes of those alleles from the larger DIAGRAM meta-analysis. The risk of being in each quintile relative to the median quintile is shown in Figure 6. For the lean group, we observed an OR = 2.1 [1.47–3.01] for the quintile of individuals carrying the most risk alleles compared to the middle quintile. This effect was larger than that in the obese group where the equivalent OR = 1.37 [1.15–1.64].

Discussion
We have confirmed our hypothesis that it is possible to identify genetic associations in previously tested samples by constraining the phenotypic heterogeneity of disease cases. By stratifying type 2 diabetes into two well accepted definitions of lean and obese cases, we identified and replicated one locus in each BMI stratum, each previously unreported in European studies: a signal in the LAMA1 gene in the lean stratum and a signal in the HMG20A gene in the obese stratum. Lack of evidence for association with BMI for these two signals in 123,000 individuals [18] argues that these associations are not driven by a primary association with BMI.
There are two reasons why previously undetected genetic associations may be observed in stratified data. First chance, in this context “sampling error”, may occur – new signals may reach statistical thresholds in subsets of data due to a combination of real association and chance. Second, the signal may represent genuine heterogeneity. The enrichment of the LAMA1 signal in lean type 2 diabetes cases compared to obese cases is likely to be a real effect but the enrichment of the HMG20A signal in obese cases is more likely to be due to chance. Whilst we observed some regression to the mean (or “winner's curse”) for the LAMA1 signal, the effects remained different in lean compared to obese cases in the replication samples alone (Figure 1). In addition, the LAMA1 type 2 diabetes risk allele was associated with lower BMI within cases alone (P = 2×10⁻⁶ when testing BMI as a quantitative trait in cases) – a similar result was previously reported for the TCF7L2 risk allele [16]. In contrast there is no evidence that the HMG20A signal is stronger in obese replication strata compared to lean replication strata (Figure 3) and there was no association with increased BMI within cases alone (P>0.05 when testing BMI as a quantitative trait in cases).
The LAMA1 signal falls in a recombination block within the LAMA1 gene (Figure 2), with the lead SNP positioned within intron 61. Searching for correlated SNPs (r2>0.5) using 1000 Genomes Project data identified only additional intronic SNPs. Previous cell biology studies support a role for LAMA1, encoding laminin-1, in diabetes etiology - inhibition of LAMA1 expression reduced glucose-stimulated secretion in INS1E cells [40]. Several studies observed the beneficial effects of laminin-1, and extracellular matrix (highly enriched with laminin-1) preparations on pancreatic islet development and function [41], [42], [43], [44], [45], [46]. Laminin-1 is expressed in intra-islet capillaries [47] and a role for laminin receptor 1 was proposed in angiogenesis [48].
The confidence in the HMG20A association is enhanced by several lines of evidence from other studies. The HMG20A signal was previously identified in a GWA study of South Asian individuals [7] and was nominally associated with fasting glucose (P = 0.04, N = 46,186) and HbA1C (P = 0.002, N = 46,368) in non-diabetic individuals analysed by the MAGIC consortium. The association with fasting glucose became stronger when adjusting for BMI in an interaction model (P = 0.008).
We initially discovered a genome-wide significant signal near the HLA-DQA2 locus, which subsequently failed to replicate (rs3916765, P = 1×10⁻⁶). This variant is not in the same gene or in linkage disequilibrium with previously reported associations between HLA loci and type 2 diabetes [1], [49]. Concerned with the prospect of this association being due to auto-immune diabetes case admixture, we assessed the association of the strongest known type 1 diabetes signals in our lean meta-analysis. None of these showed any significant evidence of association – including the lead signals from the WTCCC type 1 diabetes study in the HLA region (rs3129941, P = 0.08), or near the INS (rs3842748, P = 0.64) or PTPN22 (rs2476601, P = 0.38) genes.
This study has provided the most robust evidence to date that lean type 2 diabetic cases are likely to carry a disproportionately high load of known type 2 diabetes risk alleles. More than 80% (29/36) of type 2 diabetes variants established in Europeans had stronger effects in lean compared to obese cases and the odds ratio for the 20% of lean cases carrying the most risk alleles was more than twice that of the 20% of obese cases carrying the most risk alleles. The corollary of these findings is that obese cases on average carry a disproportionately low load of confirmed type 2 diabetes risk variants, but their diabetes risk will likely be more heavily influenced by their genetic and environmental predisposition to gaining weight in adulthood.
Despite this enrichment of stronger effects in lean versus obese cases, analyses focused only on lean cases is not a more powerful study design compared to using all cases. For each of the known loci tested, the power gained by increased effect sizes is easily offset by the reduced power of having a case sample size of ∼25%. Nevertheless our data indicate that, given limited resources, recruitment strategies that target leaner type 2 diabetes cases will have more power than those that target a similar number of cases but without enrichment for lower BMI.
There are several limitations to our study. First, the use of an unstratified control group made testing the significance of differences between lean and obese cases difficult in the context of a genome wide meta-analysis. However, several lines of evidence support our conclusions that lean individuals are enriched for known type 2 diabetes genetic effects. This evidence includes: the very large differences between the upper and lower 95% confidence intervals of the weighted per allele effects in lean and obese, the consistency of the weighted per allele results when stratifying controls as well as cases, and the 80/20 proportion of SNPs showing stronger effects in lean compared to obese individuals respectively. Second, after stratifying by BMI, we did not use other criteria to reduce the clinical heterogeneity of type 2 diabetes. Of note, cases within the BMI strata differed appreciably in their age at diagnosis and the degree to which autoimmune or monogenic diabetes had been excluded. Instead, having stratified by BMI, we opted to use the largest available sample sizes. It is possible that a small number of monogenic or autoimmune forms of diabetes amongst our cases could have reduced our power to detect novel variants. Further studies may help refine how known and novel diabetes signals operate in more clinically homogenous settings. Finally, known type 2 diabetes signals are likely to account for only a small fraction of all risk variants that exist in the genome and any inferences we make are limited to the known signals.
In conclusion, we report associations with the LAMA1 and HMG20A (not previously associated at genome-wide significance in Europeans) gene regions with type 2 diabetes risk. We have demonstrated that lean diabetic cases are enriched for known type 2 diabetes risk alleles compared to obese cases. This enrichment is consistent with the observation that many of the variants with the strongest effects on diabetes are associated with reduced beta cell function [1]. At the opposite end of the spectrum, obese cases presumably need fewer diabetes risk variants to push them towards diabetes, as they are already under strain from the physiological impact of obesity and insulin resistance. These data suggest a disease model where type 2 diabetes cases lie across a continuous distribution with regards to genetic/environmental risk, and beta-cell dysfunction versus insulin resistance aetiologies.
Supporting Information
Zdroje
1. VoightBFScottLJSteinthorsdottirVMorrisAPDinaC 2010 Twelve type 2 diabetes susceptibility loci identified through large-scale association analysis. Nat Genet 42 579 589
2. DupuisJLangenbergCProkopenkoISaxenaRSoranzoN 2010 New genetic loci implicated in fasting glucose homeostasis and their impact on type 2 diabetes risk. Nat Genet 42 105 116
3. QiLCornelisMCKraftPStanyaKJLinda KaoWH 2010 Genetic variants at 2q24 are associated with susceptibility to type 2 diabetes. Hum Mol Genet 19 2706 2715
4. TsaiFJYangCFChenCCChuangLMLuCH 2010 A genome-wide association study identifies susceptibility variants for type 2 diabetes in Han Chinese. PLoS Genet 6 e1000847 doi:10.1371/journal.pgen.1000847
5. YamauchiTHaraKMaedaSYasudaKTakahashiA 2010 A genome-wide association study in the Japanese population identifies susceptibility loci for type 2 diabetes at UBE2E2 and C2CD4A-C2CD4B. Nat Genet 42 864 868
6. ShuXOLongJCaiQQiLXiangYB 2010 Identification of new genetic risk variants for type 2 diabetes. PLoS Genet 6 e1001127 doi:10.1371/journal.pgen.1001127
7. KoonerJSSaleheenDSimXSehmiJZhangW 2011 Genome-wide association study in individuals of South Asian ancestry identifies six new type 2 diabetes susceptibility loci. Nat Genet
8. LyssenkoVNagornyCLErdosMRWierupNJonssonA 2009 Common variant in MTNR1B associated with increased risk of type 2 diabetes and impaired early insulin secretion. Nat Genet 41 82 88
9. ProkopenkoILangenbergCFlorezJCSaxenaRSoranzoN 2009 Variants in MTNR1B influence fasting glucose levels. Nat Genet 41 77 81
10. FreathyRMMook-KanamoriDOSovioUProkopenkoITimpsonNJ 2010 Variants in ADCY5 and near CCNL1 are associated with fetal growth and birth weight. Nat Genet 42 430 435
11. PerryJRWeedonMNLangenbergCJacksonAULyssenkoV 2010 Genetic evidence that raised sex hormone binding globulin (SHBG) levels reduce the risk of type 2 diabetes. Hum Mol Genet 19 535 544
12. TuomiTCarlssonALiHIsomaaBMiettinenA 1999 Clinical and genetic characteristics of type 2 diabetes with and without GAD antibodies. Diabetes 48 150 157
13. PearsonERFlechtnerINjolstadPRMaleckiMTFlanaganSE 2006 Switching from insulin to oral sulfonylureas in patients with diabetes due to Kir6.2 mutations. N Engl J Med 355 467 477
14. TimpsonNJLindgrenCMWeedonMNRandallJOuwehandWH 2009 Adiposity-related heterogeneity in patterns of type 2 diabetes susceptibility observed in genome-wide association data. Diabetes 58 505 510
15. CauchiSNeadKTChoquetHHorberFPotocznaN 2008 The genetic susceptibility to type 2 diabetes may be modulated by obesity status: implications for association studies. BMC Med Genet 9 45
16. CauchiSChoquetHGutierrez-AguilarRCapelFGrauK 2008 Effects of TCF7L2 polymorphisms on obesity in European populations. Obesity (Silver Spring) 16 476 482
17. GueyLTKravicJMelanderOBurttNPLaramieJM 2011 Power in the phenotypic extremes: a simulation study of power in discovery and replication of rare variants. Genet Epidemiol
18. SpeliotesEKWillerCJBerndtSIMondaKLThorleifssonG 2010 Association analyses of 249,796 individuals reveal 18 new loci associated with body mass index. Nat Genet 42 937 948
19. ZhouKBellenguezCSpencerCCBennettAJColemanRL 2011 Common variants near ATM are associated with glycemic response to metformin in type 2 diabetes. Nat Genet 43 117 120
20. SoranzoNSannaSWheelerEGiegerCRadkeD 2010 Common variants at 10 genomic loci influence hemoglobin A(C) levels via glycemic and nonglycemic pathways. Diabetes 59 3229 3239
21. SaxenaRHivertMFLangenbergCTanakaTPankowJS 2010 Genetic variation in GIPR influences the glucose and insulin responses to an oral glucose challenge. Nat Genet 42 142 148
22. GoringHHCurranJEJohnsonMPDyerTDCharlesworthJ 2007 Discovery of expression QTLs using large-scale transcriptional profiling in human lymphocytes. Nat Genet 39 1208 1216
23. IdaghdourYCzikaWShiannaKVLeeSHVisscherPM 2010 Geographical genomics of human leukocyte gene expression variation in southern Morocco. Nat Genet 42 62 67
24. HeapGATrynkaGJansenRCBruinenbergMSwertzMA 2009 Complex nature of SNP genotype effects on gene expression in primary human leucocytes. BMC Med Genomics 2 1
25. DixonALLiangLMoffattMFChenWHeathS 2007 A genome-wide association study of global gene expression. Nat Genet 39 1202 1207
26. StrangerBENicaACForrestMSDimasABirdCP 2007 Population genomics of human gene expression. Nat Genet 39 1217 1224
27. KwanTBenovoyDDiasCGurdSProvencherC 2008 Genome-wide analysis of transcript isoform variation in humans. Nat Genet 40 225 231
28. HeinzenELGeDCroninKDMaiaJMShiannaKV 2008 Tissue-specific genetic control of splicing: implications for the study of complex traits. PLoS Biol 6 e1 doi:10.1371/journal.pbio.1000001
29. ZellerTWildPSzymczakSRotivalMSchillertA 2010 Genetics and beyond–the transcriptome of human monocytes and disease susceptibility. PLoS ONE 5 e10693 doi:10.1371/journal.pone.0010693
30. EmilssonVThorleifssonGZhangBLeonardsonASZinkF 2008 Genetics of gene expression and its effect on disease. Nature 452 423 428
31. GreenawaltDMDobrinRChudinEHatoumIJSuverC 2011 A survey of the genetics of stomach, liver, and adipose gene expression from a morbidly obese cohort. Genome Res 21 1008 1016
32. KompassKSWitteJS 2011 Co-regulatory expression quantitative trait loci mapping: method and application to endometrial cancer. BMC Med Genomics 4 6
33. WebsterJAGibbsJRClarkeJRayMZhangW 2009 Genetic control of human brain transcript expression in Alzheimer disease. Am J Hum Genet 84 445 458
34. SchadtEEMolonyCChudinEHaoKYangX 2008 Mapping the genetic architecture of gene expression in human liver. PLoS Biol 6 e107 doi:10.1371/journal.pbio.0060107
35. InnocentiFCooperGMStanawayIBGamazonERSmithJD 2011 Identification, replication, and functional fine-mapping of expression quantitative trait loci in primary human liver tissue. PLoS Genet 7 e1002078 doi:10.1371/journal.pgen.1002078
36. GrundbergEKwanTGeBLamKCKokaV 2009 Population genomics in a disease targeted primary cell model. Genome Res 19 1942 1952
37. DingJGudjonssonJELiangLStuartPELiY 2010 Gene expression in skin and lymphoblastoid cells: Refined statistical method reveals extensive overlap in cis-eQTL signals. Am J Hum Genet 87 779 789
38. DimasASDeutschSStrangerBEMontgomerySBBorelC 2009 Common regulatory variation impacts gene expression in a cell type-dependent manner. Science 325 1246 1250
39. HanBEskinE 2011 Random-effects model aimed at discovering associations in meta-analysis of genome-wide association studies. Am J Hum Genet 88 586 598
40. AntinozziPAGarcia-DiazAHuCRothmanJE 2006 Functional mapping of disease susceptibility loci using cell biology. Proc Natl Acad Sci U S A 103 3698 3703
41. JiangFXHarrisonLC 2005 Convergence of bone morphogenetic protein and laminin-1 signaling pathways promotes proliferation and colony formation by fetal mouse pancreatic cells. Exp Cell Res 308 114 122
42. VasirBAielloLPYoonKHQuickelRRBonner-WeirS 1998 Hypoxia induces vascular endothelial growth factor gene and protein expression in cultured rat islet cells. Diabetes 47 1894 1903
43. Bonner-WeirSTanejaMWeirGCTatarkiewiczKSongKH 2000 In vitro cultivation of human islets from expanded ductal tissue. Proc Natl Acad Sci U S A 97 7999 8004
44. GaoRUstinovJPulkkinenMALundinKKorsgrenO 2003 Characterization of endocrine progenitor cells and critical factors for their differentiation in human adult pancreatic cell culture. Diabetes 52 2007 2015
45. JiangFXGeorges-LabouesseEHarrisonLC 2001 Regulation of laminin 1-induced pancreatic beta-cell differentiation by alpha6 integrin and alpha-dystroglycan. Mol Med 7 107 114
46. JiangFXCramDSDeAizpuruaHJHarrisonLC 1999 Laminin-1 promotes differentiation of fetal mouse pancreatic beta-cells. Diabetes 48 722 730
47. GeutskensSBHomo-DelarcheFPleauJMDurantSDrexhageHA 2004 Extracellular matrix distribution and islet morphology in the early postnatal pancreas: anomalies in the non-obese diabetic mouse. Cell Tissue Res 318 579 589
48. HuCOliverJAGoldbergMRAl-AwqatiQ 2001 LRP: a new adhesion molecule for endothelial and smooth muscle cells. Am J Physiol Renal Physiol 281 F739 750
49. WilliamsRCMullerYLHansonRLKnowlerWCMasonCC 2011 HLA-DRB1 reduces the risk of type 2 diabetes mellitus by increased insulin secretion. Diabetologia 54 1684 1692
Štítky
Genetika Reprodukční medicínaČlánek vyšel v časopise
PLOS Genetics
2012 Číslo 5
- Kazuistika – Perspektivy využití precizované medicíny v rámci personalizované specifické terapie onkologických pacientů
- Nobelova cena za chemii pro genetické nůžky: Objev, který změní naši budoucnost?
- Technologie na bázi RNA v klinické praxi: od přebarvených petúnií k terapii vzácných a dosud jen obtížně léčitelných chorob u lidí
- „Nepředstavovali jsme si, že náš výzkum povede přímo ke vzniku nových léků, dokonce ještě za našeho života“
- Bezplatné služby pro diagnostiku ATTRv amyloidózy pro kardiology
Nejčtenější v tomto čísle
- Inactivation of a Novel FGF23 Regulator, FAM20C, Leads to Hypophosphatemic Rickets in Mice
- Genome-Wide Association of Pericardial Fat Identifies a Unique Locus for Ectopic Fat
- Slowing Replication in Preparation for Reduction
- An Essential Role for Katanin p80 and Microtubule Severing in Male Gamete Production
Zvyšte si kvalifikaci online z pohodlí domova
Mazová zátka a její řešení
nový kurzVšechny kurzy