
Common Genetic Determinants of Intraocular Pressure and Primary Open-Angle Glaucoma
Intraocular pressure (IOP) is a highly heritable risk factor for primary open-angle glaucoma and is the only target for current glaucoma therapy. The genetic factors which determine IOP are largely unknown. We performed a genome-wide association study for IOP in 11,972 participants from 4 independent population-based studies in The Netherlands. We replicated our findings in 7,482 participants from 4 additional cohorts from the UK, Australia, Canada, and the Wellcome Trust Case-Control Consortium 2/Blue Mountains Eye Study. IOP was significantly associated with rs11656696, located in GAS7 at 17p13.1 (p = 1.4×10⁻⁸), and with rs7555523, located in TMCO1 at 1q24.1 (p = 1.6×10⁻⁸). In a meta-analysis of 4 case-control studies (total N = 1,432 glaucoma cases), both variants also showed evidence for association with glaucoma (p = 2.4×10⁻² for rs11656696 and p = 9.1×10⁻⁴ for rs7555523). GAS7 and TMCO1 are highly expressed in the ciliary body and trabecular meshwork as well as in the lamina cribrosa, optic nerve, and retina. Both genes functionally interact with known glaucoma disease genes. These data suggest that we have identified two clinically relevant genes involved in IOP regulation.
Published in the journal:
. PLoS Genet 8(5): e32767. doi:10.1371/journal.pgen.1002611
Category:
Research Article
doi:
https://doi.org/10.1371/journal.pgen.1002611
Summary
Intraocular pressure (IOP) is a highly heritable risk factor for primary open-angle glaucoma and is the only target for current glaucoma therapy. The genetic factors which determine IOP are largely unknown. We performed a genome-wide association study for IOP in 11,972 participants from 4 independent population-based studies in The Netherlands. We replicated our findings in 7,482 participants from 4 additional cohorts from the UK, Australia, Canada, and the Wellcome Trust Case-Control Consortium 2/Blue Mountains Eye Study. IOP was significantly associated with rs11656696, located in GAS7 at 17p13.1 (p = 1.4×10⁻⁸), and with rs7555523, located in TMCO1 at 1q24.1 (p = 1.6×10⁻⁸). In a meta-analysis of 4 case-control studies (total N = 1,432 glaucoma cases), both variants also showed evidence for association with glaucoma (p = 2.4×10⁻² for rs11656696 and p = 9.1×10⁻⁴ for rs7555523). GAS7 and TMCO1 are highly expressed in the ciliary body and trabecular meshwork as well as in the lamina cribrosa, optic nerve, and retina. Both genes functionally interact with known glaucoma disease genes. These data suggest that we have identified two clinically relevant genes involved in IOP regulation.
Introduction
Primary open-angle glaucoma (hereafter referred to as glaucoma) is a progressive optic neuropathy responsible for 12.3% of global blindness [1]. The evidence for a genetic etiology of glaucoma is well-established [2]. However, genes consistently implicated so far (MYOC, OPTN, WDR36) [3]–[5] are relevant only in a limited number of families and explain a small proportion of the glaucoma cases in the general population [6]–[8]. So far, 3 genome-wide association studies (GWASs) for glaucoma have been published. A study from Iceland identified a common variant near CAV1 and CAV2 [9]. Both genes are expressed in the trabecular meshwork as well as in retinal ganglion cells. A Japanese study identified 3 putative loci, although none of these reached genome-wide significance [10]. A recent study in an Australian cohort of 590 patients with severe glaucomatous visual field loss identified susceptibility loci at TMCO1 and CDKN2B-AS1 [11]. The latter region had already at a genome-wide significant level been associated with vertical cup-to-disc ratio, which is an important clinical marker of glaucoma [12]. Finally, a study in an Afro-Caribbean population identified a genome-wide significant association between glaucoma and a locus on chromosome 2p by genotyping a previously identified linkage region [13].
Intraocular pressure (IOP) is the major risk factor of glaucoma and existing glaucoma therapies are exclusively aimed at lowering IOP. An elevated IOP (>21 mmHg) influences both the onset and the progression of glaucoma [14]. Genetic effects have been shown to account for a significant proportion of the variance in IOP, with heritability estimates ranging from 0.29 to 0.67 [15]–[19]. Five genome-wide linkage studies of IOP have been performed [20]–[24]. This resulted in 15 potential regions of interest, 2 of which were genome-wide significantly linked to IOP. The first was identified in an Australian glaucoma pedigree and was located on 10q22 [20]. The second was identified in individuals without glaucoma in West Africa and Mongolia and was located in the 5q22-23 region, which had already been implicated in glaucoma (WDR36 gene and GLC1M locus) [3], [23]–[25]. Taken together, these findings suggest that extensive heterogeneity underlies the genetics of IOP and that the same genetic factors may possibly affect both the variance in normal IOP and the risk and onset of glaucoma. Thus, unraveling the genetic background of IOP may shed light upon the pathophysiology of glaucoma. To date, no GWAS has been reported for IOP.
To identify genetic determinants of IOP, we performed a GWAS in 11,972 participants from 4 independent population-based studies in The Netherlands, and we replicated our findings in 7,482 participants from 4 additional independent cohorts of Caucasian ancestry. We investigated whether the IOP associated SNPs were also related to glaucoma in 1,432 glaucoma cases. Lastly, we examined expression levels of the identified candidate genes in human ocular tissues. We identified common variants in GAS7 and TMCO1 that altered the susceptibility to both IOP and glaucoma.
Results
Discovery studies
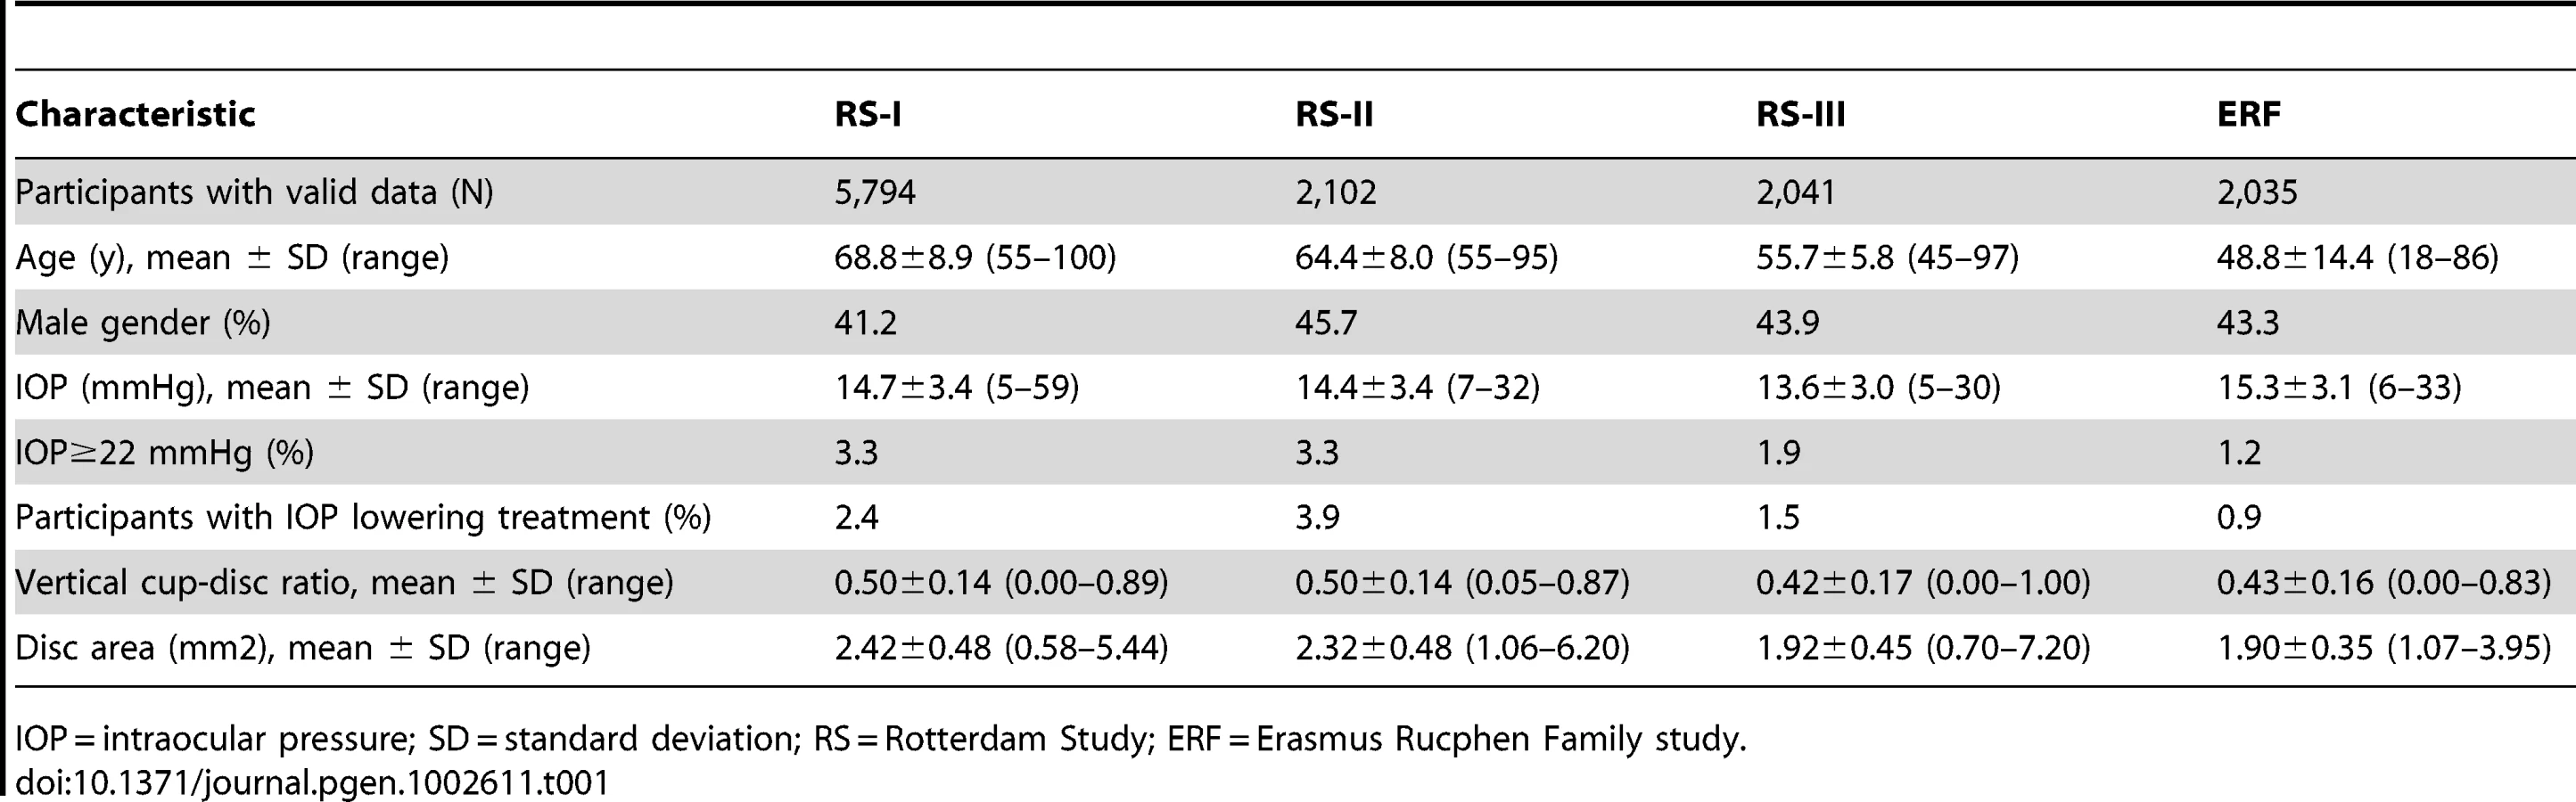
Genotypic and IOP data were available for 11,972 participants from the Rotterdam Study cohort I (RS-I), RS-II, RS-III, and the Erasmus Rucphen Family (ERF) Study (Table 1). Genomic inflation factors were 1.037 for RS-I, 1.006 for RS-II, 1.015 for RS-III, and 1.029 for ERF. QQ-plots for the observed versus expected p-values for the individuals cohorts as well as for the discovery meta-analysis have been provided in Figure S1. The genome-wide association analyses in the ERF study were performed with and without adjustment for the time of the IOP measurement. As this adjustment did not significantly affect the results, the unadjusted (other than for age and sex) data were taken forward to the meta-analysis.
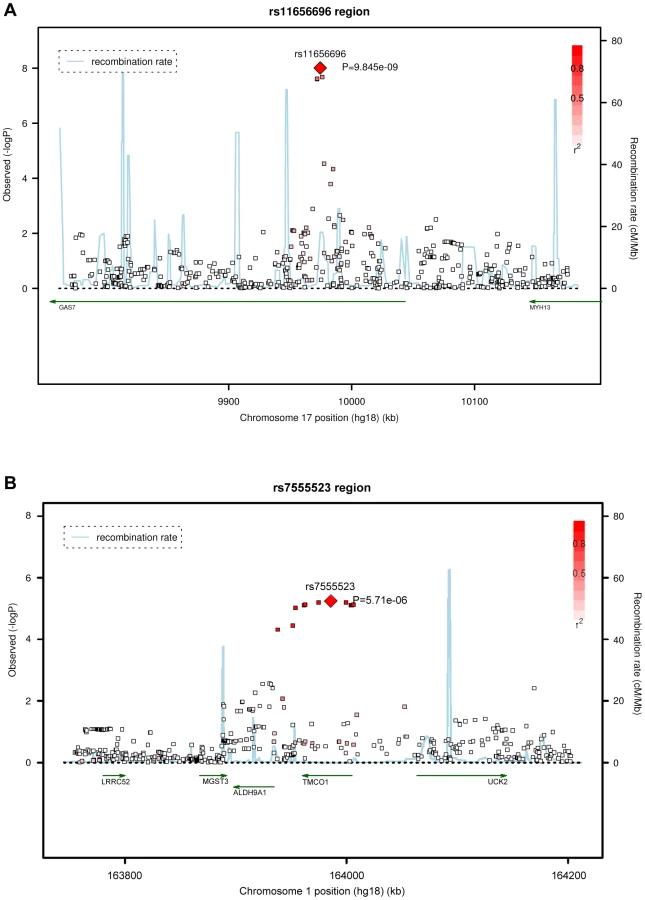
Four SNPs on chromosome 17p13.1 were significantly associated with IOP in the discovery meta-analysis (p<5×10⁻⁸; Figure 1, Table 2). These SNPs are located in the growth arrest-specific 7 (GAS7) gene (Figure 2) [26]. The SNP that showed strongest association with IOP was rs11656696. The effect of the rs11656696 alleles was consistent across all 4 discovery cohorts (Table S1). A further 6 chromosomal loci showed more moderate but nevertheless suggestive associations with IOP (p<1×10⁻⁵; Table 2, Figure S2) and were also taken to the replication phase. Of these, rs7555523 is located in the trans-membrane and coiled-coil domains 1 (TMCO1) gene on chromosome 1q24.1 (Figure 2) [26], which is located 7.6 MB from MYOC. A list of all the SNPs that were associated with IOP at a significance level of p<1×10⁻⁵ has been provided in Table S2.


We examined at least 416 KB of the chromosomal regions spanning the known disease genes MYOC, OPTN, and WDR36 in more detail in the discovery meta-analysis. None of the 1507 SNPs assessed in total showed significant association with IOP (Figure S3) [26]. We also evaluated 12 SNPs which had approached genome-wide significance in earlier association studies (Table S3) [9], [10], [13]. Of these, rs4236601 in the CAV1-CAV2 region, previously identified in Caucasians, was consistently associated with increased IOP in our discovery meta-analysis (beta = 0.19, 95%CI = 0.09–0.29, p = 1.1×10⁻⁴) [9]. The rs4656461 locus, identified in patients with severe glaucoma from Australia, overlapped with the rs7555523 locus that was identified with suggestive evidence in our study [11]. The 2 SNPs are at a disctance of 31774 base pairs from each other and are in linkage disequilibrium (R squared = 1). Rs4977756, the second locus that emerged from the study in Australia, was not associated with IOP in our discovery cohorts. Of the three regions identified in Japan, only rs7081455 on chromosome 10 showed nominal evidence for association with IOP (beta = 0.12, 95%CI = 0.08–0.16, p = 4.6×10⁻³). Our data did not replicate the association in the 2p16 locus which was previously identified in Afro-Caribbeans. Finally, we examined the two chromosomal regions that had previously been identified in genome-wide linkage studies of IOP [20], [24]. Both regions showed suggestive evidence of association with IOP in our discovery meta-analysis: Rs7894966, located in the bone morphogenetic protein receptor 1A (BMPR1A) gene on chromosome 10q23.2, is in the region previously identified in an Australian linkage study of IOP (16.2 MB from the peak LOD score) [20]; Rs216146, in the colony stimulating factor 1 receptor (CSF1R) gene on chromosome 5q32, is close to the region that previously showed genome-wide significant linkage to IOP in West Africans [24]. This SNP is located at a distance of 21.0 MB to the peak LOD score, 10.0 MB to the glaucoma locus GLC1M, and 39.0 MB to WDR36.
Replication studies
Replication of the IOP association was done in 4 additional cohorts from the TwinsUK study (N = 2,235), the Australian Twin study (N = 1,807), the Diabetes Control and Complications Trial/Epidemiology of Diabetes Interventions and Complications study (DCCT/EDIC; N = 1,304), and the Wellcome Trust Case-Control Consortium 2 / Blue Mountains Eye Study (WTCCC2/BMES; N = 2,136) (Text S1). The results of the replication analyses are presented in Table 3. Although in most studies the association did not reach nominal significance (p<0.05), most likely explained by the low statistical power of these relatively small studies, the directionality of the effects was consistent across the 4 replication cohorts for most SNPs. The exceptions were rs7894966 and rs216146 for which the effects were in opposite direction compared to the discovery cohorts. When the gene discovery and replication cohorts were combined, two intronic SNPs reached genome-wide significance. Each copy of the rs11656696 minor allele (A), located in GAS7, was associated with a 0.19 mmHg IOP reduction (95% confidence interval [CI] = 0.12–0.26 mmHg; p = 1.4×10⁻⁸), and each copy of the rs7555523 minor allele (C), located in TMCO1, with a 0.28 mmHg IOP increase (95%CI = 0.18–0.37 mmHg; p = 1.6×10⁻⁸).

Glaucoma case-control studies
We investigated the associations of the GAS7 rs11656696 minor allele (A) and the TMCO1 rs7555523 minor allele (C) with glaucoma in 4 case-control studies from the Netherlands and Germany (Text S1). The results are presented in Figure 3. For rs11656696 A we found a decreased glaucoma risk in the Amsterdam Glaucoma Study (AGS; OR = 0.71, 95%CI = 0.51–0.99) and the Erlangen and Tübingen study (OR = 0.82, 95%CI = 0.69–0.97), but not in RS-I and the Genetic Research in Isolated Populations (GRIP) program. When combining the 4 case-control studies, rs11656696 A showed a decreased glaucoma risk (OR = 0.88, 95%CI = 0.78–0.98, p = 2.4×10⁻²). For rs7555523 C, we found an increased glaucoma risk in all 4 case-control studies. Combined, these studies showed an increased glaucoma risk with an OR of 1.31 (95%CI = 1.12–1.53, p = 9.1×10⁻⁴).

Expression studies
In a first study of expression levels in human ocular tissues, we observed moderate to high expression of GAS7, and high expression of TMCO1 in the ciliary body (CB), the secretory neuroepithelium that produces the aqueous humor (Table 4). Both genes were moderately to highly expressed in the choroid, the retinal pigment epithelium and photoreceptors. In a second, independent study, mRNA expression profiles in human eyes of GAS7 and TMCO1 displayed an ubiquitous expression of both gene products, with the highest expression levels of GAS7 in the trabecular meshwork, the lamina cribrosa, and the optic nerve, whereas TMCO1 expression was most prominent in the trabecular meshwork and the retina (Figure 4).


Discussion
We identified rs11656696 in GAS7 and rs7555523 in TMCO1 as common variants associated with IOP. In a joint analysis of the discovery and replication cohorts each copy of the rs11656696 minor allele (A; allele frequency 0.43) was associated with a 0.19 mmHg decrease in IOP (95%CI = 0.12–0.26 mmHg), whereas each copy of the rs7555523 minor allele (C; allele frequency 0.12) was associated with a 0.28 mmHg increase in IOP (95%CI = 0.18–0.37 mmHg). Both variants showed marginal evidence for association with glaucoma when combining data from 4 case-control studies, although for rs11656696 significance was only obtained in 2 studies.
GAS7 is located in a chromosomal region previously identified by a linkage study of glaucoma [27]. We observed high expression levels of GAS7 in the optic nerve, and, in particular, the lamina cribrosa. The lamina cribrosa is the connective tissue network through which the nerve fibers traverse to form the optic nerve, and is assumed to be the main site for glaucomatous damage to the optic nerve. We also observed moderate to high expression of GAS7 in the ciliary body (CB), the secretory neuroepithelium that produces the aqueous humor, and high expression of GAS7 in the trabecular meshwork (TM), which is the main tissue involved in aqueous humor outflow [28]. Together, the CB and TM largely control IOP. Previously, Liton and colleagues already reported significant downregulation of GAS7 expression in TM of glaucomatous eyes [28]. In absence of the (in vivo) typical mechanical forces on the TM, a similar effect was also observed in cultured TM cells [28]. High GAS7 expression has previously been shown in amacrine cells in the mouse retina, while lower expression was found in retinal cell types which are usually not affected by glaucoma [29]. Protein pathway analyses and evidence from previous literature allude to functional effects of GAS7 in both the TM and retina. GAS7 has been implicated in cell remodelling, possibly facilitated through its capacity to associate with actin and mediate the reorganization of microfilaments [30], [31]. In neuronal cells, GAS7 expression is critical for neurite formation [30], [32]. MYOC, the major glaucoma gene previously associated with elevated IOP cases, also affects the actin cytoskeletal structure and neurite outgrowth [33]. Whereas MYOC has an inhibitory effect on neurite outgrowth, GAS7 is involved in the formation of neurites. Interestingly, experimental ischemic retinal damage in rats, resembling retinal damage due to glaucoma, leads to extensive remodelling of inner retinal neurons [34]. GAS7 may also contribute to remodelling of the TM, as is the case for the myocilin protein which has been shown to alter the actin structure and modulate TM cell morphogenesis [35]. GAS7 interacts with MYOC, as well as with other genes implicated in glaucoma, such as OPTN, WDR36, CAV1, NOS2, FOXC1, APOE, APP and CLU (Figure 5; www.ingenuity.com). The latter three genes are primarily known for their association with Alzheimer's Disease, a neurodegenerative disease previously linked to glaucoma [36]. GAS7 interacts with both MYOC and CAV1 through β-catenin (CTNNB1) and RhoA (RHOA). B-catenin anchors the actin cytoskeleton and is part of the Wnt signalling pathway, which has previously been implicated in trabecular outflow regulation [37], [38]. RhoA signalling regulates the intracellular levels of phosphorylated myosin light chain, which directly influence trabecular meshwork cellular contraction and thus aqueous humor outflow [39]. Finally, GAS7 is regulated by transforming growth factor (TGF) beta, which has previously been implicated in trabecular outflow as well as in the development of the optic disc (the primary site of neuronal damage by glaucoma) [40]–[42]. The frequency of the GAS7 rs11656696 A-allele is 0.44 in the HapMap CEU population of European ancestry whereas it is 0.12 in the HapMap Yorubian population of African ancestry. The lower frequency of the A-allele in the African population is consistent with the higher prevalence of glaucoma with elevated IOP in this population and warrants further research into the association of rs11656696 with IOP and glaucoma in African populations.

The second variant that we found to be associated with IOP and glaucoma was rs7555523 in TMCO1, a highly evolutionary conserved gene of largely unknown function [43], [44]. TMCO1 has recently been associated with severe glaucomatous visual field loss, indicating that this locus may influence both the normal variance in IOP and the risk of developing severe glaucoma [11]. These findings support the hypothesis that studies of IOP can assist in identifying susceptibility genes for glaucoma. Rs7555523 is located in a region which previously showed suggestive evidence for linkage with blood pressure [45]. IOP and blood pressure have already been shown to correlate [46]. TMCO1 is highly expressed in the human TM and CB, which together regulate IOP, and in the retina [28]. TMCO1 interacts with CAV1 via VHL (Figure 5). A homozygous frameshift mutation in TMCO1 has been associated with a genetic syndrome involving multiple organ systems, including renal agenesis and hydronephrosis [43]. Extensive ophthalmic examination was not reported, however a high incidence of strabismus was noticed.
No previous GWASs of IOP have been conducted to date. When comparing our findings to those of association studies of glaucoma, we found an overlap with 3 regions. First, we replicated the association with the TMCO1 region, as has been described in the previous paragraph. Second, rs4236601 in the CAV1-CAV2 region, previously identified in Caucasians, was consistently associated with increased IOP in our discovery meta-analysis [9]. Our findings in this region did not reach genome-wide significance. However, multiple testing adjustment by using a Bonferroni correction for the 12 SNPs evaluated (Table S3) yields a criterion for significance of p<4×10⁻³. Thus, our findings strongly support an association between the CAV1-CAV2 region and IOP, despite the fact that the original report that identified CAV1-CAV2 did not find evidence for a stronger relation to high pressure glaucoma. Third, a locus on chromosome 10p, which had previously been identified in Japan, also passed this Bonferroni threshold [10]. Similar to Nakano and coworkers, we could not assign a specific glaucoma disease gene to this region. The replication of this locus in our study is remarkable as most glaucoma patients in Japan present with normal tension glaucoma (i.e., glaucoma with IOP≤21 mmHg).
Our study design had three potential limitations. First, we did not measure central corneal thickness (CCT) in the majority of the participants of the discovery cohorts. CCT is an important determinant of IOP measurements and may be an IOP-independent risk factor for glaucoma [47], [48]. The genes involved in CCT may also associate with IOP and glaucoma. CCT has previously been reported to account for 1–6% of the variance in IOP measured with Goldmann applanation tonometry [49]–[52]. Heritability estimates of CCT range from 0.68 to 0.95 [53]–[55], implying that this trait is even more heritable than IOP. Because we did not include CCT as a covariate in our discovery analyses, the identified SNPs may determine CCT rather than IOP. To test this hypothesis, we assessed whether the identified SNPs were associated with CCT in a randomly selected subpopulation of 784 participants from RS-I for whom CCT data were available. None of the 7 SNPs identified in the discovery meta-analysis was associated with CCT (p>0.24). The results for rs11656696 (p = 0.28) and for rs7555523 (p = 0.31) suggest that the associations of these SNPs with IOP were not explained by CCT. Furthermore, in a recent GWAS conducted in the Australian twins and TwinsUK cohorts, these SNPs were not associated with CCT [56]. We also assessed the associations of rs11656696 and rs75555623 with IOP in the TwinsUK cohort after including CCT as a covariate in the multivariate model. The association changed from −0.316 (95%CI = −0.536–−0.096) to −0.400 (95%CI = −0.620–−0.180) for rs11656696 and from 0.242 (95%CI = −0.048–0.532) to 0.220 (95%CI = −0.080–0.520) for rs7555523 after correction for CCT, suggesting that the controlling for CCT only produces relatively minor changes with respect to effect size and significance of association.
Second, in the gene discovery analyses, the initial IOP levels were not known for the participants who received IOP lowering medication or who had a history of IOP lowering surgery. We imputed these IOPs, because (particularly in the elderly population of RS-I) participants with extreme IOPs, which are likely to be genetically determined, are otherwise excluded. Similar approaches have been applied to research of blood pressure, where an analogous problem occurs: those with the higher blood pressures are otherwise excluded [57], [58]. Although the imputations for IOP lowering medication are based on a large meta-analysis [59], the justification for the imputations for IOP lowering surgery is not based on empirical evidence. Exclusion of any participants who received IOP lowering treatment or who had received this treatment in the past (either by medication or surgically), did not substantially change the betas for rs11656696 and rs7555523 (see Text S1). However, for rs11656696, it did result in a loss of statistical power, as the participants on treatment had a significantly (p = 8.1×10⁻⁶) lower frequency of the protective A-allele (odds ratio = 0.58, 95%CI = 0.45–0.74).
Third, some replication cohorts differed from the discovery cohorts with respect to their age, sex or disease status. The participants of the Australian Twin study and DCCT/EDIC were evidently younger than the participants of the other cohorts were. Aging has previously been associated with an increase in the accumulation of extracellular material in the trabecular meshwork, as well as a decrease in trabecular meshwork cells [60]. A different genetic mechanism underlying aqueous humor dynamics in different age categories may therefore explain the lack of association of IOP with rs11656696 and rs7555523 in these younger cohorts. In the TwinsUK cohort, 97.5% of the participants were women. Sex was not significantly related to IOP in the discovery cohorts. Moreover, the results from the TwinsUK strongly replicate the association of IOP with rs11656696, and are also supportive for the association with rs7555523. We therefore believe that the differences in sex have not substantially influenced our results. Finally, DCCT/EDIC comprised only participants with type I diabetes mellitus. DCCT/EDIC was the only cohort that showed an inconsistent effect for rs11656696. The reduced association in the joint analysis when compared to the discovery analysis (p-value increased from 9.8×10⁻⁹ to 1.4×10⁻⁸) was mainly driven by DCCT/EDIC. When DCCT/EDIC was not included, the association in the joint analysis became stronger than it was in the discovery (p-value decreased from 9.8×10⁻⁹ to p = 1.1×10⁻⁹). Although the association of type 1 diabetes with IOP is controversial, any changes in IOP may have different origins, which may explain the inconsistent replication results in this cohort.
In conclusion, this genome-wide association study in 8 independent Caucasian cohorts identified rs11656696 in GAS7 at chromosome 17p13.1 and rs7555523 in TMCO1 at chromosome 1q24.1 as common genetic variants associated with IOP. The variants were also marginally associated with glaucoma. GAS7 and TMCO1 are expressed in ocular cells and tissues implicated in glaucoma. Biochemical protein interactions with known glaucoma disease genes, as well as functional data support the involvement of these genes in aqueous humor dynamics and glaucomatous neuropathy.
Materials and Methods
Ethics statement
All participating studies adhered to the tenets of the Declaration of Helsinki and were approved by their Medical Ethics Committees. Written, informed consent was obtained from all participants.
Outline of the study
For the gene discovery phase, we combined data of 11,972 participants derived from 4 large, independent population-based cohort studies in The Netherlands: the Rotterdam Study cohort I (RS-I), RS-II, RS-III, and the Erasmus Rucphen Family (ERF) Study. Replication of the findings was sought in 4 independent populations: the TwinsUK Adult Twin study, the Australian Twin Study, the Diabetes Control and Complications Trial / Epidemiology of Diabetes Interventions and Complications study (DCCT/EDIC) [61], and the Wellcome Trust Case-Control Consortium 2 / Blue Mountains Eye Study (WTCCC2/BMES). Clinical relevance of the identified loci was assessed by evaluating associations between the variants and glaucoma. To this end, we performed case-control analyses using 4 different glaucoma cohorts from The Netherlands and Germany. Finally, we examined the expression levels of the identified candidate genes in ocular tissues.
Discovery studies
Participants
The RS-I is a prospective population-based cohort study of 7,983 residents 55 years of age and older living in Ommoord, a suburb of Rotterdam, The Netherlands [62]. Baseline ophthalmic examinations took place from 1991 to 1993, follow-up examinations from 1997 to 1999 and from 2002 to 2006. The RS-II is an independent cohort of another 3,011 new respondents in the same age range as RS-I [62]. Baseline examinations were performed from 2000 to 2002 and follow-up examinations from 2004 to 2005. The RS-III was based on the same protocol as RS-I and RS-II, and included 3,932 residents with a different age range, being 45 years and older. Baseline examinations took place from 2006 to 2009. Finally, ERF is a family-based cohort study in a genetically isolated population in the southwest of The Netherlands with over 3,000 participants 18 years of age and older [18], [63]. Examinations took place from 2002 to 2005.
IOP measurement
In all discovery cohorts, the IOP was measured with Goldmann applanation tonometry (Haag-Streit, Bern, Switzerland), which is the international standard for IOP assessment in ophthalmic research and clinical practice. A drop of fluorescein sodium was instilled in each eye. The tonometer was set at 10 mm Hg, and the prism was carefully applied to the corneal surface of the right eye. Without looking at the scale, the examiner rotated the dial until the inner margins of the two semicircles touched each other. The examiner then moved the slit lamp away from the eye and read the IOP. The tonometer was set at 10 mm Hg, and the measurement was repeated. If the two measurements differed, a third measurement was performed, and the median value was recorded. The procedure was repeated for the left eye [18], [64]. The IOP measurement was part of a comprehensive ophthalmic examination, including the assessment of visual acuity, refraction, keratometry, fundus photography, and imaging of the optic disc.
Genotyping
In the RS-I, RS-II and RS-III cohorts, DNA was genotyped with the Illumina Infinium II HumanHap550 chip v3.0 array. In the ERF study, DNA was genotyped on 4 different platforms (Illumina 6k, Illumina 318K, Illumina 370K and Affymetrix 250K), which were then merged. Genotype data were imputed by using HapMap CEU build 35 as the reference population, resulting in over 2.5 million SNPs. For details please see Text S1.
Replication studies
SNPs showing strongest association in the discovery phase were carried forward and assessed for association with IOP in 2,235 participants from the TwinsUK Study, 1,807 from the Australian Twin Study, 1,304 from the DCCT/EDIC Study, and 2,136 from the WTCCC2/BMES Study. The TwinsUK , Australian Twin and WTCCC2/BMES were also population-based studies, and participants were ascertained regardless of their phenotypes or clinical status. The DCCT/EDIC study comprised only patients with type 1 diabetes included in a preventive trial. Descriptions of the study populations, clinical examinations, and genotyping methods of the replication cohorts are provided in Text S1 and Table S4.
Glaucoma case-control studies
SNPs showing the strongest associations in the discovery and replication phase were also evaluated in 4 series of glaucoma patients. The first series included 188 participants from RS-I in whom the technician measuring IOP was completely ignorant of the presence of glaucoma. Controls were healthy participants of RS-I. The second case-control study was an independent series of 104 glaucoma cases from an isolated population (Genetic Research in an Isolated Population [GRIP] study), with the ERF population as a control group. The third study included 152 cases and 141 controls recruited from all over The Netherlands as part of the Amsterdam Glaucoma Study (AGS). The last case-control study comprised a series of 988 glaucoma cases and 378 controls ascertained in Erlangen and Tübingen, Germany. Details of the clinical evaluation and glaucoma diagnosis in these studies are described in Text S1 and Table S5.
Statistical analyses
Discovery analysis
Analyses were performed for the mean IOP of both eyes or for one eye if data on the other eye were missing. In the gene discovery analyses, IOP levels were imputed for those who received IOP lowering medication or had a history of IOP lowering surgery, because the initial IOP levels were unknown. Based on a reported average of a 30% IOP reduction caused by IOP lowering medication, estimated in a meta-analysis, IOP values of those receiving this medication were divided by 0.7 to estimate pre-treatment IOP [59]. In participants with a history of IOP lowering surgery, pre-treatment IOP was assumed to be at least 30 mmHg. The data were also analyzed after exclusion of any participants who received IOP lowering treatment or had a history of IOP lowering surgery. The results of these analyses have been presented in Text S1.
Associations between IOP and genome-wide loci were assessed with linear regression models under the assumption of an additive model for the effect of the risk allele. Analyses were adjusted for age and sex. In the ERF study, the analyses were also performed with additional adjustment for the time of the IOP measurement. Genomic inflation factors (λ) were calculated to evaluate any population stratification. Analyses were performed with the ProbABEL package from the ABEL set of programs (http://mga.bionet.nsc.ru/yurii/ABEL/) [65]. To adjust for familial relationships of participants in ERF, the score test for relatives was applied by using the genomic kinship matrix as implemented in the GenABEL package of R statistical software (http://cran.r-project.org) [65]–[67].
The results from the 4 cohorts were subjected to an inverse variance meta-analysis. Genomic control was used to correct the standard errors of the effect estimates before pooling [68]. The genome-wide threshold for statistical significance was set at a p-value of 5×10⁻⁸ to adjust for multiple testing [69]. Meta-analyses were performed with METAL software (http://www.sph.umich.edu/csg/abecasis/metal/index.html).
Results of the discovery meta-analysis were also used to explore regions in the immediate vicinity of the known glaucoma genes (MYOC, OPTN, WDR36) as well as the regions which had approached genome-wide significance in previous GWASs of glaucoma and previous linkage studies of IOP [9], [10], [13], [20], [24].
Replication analysis
Loci which were suggestive (p<1×10⁻⁵) of association with IOP in the discovery meta-analysis were taken forward to the replication phase. If two or more significantly associated SNPs within a locus were in linkage disequilibrium (LD), only the SNP with the best probability of association (lowest p-value) was selected. Linear regression analyses adjusted for age and sex were performed under the assumption of an additive effect of the risk allele. The results from the discovery and replication cohorts were combined by using an inverse variance meta-analysis (METAL software).
Glaucoma case-control analysis
SNPs that were genome-wide significantly associated with IOP in the meta-analysis of the discovery and replication cohorts were assessed in the 4 glaucoma case-control studies. Logistic regression analyses adjusted for age and sex were performed (SPSS version 15.0 for Windows; SPSS, Chicago, IL) and a pooled effect estimate was calculated (Rmeta software [http://cran.r-project.org/web/packages/rmeta/index.html]). Considering the difference in mean age between the cases and controls of the GRIP and ERF studies, the analyses were repeated after excluding any control subjects younger than 51 years of age from the ERF study. As this did not substantially change the odds ratios (from 0.99 [95%CI = 0.70–1.41] to 0.99 [95%CI = 0.70–1.42] for rs11656696, and from 1.78 [95%CI = 1.21–2.62] to 1.72 [95%CI = 1.15–2.57] for rs7555523), we only report the results of the initial analyses including all participants of the ERF study.
Protein pathway analyses
Protein pathway analysis was conducted in Ingenuity Knowledge Base (Ingenuity Systems, www.ingenuity.com). We looked for functional links between GAS7 (MLL in rodents) and TMCO1 and molecules known to play a role in glaucoma.
Expression studies
Two independent expression studies were performed. In the first, retinal expression data were obtained essentially as described by Booij and colleagues [70]. Human healthy donor eyes (n = 4) were collected in collaboration with the Dutch Cornea Bank and snap frozen. History of the donor eyes revealed no glaucoma or other eye diseases. Cryosections (20 µm) of the CB were cut and mounted on PEN membrane slides (Carl Zeiss MicroImaging). With the use of laser dissection microscopy, the CB epithelium was cut out. RNA isolation (RNeasy Micro Kit, Qiagen) and amplification (Amino Allyl MessageAmp II aRNA Amplification, Ambion Applied Biosystems) were conducted according to the manufacturers' protocols. After labelling of experimental aRNA with Cy5 and reference aRNA (composed of RPE and choroid) with Cy3, we performed hybridization on catalogue human 4×44k microarrays (Agilent Technologies). Mean expression intensity data were normalized with R software (R Development Core Team, 2009). The mean expression data were further subdivided based on percentiles in Windows Excel. We used the 90th, 50th and 10th percentile of the mean expression intensity to categorize our data into groups with high (>90th), moderate (50th–90th), low (10th–50th) and very low (<10th) expression.
In the second expression study, ocular tissues were obtained for quantitative real-time PCR from four donor eyes (age: 81.2±4.5 years, 2 female, 2 male) without any known ocular disease. These eyes were obtained at autopsy and were processed within 8 hours after death. Informed consent to tissue donation was obtained from the donors or their relatives, and the protocol of the study was approved by the local Ethics Committee and adhered to the tenets of the Declaration of Helsinki for experiments involving human tissue. Total RNA was extracted from various ocular tissues by using the RNeasy kit (Quiagen, Hilden, Germany) including an on-column DNase I digestion step. First strand cDNA synthesis was performed by using 0.1 µg of total RNA, 200 U Superscript II reverse transcriptase (Invitrogen; Karlsruhe, Germany), and 500 ng oligo dT primers (Roche Diagnostics; Mannheim, Germany) in a 20 µl reaction volume. Quantitative real-time PCR was performed by means of the MyIQ thermal cycler and software (Biorad, Munich, Germany). PCR reactions (25 µl) contained 2 µl of first-strand cDNA, 0.4 µM each of upstream - and downstream-primer, 3.0 mM MgCl2, and 1× SsoFast EvaGreen Supermix (Biorad). All samples were analyzed in duplicates by means of a program with an initial denaturation step of 95°C for 3 minutes and 40 cycles of 95°C for 5 seconds, and 64°C (GAS7 and TMCO1) or 62°C (GAPDH) for 15 seconds. Gene-specific primers (Eurofins, Anzing, Germany) were designed to anneal with sequences located in different exons by means of Primer 3 software (http://fokker.wi.mit.edu/primer3/input.htm) and are summarized in Table S6. For quantification, serially diluted standard curves were run in parallel, and amplification specificity was checked using melt curve analysis. For normalization of gene expression levels, mRNA ratios relative to the house-keeping gene GAPDH were calculated.
Supporting Information
Zdroje
1. ResnikoffSPascoliniDEtya'aleDKocurIPararajasegaramR 2004 Global data on visual impairment in the year 2002. Bull World Health Organ 844 851
2. van KoolwijkLMEBunceCViswanathanAC 2009 Genetic Epidemiology. ShaarawyTMSherwoodMBHitchingsRACrowstonJG Glaucoma Saunders Elsevier 277 289
3. MonemiSSpaethGDaSilvaAPopinchalkSIlitchevE 2005 Identification of a novel adult-onset primary open-angle glaucoma (POAG) gene on 5q22.1. Hum Mol Genet 725 733
4. RezaieTChildAHitchingsRBriceGMillerL 2002 Adult-onset primary open-angle glaucoma caused by mutations in optineurin. Science 1077 1079
5. StoneEMFingertJHAlwardWLNguyenTDPolanskyJR 1997 Identification of a gene that causes primary open angle glaucoma. Science 668 670
6. FingertJHHeonELiebmannJMYamamotoTCraigJE 1999 Analysis of myocilin mutations in 1703 glaucoma patients from five different populations. Hum Mol Genet 899 905
7. AlwardWLKwonYHKawaseKCraigJEHayrehSS 2003 Evaluation of optineurin sequence variations in 1,048 patients with open-angle glaucoma. Am J Ophthalmol 904 910
8. HauserMAAllinghamRRLinkroumKWangJLaRocque-AbramsonK 2006 Distribution of WDR36 DNA sequence variants in patients with primary open-angle glaucoma. Invest Ophthalmol Vis Sci 2542 2546
9. ThorleifssonGWaltersGBHewittAWMassonGHelgasonA 2010 Common variants near CAV1 and CAV2 are associated with primary open-angle glaucoma. Nat Genet 906 909
10. NakanoMIkedaYTaniguchiTYagiTFuwaM 2009 Three susceptible loci associated with primary open-angle glaucoma identified by genome-wide association study in a Japanese population. Proc Natl Acad Sci U S A 12838 12842
11. BurdonKPMacgregorSHewittAWSharmaSChidlowG 2011 Genome-wide association study identifies susceptibility loci for open angle glaucoma at TMCO1 and CDKN2B-AS1. Nat Genet 574 578
12. RamdasWDvan KoolwijkLMIkramMKJansoniusNMde JongPT 1998 A genome-wide association study of optic disc parameters. PLoS Genet e1000978 doi:10.1371/journal.pgen.1000978
13. JiaoXYangZYangXChenYTongZ 2009 Common variants on chromosome 2 and risk of primary open-angle glaucoma in the Afro-Caribbean population of Barbados. Proc Natl Acad Sci U S A 17105 17110
14. ColemanALMigliorS 2008 Risk factors for glaucoma onset and progression. Surv Ophthalmol S3 10
15. CarbonaroFAndrewTMackeyDASpectorTDHammondCJ 2008 Heritability of intraocular pressure: a classical twin study. Br J Ophthalmol 1125 1128
16. ChangTCCongdonNGWojciechowskiRMunozBGilbertD 2005 Determinants and heritability of intraocular pressure and cup-to-disc ratio in a defined older population. Ophthalmology 1186 1191
17. KleinBEKleinRLeeKE 2004 Heritability of risk factors for primary open-angle glaucoma: the Beaver Dam Eye Study. Invest Ophthalmol Vis Sci 59 62
18. van KoolwijkLMDesprietDDvan DuijnCMPardo CortesLMVingerlingJR 2007 Genetic contributions to glaucoma: heritability of intraocular pressure, retinal nerve fiber layer thickness, and optic disc morphology. Invest Ophthalmol Vis Sci 3669 3676
19. ZhengYXiangFHuangWHuangGYinQ 2009 Distribution and heritability of intraocular pressure in chinese children: the Guangzhou twin eye study. Invest Ophthalmol Vis Sci 2040 2043
20. CharlesworthJCDyerTDStankovichJMBlangeroJMackeyDA 2005 Linkage to 10q22 for maximum intraocular pressure and 1p32 for maximum cup-to-disc ratio in an extended primary open-angle glaucoma pedigree. Invest Ophthalmol Vis Sci 3723 3729
21. DuggalPKleinAPLeeKEIyengarSKKleinR 2005 A genetic contribution to intraocular pressure: the beaver dam eye study. Invest Ophthalmol Vis Sci 555 560
22. DuggalPKleinAPLeeKEKleinRKleinBE 2007 Identification of novel genetic loci for intraocular pressure: a genomewide scan of the Beaver Dam Eye Study. Arch Ophthalmol 74 79
23. LeeMKWooSJKimJIChoSIKimH 2010 Replication of a glaucoma candidate gene on 5q22.1 for intraocular pressure in mongolian populations: the GENDISCAN Project. Invest Ophthalmol Vis Sci 1335 1340
24. RotimiCNChenGAdeyemoAAJonesLSAgyenim-BoatengK 2006 Genomewide scan and fine mapping of quantitative trait loci for intraocular pressure on 5q and 14q in West Africans. Invest Ophthalmol Vis Sci 3262 3267
25. PangCPFanBJCanlasOWangDYDuboisS 2006 A genome-wide scan maps a novel juvenile-onset primary open angle glaucoma locus to chromosome 5q. Mol Vis 85 92
26. JohnsonADHandsakerREPulitSLNizzariMMO'DonnellCJ 2008 SNAP: a web-based tool for identification and annotation of proxy SNPs using HapMap. Bioinformatics 2938 2939
27. WiggsJLAllinghamRRHossainAKernJAugusteJ 2000 Genome-wide scan for adult onset primary open angle glaucoma. Hum Mol Genet 1109 1117
28. LitonPBLunaCChallaPEpsteinDLGonzalezP 2006 Genome-wide expression profile of human trabecular meshwork cultured cells, nonglaucomatous and primary open angle glaucoma tissue. Mol Vis 774 790
29. CherryTJTrimarchiJMStadlerMBCepkoCL 2009 Development and diversification of retinal amacrine interneurons at single cell resolution. Proc Natl Acad Sci U S A 9495 9500
30. JuYTChangACSheBRTsaurMLHwangHM 1998 gas7: A gene expressed preferentially in growth-arrested fibroblasts and terminally differentiated Purkinje neurons affects neurite formation. Proc Natl Acad Sci U S A 11423 11428
31. SheBRLiouGGLin-ChaoS 2002 Association of the growth-arrest-specific protein Gas7 with F-actin induces reorganization of microfilaments and promotes membrane outgrowth. Exp Cell Res 34 44
32. ChaoCCChangPYLuHH 2005 Human Gas7 isoforms homologous to mouse transcripts differentially induce neurite outgrowth. J Neurosci Res 153 162
33. KogaTShenXParkJSQiuYParkBC 2010 Differential effects of myocilin and optineurin, two glaucoma genes, on neurite outgrowth. Am J Pathol 343 352
34. DijkFBergenAAKamphuisW 2007 GAP-43 expression is upregulated in retinal ganglion cells after ischemia/reperfusion-induced damage. Exp Eye Res 858 867
35. Wentz-HunterKKubotaRShenXYueBY 2004 Extracellular myocilin affects activity of human trabecular meshwork cells. J Cell Physiol 45 52
36. BayerAUFerrariFErbC 2002 High occurrence rate of glaucoma among patients with Alzheimer's disease. Eur Neurol 165 168
37. WangWHMcNattLGPangIHMillarJCHellbergPE 2008 Increased expression of the WNT antagonist sFRP-1 in glaucoma elevates intraocular pressure. J Clin Invest 1056 1064
38. ShyamRShenXYueBYWentz-HunterKK 2010 Wnt gene expression in human trabecular meshwork cells. Mol Vis 122 129
39. RussPKKuppermanAIPresleySHHaseltonFRChangMS 2010 Inhibition of RhoA signaling with increased Bves in trabecular meshwork cells. Invest Ophthalmol Vis Sci 223 230
40. ChangYUengSWLin-ChaoSChaoCC 2008 Involvement of Gas7 along the ERK1/2 MAP kinase and SOX9 pathway in chondrogenesis of human marrow-derived mesenchymal stem cells. Osteoarthritis Cartilage 1403 1412
41. RamdasWDvan KoolwijkLMIkramMKJansoniusNMde JongPT 2010 A genome-wide association study of optic disc parameters. PLoS Genet e1000978 PLoS Genet: e1000978. doi:10.1371/journal.pgen.1000978
42. RobertsonJGolesicEGauldieJWest-MaysJA 2009 Ocular Gene Transfer of Active TGF{beta} Induces Changes in Anterior Segment Morphology and Elevated IOP in Rats. Invest Ophthalmol Vis Sci
43. XinBPuffenbergerEGTurbenSTanHZhouA 2010 Homozygous frameshift mutation in TMCO1 causes a syndrome with craniofacial dysmorphism, skeletal anomalies, and mental retardation. Proc Natl Acad Sci U S A 258 263
44. ZhangZMoDCongPHeZLingF 2010 Molecular cloning, expression patterns and subcellular localization of porcine TMCO1 gene. Mol Biol Rep 1611 1618
45. EhretGBO'ConnorAAWederACooperRSChakravartiA 2009 Follow-up of a major linkage peak on chromosome 1 reveals suggestive QTLs associated with essential hypertension: GenNet study. Eur J Hum Genet 1650 1657
46. KleinBEKleinRKnudtsonMD 2005 Intraocular pressure and systemic blood pressure: longitudinal perspective: the Beaver Dam Eye Study. Br J Ophthalmol 284 287
47. KohlhaasMBoehmAGSpoerlEPurstenAGreinHJ 2006 Effect of central corneal thickness, corneal curvature, and axial length on applanation tonometry. Arch Ophthalmol 471 476
48. GordonMOBeiserJABrandtJDHeuerDKHigginbothamEJ 2002 The Ocular Hypertension Treatment Study: baseline factors that predict the onset of primary open-angle glaucoma. Arch Ophthalmol 714 720
49. ShimmyoMRossAJMoyAMostafaviR 2003 Intraocular pressure, Goldmann applanation tension, corneal thickness, and corneal curvature in Caucasians, Asians, Hispanics, and African Americans. Am J Ophthalmol 603 613
50. GunvantPBaskaranMVijayaLJosephISWatkinsRJ 2004 Effect of corneal parameters on measurements using the pulsatile ocular blood flow tonograph and Goldmann applanation tonometer. Br J Ophthalmol 518 522
51. FosterPJBaasanhuJAlsbirkPHMunkhbayarDUranchimegD 1998 Central corneal thickness and intraocular pressure in a Mongolian population. Ophthalmology 969 973
52. FosterPJMachinDWongTYNgTPKirwanJF 2003 Determinants of intraocular pressure and its association with glaucomatous optic neuropathy in Chinese Singaporeans: the Tanjong Pagar Study. Invest Ophthalmol Vis Sci 3885 3891
53. CharlesworthJKramerPLDyerTDiegoVSamplesJR 2010 The path to open-angle glaucoma gene discovery: endophenotypic status of intraocular pressure, cup-to-disc ratio, and central corneal thickness. Invest Ophthalmol Vis Sci 3509 3514
54. LandersJAHewittAWDimasiDPCharlesworthJCStragaT 2009 Heritability of central corneal thickness in nuclear families. Invest Ophthalmol Vis Sci 4087 4090
55. TohTLiewSHMacKinnonJRHewittAWPoulsenJL 2005 Central corneal thickness is highly heritable: the twin eye studies. Invest Ophthalmol Vis Sci 3718 3722
56. LuYDimasiDPHysiPGHewittAWBurdonKP 2010 Common genetic variants near the Brittle Cornea Syndrome locus ZNF469 influence the blinding disease risk factor central corneal thickness. PLoS Genet e1000947 doi:10.1371/journal.pgen.1000947
57. Newton-ChehCJohnsonTGatevaVTobinMDBochudM 2009 Genome-wide association study identifies eight loci associated with blood pressure. Nat Genet 666 676
58. LevyDEhretGBRiceKVerwoertGCLaunerLJ 2009 Genome-wide association study of blood pressure and hypertension. Nat Genet 677 687
59. van der ValkRWebersCASchoutenJSZeegersMPHendrikseF 2005 Intraocular pressure-lowering effects of all commonly used glaucoma drugs: a meta-analysis of randomized clinical trials. Ophthalmology 1177 1185
60. GabeltBTKaufmanPL 2005 Changes in aqueous humor dynamics with age and glaucoma. Prog Retin Eye Res 612 637
61. 1993 The effect of intensive treatment of diabetes on the development and progression of long-term complications in insulin-dependent diabetes mellitus. The Diabetes Control and Complications Trial Research Group. N Engl J Med 977 986
62. HofmanABretelerMMvan DuijnCMKrestinGPPolsHA 2007 The Rotterdam Study: objectives and design update. Eur J Epidemiol 819 829
63. AulchenkoYSHeutinkPMackayIBertoli-AvellaAMPullenJ 2004 Linkage disequilibrium in young genetically isolated Dutch population. Eur J Hum Genet 527 534
64. DielemansIVingerlingJRHofmanAGrobbeeDEde JongPT 1994 Reliability of intraocular pressure measurement with the Goldmann applanation tonometer in epidemiological studies. Graefes Arch Clin Exp Ophthalmol 141 144
65. AulchenkoYSRipkeSIsaacsAvan DuijnCM 2007 GenABEL: an R library for genome-wide association analysis. Bioinformatics 1294 1296
66. AminNvan DuijnCMAulchenkoYS 2007 A genomic background based method for association analysis in related individuals. PLoS ONE e1274 doi:10.1371/journal.pone.0001274
67. ChenWMAbecasisGR 2007 Family-based association tests for genomewide association scans. Am J Hum Genet 913 926
68. BacanuSADevlinBRoederK 2000 The power of genomic control. Am J Hum Genet 1933 1944
69. HoggartCJClarkTGDeIMWhittakerJCBaldingDJ 2008 Genome-wide significance for dense SNP and resequencing data. Genet Epidemiol 179 185
70. BooijJCvanSSSwagemakersSMEssingAHVerkerkAJ 2009 Functional annotation of the human retinal pigment epithelium transcriptome. BMC Genomics 164
Štítky
Genetika Reprodukční medicínaČlánek vyšel v časopise
PLOS Genetics
2012 Číslo 5
- Kazuistika – Perspektivy využití precizované medicíny v rámci personalizované specifické terapie onkologických pacientů
- Nobelova cena za chemii pro genetické nůžky: Objev, který změní naši budoucnost?
- Technologie na bázi RNA v klinické praxi: od přebarvených petúnií k terapii vzácných a dosud jen obtížně léčitelných chorob u lidí
- „Nepředstavovali jsme si, že náš výzkum povede přímo ke vzniku nových léků, dokonce ještě za našeho života“
- Bezplatné služby pro diagnostiku ATTRv amyloidózy pro kardiology
Nejčtenější v tomto čísle
- Inactivation of a Novel FGF23 Regulator, FAM20C, Leads to Hypophosphatemic Rickets in Mice
- Genome-Wide Association of Pericardial Fat Identifies a Unique Locus for Ectopic Fat
- Slowing Replication in Preparation for Reduction
- An Essential Role for Katanin p80 and Microtubule Severing in Male Gamete Production
Zvyšte si kvalifikaci online z pohodlí domova
Mazová zátka a její řešení
nový kurzVšechny kurzy