
Motility and Chemotaxis Mediate the Preferential Colonization of Gastric Injury Sites by
H. pylori is a disease-causing bacterium that commonly infects the human stomach in both developed and underdeveloped countries. Infected individuals can develop digestive diseases, including stomach inflammation, peptic ulcer, and cancer. There has been only limited investigation into the events when H. pylori first interacts with stomach tissue. Using anesthetized mice in which we have induced microscopic damage to the stomach surface, we find that H. pylori is able to rapidly detect and navigate towards this damage site. Within minutes, bacterial accumulation slows repair of the damage. This is the earliest event of H. pylori pathogenesis that has been reported in vivo. We further define that this pathology is due to the bacterial accumulation at damage sites and that this also occurs in a model of larger stomach damage (ulceration). The broader implications of our work are that even sub-clinical insults to the stomach that occur in daily life (damage from grinding of food, ingestion of alcohol, taking an aspirin) can potentially attract H. pylori and not only slow repair of any existing damage, but maybe also provide an initiation site that can start the pathogenic sequence of stomach disease caused by H. pylori.
Published in the journal:
. PLoS Pathog 10(7): e32767. doi:10.1371/journal.ppat.1004275
Category:
Research Article
doi:
https://doi.org/10.1371/journal.ppat.1004275
Summary
H. pylori is a disease-causing bacterium that commonly infects the human stomach in both developed and underdeveloped countries. Infected individuals can develop digestive diseases, including stomach inflammation, peptic ulcer, and cancer. There has been only limited investigation into the events when H. pylori first interacts with stomach tissue. Using anesthetized mice in which we have induced microscopic damage to the stomach surface, we find that H. pylori is able to rapidly detect and navigate towards this damage site. Within minutes, bacterial accumulation slows repair of the damage. This is the earliest event of H. pylori pathogenesis that has been reported in vivo. We further define that this pathology is due to the bacterial accumulation at damage sites and that this also occurs in a model of larger stomach damage (ulceration). The broader implications of our work are that even sub-clinical insults to the stomach that occur in daily life (damage from grinding of food, ingestion of alcohol, taking an aspirin) can potentially attract H. pylori and not only slow repair of any existing damage, but maybe also provide an initiation site that can start the pathogenic sequence of stomach disease caused by H. pylori.
Introduction
H. pylori infection promotes gastritis, gastric ulceration, and gastric cancer [1]. The mechanisms of early H. pylori interaction with gastric tissue have not been explored, but are essential for successful colonization and ultimately the disease consequences of H. pylori infection. H. pylori is believed to migrate through the gastric environment by chemotaxis, using its multiple flagella [2], [3]. Indeed, motility and chemotaxis have been shown to lower the dose of H. pylori needed to establish an infection [2], [3]. In vitro, H. pylori motility responds to various conditions, including CO2, urea/ammonium, arginine, bacterial energy status and low pH [4]–[9]. Additionally, H. pylori has been shown to use gradients that are sensitive to pH to localize close to the gastric epithelium in vivo [7]. We and others have shown that damage to the gastric epithelium (commonly produced by alcohol, salt intake, smoking, and non-steroidal anti-inflammatory drugs usage) can affect the luminal microenvironment adjacent to tissue [10]–[13]. We were thus curious whether H. pylori can sense and respond to these damage-induced microenvironments using chemotaxis, and whether these regions might serve as preferential colonization sites.
H. pylori uses largely canonical chemotaxis signal transduction to promote chemotaxis [4]. H. pylori senses its environment through four chemoreceptors TlpA, TlpB, TlpC, and TlpD that detect conditions including pH, autoinducer 2, CO2, arginine, urea/NH4 and molecules that lead to bacterial energy generation [4]–[6], [8], [9], [14], [15]. Ligand interactions with chemoreceptors control the direction of flagellar motor rotation via the Che family of proteins [4]. The most downstream member of the Che protein family, CheY, directly interacts with the flagellar motor to control flagellar rotational direction [4], [16], [17]. Generation of torque for flagellar rotation is regulated by members of the Mot family of proteins, MotA and MotB [4]. Isogenic mutant strains lacking the flagellar motor protein MotB (ΔmotB) retain wild-type flagellar structure (Fla+), but the Mot− flagella are non-functional [2]. H. pylori lacking the motB gene have no motility and a substantially reduced ability to colonize the stomach initially and to multiply to full bacterial loads [2], [4]. Mutants lacking CheY (ΔcheY) retain functional flagella (Mot+) but cannot change the direction of flagellar rotation, and thus are non-chemotactic (Che−) [3], [4], [18]. ΔcheY swim with fewer direction changes as compared to wild-type H. pylori [19], [20].
In vivo, chemotaxis promotes multiple aspects of H. pylori gastric colonization. Che− H. pylori similarly show a reduced ability to colonize the stomach, particularly at early time points [3], [18], [21], [22]. In addition, they lose the ability to locate close to the epithelial surface and deep in the antral gastric glands [3], [21]. Thus, evidence supports that chemotaxis aids colonization, but whether it is directed toward sites of damage is not known.
In the present study, we test the role of H. pylori chemosensing and motility in response to damaged tissue in vivo, using acetic-acid ulcer induction as a long term injury/repair model, and then extend results to short term injury/repair using two-photon induced gastric epithelial damage.
Results
We first confirmed the motility of wild-type H. pylori (Sydney Strain 1: SS1) used in this study by tracking individual fluorescently labeled H. pylori using a fast-scan confocal microscope (Movie S1). As shown in Figures S1 and S2, fluorescently labeled wild-type H. pylori (n = 6 experiments) had motility properties (swimming in straight or arced lines at mean velocity 25.5±0.7 µm/sec, number of stopping: 0.13±0.05 per sec, frequent changes in speed, slowed motility at pH 5 and pH 4) consistent with previous findings [19], [20], [23]. Results from fluorescently labeled H. pylori were indistinguishable from unlabeled H. pylori (velocity: 28.5±1.1 µm/sec, number of stopping: 0.15±0.06 per sec, n = 6).
Ulcer repair is inhibited rapidly by H. pylori
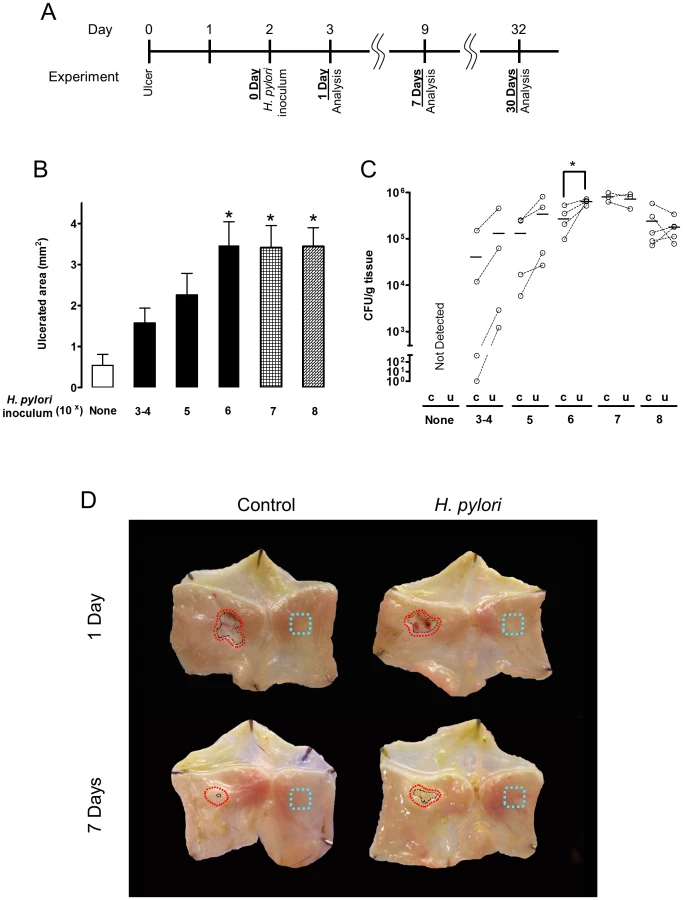
Acetic acid-induced ulcer models are well established and resemble human ulcers in terms of both pathological features and healing process [24]. Murine gastric ulcers were induced by serosal topical application of acetic acid to the exterior of the intact stomach corpus, then two days later, when ulcer size is maximal, wild-type SS1 H. pylori was gavaged into the ulcerated stomach. We evaluated both ulcer size and H. pylori colonization at days 3, 9 and 32 after ulcer induction (which are respectively, Day 1, 7, and 30 after inoculation; as shown in the Figure 1A diagram). Wild-type H. pylori delayed ulcer healing 7 Days after inoculation, in a dose dependent manner, as compared to almost complete ulcer healing in the absence of H. pylori over the same time interval (Figure 1B and 1D). Inoculation with ≥106 H. pylori resulted in reproducible detection of colony forming units (CFU) from the small ulcerated area (Figure 1C) as well as significantly impaired ulcer healing, so was used as the routine inoculum. Looking at a more extensive time course, ulcer size diminished in the uninfected control group approximately 6-fold in the first 9 days after damage, and no macroscopic ulcer was observed 32 days after damage (Figure 2A). H. pylori had no effect on initial damage size at day 3 (1 Day after inoculum), however H. pylori significantly delayed ulcer healing such that at day 32 the ulcers were still prominent (Figure 2A).

Preferential colonization of ulcerated tissue by H. pylori
In the same experiments, we compared the time course of bacterial colonization in the ulcerated tissue versus the contralateral region of undamaged tissue on the opposite side of the same stomach, using small tissue regions collected as shown in Figure 1D. We used two independent methods to measure H. pylori colonization of tissue: bacterial culture to obtain CFU (Figure 2B) and PCR of the H. pylori ssa gene (Figure S3) [25]. Control experiments confirmed the accuracy of the ssa PCR method versus CFU determination (Figure S3). Both methods identified significantly higher H. pylori colonization at the ulcer site versus the undamaged area of gastric tissue, at 1, 7 and 30 Days after inoculation (Figure 2B and S3). Both methods also reported undetectable levels of H. pylori in control (uninfected) tissues, confirming the specificity of our techniques. Additional control experiments examined conditions of no surgery and sham surgery (in the latter case applying PBS instead of acetic acid) to confirm that H. pylori colonization was not affected by these factors at either Day 1 or Day 7 after inoculum (Figure S4). Figure S4 also confirms that bacterial growth between Day 1–7 is not affected by surgery.
We also measured whether ulceration changed the total gastric bacterial load, and separately quantified gastric Lactobacilli. In mice not treated with H. pylori, PCR of 16S rRNA reported no difference in total bacterial load between the ulcers and healthy regions, suggesting that ulceration did not generally increase bacterial colonization (Figure 2C). As predicted, gavage with H. pylori increased total bacterial load versus the control condition in absence of both ulceration and H. pylori (Figure 2C). PCR for the genus Lactobacillus, a documented stomach commensal, confirmed the presence of the bacteria in control and H. pylori infected stomachs, but Lactobacillus did not preferentially colonize ulcerated tissues in either the absence or presence of H. pylori (Figure 2D). As reported by others, we observed that Lactobacillus increased at 30 Days after H. pylori inoculation [26]. Since this was not observed at earlier time points, this H. pylori-induced gastric microbiota change is a more long time effect. Combined, these results suggest that the observed preferential colonization of damaged tissue is specific to H. pylori.
We examined two proteins by real-time PCR (Figure 3) and immunofluorescence (Figure 4–6) to interrogate tissue architecture and H. pylori tissue localization during the ulcer repair cycle. Trefoil factor 2 (TFF2) is a marker for gastric mucous cells, and a peptide that has been shown to promote repair of gastric damage [12]. H,K-ATPase mediates the gastric acid secretion that can oppose ulcer healing [24] and is a classic marker of parietal cells. Three days after ulcer induction in the absence of H. pylori, H&E staining (Figure 4A) showed many necrotic or apoptotic cells present at the ulcerated area (the ulcer crater recognized by macroscopic imaging in Figure 1D), and both PCR of ulcerated tissue (Figure 3A) and immunostaining (Figure 4A) showed the same area depleted of parietal cells. At this time point, H. pylori inoculation (for 24 hrs; Day 1) did not change these features recognized by macroscopic imaging (Figure 1D), PCR (Figure 3A) or histology and immunostaining (Figure 4A). H. pylori did, however, increase the presence of TFF2 recognized by both PCR and immunostaining (Figures 3B and 4A). By immunostaining, H. pylori bacteria were identified at the tissue surface and within gastric gland lumens (Figure 4B), while we failed to detect H. pylori in non-H. pylori infected stomachs (Figure S5). In infected stomachs, H. pylori appeared most abundantly in the ulcerated tissue and at ulcer margins (Figure 4B,b–c), but were also identified in undamaged tissue (Figure 4Ba).


In tissue at Day 7 (Figure 5) and Day 30 (Figure 6) after H. pylori inoculation (or 9 and 32 days post-ulcer induction), we observed the gastric epithelium still displayed altered distributions of H,K-ATPase and TFF2. In the uninfected tissues at both of these later time points the ulcer was healed and the epithelium had fully regenerated, but both immunostaining and PCR reported a sustained decrease in parietal cells (H,K-ATPase) and increase of mucous cells (TFF2) in the area that had been damaged. A more extensive comparison of the stomach distribution of these two proteins across the corpus at day 9 (Figure S6) confirms that these alterations are restricted to the area of gastric damage. In the H. pylori infected tissues at these later time points, no ulcer crater was visible macroscopically 32 days after ulceration (Day 30 after H. pylori inoculum), but histologically the tissue showed partial epithelialization and inflamed tissue at ulcer margins (Figure 5A & 6A). In this condition, both PCR and immunostaining report that infected ulcerated tissue has reduced parietal cells (H,K-ATPase) compared to infected tissue from non-ulcerated areas. In contrast, PCR reports an elevation in TFF2 in both intact and ulcerated areas of the infected tissue suggesting a general effect of H. pylori infection on TFF2 mRNA abundance (Figure 3B). In contrast, although TFF2 immunostaining is generally elevated in the damaged and ulcer margin areas at these later time points, we could not discern a consistent increase in TFF2 protein levels in general non-ulcerated tissue (Figure 5 and 6). Differences between mRNA and protein levels are commonly observed, and in this case discrepancies may be compounded in the PCR analysis by the need to collect tissues with variable amounts of ulcerated tissue over this repair time course. H. pylori bacteria were identified at both tissue surface and within gastric gland lumens at Day 7 after inoculation, but only within glands at Day 30 (Figure 5B and 6B). Qualitatively, H. pylori density appeared highest at ulcer margins. These results suggest that H. pylori preferentially colonizes the ulcerated tissue at the early time point, followed by migration/expansion to surrounding viable epithelial cells as colonization is established.
Role of motility and chemotaxis in ulcer colonization
To test the importance of H. pylori motility and chemotaxis in the preferential colonization of ulcerated tissue at early time points (1–7 Days after inoculation), we used H. pylori ΔmotB or ΔcheY mutants. Prior to use, we confirmed the previously described motility phenotypes of these strains [2], [3]. As expected, ΔmotB mutants are not motile, ΔcheY mutants are motile but do not change direction, and wild-type strains display normal motility and pH sensitivity (Figure S1 and S2). After inoculation with 106 ΔmotB, we failed to detect H. pylori colonization in the stomach (Figure 7A). However, ΔmotB could colonize the stomach if we infected with a higher dose of 108 (Figure 7A). Under this condition, we recovered ∼100 fold lower CFU/g of this mutant as compared to wild-type (Figure 7A). These findings are consistent with the documented elevated infectious dose and poor colonization properties previously reported for strains lacking motility [2]. Although there was moderate colonization by the ΔmotB strain, it did not inhibit ulcer healing (Figure 7B) as compared to the wild-type. In addition, H. pylori ΔmotB displayed no difference in the colonization of undamaged and ulcerated areas of stomach at either time point (Figure 7A). In contrast, 106 ΔcheY colonized the stomach initially at low levels that increased over time (Figure 7A), and ΔcheY inhibited ulcer healing (Figure 7B). Results suggest ΔcheY grows reasonably in gastric tissue, consistent with previous findings [27]. In contrast to what we observed with wild-type H. pylori, ΔcheY colonized undamaged and ulcerated areas of stomach equally at either time point (Figure 7A). These results suggest that motility and chemotaxis facilitate the ability of H. pylori to colonize damaged gastric tissue to elevated levels.

In Figure 8, we plotted all data of wild-type and mutant H. pylori CFU/g in ulcerated regions versus the ulcer size from the same animal. As expected, 24 hr after inoculation, there is no correlation between ulcer size and H. pylori CFU (Figure 8A). In contrast, at Day 7 after inoculation (9 days after ulceration), we observed a strong correlation between bacterial load of all H. pylori genotypes and ulcer size (Figure 8B). This correlation suggests that bacterial load leads to compromised ulcer healing independent of H. pylori genotype. Once colonization is established, other virulence factors independent of chemotaxis and motility may slow ulcer repair. These results also suggest that chemosensing and motility help H. pylori target regions of tissue damage, and increase the efficiency of colonization.

H. pylori chemotaxis immediately after detecting gastric damage
Our observations above show that H. pylori preferentially colonizes damaged tissue within one day after inoculation, but it was not clear when within this 24 hour period H. pylori localized with the damaged tissue, so we examined H. pylori behavior at earlier time points. Pilot experiments applied fluorescently tagged wild-type H. pylori directly to the surface of the surgically exposed gastric mucosa of anesthetized animals, whose stomachs were previously ulcerated by acetic acid. As shown in Figure S7, intravital confocal microscopy reported wild-type H. pylori were found more abundantly in ulcerated areas than in intact tissue within 1 hr of bacterial addition. In contrast, ΔcheY was less abundant in both intact and ulcerated tissue (Figure S7). This model was not pursued further since acetic acid ulcers were too large and heterogeneous to test in the same microscopic field if H. pylori selectively accumulates at a site of injury.
Therefore we used established two-photon microscopy methods to induce microscopic epithelial lesions in surgically exposed mouse gastric mucosa and then tracked repair in real-time over 15 min [11], [12], [28]. In initial experiments, we added fluorescent beads (1.0 µm diameter) to the gastric luminal superfusate, then induced photodamage of 3–5 gastric surface epithelial cells by two-photon laser. We then measured the rheological properties of the in vivo injury site environment. As shown in Figure 9B, S8 and Movie S2, fluorescent beads moved away from gastric tissue after damage, suggesting that the injury creates fluid flow away from the tissue into the lumen. Fluorescently labeled H. pylori ΔmotB showed a similar passive flow away from the injury site in response to gastric damage (Figure 9B). In contrast, wild-type H. pylori rapidly accumulated at the two photon-induced damage site (Figure 9B) and this tissue accumulation was not observed in the absence of imposed damage (Figure 9A). H. pylori ΔcheY gradually accumulated at the gastric surface, but ΔcheY did not show an obvious affinity for the site of gastric damage. Results from such time course experiments were quantified by comparing surface intensity of H. pylori fluorescence at the site of damage versus surface regions (>50 µm) distant from damage (Figure 10C–E). Results from multiple experiments are compiled in Figure 10F, showing that ΔcheY had more limited surface accumulation than wild-type but greater than the strain lacking motility, and that only wild-type responded to damage with a preferential accumulation at damage sites.


In the same experiments evaluating bacterial surface accumulation in real time, we measured speed of gastric repair. Figure 10A shows the time course of repair, and Figure 10B shows the value of repair rate compiled from multiple experiments. Compared to the absence of bacteria (vehicle control), both wild-type and ΔcheY inhibited repair of damage, but ΔmotB did not.
Discussion
H. pylori chemotaxis genes have been identified as acid-induced genes and virulence factors that promote colonization initially and throughout infection, as well as promote H. pylori disease [4], [27], [29]. In H. pylori, however, the in vivo host-derived chemotactic factors regulating interactions of H. pylori with gastric tissue have been difficult to study. In this report, we used mouse models of ulceration and superficial epithelial damage to study the mechanisms employed by H. pylori to colonize the gastric niche. We demonstrate that H. pylori preferentially colonizes at an injury site compared to healthy regions of the stomach, with the highest efficiency of colonization requiring contributions of the chemotaxis system and flagellar motor activity in sensing the location of damaged tissue, and migrating towards the damage.
In our experiments, H. pylori can colonize gastric tissue in the absence of chemotaxis or even bacterial motility. Consistent with previous results [2], [3], our results suggest that high bacterial inocula can overcome the need for chemotaxis and motility. This finding is likely due to the fact that at supra-physiologic concentrations, there is increased probability that H. pylori will locate the correct niche by chance. Thus Che− and Mot− bacteria can establish colonization by luckily landing in favorable growth conditions and then engaging the mechanisms for attachment and other virulence factors normally engaged downstream of the chemotaxis functions.
Our study makes the striking observations that not only can H. pylori slow the repair of macroscopic ulcers over a period of 30 Days, but H. pylori in the gastric lumen can find damaged tissue and slow repair in a matter of minutes. Many investigators have confirmed that H. pylori inhibits ulcer healing induced by acetic acid [30]–[32], and one interesting study showed that gastric ulcer relapse occurs rapidly following H. pylori infection [30]. Using Mongolian gerbils, these investigators demonstrated that 8 weeks post-ulcer induction, ulcers were healed. However inoculation with H. pylori at this time point lead to re-expression of gastric ulcer more rapidly compared to previously uninjured animals [30]. Although the H. pylori abundance at the ulcerated area was not specifically determined in this prior study, it can be speculated that H. pylori were able to sense damaged tissue and preferentially colonize this site for rapid re-ulceration. Results from our micro-lesion model do not yet allow us to determine what H. pylori factors slow gastric repair. However, in both the ulcer and micro-lesion models, the ability of the ΔcheY mutant to slow repair makes it clear that the chemosensing system is not necessary to compromise epithelial repair.
We observed a striking decrease in H,K-ATPase expression during gastric ulcer healing, consistent with previous reports [33], [34]. We extended these findings by demonstrating that H,K-ATPase expression remains suppressed in the regenerating epithelium even by 32 days after ulceration, similar to observations by Blom's group that gastric wound repair resulted in full re-epithelialization by one month but parietal cells only re-appeared at 3 months and the number of parietal cells in the healed gastric mucosa never reached pre-ulceration levels [33]. Since the regenerated epithelium is slow to restore a normal cell census of parietal and TFF2-containing mucous cells, it is clear that ulcer healing results in an altered gastric epithelium that will alter both local gastric function and sensitivity to further insult. Results suggest that H. pylori may further delay the restoration of a normal epithelium in part by further delaying the epithelial repair process.
It is not yet known what signals drive H. pylori toward the damaged tissue. Changes in luminal pH in the microenvironment near the gastric surface may be a signal used by H. pylori chemotaxis to colonize this niche. We have shown that the pH increases in the luminal juxtamucosal space near the microlesions induced by two-photon laser damage [11], [12]. Others have used pH electrodes to show pH increases over sites of pervasive superficial gastric damage [13]. In preliminary studies with a pH 3 luminal perfusate, we observed using fluorescent pH indicators that luminal pH adjacent to the ulcer tissue was significantly elevated compared with intact tissue (Figure S9). H. pylori has a well-established pH-tactic response. It is reported that most H. pylori are free-swimming in the mucus gel layer within ∼30 µm of the epithelial surface [7], [35], [36]. H. pylori furthermore are spatially oriented within the mucus layer based on pH gradients [7]. Disruption of these gradients, by equalizing luminal and surface pH, causes H. pylori to lose their direction of motion, and spread over the entire mucus layer [37]. Specifically, H. pylori are repelled by acidic regions in vitro, and this behavior is eliminated by deletion of one of the chemotaxis receptor genes, tlpB, as well as the general chemotaxis pathway [8], [15]. In this study, we report that ΔcheY behavior is also different from wild-type H. pylori in a low pH environment. Thus one might predict that H. pylori's response to migrate away from acidic conditions would drive it toward the more neutral conditions overlying the damaged tissue.
Hydrogen ion concentration is only one of numerous gradients that could be act as chemorepellents or chemoattractants after gastric damage. Our 2-photon experiments determined that H. pylori responds to injury within minutes, and therefore it is unlikely that any signals result from inflammatory products. Instead, they are likely to arise by release promptly from epithelial damage. There are many potential candidates for H. pylori chemoattractants, including pH (CO2, HCO3−, H+), serum factors, urea, and ions (Ca, Mg, Fe, Zn etc) [4], although their presence at the injury site is not yet known. Several of these are reported chemoattractants for H. pylori in vitro, but not yet established in vivo [4], [20]. Based on the ability to rapidly evaluate H. pylori accumulation at the site of injury, further studies can now determine the chemoattractant(s) in the injury environment. Since this accumulation also slows gastric repair within minutes, future work also offers an opportunity to explore the mechanism and genes allowing H. pylori to initiate its earliest pathophysiological effects.
Several pathogens including H. pylori require chemotaxis for colonization, but to our knowledge, this report is the first to show bacterial chemotaxis aiding colonization of damaged tissue. However, Amieva's group has shown that in the intestine, Listeria monocytogenes preferentially adheres at sites of epithelial cell shedding [38]; and this may be considered a physiologic correlate of the microscopic epithelial discontinuity that we have produced experimentally. Supporting this conjecture, the same group has also shown that H. pylori can form microcolonies over intercellular junctions of cultured non-gastric cells [39]. Combined, the evidence suggests that compromises to the epithelial barrier can be an invitation to bacteria. There are several examples of chemotaxis directing pathogens to specific niches in vivo. For example, H. pylori requires chemotaxis for optimal initial colonization of the corpus and antrum, but after months of infection chemotaxis is only required to promote stable colonization and bacterial proliferation in the gastric glands of the antrum [3], [27]. In contrast, Vibrio cholerae uses chemotaxis to restrict its colonization to the jejunum and ileum. Che− V. cholerae are found in elevated numbers compared to wild type throughout the gastrointestinal tract [40]. As documented in this work, bacteria are exquisite biosensors of their environment. As we continue to study the role of chemotaxis in vivo, we will learn about the variety and importance of these niches for promoting bacterial colonization and disease pathogenesis.
Materials and Methods
Ethics statement
All mice experiments were conducted according to both Animal Welfare Act Regulations and Public Health Service Policy on Humane Care and Use of Laboratory Animals. Mice were maintained in an AAALAC approved facility and all animal studies followed protocol 04-03-08-01 that was approved by the Institutional Animal Care and Use Committee of the University of Cincinnati (Cincinnati, OH).
Animal husbandry and surgery
Experiments used C57BL/6J mice (Jackson lab, Bar Harbor, ME). Animals were used for experiments at 3–6 month of age, were fed a standard rodent chow diet, and had free access to water.
Gastric ulcers were produced by acetic acid, according to a previously described method with slight modification [24]. In brief, under isoflurane anesthesia, the abdomen was incised and the intact stomach exposed. A microcapillary tube (0.7 mm in diameter: Drummond Scientific Co. Broomall, PA) filled with acetic acid (99%) was placed in contact with the exterior surface of the stomach corpus region and left in place for 25 sec. Buprenorphine hydrochloride (0.75 mg/kg i.p., Buprenex, Rechkitt Benckiser Pharmaceuticals Inc., Richmond, VA) was given as preemptive analgesia. After the acid was removed, the treated exterior of the stomach was wiped with gauze, the abdomen was closed, and the animals were routinely maintained with food and tap water. Using this procedure, no incision was made to the stomach as part of ulcer induction.
To examine ulcer healing, animals were sacrificed on day 3, 9, or 32 after ulceration, and the stomach was removed and opened along the greater curvature. The area (mm2) of ulceration was measured by digital caliper (Mitutoyo, Kanagawa, Japan). Since deep, well-defined ulcers were consistently observed 2 days following acid application [24], [41], H. pylori were gavaged at day 2 after the ulceration. Control uninfected animals received Brucella broth vehicle.
The surgical preparation of animals for in vivo gastric microscopic damage study has been described [11], [12], [42]. Briefly, mice were anesthetized with inactin (10 mg/kg i.p., Sigma, St. Louis, MO) and ketamine (50 mg/kg i.p., Phoenix, St. Joseph, MO, USA), then the stomachs of anesthetized mice were exteriorized and everted to expose the gastric mucosa. The mouse was placed in prone position such that a portion of the exposed mucosa protruded into a perfusion chamber on the stage of an inverted confocal/two-photon microscope (Zeiss LSM 510 NLO; Carl Zeiss, Jena, Germany), with the microscope stage enclosed and heated to keep the animal's body temperature at ∼37°C. The mucosal surface was exposed to fluorescently labeled H. pylori.
Preparation and inoculation of H. pylori
H. pylori strain SS1 and isogenic mutants [2]–[4] were grown on Columbia blood agar plates (Remel, Lenexa, KS, USA) containing 5% defibrinated horse blood (Colorado Serum, Denver, CO, USA), 0.2% β-cyclodextrin (Sigma), 50 µg/ml cyclohexamide (Sigma), 5 µg/ml vancomycin (Sigma), 10 µg/ml trimethoprim (Sigma) and 5 µg/ml chloramphenicol (only for ΔcheY mutant, Sigma) for 4 days. Colonies from these plates tested positive for urease (BD Diagnostic Systems, Franklin Lakes, NJ, USA), catalase (using 3% H2O2) and oxidase (DrySlide, BD Diagnostic Systems). Bacteria harvested from the plate were grown in Brucella broth (BD Diagnostic Systems) supplemented with 10% fetal bovine serum and CO2 gas pack (BD Diagnostic Systems) in a humidified microaerophilic chamber (BBL Gas System, with CampyPak Plus packs, BD Microbiology, Sparks, MD, USA) in an incubator at 37°C for 16 to 18 hr without shaking. Bacteria were collected by centrifuge at 2000 rpm for 5 min, and resuspended in Brucella broth without serum. H. pylori were diluted in 50% glycerol (1∶100 dilution) and counted in haemocytometer. Each mouse received 200 µl Brucella broth containing 103 to 108 H. pylori bacteria. Control mice (uninfected group) received 200 µl of Brucella broth alone.
For in vivo gastric microscopic damage study, H. pylori was labeled with one of the following fluorescent dyes (Invitrogen, Carlsbad, CA, USA): cell tracker green CMFDA, cell tracker orange CMRA or 5-(and -6)carboxyfluorescein diacetate, succinimidyl ester (5(6) - CFDA, SE: CFSE)-mixed isomers. Briefly, fluorescent dye (5 µM) was added into Brucella broth containing H. pylori for 15 min at 37°C, then washed with Brucella broth twice using 0.22 µm filter. H. pylori were adjusted to 108/ml for usage.
Quantification of levels of H. pylori in mouse stomach tissue
The wet weight was measured of small regions of mouse gastric tissue collected from intact (right side of gastric corpus in Figure 1D) and ulcerated (left side of gastric corpus in Figure 1D) tissue. Tissue was homogenized by Tissue Tearor (Model: 985370-395, BioSpec Products) in 1 ml saline and 1–10 dilutions were spread on a Columbia blood agar plate containing 5% defibrinated horse blood, 50 µg/ml cyclohexamide, 5 µg/ml vancomycin, 10 µg/ml trimethoprim (and 5 µg/ml chloramphenicol only for CheY mutant). Plates were incubated for 5–7 days at 37°C in a humidified microaerophilic chamber with CO2 gas pack. Colonies were counted and data normalized using the tissue weight and expressed in CFU/g tissue.
Quantification of total bacteria using real-time PCR
Quantitative analysis of bacterial load was performed by qRT-PCR using specific primers targeting different gut bacterial groups. Total RNA was isolated from either the intact or ulcerated area of stomach using TRI Reagent (Molecular Research Center) and single-stranded cDNA was synthesized by iScript cDNA synthesis kit (Bio-Rad, Hercules, CA, USA). Quantitative real-time PCR was performed using SYBR Green PCR Master Mix (Applied Biosystems) with following specific primers: 16S rRNA (Forward: 5′-ACTCCTACGGGAGGCAGCAGT-3′ and Reverse: 5′ - ATTACCGCGGCTGCTGGC-3′) [43], Lactobacillus (Forward: 5′-GGAAACAGATGCTAATACCG-3′ and Reverse: 5′-CACCGCTACACATGGAG-3′) [44], SSA specific to H. pylori (Forward: 5′-TGGCGTGCTCTATTGACAGCGAGC-3′ and Reverse: 5′-CCTGCTGGGCATACTTCACCATG-3′), H,K-ATPase (Forward: 5′-AGATGGTGTTTGCTCGAACC-3′ and Reverse: 5′-TCCAGCAAGATCATGTCAGC-3′), TFF2 (Forward: 5′-GCAGTGCTTTGATCTTGGATGC-3′ and Reverse: 5′-TCAGGTTGGAAAAGCAGCAGTT-3′), or GAPDH (Forward: 5′-AACGACCCCTTCATTGAC-3′ and Reverse: 5′-TCCACGACATACTCAGCAC-3′). Each PCR amplification was performed in duplicate wells in a StepOnePlus Real-Time PCR System (Applied Biosystems).
Histological assessment
Mouse intact or ulcerated stomach tissue was embedded in OCT and frozen and stored at −80°C. Serial cryosections (10 µm) were prepared by cryostat. The section was stained with hematoxylin & eosin to localize and evaluate damage severity. The adjacent sections including damaged area were then stained using anitbodies against H. pylori, TFF2 or H+/K+-ATPase. For immunostaining, sections were fixed with 4% paraformaldehyde followed by incubated with goat serum (4%) for 60 min. Sections were then incubated with primary antibodies indicated below for 60 min in room temperature. Primary antibodies to H. pylori (Rabbit polyclonal 1∶ 1000, Abcam) and H+/K+-ATPase alpha subunit (Mouse monoclonal 1∶ 1000, Thermo Science) or TFF2 (Rabbit polyclonal, 1∶200) were used. Secondary antibodies (Alexa 633-labeled goat anti-mouse IgGγ1 : 1∶1000, and Alexa 488-labeled goat anti-rabbit IgG, 1∶1000 for H. pylori, 1∶ 400 for TFF2, Invitrogen, Carlsbad, CA, USA) were incubated for 60 min in room temperature. Nuclear DNA staining was performed by incubation with Hoechst 33342 (Invitrogen) at 1 µg/ml for 1 min.
Live H. pylori quantitative imaging
H. pylori labeled with CMFDA or CFDA-SE (Invitrogen) fluorescence was imaged at 500–530 nm in response to 488 nm excitation, while CMRA was imaged at 565–615 nm in response to 560 nm excitation. H. pylori was loaded into uncoated μ-Slide chamber (ibidi) and monitored on the inverted fast scan confocal microscope (Zeiss LSM 7 LIVE; Carl Zeiss), with the microscope stage enclosed and heated at ∼37°C. To analyze bacterial swimming, the program Image J with manual tracking plugin was used. The number of stopping was counted from 4 sec motility traces and data showed as number of stopping per second.
Gastric microscopic damage model
The method of inducing, tracking, and quantifying microscopic photodamage in the gastric surface epithelium has been described previously [11], [12], [28], [42]. Two-photon imaging of tissue NAD(P)H autofluorescence (Ti-Sa excitation 730 nm, emission 435–485 nm) was collected simultaneously with a confocal reflectance image (reflecting 730 nm light to show cell/tissue structure). In some experiments, CMFDA-labeled H. pylori was applied to chamber and monitored in parallel (Ex: 488 nm, Em: 500–550 nm). After collecting a set of control images using minimal laser power, a small rectangle region (≈200 µm2) of gastric surface epithelium in the corpus was repetitively scanned at high Ti-Sa laser power (350 mW average) for 150 iterations (requiring 5–15 sec). Photobleaching of endogenous NAD(P)H induced epithelial cell death and extrusion followed normally by epithelial restitution via epithelial cell migration in ∼15 min, as recorded by two-photon/confocal time course imaging.
Damage (and repair) was quantified from the time course of images as described [12], [28] using Metamorph software (ver. 6.3, Molecular Devices, Downington, PA, USA). Briefly, the damaged area was measured as the region of cellular loss of autofluorescence NAD(P)H, using confocal reflectance images to positively identify the location of cellular structures. In each experiment, we determined the time point displaying maximal damage area and estimated rates of epithelial restitution starting from this time with a single exponential curve fit to the changing size of damaged area over time [12]. Best fit values of the rate constant (κ) were used as estimates of the rate of restitution (estimate of the fractional recovery per time, in units of sec−1). In some experiments, intensity of H. pylori fluorescence at the gastric surface was measured. The damage-repair cycle was measured independently several times per animal in different locations of the corpus, and outcomes from at least 4 animals were compiled for each experimental protocol.
Statistical analysis
All values are reported from representative experiments as the mean ± standard error of the mean (SEM) from multiple experiments. The number of repetitions is reported as the number of independent damage-repair cycles (n) analyzed, and the number of different animals used is also indicated. All results were reproduced in at least 4 animals. Statistical significance was determined using unpaired Student's T-test, or one-way ANOVA with Dunnett's multiple comparison post-hoc test. A p value of <0.05 was considered significant.
Supporting Information
Zdroje
1. MarshallBJ, WarrenJR (1984) Unidentified curved bacilli in the stomach of patients with gastritis and peptic ulceration. Lancet 1 : 1311–1315.
2. OttemannKM, LowenthalAC (2002) Helicobacter pylori uses motility for initial colonization and to attain robust infection. Infect Immun 70 : 1984–1990.
3. TerryK, WilliamsSM, ConnollyL, OttemannKM (2005) Chemotaxis plays multiple roles during Helicobacter pylori animal infection. Infect Immun 73 : 803–811.
4. LertsethtakarnP, OttemannKM, HendrixsonDR (2011) Motility and chemotaxis in Campylobacter and Helicobacter. Annu Rev Microbiol 65 : 389–410.
5. MizoteT, YoshiyamaH, NakazawaT (1997) Urease-independent chemotactic responses of Helicobacter pylori to urea, urease inhibitors, and sodium bicarbonate. Infect Immun 65 : 1519–1521.
6. CerdaO, RivasA, ToledoH (2003) Helicobacter pylori strain ATCC700392 encodes a methyl-accepting chemotaxis receptor protein (MCP) for arginine and sodium bicarbonate. FEMS Microbiol Lett 224 : 175–181.
7. SchreiberS, KonradtM, GrollC, ScheidP, HanauerG, et al. (2004) The spatial orientation of Helicobacter pylori in the gastric mucus. Proc Natl Acad Sci U S A 101 : 5024–5029.
8. CroxenMA, SissonG, MelanoR, HoffmanPS (2006) The Helicobacter pylori chemotaxis receptor TlpB (HP0103) is required for pH taxis and for colonization of the gastric mucosa. J Bacteriol 188 : 2656–2665.
9. SchweinitzerT, MizoteT, IshikawaN, DudnikA, InatsuS, et al. (2008) Functional characterization and mutagenesis of the proposed behavioral sensor TlpD of Helicobacter pylori. J Bacteriol 190 : 3244–3255.
10. GarnerA, FlemstromG, AllenA, HeylingsJR, McQueenS (1984) Gastric mucosal protective mechanisms: roles of epithelial bicarbonate and mucus secretions. Scand J Gastroenterol Suppl 101 : 79–86.
11. StarodubOT, DemitrackES, BaumgartnerHK, MontroseMH (2008) Disruption of the Cox-1 gene slows repair of microscopic lesions in the mouse gastric epithelium. Am J Physiol Cell Physiol 294: C223–232.
12. XueL, AiharaE, PodolskyDK, WangTC, MontroseMH (2010) In vivo action of trefoil factor 2 (TFF2) to speed gastric repair is independent of cyclooxygenase. Gut 59 : 1184–1191.
13. NishioH, TerashimaS, NakashimaM, AiharaE, TakeuchiK (2007) Involvement of prostaglandin E receptor EP3 subtype and prostacyclin IP receptor in decreased acid response in damaged stomach. J Physiol Pharmacol 58 : 407–421.
14. RaderBA, WredenC, HicksKG, SweeneyEG, OttemannKM, et al. (2011) Helicobacter pylori perceives the quorum-sensing molecule AI-2 as a chemorepellent via the chemoreceptor TlpB. Microbiology 157 : 2445–2455.
15. Goers SweeneyE, HendersonJN, GoersJ, WredenC, HicksKG, et al. (2012) Structure and proposed mechanism for the pH-sensing Helicobacter pylori chemoreceptor TlpB. Structure 20 : 1177–1188.
16. BeierD, SpohnG, RappuoliR, ScarlatoV (1997) Identification and characterization of an operon of Helicobacter pylori that is involved in motility and stress adaptation. J Bacteriol 179 : 4676–4683.
17. LowenthalAC, HillM, SycuroLK, MehmoodK, SalamaNR, et al. (2009) Functional analysis of the Helicobacter pylori flagellar switch proteins. J Bacteriol 191 : 7147–7156.
18. FoynesS, DorrellN, WardSJ, StablerRA, McColmAA, et al. (2000) Helicobacter pylori possesses two CheY response regulators and a histidine kinase sensor, CheA, which are essential for chemotaxis and colonization of the gastric mucosa. Infect Immun 68 : 2016–2023.
19. LowenthalAC, SimonC, FairAS, MehmoodK, TerryK, et al. (2009) A fixed-time diffusion analysis method determines that the three cheV genes of Helicobacter pylori differentially affect motility. Microbiology 155 : 1181–1191.
20. SandersL, AndermannTM, OttemannKM (2013) A supplemented soft agar chemotaxis assay demonstrates the Helicobacter pylori chemotactic response to zinc and nickel. Microbiology 159 : 46–57.
21. HowittMR, LeeJY, LertsethtakarnP, VogelmannR, JoubertLM, et al. (2011) ChePep controls Helicobacter pylori Infection of the gastric glands and chemotaxis in the Epsilonproteobacteria. MBio 2: e00098–11.
22. BehrensW, SchweinitzerT, BalJ, DorschM, BleichA, et al. (2013) Role of energy sensor TlpD of Helicobacter pylori in gerbil colonization and genome analyses after adaptation in the gerbil. Infect Immun 81 : 3534–3551.
23. TerryK, GoAC, OttemannKM (2006) Proteomic mapping of a suppressor of non-chemotactic cheW mutants reveals that Helicobacter pylori contains a new chemotaxis protein. Mol Microbiol 61 : 871–882.
24. OkabeS, AmagaseK (2005) An overview of acetic acid ulcer models–the history and state of the art of peptic ulcer research. Biol Pharm Bull 28 : 1321–1341.
25. SmithSI, OyedejiKS, ArigbabuAO, CantetF, MegraudF, et al. (2004) Comparison of three PCR methods for detection of Helicobacter pylori DNA and detection of cagA gene in gastric biopsy specimens. World J Gastroenterol 10 : 1958–1960.
26. LertpiriyapongK, WharyMT, MuthupalaniS, LofgrenJL, GamazonER, et al. (2014) Gastric colonisation with a restricted commensal microbiota replicates the promotion of neoplastic lesions by diverse intestinal microbiota in the Helicobacter pylori INS-GAS mouse model of gastric carcinogenesis. Gut 63 : 54–63.
27. RoligAS, ShanksJ, CarterJE, OttemannKM (2012) Helicobacter pylori requires TlpD-driven chemotaxis to proliferate in the antrum. Infect Immun 80 : 3713–3720.
28. AiharaE, HentzCL, KormanAM, PerryNP, PrasadV, et al. (2013) In vivo epithelial wound repair requires mobilization of endogenous intracellular and extracellular calcium. J Biol Chem 288 : 33585–33597.
29. RoligAS, CarterJE, OttemannKM (2011) Bacterial chemotaxis modulates host cell apoptosis to establish a T-helper cell, type 17 (Th17)-dominant immune response in Helicobacter pylori infection. Proc Natl Acad Sci U S A 108 : 19749–19754.
30. KetoY, EbataM, TomitaK, OkabeS (2002) Influence of Helicobacter pylori infection on healing and relapse of acetic acid ulcers in Mongolian gerbils. Dig Dis Sci 47 : 837–849.
31. KonturekPC, BrzozowskiT, KonturekSJ, StachuraJ, KarczewskaE, et al. (1999) Mouse model of Helicobacter pylori infection: studies of gastric function and ulcer healing. Aliment Pharmacol Ther 13 : 333–346.
32. WatanabeT, HiguchiK, HamaguchiM, TanigawaT, WadaR, et al. (2002) Rebamipide prevents delay of acetic acid-induced gastric ulcer healing caused by Helicobacter pylori infection in Mongolian gerbils. Dig Dis Sci 47 : 1582–1589.
33. BlomH (1985) The structure of normal and regenerating rat oxyntic mucosa. Scand J Gastroenterol Suppl 110 : 73–80.
34. XiaoC, FengR, EngevikAC, MartinJR, TritschlerJA, et al. (2013) Sonic Hedgehog contributes to gastric mucosal restitution after injury. Lab Invest 93 : 96–111.
35. ClyneM, DillonP, DalyS, O'KennedyR, MayFE, et al. (2004) Helicobacter pylori interacts with the human single-domain trefoil protein TFF1. Proc Natl Acad Sci U S A 101 : 7409–7414.
36. SchreiberS, StubenM, JosenhansC, ScheidP, SuerbaumS (1999) In vivo distribution of Helicobacter felis in the gastric mucus of the mouse: experimental method and results. Infect Immun 67 : 5151–5156.
37. Azevedo-VethackeM, GartenD, GrollC, SchreiberS (2009) Specific therapeutic schemes of omeprazole affect the orientation of Helicobacter pylori. Antimicrob Agents Chemother 53 : 3511–3514.
38. PentecostM, OttoG, TheriotJA, AmievaMR (2006) Listeria monocytogenes invades the epithelial junctions at sites of cell extrusion. PLoS Pathog 2: e3.
39. TanS, TompkinsLS, AmievaMR (2009) Helicobacter pylori usurps cell polarity to turn the cell surface into a replicative niche. PLoS Pathog 5: e1000407.
40. ButlerSM, CamilliA (2005) Going against the grain: chemotaxis and infection in Vibrio cholerae. Nat Rev Microbiol 3 : 611–620.
41. EngevikAC, FengR, YangL, ZavrosY (2013) The acid-secreting parietal cell as an endocrine source of Sonic Hedgehog during gastric repair. Endocrinology 154 : 4627–4639.
42. DemitrackES, AiharaE, KennyS, VarroA, MontroseMH (2012) Inhibitors of acid secretion can benefit gastric wound repair independent of luminal pH effects on the site of damage. Gut 61 : 804–811.
43. EngevikMA, AiharaE, MontroseMH, ShullGE, HassettDJ, et al. (2013) Loss of NHE3 alters gut microbiota composition and influences Bacteroides thetaiotaomicron growth. Am J Physiol Gastrointest Liver Physiol 305: G697–711.
44. ColladoMC, DonatE, Ribes-KoninckxC, CalabuigM, SanzY (2009) Specific duodenal and faecal bacterial groups associated with paediatric coeliac disease. J Clin Pathol 62 : 264–269.
Štítky
Hygiena a epidemiologie Infekční lékařství LaboratořČlánek vyšel v časopise
PLOS Pathogens
2014 Číslo 7
- Parazitičtí červi v terapii Crohnovy choroby a dalších zánětlivých autoimunitních onemocnění
- Vakcíny proti klíšťové encefalitidě
- Kdy je nejlepší očkovat
- Možné vedlejší účinky očkování
- Imunogenita vakcín
Nejčtenější v tomto čísle
- Molecular and Cellular Mechanisms of KSHV Oncogenesis of Kaposi's Sarcoma Associated with HIV/AIDS
- Holobiont–Holobiont Interactions: Redefining Host–Parasite Interactions
- BCKDH: The Missing Link in Apicomplexan Mitochondrial Metabolism Is Required for Full Virulence of and
- Helminth Infections, Type-2 Immune Response, and Metabolic Syndrome
Zvyšte si kvalifikaci online z pohodlí domova
Mazová zátka a její řešení
nový kurzVšechny kurzy