
A Repetitive DNA Element Regulates Expression of the Sialic Acid Binding Adhesin by a Rheostat-like Mechanism
During persistent H. pylori infection, the local gastric milieu is constantly altered by host responses and inflammation fluxes. As adhesion is crucial to maintain infection, appropriate adaptation of bacterial adherence properties is required to meet these environmental fluctuations. H. pylori uses the SabA protein to bind glycan receptors present on inflamed stomach mucosa. SabA expression can be turned on or off via known genetic mechanisms; however, how fine-tuning of SabA expression occurs to match changes in receptor levels is still unknown. The H. pylori genome encodes few trans-acting regulators but has numerous simple sequence repeats (SSR), i.e. hypermutable DNA segments. Here, we have deciphered a mechanism where a T-repeat tract, located in the sabA promoter region, affects SabA expression. The mechanism involves structural alterations of the promoter DNA that affects interaction of the RNA polymerase, without input from known trans-acting regulators. This mechanism is likely not unique for SabA or to H. pylori, but also applicable to other pathogens with high abundance of SSRs and limited set of transcription factors. Our findings contribute to understanding of the important bacterial-host interplay, and to mechanisms that generate heterogeneous populations of best-fit clones, i.e. stochastic switching.
Published in the journal:
. PLoS Pathog 10(7): e32767. doi:10.1371/journal.ppat.1004234
Category:
Research Article
doi:
https://doi.org/10.1371/journal.ppat.1004234
Summary
During persistent H. pylori infection, the local gastric milieu is constantly altered by host responses and inflammation fluxes. As adhesion is crucial to maintain infection, appropriate adaptation of bacterial adherence properties is required to meet these environmental fluctuations. H. pylori uses the SabA protein to bind glycan receptors present on inflamed stomach mucosa. SabA expression can be turned on or off via known genetic mechanisms; however, how fine-tuning of SabA expression occurs to match changes in receptor levels is still unknown. The H. pylori genome encodes few trans-acting regulators but has numerous simple sequence repeats (SSR), i.e. hypermutable DNA segments. Here, we have deciphered a mechanism where a T-repeat tract, located in the sabA promoter region, affects SabA expression. The mechanism involves structural alterations of the promoter DNA that affects interaction of the RNA polymerase, without input from known trans-acting regulators. This mechanism is likely not unique for SabA or to H. pylori, but also applicable to other pathogens with high abundance of SSRs and limited set of transcription factors. Our findings contribute to understanding of the important bacterial-host interplay, and to mechanisms that generate heterogeneous populations of best-fit clones, i.e. stochastic switching.
Introduction
A key factor for bacterial pathogens to establish and maintain a persistent infection is the adaptation to host responses and to microenvironmental alterations that occur during pathogenesis. Both stochastic and regulated processes can affect gene expression, and contribute to population heterogeneity. From the plethora of clones, best-fit phenotypes arise to match the current environmental demands. Population heterogeneity can be achieved by epigenetic events, such as DNA methylations; or strictly genetic mechanisms, such as reversible phase variation e.g. homologous recombination or slipped strand mispairing (SSM) of simple sequence repeats (SSRs) [1], [2]. SSRs create so-called contingency loci, i.e. hypermutable DNA that mediates stochastic genotypic switching, and these regions are often evolutionary conserved [3], [4]. The role of SSM in regulation of mRNA levels and protein expression is determined by the genetic location of the SSR. Intragenic SSRs cause biphasic translational control and turn protein expression on or off, while intergenic SSRs, may result in altered mRNA levels by different mechanisms [5], [6].
Helicobacter pylori infects the human stomach and if left untreated causes chronic gastritis that potentially leads to peptic ulcer disease and gastric cancer [7]–[9]. Adhesion is a prerequisite to establish persistent infection. The two dominating carbohydrates targeted by H. pylori in the gastric mucosa are the ABO/Leb blood group and the sialyl Lewis x/a (sLex/sLea) antigens [10]–[14]. In healthy mucosa the ABO/Leb antigens predominate, whereas the sLex/sLea antigens dominate the inflamed mucosa. H. pylori binds the ABO/Leb-receptors via the blood group antigen binding adhesin BabA, and the sLex/sLea-receptors via the sialic acid binding adhesin SabA. Since the human stomach glycosylation pattern constantly changes, H. pylori needs to adapt its adherence properties accordingly. Expression can efficiently be switched on or off via homologous recombination, or via SSM events [13], [15]–[18]. The protein expression of the BabA and SabA adhesins also varies between strains [15], [16], [19], [20].
Detailed studies of adhesin expression regulation in H. pylori are scarce. In other eubacteria, RNA polymerase sigma (σ) factors and transcriptional regulators control gene expression at the mRNA level. These likely play a diminished role in H. pylori, as only three σ-factors (σ80, σ54 and σ28) and few classical trans-acting regulators are present [21]–[23]. Thus, fine-tuning of mRNA levels in H. pylori likely involve alternative processes. H. pylori, like other bacteria with small genomes, has a high content of SSRs, primarily in genes encoding outer membrane proteins e.g. alpA, alpB, babA, babB, sabA and sabB [24]–[26]. In H. pylori, the impact of SSRs is probably further accentuated by the lack of mismatch repair systems and proof reading deficiency of the DNA polymerase I [27], [28]. In this context, SSM can rapidly create a large pool of heterogeneous clones and not surprisingly, H. pylori has an extremely high intraspecies genetic variability [29]–[32].
A cytosine-thymine dinucleotide (CT) repeat tract in the 5′-end of the sabA coding sequence (CDS) causes translational frameshifts and on/off phase variation [13], [15]. Additionally, a thymine (T) nucleotide repeat tract is found adjacent to the sabA −35 promoter element. The length of this T-tract varies between strains and such length variations have been suggested to influence sabA expression [33], [34]; however, the functional mechanism of how the T-tract regulates transcription remains to be elucidated. In this paper, we present data illustrating that the T-tract length, in clones isolated post-infection from different local gastric environments, is variable in vivo. We also demonstrate that the T-tract length controls sabA transcription initiation, and thus SabA expression and functional sLex-receptor binding to gastric mucosa, in a multiphasic manner by affecting binding of the RNA polymerase. We describe in molecular terms how the T-tract length influences the local DNA structure, by changing the axial alignment between the core promoter and UP-like elements, thereby affecting interaction of the RNA polymerase α-subunits to the sabA promoter. In addition, we provide evidence that a similar mechanism controls multiple loci in H. pylori. Therefore, we propose a generally applicable model in which T - or A-tracts located adjacent to −35 promoter elements act by a rheostat-like mechanism, to control transcription initiation in H. pylori.
Results and Discussion
The T-tract fine-tunes sabA expression and consequently binding to the sialyl Lewis x receptor
It was previously shown that expression of SabA varies among different clinical isolates and that expression levels match the binding activity to the cognate sialyl Lewis x (sLex) receptor [15], [19], [20], [35]. In this study, we set out to scrutinize determinants that cause these differences. A set of five H. pylori strains, representing numerous geographical origins and isolated from patients with different disease symptoms (described in Table 1), were chosen for the analysis. SMI109 (Sweden, GC), J99 (USA, DU), G27 (Italy, GA), 17875/sLex (Australia, GA) and 26695 (UK, GA) were assayed for SabA protein expression by immune-detection, and for receptor binding activity by RadioImmunoAssay (RIA) using 125I-sLex-receptor conjugates. As expected strain 26695, with a predicted frameshift in the sabA CT-tract, did not express any SabA protein nor could it bind to sLex-receptor conjugates (Fig. 1A and 1C). Strains SMI109 and 17875/sLex displayed highest SabA expression and accordingly cognate sLex-receptor binding activity, whereas strains J99 and G27 displayed intermediate levels of both (Fig. 1A). These results confirmed the significant variation of SabA expression between strains and the link between protein expression and receptor binding activity.


To establish if mRNA levels were related to the SabA protein expression, we analyzed sabA mRNA levels with RT-qPCR in the corresponding H. pylori strains. A clear correlation was observed (Fig. 1B). We also generated transcriptional lacZ reporter fusions of the sabA promoter (PsabA) from the different strains (Fig. S1A) and found transcriptional initiation to vary when measuring promoter activity by β-galactosidase assay in E. coli (Fig. S1B). However, the promoter activities did not correlate with the mRNA levels or SabA protein expression found in the different H. pylori strains. For example, activity of the PsabA from strain 26695 was comparatively high, considering that this strain did not express any detectable cognate sabA mRNA (compare Fig. 1B and S1B). This is likely explained by the correlation between transcriptional and translational processes in H. pylori recently shown [36] and illustrates that downstream effectors, like mRNA stability or H. pylori specific factors, are essential for absolute mRNA levels. Further, this emphasizes the importance of studying expression in an isogenic strain background.
Sequencing of the PsabA region from the different strains revealed scarce nucleotide variations scattered across the promoter. Some exchanges in the −10 and −35 promoter elements were observed, as well as length variations in the T-tract located adjacent to the −35 element (Fig. 1C). sabA from strain G27 shows a nearly perfect extended −10 promoter element (TGnTAAAAT vs TGnTATAAT in E. coli), which explains the high promoter activity observed with lacZ fusions in E. coli for this promoter (Fig. S1B). Analysis of a larger set of PsabA sequences revealed unusual high homology, except for a major discrepancy in the length of the T-tract (Fig. S2). If the T-tract could play a role in regulating sabA expression, we reasoned that the T-tract length might vary extensively between H. pylori strains to match the present sLex-receptor availability in each infected individual. Therefore, we compared the T-tract length of forty-nine published H. pylori genome sequences and sequenced the PsabA of twelve additional strains. In total, we found fifty-one strains to encode a sabA gene. As assumed, there was a wide distribution of T-tract lengths, ranging from T5 to T22, where T13 to T17 being the most common variants (Fig. 1D and Table S1). In a collection of 115 clinical Taiwanese isolates, Kao et al [34] showed that the T-tract length varied from T10 to T28, with the most common variants being T14 to T19. In further support of the idea for individual selection, we could not find any obvious geographic correlations of T-tract lengths, as exemplified by the extensive T-tract variation (T5 to T16) in the different Peruvian strains analyzed (Cuz20, PeCan4, PeCan18, Puno120, Puno135, Sat464, Shi112, Shi169, Shi417, Shi470, SJM180; Table S1).
Since a number of factors affect transcription, at different regulatory levels, we generated transcriptional PsabA::lacZ reporter fusions to determine if the T-tract length could impact transcription initiation in a given strain. The PsabA::lacZ fusions were based on the PsabA of the SabA high-expressing strain SMI109, but with varying T-tract lengths comparable to the T-length distribution described in the preceding section (Fig. 1D, T1 to T21). The β-galactosidase assays were performed in E. coli. First, we used 5′ rapid amplification of cDNA ends (5′-RACE) and determined the transcriptional start site of sabA in SMI109 to be located at a cytosine, 66 nt upstream of ATG, the same transcriptional start site as previously published for J99 [34]. We also verified that an identical transcriptional start site was used in E. coli as in H. pylori by primer extension analysis (data not shown). The β-galactosidase assays revealed that the promoter activity of the PsabA::lacZ fusions with varying T-tract length was gradually multiphasic: high in T5, low in T9, intermediate in the T13 (wt) and high in T18 (Fig. S1C).
These results suggested that the T-tract length affects promoter activity. To further analyze this in H. pylori, we decided to explore the role of the T-tract in otherwise isogenic variants of strain SMI109, with PsabA T-tracts spanning from T1 to T21, the same set of T-variants that were analyzed in E. coli. Such variants were obtained by exchanging the PsabA region in SMI109 using a method involving contraselection in combination with in vitro mutagenesis (see Materials and Methods). First, SabA protein expression and sLex-receptor binding activity were analyzed in these variants. This revealed an even more pronounced multiphasic appearance than in E. coli, although in H. pylori the T13 variant exhibited high and the T18 variant intermediate protein expression and sLex-receptor binding activity (Fig. 2A–B). We also determined the sabA mRNA levels in the T-tract variants T5 to T18 with RT-qPCR (Fig. 2C). The mRNA level was likewise gradually multiphasic and closely correlated to the protein expression and receptor activity (Fig. 2). Interestingly, the max/min protein and mRNA levels were observed with T-tract length intervals of approximately ten base pairs, the same distance as one turn of the DNA helix.

To mimic H. pylori adhesion during in vivo conditions and the presentation of the sLex-receptor on epithelial cells, we analyzed SabA-mediated adhesion to human gastric tissue sections. Gastric tissue sections were probed with fluorescently labeled H. pylori of varying T-tract lengths, which displayed different sLex binding activity. The SabA high-expressing T13 variant clearly exhibited more binding to the tissue sections than the low-expressing T9 and intermediate-expressing T18 variants (Fig. 2D). In contrast, neuraminidase-treated mucosa, where the sialic acid moieties had been removed, showed only background binding (data not shown). Likewise, a ΔsabA mutant derivative of SMI109 exhibited no binding to the tissue sections (Fig. 2D). Thus, our results demonstrate that variations in the T-tract length, in otherwise isogenic strains, affect PsabA activity. This induces multiphasic alterations of sabA mRNA levels and thereby SabA protein expression levels which adjust the sLex-receptor binding activity and binding to human gastric mucosa.
Variations in T-tract length during infection
At the H. pylori infection site, a local inflammation develops as a result of the host cell responses and release of effector molecules. Earlier experimental H. pylori infections in Rhesus monkeys showed variable reciprocal changes of both fucosylated ABO/Leb and sialylated sLex/a receptor expression during infection [14], [37], [38]. These alterations need to be accompanied by changes of BabA and SabA adhesin expression to maintain infection. Consequently, there is a delicate balance to cycle between non-adherent and adherent states, and to adjust expression levels at the adherent state. We have previously shown that Mongolian gerbils infected with H. pylori strains, expressing different levels of BabA adhesin, display alterations in the infection load and host cell responses, as well as phenotype modifications of the infected strain [39]. This scenario likely mirrors the host-pathogen interplay and post-experimental output clones are thus the result of a host-biopanning procedure that selects for clones with best-fit phenotype, i.e. stochastic switching.
Since our results suggest that the T-tract length ultimately controls sLex-receptor binding activity, selection for certain T-tract variants likely occurs as SabA expression is optimized to the receptor availability in a respective host. As outlined in the preceding section, we propose that the T-tract length is variable over time and under different selection conditions. To study T-tract length variations, and the corresponding functional alteration in sLex-receptor binding over time, we subjected strain SMI109 to a series of in vitro passages for three months. sLex-receptor binding post-passages revealed sub-populations that displayed lower sLex-receptor binding activity (sLex-low) relative to the other sub-populations (sLex-high, data not shown). Single clones were isolated from both sub-populations, and the cognate PsabA regions were sequenced. This analysis revealed that the sLex-high clones had a T13 tract (wt), while the sLex-low clones had T12 tract in the PsabA region (Fig. S3A). A similar experiment was also performed with strain J99 and comparable results were observed. Here the sLex-high clones had a T18 tract (wt), while the sLex-low clones had T19 tract in the PsabA region (Fig. S3B).
Next, we used a mouse-adapted sLex-negative clone of strain J99StrR (sabA T17 and CT8-off) to infect five Lewis b (Leb) transgenic FVB/N mice, since we did not succeed to infect mice with strain SMI109 [40]. After two months, the mice were terminated and the output bacteria (pools) were scored for recovery of sLex-receptor binding activity. Bacterial pools from three out of five mice had changed their adherence phenotype and were now positive for sLex-receptor binding (Fig. 3A, bar diagram). Sequencing of output pools often generates mixed peaks, likely due to population heterogeneity and loss of signal after repetitive DNA tracts. Therefore, to estimate changes in T - and CT-tract lengths, we used fragment length analysis (FLA) to discriminate length variations of PCR-amplicons, down to one nucleotide. Since FLA of repetitive DNA gives rise to additional “stutter” peaks [41], we obtained reference spectra of genomic DNA isolated from the otherwise isogenic T18 or T19 variants of SMI109, and correlated our results to these (Fig. S4). To confirm that changes in the CT-tract length caused the alterations in on/off sLex-receptor binding appearance of the output pools, we ran FLA with primers including part of the sabA coding sequence (CDS). This was exemplified by using genomic DNA isolated from one sLex-negative output pool (mouse 2) and one sLex-positive output pool (mouse 4), and also the sLex-negative input strain as reference. As expected, our analysis revealed two nucleotides shorter PCR-amplicons from output pools of mouse 4, corresponding to a change in the CT-tract length from eight to seven repeats, thereby placing translation in the right open reading frame. The PCR-amplicons of output pools of mouse 2 displayed the same length as the input strain (data not shown).

In order to only analyze changes in the T-tract length, we ran FLA with primers excluding the CT-tract. The results showed that bacterial pools from mouse 3 and 5 had a left-shifted curve pattern indicative of a larger subpopulation with one nucleotide shorter T-tract, which contrasts the unchanged curve pattern in pools from mouse 1, 2 and 4 (Fig. 3A, bottom curves). However, to determine if the FLA was limited in detecting smaller population changes in T - and CT-tract length, we next analyzed ten random clones from two distinctly different output pools not shifted in the FLA and with the lowest and highest CFU counts: the sLex-negative pool from mouse 2 and the sLex-positive pool from mouse 4 (Fig. 3A). First we determined the frequency of sLex-receptor binding in each population and as expected, all clones from mouse 4 showed binding (10/10 clones) while only 3/10 clones from mouse 2 showed sLex-receptor binding (Fig. 3B). The 5′ region of the sabA locus, in four representative clones from each bacterial pool, was sequenced and revealed that all sLex-negative clones were CT8-off, and all sLex-positive clones were CT7-On (Fig. 3B). Furthermore, among the sLex-positive clones, different binding activities were observed. The clones with highest sLex-receptor binding activity (4–5 and 4–10) had T16-tract in their PsabA region, in contrast to the other clones, which had T17 (Fig. 3B). FLA-spectra obtained for these clones corroborated the sequencing results (data not shown). Hence we concluded that although FLA gives a view of general population shifts in nucleotide repeat tract length, it is limited in detecting more discrete shifts as was seen in output pools from mouse 2 and 4. Overall, our results confirm the in vitro data obtained from SMI109 and J99, illustrating that small changes in T-tract length have major impact on sLex-receptor binding activity (Fig. 2B and Fig. S3).
To further investigate T-tract length alterations in vivo, we analyzed H. pylori output pools isolated from both antrum and corpus regions of the stomach, from three Swedish patients (here called: 101, 1026 and 1106). These bacterial pools were first analyzed for sLex-receptor binding activity. Bacterial pools from patient 101 showed high sLex-receptor binding, whereas lower binding was observed for the antrum-pools from patients 1026 and 1106. The sLex-receptor binding of the corpus-pools from patients 1026 and 1106 was barely detectable (Fig. 3C, bar diagram). We also isolated genomic DNA to obtain FLA-spectra of the 5′ region of the sabA locus from each pool (Fig. 3C, right curves). This revealed distinct curve patterns, in the bacterial pools from each stomach region and from each patient, respectively. FLA analysis of PsabA region alone, using primers excluding the CT-tract, showed similar results (data not shown). To confirm that the observed FLA alterations were a consequence of T-tract length variations, genomic DNA was isolated from two clones of each output pool, and the 5′-end of sabA locus was sequenced. The result showed similar T-tract length variations as detected by the FLA (Fig. 3C). Although it was not possible to make quantitative measurements using FLA technique (Fig. S4), it is a powerful tool to estimate variations in repeat tract lengths in heterogeneous populations.
Our data support the idea of individual selection since analysis of output clones, from infected mice as well as from distinct regions of the human stomach, revealed populations of heterogeneous sLex-receptor binding phenotypes and different T-tract lengths, which changed along the course of infection (Fig. 3). Interestingly, in one stomach we found a sLex-negative population (CT-off) that displayed a higher degree of T-tract length heterogeneity (Fig. 3C, sample 1026C). This suggests that without SabA-mediated adhesion, and corresponding host cell responses, there is no selection pressure directed against clones with certain SabA-expressing phenotypes and thus, all T-tract variants generated by SSM are preserved. It has been suggested that SSM frequencies could be affected by environmental stresses [6], however, how these signals are transduced to modulate switching rates are still unclear.
The T-tract modifies RNA polymerase binding efficiency to the sabA promoter
SSRs located in intergenic regions have been reported to affect transcription by different mechanisms. SSRs positioned between the −10 and −35 promoter elements affect the docking of the RNAP sigma factor [42]–[45]. SSRs positioned upstream of the −35 element have been reported to affect binding of trans-acting factors and interaction with the RNAP [46]–[48]. SSRs located downstream of transcriptional start sites affect mRNA stability or binding of regulatory proteins [49], [50]. A recent study of a SSR in H. pylori shows that expression of the chemotaxis receptor tlpB is affected by a variable G-tract located downstream of the −10 element, via small RNA-mediated posttranscriptional regulation [51]. Depending of the length of the G-tract and interaction with the sRNA, expression of TlpB is either increased or decreased. Having ascertained that the length of our described T-tract affects sabA mRNA levels, we hypothesized that changes in RNA polymerase (RNAP) interaction with the PsabA DNA could underlie the observed variations in mRNA levels, since the T-tract is positioned adjacent to the −35 element.
The core promoter of PsabA (SMI109, TGGAAT-16 bp-TAAAAT) in strain SMI109 is similar to that of the E. coli housekeeping σ70 consensus binding site (TTGACA-17+/−1 bp-TATAAT), and highly homologous between different H. pylori strains (Fig. 1C and Fig. S2). No functional RNAP holoenzyme has yet been purified from H. pylori, however, the E. coli σ70-RNAP can bind and transcribe H. pylori promoters [52], [53]. Therefore, we tested binding of the E. coli σ70-RNAP to PsabA DNA fragments, using electrophoretic mobility shift assay (EMSA), and found it to interact strongly (Fig. S5, picture). No interaction was observed to sabA CDS DNA or when only the core RNAP was used (data not shown). When we analyzed σ70-RNAP binding to PsabA with varying T-tract lengths by EMSA, we could not detect differences in the amount of shifted DNA as the T-tract length was varied (Fig. S5, bar diagram). We instead decided to use high-resolution surface plasmon resonance (SPR) to obtain sensorgrams of σ70-RNAP binding to immobilized PsabA fragments with various T-tract lengths (T5, T9, T13, and T18). Now, we could clearly distinguish variations in binding strength to the PsabA fragments (Fig. 4A). As a control, the EMSA-inactive DNA fragment of sabA CDS showed no specific binding in the SPR analysis and was subtracted from each of the sensorgrams in Fig. 4. The results showed that σ70-RNAP displayed weakest binding to T9, but stronger binding to both T5 and T18, as compared to T13 (wt). The relative binding was comparable to the promoter activity of the various PsabA fragments, as measured by β-galactosidase assays using transcriptional fusions in E. coli (Fig. 4A inlay and Fig. S1C).

In order to investigate if the T-tract acts as a spacer, i.e. changing the distance and position of a binding site, we started by replacing the PsabA nucleotide content of the T-tract, without changing the length. The wt T13-tract was exchanged to A13 or C13 in the corresponding PsabA::lacZ fusion plasmids. Measurements of the promoter activities in E. coli showed that the PsabA activity, in both A13 and C13, increased relative the T13 variant (Fig. 4B, inlay). SPR analysis revealed higher binding of σ70-RNAP to the A13 then to the T13 variant, comparable to the PsabA activity (Fig. 4B). Conversely, for the C13 variant, the binding of σ70-RNAP was similar to that of the T13 variant. We also created isogenic A - and C-tract variants in strain SMI109 and found that replacement of T's to A's indeed gave higher SabA expression and sLex-receptor binding, whereas substitution of T's to C's gave slightly lower SabA expression, matching the SPR results (Fig. 4B–C). These results excluded that the T-tract merely acts as a spacer, as there were still variations in SabA expression levels, though the tract length was kept constant.
Thus, our results suggest that the T-tract modulates sabA transcription by changing the efficiency of RNAP binding. Nevertheless, sabA expression in H. pylori and in vitro RNAP binding did not exactly match. This could possibly be explained by alternative display of the RNAP binding site, caused by different organization of genomic DNA in vivo versus the shorter DNA fragments used in the in vitro SPR-analyses, or conceivably by additional unknown factors that impact sabA transcription in H. pylori. Another contributing factor could be the structural differences in the RNAP subunits between E. coli and H. pylori. The β - and β′-subunits have 45% identity to E. coli counterparts (RpoB and RpoC) but are expressed as a fused polypeptide in H. pylori [54]. This has been implied to facilitate the assembly of the holoenzyme [55] and to give a selective advantage for H. pylori fitness in the acidic human stomach [56]. The housekeeping sigma factor (σ80) from H. pylori has 32% identity to E. coli σ70. The most divergent region is the N-terminal part of the protein (region 1.1) involved in formation of transcription initiating complex and the spacer region [52], [53]. In spite of these differences, the E. coli RNAP can bind and transcribe H. pylori promoters both in vivo and in vitro, but not the other way around [52], [53].
The T-tract modulates the RNAP α-subunits interaction to PsabA
Besides docking of the σ-factor to the core promoter (−35/−10 elements), RNAP binding can also include interaction of the C-terminal domain of the α subunits (αCTDs) to UP-elements located upstream of the core promoter [57]–[59]. To elucidate if the T-tract affects RNAP binding by influencing σ-factor or αCTDs binding, we obtained DNase I footprints of σ70-RNAP and PsabA DNA fragments with different repeat tract length and composition (T9, T13, T18, A13 and C13). The results showed strong binding to the core promoter (−35 to +20) with all variants, and no direct interaction to the T-, A - or C-repeat tracts (Fig. 5B, data not shown). Previous studies show that UP-elements positioned close to the −35 element have a larger impact on αCTDs binding than UP-elements located further upstream. UP-elements positioned upstream of −60 have not been shown to influence transcription of promoters in E. coli [59]. Interestingly, we could observe a clear DNase I protected region, positioned at −95 to −50, upstream of the repetitive tract (Fig. 5B–C, blue line) in some of the variants: T13, A13 and C13.

As the RNAP αCTDs often interact with AT-rich DNA sequences, we scrutinized the PsabA nucleotide content and it showed more than 74% A/T-residues. This can be compared to 61% A/T-content in the whole genome of H. pylori strains. Dissecting the PsabA region revealed two regions, upstream of the T-tract, with three to four short repetitive A-boxes in each region (Fig. 5A and S2, red boxes). This suggested that the RNAP αCTDs might interact to more than one site. Corroborating this, we could clearly observe an additional protected region in the A13 variant, located further upstream of the proximal region, positioned approximately at position −130 to −105 (Fig. 5C, green line). The footprint analysis revealed that several of these A-boxes were located within the DNase I protected regions observed in Fig. 5B–C. Two of A-boxes were perfectly phased, i.e. spaced by 10 bp, similar to an E. coli UP-element (NNAAAWWTWTTTTNNAAANNN). However, the regions containing the A-boxes are located further away from the core promoter and did not display complete sequence consensus to an UP-element. Therefore, we considered the regions containing the A-boxes in PsabA to be UP-like elements (Fig, 5A and S2, blue and green lines).
Based on these findings, we generated PsabA DNA fragments lacking the proximal UP-like element (Δ46 between −97 to −49), effectively positioning the distal UP-like element closer to the T-tract and the core promoter (Fig. 5A, green line). We speculated that the tract length/composition would optimize the RNAP αCTDs binding to the distal UP-like element differently in the Δ46 fragments, relative to the full-length fragments. As hypothesized, DNase I footprint analysis of the PsabA Δ46 fragments showed a stronger and more distinct protected region upstream of the repetitive tract as compared to the wt fragments, respectively (Fig. S6A). This was the case in all variants except for the Δ46T9 fragment. This further demonstrates the RNAP αCTDs capability to also interact with the more distal region. We also assayed the σ70-RNAP binding in an additional SPR-system where the same series of PsabA Δ46 fragments as above, were analyzed simultaneously as their respective wt fragments. We found that the σ70-RNAP bound stronger to the PsabA Δ46T9 DNA when the proximal UP-like element was removed, although we could not detect any interaction with the UP-like element (compare Fig. 5D and S6A). We also observed that RNAP bound slightly stronger to PsabA Δ46T18, corroborating the footprint results (Fig. 5D and S6A). Furthermore, the RNAP bound weaker to PsabA Δ46T13 and PsabA Δ46A13 (Fig. 5D), respectively, although we still could observe an interaction between RNAP to distal UP-like element. Next we analyzed promoter activity of these fragments lacking the proximal UP-like element as transcriptional lacZ fusions in E. coli and found that the expression patterns to large extent match the SPR results (Fig. 5E). We observed increased promoter activity from PsabA Δ46T9 and PsabA Δ46T18 variants, following the increased binding of RNAP, and we also found a concomitant decrease of PsabA Δ46A13 promoter activity. If the binding of the RNAP αCTDs were restricted to the proximal UP-like element, just upstream of the core promoter, the sensorgrams and promoter activities of all deletion fragments should have converged to identical ones, due to the interaction of σ70-subunit alone. Instead, the Δ46 fragments, with varying tract length/composition, still displayed different RNAP binding efficiencies and promoter activities, suggesting that the RNAP can bind to additional regions upstream of T-tract, corroborating the footprint results.
To confirm interaction of RNAP with the UP-like elements we scrambled the A-boxes by exchanging every second A in the A-box with a C or a G (see Materials and Methods for details). Promoter activity of PsabA DNA with scrambled UP-like elements (A-boxes) was analyzed as transcriptional lacZ fusions in E. coli. First, the four A-boxes in proximal UP-like element (Fig. 5A, blue line) or the three A-boxes in the distal UP-like element (Fig. 5A, green line) were scrambled separately. The results showed a clear effect on promoter activity, as expression from PsabA was increased in both variants by 2-fold (Fig. 5F). Concurrently, when both UP-like elements were changed an even more pronounced up-regulation (3-fold) of PsabA activity was observed. Regulation of transcriptional output from a promoter is a complex multi-step process, involving binding of RNAP, separation of DNA strands, initiation of transcription and promoter escape. Ellinger et al showed that depending on a promoter's rate-limiting step in the pathway to productive transcription, A-tracts/UP-elements can either activate or inhibit promoter activity [60]. To determine at what step PsabA activity is limiting, extensive in vitro transcriptional studies are required.
Taken together, our results show that the two UP-like elements are important for PsabA activity and that the RNAP interacts directly with both regions upstream of the core promoter. The T-tract length modulates this interaction, by changing the affinity of the RNAP to the promoter, and thereby affecting PsabA activity. During transcription initiation the DNA is wrapped >300° around the RNAP [61] and although most of the effect of UP-like elements occurs via interaction with the αCTDs, we cannot exclude the possibility that some of the upstream sequences is also interacting with other surfaces on the RNAP.
The T-tract length influences local DNA structure
Short phased A-tracts act as major determinants of DNA curvature by forming intrinsically bent DNA and depending on the tract periodicity this alters the DNA structure to different conformations [62]–[64]. Our results suggest that the A-boxes in the UP-like elements upstream of the T-tract is important for PsabA activity, therefore we hypothesized that the effect on RNAP binding can be a result of changes in local DNA structure. We made in silico structure predictions of the PsabA DNA (−166 to +74) of different T-variants (T9, T13, T18 and A13), which supported this hypothesis by showing structural changes of the DNA in several orientations (Fig. 6A). This was further supported by PAGE separation of PsabA DNA fragments with varying tract length/composition where we observed altered migration patterns that can be explained by structural differences rather than by the small differences in size (Fig. 6B). The T9 and T18 variants have an apparent similar structure (Fig. 6A), although the sabA expression are slightly different, low vs. intermediate (Fig. 2). Possibly, the longer T-tract in T18 may give a more flexible DNA that allows for some contact between the RNAP αCTDs and the UP-like elements, as our SPR and footprint data from the wt and Δ46 PsabA DNA suggested (Fig. 5D and S6A). To further look into this, we made in silico structure predictions of PsabA DNA with sequential nucleotide extensions in T-tract length (T13 to T18). Evidently, a distinct 3D DNA structure was observed for each variant (Fig. 6C), since the DNA was converted both in the y and in the z orientation by each thymine addition (Fig. 6D). This is in line with the alterations in mRNA levels we detected in the H. pylori T-variants with one deleted (T12, 60%) or two added (T15, 75%) T's, as compared to the wt (T13, 100%, Fig. 2C). This illustrates the influence of small alterations in T-tract length on the final SabA expression and sLex binding activity in H. pylori. This is also visible in the heterogeneous populations isolated post-infection (Fig. 3).

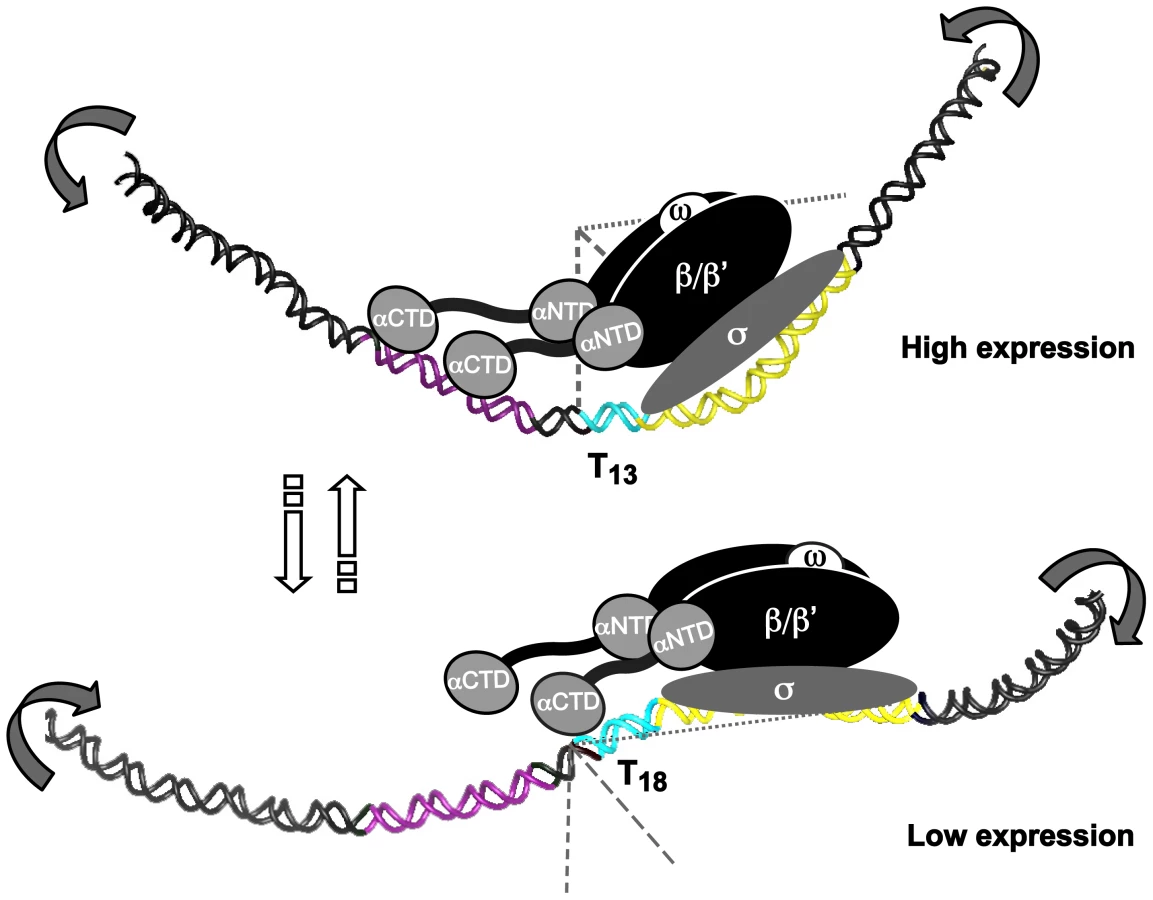
Some of the A-boxes, described in the preceding section, have a perfectly phased location (10–11 nucleotides in between) in the DNA helix (Fig. 5A and S2). We propose that the A-boxes are interaction sites for RNAP αCTDs and also contribute to the intrinsic DNA curvature in the promoter (Fig. 5–6). Such curvature has previously been shown to affect both binding of RNAP (formation of closed complex), melting of DNA strands (formation of open complex), release from promoters (promoter escape) and binding of trans-acting factors, which argues that upstream static DNA bends can influence promoter activity at several levels [65]. Structural predictions of PsabA fragments lacking the proximal UP-like element showed major structural alterations in PsabA DNA as compared to the wt fragments (Fig. S6B). This explains the SPR and promoter activity results where we observe a stronger interaction and increased promoter activity with low-expressing T9 and T18 variants as this region is missing (Fig. 5D–E). Probably, the A-boxes in the distal UP-like element is in a more favorably phasing in the Δ46T9 and Δ46T18, promoting DNA curvature and optimal contact to RNAP, than in the Δ46A13 variant (Fig. 5E and S6B). The overall effect on promoter activity observed in these variants is probably due to a combination of the changed RNAP binding and DNA structure. Structure predictions of the scrambled UP-like elements revealed that it is the A-box located between the T-tract and the proximal UP-like element that has most impact on DNA structure (Fig. S6C). This A-box is missing in the Δ46 fragments, probably resulting in observed changes in DNA structure (Fig. S6B) but was kept unchanged in our scrambled UP-like elements (Fig. S6C). In conclusion, our results suggest that the T-tract length drives the A-boxes into different phasing of the DNA, thereby altering the three-dimensional architecture of PsabA DNA. Furthermore, this changes the angular orientation between the core promoter and UP-like elements resulting in enhanced or decreased interaction of RNAP with DNA, giving the observed multiphasic expression pattern of SabA protein and sLex-receptor binding activity (Fig. 2).
The T-tract length affects PsabA activity without involvement of known DNA binding proteins
Not only AT-rich DNA is known to bend DNA, but also binding of nucleoid-associated proteins (NAPs). SSRs positioned upstream of −35 promoter elements frequently influence the binding of a trans-acting regulatory factor exemplified by; the TAAA tract of the nadA promoter in Neisseria meningitidis, affecting binding of integration host factor (IHF); the GAA tract of pMGA in Mycobacterium gallisepticum, affecting binding of a putative regulator HAP; and the A-tract of PatzDEF in Pseudomonas putida, affecting binding of AztR [48], [66], [67]. Typical for many of the classical trans-acting transcriptional regulators in other species, such as H-NS, cAMP receptor protein CRP, and LysR-type regulators, are their ability to interact with AT-rich DNA [68]–[70]. Though, there is no H-NS or IHF homolog present in H. pylori, two other NAPs have been described; the HU homolog Hup [71], [72] and the Dps homolog NapA [73], [74]. HU is one of the NAPs conserved in eubacteria.
In order to explore if these DNA binding proteins affect sabA expression, we constructed hup and napA mutants in strain SMI109 and analyzed changes in expression by RT-qPCR (mRNA levels), Western (protein expression) and RIA (receptor binding activity). However, we could not observe an effect on sabA expression, at any level, in either the hup or the napA mutant (Fig. S7B–C). We also analyzed sabA expression in hup mutants with various T-tract lengths, and again no effect was observed (Fig. S7D–E). We cannot yet exclude that no additional factors are involved in regulating sabA mRNA levels in combination with the T-tract. To our knowledge the only trans-acting factor that affects SabA expression is the acid responsive ArsRS system that represses SabA expression at acidic conditions [33]. How this repression operates in molecular terms and if the regulation occurs by direct interaction with PsabA, is not yet known. Nonetheless, our results show that the T-tract length located adjacent to the −35 element of the sabA promoter affects binding of the RNAP and thereby the transcriptional output, without involvement of any known DNA binding proteins.
The recurrent multiphasic SabA expression pattern observed in the T-variants supports the hypothesis that it is the structure of promoter DNA and RNAP interaction, rather than binding of a trans-acting factor, that is important for expression. The multiphasic pattern was much more pronounced in H. pylori (Fig. 2) than when promoter activity was analyzed in E. coli (Fig. S1C). Two of the T-variants, T18 and C13, displayed divergent expression levels in H. pylori as compared to the in vitro data (compare Fig. 2 and 4). Nonetheless, SPR analysis of σ70-RNAP binding and the promoter activities analyzed in E. coli show comparable results (Fig. 4A–B). It is therefore tempting to speculate that the dissimilarities could be due to structural differences of the E. coli and H. pylori RNAPs. Our results indicate that it is the interaction between α-subunit of the RNAP and the UP-like elements that is affected by the T-tract length, through change in DNA structure. Homology predictions has shown that the RNAP α - and ω-subunits are more divergent between different bacterial species than the remaining subunits [75] and thus, interaction of RNAP to DNA structures or DNA binding trans-acting factors might deviate from E. coli. Borin et al showed that the linker region between the αCTD and αNTD is longer in H. pylori compared to the E. coli α-subunit. The H. pylori αCTDs have an additional amphipathic helix in the C-terminal [76], which could explain why the highest expression in H. pylori is the T13 whereas it is T18 in E. coli. The H. pylori α-subunit should, due to these structural differences, be able to reach further upstream than the E. coli one, to make contact with the UP-like elements or potential trans-acting factors.
T - or A-tracts adjacent to −35 elements affect transcription in H. pylori
SSR motifs located between the −35 and −10 promoter elements affect docking of the RNAP σ-factor, motifs located upstream of the −35 element affect binding of regulatory factors [6], and as we show here for sabA, motifs located adjacent to the −35 element adjust transcription initiation by affecting local DNA structure. To dissect if this finding is a general phenomenon in H. pylori, we searched the genome of strain 26695 for additional genes with T - or A-tracts (>9 nucleotides) close to the −35 element. Among the predicted promoters of H. pylori [77], we found twenty-five genes with appropriately located T - or A-tracts (Table 2). Interestingly, loci encoding outer membrane proteins were again overrepresented among these genes (15 of 25 genes).

Among the twenty-five loci, nine had a T - or A-tract located between the −35 and −10 elements, two replaced the −35 element, six were located approximately 30, 31, 59, 68 and 86 nt upstream of −35 element, respectively, and two were located downstream of the transcriptional start site. Furthermore, five loci had T - or A-tracts located adjacent (<20 nt) to the −35 element, similar to that of sabA: sabB (HP_0722), hopD (HP_0025), hofA (HP_0209), hopM (HP_0227), and hp_0350 (Table 2). We compared the tract lengths of these five loci in the forty-nine publically available genome sequences (Table S1). Our comparison showed that all T - or A-tracts displayed great length variability, in line with the individual selection and stochastic switching hypotheses discussed in preceding sections (Fig. S8).
We also found four intergenic regions with predicted divergent transcriptional start sites, and T - or A-tracts located in between their respective promoters (Table 2). The adjacent genes, hp_0350 (unknown) and pyrG (CTP synthase), have an A-tract located just three nucleotides upstream of the −35 element of hp_0350, and a T-tract positioned 30 nucleotides upstream of the −35 element of pyrG (Fig. 7A). These two loci were found in all sequenced H. pylori genomes, and additionally, in other Helicobacter species such as H. acinonychis isolated from cheetahs and H. cetorum isolated from Atlantic white-sided dolphins (Table S1). In order to test if the length of the T - or A-tract influences the expression of these genes, we created lacZ transcriptional fusion plasmids of hp_0350 and pyrG promoter regions from strain SMI109 (A14/T14). Additionally, we constructed the corresponding promoter variants with 5 nucleotides shorter A - or T-tracts (A9/T9), i.e. half the distance between min/max expression levels observed for sabA (Fig. 2). The promoter activities were analyzed by β-galactosidase assay in H. pylori, and as hypothesized the hp_0350 promoter showed distinct differences in activity in the A-tract length variants, whereas in contrast, the pyrG promoter activity remained unaffected by the change in T-tract length (Fig. 7A). The experiment was repeated at different growth phases and these lacZ fusions were also analyzed in E. coli, with the same results (data not shown).

In addition, we made in silico DNA curvature predictions of three additional promoter regions (hp_0350, hofA and hopM) and found that the DNA structure was affected as the length of the repetitive tract was decreased by 5 nucleotides (Fig. 7B), just as we observed for sabA (Fig. 6A). Alignment of the hp_0350 promoter sequences also revealed high homology between different strains (Fig. S9) and we could observe conserved A-boxes located upstream of the A-tract, forming potential UP-like elements, where the RNAP α-subunits likely interact. Our findings suggest that poly A - or T-tracts located adjacent to −35 elements fine-tune promoter activity, and thereby mRNA levels, by changing the DNA structure as the tract length is altered.
Concluding remarks
In conclusion, we describe a general mechanism where certain simple sequence repeats (SSRs) in H. pylori changes the local DNA structure, which by a rheostat-like mechanism affects interaction of the RNAP, to fine-tune gene expression via slipped strand mispairing (SSM). For SabA, optimal T-tract length (T13 in strain SMI109) positions the upstream-located A-boxes in a favorable phasing, aligning the UP-like elements and the core promoter, to enhance RNAP interaction, and resulting in higher promoter activity (Fig. 8). Thus, low transcriptional activity occurs when the UP-like elements and the core promoter are skewed relative each other, and the interaction of the RNAP α-subunits to the UP-like elements is disturbed (Fig. 8). Each T-tract length variant displayed a unique 3D DNA structure, contributing to the multiphasic transcriptional output observed from the sabA promoter. The mechanism described in this paper is possibly of significance to other bacterial systems that like H. pylori have a limited repertoire of trans-acting transcription factors and numerous SSRs, e.g. Haemophilus influenzae and N. meningitidis.
SabA is just one, of many outer membrane proteins in H. pylori, which have SSRs in its inter - and intragenic sequences. Intragenic CT-tracts have been reported for loci encoding BabA, BabB, SabB, OipA and HopZ, and we show that a set of them also harbor T - or A-tracts in their promoter regions, respectively. Taken together, all the SSR regions found in a genome create multiple contingency loci of hypermutable DNA that via different mechanisms blindly mediate causal and heritable genotypes, and contribute to stochastic switching. This cost-beneficial approach meets the need to control gene expression at various levels and can despite the lack of specific trans-acting regulators pilot persistent infections in fluctuating host environments through production of heterogeneous bacterial populations of best-fit phenotypes.
Materials and Methods
Ethical statement
The animal studies were approved by the Animal Care and Use Committee of Umeå University and by the ethical committee of Swedish Board of Agriculture (Decision No. A120-06). Experiments were conducted in accordance with Guidelines for Care and Use of Laboratory Animals.
Growth conditions and strains
Bacterial strains used in this study are listed in Table 1. H. pylori strains were routinely grown on Brucella agar (Difco) supplemented with 10% citrated bovine blood (Svenska Labfab), 1% IsoVitox (Becton Dickinson, US) and an antibiotic mix (4 mg/L amphotericin B, 5 mg/L trimethoprim and 10 mg/L vancomycin). When needed, H. pylori strains were grown in culture medium containing Brucella Broth (Difco), 1% Isovitox and 10% fetal calf serum (Gibco). Plates or broth were, when required, supplemented with chloramphenicol (20 mg/L) and/or kanamycin (25 mg/L). Bacteria were grown at 37°C under microaerophilic conditions (5% O2, 10% CO2, and 85% N2). For the analysis of sabA mRNA levels, protein expression and sLex-receptor binding, equal amounts of each strain were re-plated onto Brucella blood agar plates, and the bacteria were collected after 16 h of growth, in order to have all strains in the same growth phase. For the Δhup strain the plates were left for 40 h due to the delayed onset of growth (Fig. S7A). E. coli strains were cultured in Luria broth (LB) agar at 37°C, supplemented with carbenicillin (100 mg/L) and/or kanamycin (25 mg/L). Growth was measured by OD at 600 nm using the spectrophotometer Ultrospec2100 PRO (GE healthcare).
SMI109 ΔsabA was created by transformation of a plasmid containing the ΔsabA::cam construct [13]. Deletion of the sabA gene, loss of sLex-receptor binding, and absence of SabA expression was verified by PCR, RadioImmunoAssay (RIA), and immunoblot assays, respectively. We also determined, by diagnostic PCR, as previously described [18], that the sabA homolog sabB is absent in strain SMI109. SMI109 Δhup was created by transformation of a Δhup::kan PCR fragment generated by hup-1 and hup-5 primers, and pAAG178 as template. SMI109 ΔnapA was created by transformation of a ΔnapA::kan PCR fragment generated by napA1F and napA1R primers, and pBlue-ΔnapA::kan [78] as template. Deletion of the hup and napA genes was verified by PCR using hup-2/hup-in and napA2F/napA2R primers, respectively. Plasmids used are shown in Table 1 and primers in Table S2.
J99StrR was constructed by transformation of plasmid pEG21 (a kind gift from Prof Rainer Haas, Ludwig Maximilians University, Munich, Germany) into J99. The bacteria were plated on plates containing 500 mg/L streptomycin to obtain single colonies and a sabA T17 and CT8-off clone was selected and used for animal studies.
SMI109 pyrG::lacZ and hp_0350::lacZ strains were constructed by transformation of pAAG202-205 plasmids into SMI109. Correct incorporation in the chromosome was verified by PCR.
Genetic techniques
Basic molecular genetic manipulations were performed essentially as described previously [79]. Genomic DNA was isolated as previously described [80] from bacteria grown on plate. Polymerase chain reactions (PCR) were carried out according to the manufacturer's instruction, using GoTaq polymerase (Promega) or Phusion Hot start DNA polymerase (Thermo Scientific), on a MJ PTC-200 thermal cycler (MJ Research). For isolation of plasmid DNA, the E.Z.N.A Mini and Midi column plasmid purification kits were used and purification of PCR products were done with the E.Z.N.A Cycle Pure or Gel Extraction kits (OMEGA bio-tek, USA). Plasmids and/or PCR products were sequenced at Eurofins MWG Biotech (Germany).
Construction of lacZ transcriptional fusion plasmids
The sabA transcriptional lacZ fusion plasmids were obtained by cloning a PCR-amplified fragment (sabA-1 and sabA-3) spanning 310 bp of the sabA promoter region and 8 bp of the CDS (−244 to +74) between the EcoRI-BamHI sites in pRZ5202 creating a transcriptional fusion (Fig. S1A). As template, genomic DNA from different H. pylori strains (26695, J99, G27, 17875/sLex and SMI109) were used. Site-directed mutagenesis, using primers spanning ∼20 bp on either side of the T-tract (see example sabA-Tf/sabA-Tr in Table S2), were used to change the length of the T-tract in the sabA::lacZ promoter fusions.
The Δ46 promoter fragments were constructed with over-lapping PCR using primers P163–165 and P167 (different variants), and 162 (Table S2). As template PsabA DNA from SMI109 was used. Mutations were verified by sequencing and a PCR-amplified fragment (sabA-1 and sabA-3) was cloned between EcoRI-BamHI sites in pRZ5202, creating lacZ transcriptional fusions. For SPR and footprint analysis, PCR fragments generated with primers sabA-5 and sabA-8 were used.
Scrambling of the A-boxes in UP-like elements of PsabA was generated by site-directed mutagenesis, using primers spanning the proximal (Amut1) or/and distal (Amut2) elements (Table S2). As template PsabA DNA from SMI109 cloned in pUC19 was used. Mutations were verified by sequencing and a PCR-amplified fragment (sabA-1 and sabA-3) was cloned between EcoRI-BamHI sites in pRZ5202, creating lacZ transcriptional fusions.
The hp_0350 and pyrG promoter lacZ fusion plasmids were obtained by cloning the PCR-amplified fragments (hyp F/hyp R or pyrGp F/pyrGp R) spanning the hp_0350/pyrG promoter region between SalI-BglII sites in pBW. As template, genomic DNA from strain SMI109 was used. Stitch PCR using primers spanning ∼20 bp on either side of the T - or A-tract (pyrG 9Tf/pyrG 9Tr), were used to change the length of the T - or A - tract in the pyrG::lacZ and hp_0350::lacZ promoter fusions.
Construction of T-tract mutants in H. pylori
Isogenic sabA repeat tract variants were constructed by contraselection in strain SMI109, as previously described [81]. In short, the sabA promoter region was removed and replaced by an antibiotic resistance cassette, generating the SMI109ΔsabA::rpsLCAT strain, using primers LA-F, LA-R, RA-F, RA-R, rpsLCAT-F, rpsLCAT-R. PCR fragments harboring the sabA promoter region, with different lengths or composition of the repeat tract, were generated by stitch PCR using (P93, Tf, Tr, P96) and transformed into the SMI109ΔsabA::rpsLCAT strain, to replace the antibiotic cassette. Tf and Tr refer to the complementary primers spanning the region determining the tract length or composition (see Table S2). Clones were verified by PCR and sequencing using P93 and P96 primers. The protocol was optimized to fit the SMI109 strain by first determining the frequency of false positive clones (as contraselection is somewhat leaky). The amount of bacteria that corresponded to <10 false positives (in mock transformation) was used for transformation, which greatly facilitated the yield of mutants.
Construction of hup deletion/insertion fragment
A deletion/insertion fragment of the hup gene from SMI109 was generated by removal of the hup CDS and replacing that with a kanamycin resistance cassette. DNA regions upstream and downstream of the hup gene (HP_0835) were amplified by PCR using SMI109 genomic DNA as template, hup-1/hup-3Km and hup-4Km/hup-5 primers generating PCR fragments with flanking regions homologous to a kanamycin cassette. The kanamycin cassette from pKD4 was amplified using Km-up/Km-dn primers. The three PCR fragments were stitched together using equimolar amounts of each PCR fragment and hup-1/hup-5 primers. The hup deletion/insertion fragment was cloned in SmaI cut pUC19, generating the plasmid pAAG178, and analyzed by PCR and sequencing.
RadioImmunoAssay (RIA)
Measurement of binding to soluble 125I-sLex-receptor conjugate was performed as previously described [82]. Samples were assayed in duplicates and minimum two independent sets of each experiment, plotted with standard deviations.
Immunoblot analysis
Immunoblot analysis was performed as previously described [17]. Antibodies against SabA (AK278) and AlpB (AK262) [83] was used in combination with secondary α-rabbit IgG-HRP (DAKO A/S, Denmark). Blots were developed with SuperSignal (Pierce, Rockford, IL) ECL and detected on High Performance Chemiluminescence film (GE Healthcare). SabA protein densities were measured by ImageJ software (NIH) and normalized to the corresponding PAGE Blue stained SDS-PAGE gel (for Fig. 1A) or AlpB protein density (Fig. 2A, 4C, S6C and S6E) to calculate relative protein expression levels (Fig. S10).
β-galactosidase assay
β-galactosidase activity measurements were performed as described by Miller [84]. Data shown are mean values of duplicate determinations of at least three independent experiments, plotted with standard deviations.
RNA isolation
Total RNA was extracted using the SDS/hot phenol method, as previously described [85]. Contaminating DNA was removed by 10 U DNase I (Ambion 2 U/µl) treatment for 10 min at 37°C, followed by phenol/chloroform extraction. Quality and concentration of the total RNA was examined in a 1.2% agarose gel and by measurement on a micro-spectrophotometer (Nanodrop, ND-1000). The total RNA was stored at −80°C until used.
5′ - Rapid Amplification of cDNA Ends (5′-RACE) and primer extension
The 5′-RACE analysis was made using FirstChoice RLM-RACE kit (Ambion) according to the manufacturer's protocol. In brief, ∼1 µg of total RNA isolated from different H. pylori strains was used in each ligation and cDNA synthesis reaction. For the first PCR reaction RACE-outer and AB35 primers were used, and for the second PCR reaction RACE-inner and J99-8 primers were used. The PCR fragment of expected size was cloned in SmaI cut pUC19 and sequenced using universal M13F/R primers.
Primer extension analysis was done as previously described [86] using total RNA samples from H. pylori and E. coli (20 µg), and [γ-32P]-ATP kinase-labeled sabA-8 primer.
cDNA synthesis and quantitative real-time PCR (qPCR) analysis
The cDNA synthesis and RT-qPCR analysis was performed in accordance to the MIQUE guidelines [87]. Total RNA was isolated from H. pylori strains grown on Brucella blood agar plates (as described above). Before cDNA synthesis the total RNA (250 µg/µl) was treated an extra time with Turbo DNase I (Ambion) to remove any residual DNA. cDNA synthesis was performed in 20 µl reactions using 500 ng Turbo DNase treated total RNA, Transcriptor First Strand cDNA Synthesis kit (Roche Applied Science) and random hexamers (60 µM) provided with the kit, according to the manufacturer's protocol. cDNA synthesis was performed at 25°C for 10 min and at 55°C for 30 min. The enzyme was inactivated at 85°C for 5 min. The cDNA was diluted with 80 µl DEPC MQ before it was used as template in qPCR reactions.
Quantitative real-time reverse transcriptase PCR (RT-qPCR) was used to determine the mRNA levels of sabA in different H. pylori strains, and the primers used are listed in Table S2. As reference genes, expression of gyrA, ppk and rrnA were simultaneously analyzed. RT-qPCR analysis was done in 20 µl reactions in 96-well plates using cDNA from 10 or 100 ng RNA as template, 2× FastStart Essential Green Master (Roche Applied Science), gene specific primers (5 µM each) and LightCycler 96 instrument (Roche Applied Science). Cycling conditions were; 10 min at 95°C and 40 cycles of; 20 s at 95°C, 20 s at 58°C and 20 s at 72°C. Fluorescence was detected at the end of each extension step, and the Cq values and relative ratios were calculated using the LightCycler 96 software (Roche Applied Science). After each run a melt curve analysis was performed and the size of the PCR products were analyzed by gel electrophoresis. In each run, a non-template control for each cDNA sample (NTC, RNA only), and a PCR negative control was included for each primer pair. At least duplicate samples were analyzed in each experiment and expression ratios were determined from at least two biological replicates. The PCR efficiencies were determined using standard curve analysis and cDNA from SMI109 as template, and were as follows: sabA-1 1.98±0.09, sabA-2 1.99±0.06, ppk-2 1.99±0.05, gyrA-1 1.96±0.03 and rrnA-2 1.90±0.03.
Semi-quantitive RT-PCR analysis was performed using the same cDNA and primers as in RT-qPCR analysis. 20 µl reactions, using cDNA from 100 ng of RNA as template, Phusion Hot Start DNA polymerase (Thermo Scientific) and gene specific primers (5 µM each), were run on MJ PTC-200 thermal cycler (MJ Research). Cycling conditions were; 30 s 98°C followed by 10 (rrnA amplicon) or 20 (sabA and ppk amplicons) cycles of 15 s at 98°C, 30 s at 55°C and 30 s at 72°C. 5 µl of each PCR reaction was separated in a 1.5% agarose TAE gel, stained with GelRed (Biotium) and scanned using the Kodak Image station 2000R.
FITC-labeled bacteria overlaid on human paraffin tissue sections
Human gastric tissue was deparrafinized and incubated with blocking buffer (1× phosphate-buffered saline, 0.05% Tween-20 and 1% periodate-treated BSA) for 1 hour. Thereafter, FITC-labelled bacteria, prepared as described previously [12], was added and incubated for 3 hours. Tissue sections were washed in washing buffer (1× phosphate-buffered saline, 0.05% Tween-20), mounted with fluorescent mounting medium (DAKO), and analyzed for binding using Zeiss Axio Imager Z1 system and AxioVision software (Zeiss, Germany).
Animal experiments and collection of bacterial sweeps
FVB/N male mice (6–8 weeks of age), transgenic for the human α-1,3/4-fucosyltransferase gene, resulting in the expression of ABO Lewis blood group antigen in the epithelial lining of the stomach, were used in this study [40]. Transgenicity was confirmed as described previously [40]. Mice were bred and kept in separate cages during the study and kept on a 12-h light-dark cycle. Water and standard pellet diet was provided ad libitum. Animals were infected with 2×10⁸ H. pylori (J99StrR sabA T17 and CT8-off), twice a week during two weeks, via oro-gastrical gavage. To evaluate the H. pylori infection load, mice were sacrificed 4 weeks post-infection and stomach tissue samples were collected and quantitatively cultured on plates supplemented with 500 mg/L streptomycin.
Bacterial sweeps prepared from antrum and corpus biopsies during the same gastroscopy session [88] were thawed for re-culturing of H. pylori under standard conditions. Genomic DNA isolation and receptor binding analysis of these bacterial pools was performed as described in preceding sections.
Fragment length analysis (FLA)
All fragment length analysis was performed at MWG Eurofins Medigenomix GmbH (Germany). FAM-labeled primers (see Table S2) were designed and optimized by using the Lasergene software (DNASTAR) and synthesized on site at MWG. Repetitive PCR-amplifications, with three different DNA polymerases (AmpliTaq Gold, Takara Taq, Bioline MyTaq), gave identical peak distribution at different dilutions, although with varying amplification strength (Fig. S4). For all FLA assays at least two dilutions with equal amounts of genomic DNA was used with comparable results.
Electric mobility shift assay (EMSA)
Linear DNA containing the sabA promoter region (spanning −166 to +74) was generated by high-fidelity PCR using genomic DNA from SMI109 as template and primers sabA-5 and sabA-8. Radio-labeled DNA fragments were generated by first pre-labeling the sabA-5 primer using [γ32P]ATP (>3000 Ci/mmol; Perkin Elmer) and T4 kinase (Thermo Scientific). The binding reactions with 10 nM DNA and increasing concentrations of E. coli σ70-RNAP (Holoenzyme, Epicentre) were done as previously described [89]. The samples were separated on 4.5% Tris-Glycine (pH 8.5) polyarcylamide gel. The bands were visualized using Phosphor screen cassette, Typhoon scanner 9400 (GE Healthcare) and ImageJ software (NIH).
Surface plasmon resonance analysis
Binding experiments shown in Fig. 4A and 4B were done with a Biacore3000 (GE Healthcare) at 25°C and analyzed with Scrubber 2 software (BioLogic Software). CM5 sensor chips where pre-coated with streptavidin (50 µg/ml) by injecting at 5 µl/min until approximately 5000 RU were obtained, using an amine coupling kit according to GE Healthcare protocol. This was followed by ethanolamine blockage and subsequent immobilization of 5′ biotin-labeled DNA fragments with running buffer [25 mM HEPES pH 7.5, 150 mM KCl, 10 mM MgCl2, 0.1 mM EDTA and 0.005% non-ionic surfactant polyoxyethylenesorbitan (P2O) (GE Healthcare)], by injecting at 5 µl/min to obtain approximately equal RU (<70) for every chip. All results were normalized to a T13 (wt) DNA-fragment used in all runs. DNA fragments were obtained by PCR amplification of genomic DNA from the A-, C-, or T-tract variants, using high fidelity DNA polymerase and 5′-Biotin-labeled primer paired with an unlabeled primer (Biotin-sabA-5 & sabA-8). 20 nM of the E. coli σ70-RNAP (Holoenzyme, Epicentre) was injected for 2 min at the rate of 100 µl/min. Between injections the σ70-RNAP was regenerated from the chip with a quick injection of 30 µl of 500 mM MgCl2. Binding to a DNA fragment of the sabA CDS was used as negative control, and subtracted from all data in Fig. 4. Experiments were performed in at least duplicates.
Binding experiments shown in Fig. 5D were done with the ProteOn system (Bio-Rad) at 25°C and analyzed with ProteOn manager 3.1 software (Bio-Rad). ProteOn GLC Sensor Chips were coated with streptavidin and blocked with ethanolamine, essentially as described in the preceding section. Biotinylated DNA fragments of the sabA promoter were immobilized by injection at 30 µl/min, to obtain approximately 120 RU for the two chips used. The E. coli σ70-RNAP (Holoenzyme, Epicentre) was injected in 5 different concentrations, 1.25, 2.5, 5, 10 and 20 ng/ml. The results were normalized to that of the T13 (wt) DNA-fragment.
DNase I footprint assay
Binary complexes were formed by incubating 10 nM [γ32P]ATP-labeled DNA fragments and increasing concentrations of E. coli σ70-RNAP (Holoenzyme, Epicentre). Binding reactions were done in buffer B (25 mM HEPES pH 7.5, 0.1 mM EDTA, 5 mM DTT and 10% glycerol), 50 mM KCl and 0.5 mg/ml bovine serum albumin), for 30 min at 30°C. The reactions were subjected to DNase I digestion (0.3 U Recombinant DNase I, Ambion) and treated as previously described [90]. The samples were analyzed on a 6% denaturing polyacrylamide-8.3M urea gel. A+G Maxam Gilbert sequencing reactions of the same DNA fragments were loaded alongside the samples. The bands were visualized using Phosphor screen cassette and Typhoon scanner 9400 (GE Healthcare).
Statistical analysis
We used the non-parametric two-tailed Mann-Whitney test for the statistical analyzes. Differences were considered significant when the p value was below 0.05. Significance levels are marked with *<0.05, **<0.01 and ***<0.005.
Supporting Information
Zdroje
1. BaylissCD (2009) Determinants of phase variation rate and the fitness implications of differing rates for bacterial pathogens and commensals. FEMS Microbiol Rev 33 : 504–520.
2. DeitschKW, LukehartSA, StringerJR (2009) Common strategies for antigenic variation by bacterial, fungal and protozoan pathogens. Nat Rev Microbiol 7 : 493–503.
3. PalmerME, LipsitchM, MoxonER, BaylissCD (2013) Broad conditions favor the evolution of phase-variable loci. MBio 4: e00430-00412.
4. LinWH, KussellE (2012) Evolutionary pressures on simple sequence repeats in prokaryotic coding regions. Nucleic Acids Res 40 : 2399–2413.
5. BaylissCD, PalmerME (2012) Evolution of simple sequence repeat-mediated phase variation in bacterial genomes. Ann N Y Acad Sci 1267 : 39–44.
6. ZhouK, AertsenA, MichielsCW (2013) The role of variable DNA tandem repeats in bacterial adaptation. FEMS Microbiol Rev 38 : 119–141.
7. PolkDB, PeekRMJr (2010) Helicobacter pylori: gastric cancer and beyond. Nat Rev Cancer 10 : 403–414.
8. ShenF, HobleyL, DohertyN, LohJT, CoverTL, et al. (2010) In Helicobacter pylori auto-inducer-2, but not LuxS/MccAB catalysed reverse transsulphuration, regulates motility through modulation of flagellar gene transcription. BMC Microbiol 10 : 210.
9. SalamaNR, HartungML, MullerA (2013) Life in the human stomach: persistence strategies of the bacterial pathogen Helicobacter pylori. Nat Rev Microbiol 11 : 385–399.
10. IlverD, ArnqvistA, ÖgrenJ, FrickIM, KersulyteD, et al. (1998) Helicobacter pylori adhesin binding fucosylated histo-blood group antigens revealed by retagging. Science 279 : 373–377.
11. BorénT, FalkP, RothKA, LarsonG, NormarkS (1993) Attachment of Helicobacter pylori to human gastric epithelium mediated by blood group antigens. Science 262 : 1892–1895.
12. Aspholm-HurtigM, DailideG, LahmannM, KaliaA, IlverD, et al. (2004) Functional adaptation of BabA, the H. pylori ABO blood group antigen binding adhesin. Science 305 : 519–522.
13. MahdaviJ, SondénB, HurtigM, OlfatFO, ForsbergL, et al. (2002) Helicobacter pylori SabA adhesin in persistent infection and chronic inflammation. Science 297 : 573–578.
14. LindénS, MahdaviJ, Semino-MoraC, OlsenC, CarlstedtI, et al. (2008) Role of ABO secretor status in mucosal innate immunity and H. pylori infection. PLoS Pathog 4: e2.
15. YamaokaY, OjoO, FujimotoS, OdenbreitS, HaasR, et al. (2006) Helicobacter pylori outer membrane proteins and gastroduodenal disease. Gut 55 : 775–781.
16. SolnickJV, HansenLM, SalamaNR, BoonjakuakulJK, SyvanenM (2004) Modification of Helicobacter pylori outer membrane protein expression during experimental infection of rhesus macaques. Proc Natl Acad Sci U S A 101 : 2106–2111.
17. BäckströmA, LundbergC, KersulyteD, BergDE, BorénT, et al. (2004) Metastability of Helicobacter pylori bab adhesin genes and dynamics in Lewis b antigen binding. Proc Natl Acad Sci U S A 101 : 16923–16928.
18. TalaricoS, WhitefieldSE, FeroJ, HaasR, SalamaNR (2012) Regulation of Helicobacter pylori adherence by gene conversion. Mol Microbiol 84 : 1050–1061.
19. AspholmM, OlfatFO, NordénJ, SondénB, LundbergC, et al. (2006) SabA is the H. pylori hemagglutinin and is polymorphic in binding to sialylated glycans. PLoS Pathog 2: e110.
20. SheuBS, OdenbreitS, HungKH, LiuCP, SheuSM, et al. (2006) Interaction between host gastric Sialyl-Lewis X and H. pylori SabA enhances H. pylori density in patients lacking gastric Lewis B antigen. Am J Gastroenterol 101 : 36–44.
21. JosenhansC, BeierD, LinzB, MeyerTF, SuerbaumS (2007) Pathogenomics of helicobacter. Int J Med Microbiol 297 : 589–600.
22. ScarlatoV, DelanyI, SpohnG, BeierD (2001) Regulation of transcription in Helicobacter pylori: simple systems or complex circuits? Int J Med Microbiol 291 : 107–117.
23. DanielliA, AmoreG, ScarlatoV (2010) Built shallow to maintain homeostasis and persistent infection: insight into the transcriptional regulatory network of the gastric human pathogen Helicobacter pylori. PLoS Pathog 6: e1000938.
24. SaundersNJ, PedenJF, HoodDW, MoxonER (1998) Simple sequence repeats in the Helicobacter pylori genome. Mol Microbiol 27 : 1091–1098.
25. ArasRA, KangJ, TschumiAI, HarasakiY, BlaserMJ (2003) Extensive repetitive DNA facilitates prokaryotic genome plasticity. Proc Natl Acad Sci U S A 100 : 13579–13584.
26. CoenyeT, VandammeP (2005) Characterization of mononucleotide repeats in sequenced prokaryotic genomes. DNA Res 12 : 221–233.
27. PintoAV, MathieuA, MarsinS, VeauteX, IelpiL, et al. (2005) Suppression of homologous and homeologous recombination by the bacterial MutS2 protein. Mol Cell 17 : 113–120.
28. Garcia-OrtizMV, MarsinS, AranaME, GasparuttoD, GueroisR, et al. (2011) Unexpected role for Helicobacter pylori DNA polymerase I as a source of genetic variability. PLoS Genet 7: e1002152.
29. SuerbaumS, SmithJM, BapumiaK, MorelliG, SmithNH, et al. (1998) Free recombination within Helicobacter pylori. Proc Natl Acad Sci U S A 95 : 12619–12624.
30. KersulyteD, ChalkauskasH, BergDE (1999) Emergence of recombinant strains of Helicobacter pylori during human infection. Mol Microbiol 31 : 31–43.
31. KuipersEJ, IsraelDA, KustersJG, GerritsMM, WeelJ, et al. (2000) Quasispecies development of Helicobacter pylori observed in paired isolates obtained years apart from the same host. J Infect Dis 181 : 273–282.
32. SalamaN, GuilleminK, McDanielTK, SherlockG, TompkinsL, et al. (2000) A whole-genome microarray reveals genetic diversity among Helicobacter pylori strains. Proc Natl Acad Sci U S A 97 : 14668–14673.
33. GoodwinAC, WeinbergerDM, FordCB, NelsonJC, SniderJD, et al. (2008) Expression of the Helicobacter pylori adhesin SabA is controlled via phase variation and the ArsRS signal transduction system. Microbiology 154 : 2231–2240.
34. KaoCY, SheuSM, SheuBS, WuJJ (2012) Length of thymidine homopolymeric repeats modulates promoter activity of sabA in Helicobacter pylori. Helicobacter 17 : 203–209.
35. ShaoL, TakedaH, FukuiT, MabeK, HanJ, et al. (2010) Genetic diversity of the Helicobacter pylori sialic acid-binding adhesin (sabA) gene. Biosci Trends 4 : 249–253.
36. RedkoY, AubertS, StachowiczA, LenormandP, NamaneA, et al. (2013) A minimal bacterial RNase J-based degradosome is associated with translating ribosomes. Nucleic Acids Res 41 : 288–301.
37. DuboisA, FialaN, Heman-AckahLM, DrazekES, TarnawskiA, et al. (1994) Natural gastric infection with Helicobacter pylori in monkeys: a model for spiral bacteria infection in humans. Gastroenterology 106 : 1405–1417.
38. ApoilPA, RoubinetF, DespiauS, MolliconeR, OriolR, et al. (2000) Evolution of alpha 2-fucosyltransferase genes in primates: relation between an intronic Alu-Y element and red cell expression of ABH antigens. Mol Biol Evol 17 : 337–351.
39. OhnoT, VallströmA, RuggeM, OtaH, GrahamDY, et al. (2011) Effects of blood group antigen-binding adhesin expression during Helicobacter pylori infection of Mongolian gerbils. J Infect Dis 203 : 726–735.
40. FalkPG, BryL, HolgerssonJ, GordonJI (1995) Expression of a human alpha-1,3/4-fucosyltransferase in the pit cell lineage of FVB/N mouse stomach results in production of Leb-containing glycoconjugates: a potential transgenic mouse model for studying Helicobacter pylori infection. Proc Natl Acad Sci U S A 92 : 1515–1519.
41. ShindeD, LaiY, SunF, ArnheimN (2003) Taq DNA polymerase slippage mutation rates measured by PCR and quasi-likelihood analysis: (CA/GT)n and (A/T)n microsatellites. Nucleic Acids Res 31 : 974–980.
42. WillemsR, PaulA, van der HeideHG, ter AvestAR, MooiFR (1990) Fimbrial phase variation in Bordetella pertussis: a novel mechanism for transcriptional regulation. EMBO J 9 : 2803–2809.
43. YogevD, RosengartenR, Watson-McKownR, WiseKS (1991) Molecular basis of Mycoplasma surface antigenic variation: a novel set of divergent genes undergo spontaneous mutation of periodic coding regions and 5′ regulatory sequences. EMBO J 10 : 4069–4079.
44. van HamSM, van AlphenL, MooiFR, van PuttenJP (1993) Phase variation of H. influenzae fimbriae: transcriptional control of two divergent genes through a variable combined promoter region. Cell 73 : 1187–1196.
45. SarkariJ, PanditN, MoxonER, AchtmanM (1994) Variable expression of the Opc outer membrane protein in Neisseria meningitidis is caused by size variation of a promoter containing poly-cytidine. Mol Microbiol 13 : 207–217.
46. MillerVL, TaylorRK, MekalanosJJ (1987) Cholera toxin transcriptional activator toxR is a transmembrane DNA binding protein. Cell 48 : 271–279.
47. MartinP, MakepeaceK, HillSA, HoodDW, MoxonER (2005) Microsatellite instability regulates transcription factor binding and gene expression. Proc Natl Acad Sci U S A 102 : 3800–3804.
48. LiuL, PanangalaVS, DybvigK (2002) Trinucleotide GAA repeats dictate pMGA gene expression in Mycoplasma gallisepticum by affecting spacing between flanking regions. J Bacteriol 184 : 1335–1339.
49. LafontaineER, WagnerNJ, HansenEJ (2001) Expression of the Moraxella catarrhalis UspA1 protein undergoes phase variation and is regulated at the transcriptional level. J Bacteriol 183 : 1540–1551.
50. AttiaAS, HansenEJ (2006) A conserved tetranucleotide repeat is necessary for wild-type expression of the Moraxella catarrhalis UspA2 protein. J Bacteriol 188 : 7840–7852.
51. PernitzschSR, TirierSM, BeierD, SharmaCM (2014) A variable homopolymeric G-repeat defines small RNA-mediated posttranscriptional regulation of a chemotaxis receptor in Helicobacter pylori. Proc Natl Acad Sci U S A 111: E501–510.
52. SpohnG, BeierD, RappuoliR, ScarlatoV (1997) Transcriptional analysis of the divergent cagAB genes encoded by the pathogenicity island of Helicobacter pylori. Mol Microbiol 26 : 361–372.
53. BeierD, SpohnG, RappuoliR, ScarlatoV (1998) Functional analysis of the Helicobacter pylori principal sigma subunit of RNA polymerase reveals that the spacer region is important for efficient transcription. Mol Microbiol 30 : 121–134.
54. TombJF, WhiteO, KerlavageAR, ClaytonRA, SuttonGG, et al. (1997) The complete genome sequence of the gastric pathogen Helicobacter pylori. Nature 388 : 539–547.
55. ZakharovaN, HoffmanPS, BergDE, SeverinovK (1998) The largest subunits of RNA polymerase from gastric helicobacters are tethered. J Biol Chem 273 : 19371–19374.
56. DailidieneD, TanS, OguraK, ZhangM, LeeAH, et al. (2007) Urea sensitization caused by separation of Helicobacter pylori RNA polymerase beta and beta' subunits. Helicobacter 12 : 103–111.
57. RossW, GosinkKK, SalomonJ, IgarashiK, ZouC, et al. (1993) A third recognition element in bacterial promoters: DNA binding by the alpha subunit of RNA polymerase. Science 262 : 1407–1413.
58. EstremST, GaalT, RossW, GourseRL (1998) Identification of an UP element consensus sequence for bacterial promoters. Proc Natl Acad Sci U S A 95 : 9761–9766.
59. AiyarSE, GourseRL, RossW (1998) Upstream A-tracts increase bacterial promoter activity through interactions with the RNA polymerase alpha subunit. Proc Natl Acad Sci U S A 95 : 14652–14657.
60. EllingerT, BehnkeD, KnausR, BujardH, GrallaJD (1994) Context-dependent effects of upstream A-tracts. Stimulation or inhibition of Escherichia coli promoter function. J Mol Biol 239 : 466–475.
61. RivettiC, GutholdM, BustamanteC (1999) Wrapping of DNA around the E.coli RNA polymerase open promoter complex. EMBO J 18 : 4464–4475.
62. Nov KlaimanT, HosidS, BolshoyA (2009) Upstream curved sequences in E. coli are related to the regulation of transcription initiation. Comput Biol Chem 33 : 275–282.
63. Olivares-ZavaletaN, JaureguiR, MerinoE (2006) Genome analysis of Escherichia coli promoter sequences evidences that DNA static curvature plays a more important role in gene transcription than has previously been anticipated. Genomics 87 : 329–337.
64. De la CruzMA, MerinoE, OropezaR, TellezJ, CalvaE (2009) The DNA static curvature has a role in the regulation of the ompS1 porin gene in Salmonella enterica serovar Typhi. Microbiology 155 : 2127–2136.
65. Pérez-MartínJ, RojoF, de LorenzoV (1994) Promoters responsive to DNA bending: a common theme in prokaryotic gene expression. Microbiol Rev 58 : 268–290.
66. MetruccioMM, PigozziE, RoncaratiD, Berlanda ScorzaF, NoraisN, et al. (2009) A novel phase variation mechanism in the meningococcus driven by a ligand-responsive repressor and differential spacing of distal promoter elements. PLoS Pathog 5: e1000710.
67. PorrúaO, López-SánchezA, PlateroAI, SanteroE, ShinglerV, et al. (2013) An A-tract at the AtzR binding site assists DNA binding, inducer-dependent repositioning and transcriptional activation of the PatzDEF promoter. Mol Microbiol 90 : 72–87.
68. DillonSC, DormanCJ (2010) Bacterial nucleoid-associated proteins, nucleoid structure and gene expression. Nat Rev Microbiol 8 : 185–195.
69. MaddocksSE, OystonPC (2008) Structure and function of the LysR-type transcriptional regulator (LTTR) family proteins. Microbiology 154 : 3609–3623.
70. RimskyS, TraversA (2011) Pervasive regulation of nucleoid structure and function by nucleoid-associated proteins. Curr Opin Microbiol 14 : 136–141.
71. ChenC, GhoshS, GroveA (2004) Substrate specificity of Helicobacter pylori histone-like HU protein is determined by insufficient stabilization of DNA flexure points. Biochem J 383 : 343–351.
72. WangG, LoLF, MaierRJ (2012) A histone-like protein of Helicobacter pylori protects DNA from stress damage and aids host colonization. DNA Repair (Amst) 733–740.
73. CooksleyC, JenksPJ, GreenA, CockayneA, LoganRP, et al. (2003) NapA protects Helicobacter pylori from oxidative stress damage, and its production is influenced by the ferric uptake regulator. J Med Microbiol 52 : 461–469.
74. CeciP, MangiarottiL, RivettiC, ChianconeE (2007) The neutrophil-activating Dps protein of Helicobacter pylori, HP-NAP, adopts a mechanism different from Escherichia coli Dps to bind and condense DNA. Nucleic Acids Res 35 : 2247–2256.
75. SwapnaLS, RekhaN, SrinivasanN (2012) Accommodation of profound sequence differences at the interfaces of eubacterial RNA polymerase multi-protein assembly. Bioinformation 8 : 6–12.
76. BorinBN, TangW, KrezelAM (2014) Helicobacter pylori RNA polymerase alpha-subunit C-terminal domain shows features unique to epsilon-proteobacteria and binds NikR/DNA complexes. Protein Sci 23 : 454–463.
77. SharmaCM, HoffmannS, DarfeuilleF, ReignierJ, FindeissS, et al. (2010) The primary transcriptome of the major human pathogen Helicobacter pylori. Nature 464 : 250–255.
78. PeterssonC, ForsbergM, AspholmM, OlfatFO, ForslundT, et al. (2006) Helicobacter pylori SabA adhesin evokes a strong inflammatory response in human neutrophils which is down-regulated by the neutrophil-activating protein. Med Microbiol Immunol 195 : 195–206.
79. Sambrook J, Russel DW (2001) Molecular Cloning - A Laboratory Manual. New York: Cold Spring Harbor Laboratory Press.
80. PitcherDG, SaundersNA, OwenRJ (1989) Rapid extraction of bacterial genomic DNA with guanidium thiocyanate. Letters in Applied Microbiology 8 : 151–156.
81. DailidieneD, DailideG, KersulyteD, BergDE (2006) Contraselectable streptomycin susceptibility determinant for genetic manipulation and analysis of Helicobacter pylori. Appl Environ Microbiol 72 : 5908–5914.
82. AspholmM, KaliaA, RuhlS, SchedinS, ArnqvistA, et al. (2006) Helicobacter pylori adhesion to carbohydrates. Methods Enzymol 417 : 293–339.
83. OdenbreitS, KavermannH, PulsJ, HaasR (2002) CagA tyrosine phosphorylation and interleukin-8 induction by Helicobacter pylori are independent from AlpAB, HopZ and Bab group outer membrane proteins. Int J Med Microbiol 292 : 257–266.
84. Miller JH (1992) A short course in bacterial genetics - Laboratory manual. New York: Cold Spring Harbor Laboratory Press.
85. von GabainA, BelascoJG, SchottelJL, ChangAC, CohenSN (1983) Decay of mRNA in Escherichia coli: investigation of the fate of specific segments of transcripts. Proc Natl Acad Sci U S A 80 : 653–657.
86. BalsalobreC, MorschhauserJ, JassJ, HackerJ, UhlinBE (2003) Transcriptional analysis of the sfa determinant revealing mmRNA processing events in the biogenesis of S fimbriae in pathogenic Escherichia coli. J Bacteriol 185 : 620–629.
87. BustinSA, BenesV, GarsonJA, HellemansJ, HuggettJ, et al. (2009) The MIQE guidelines: minimum information for publication of quantitative real-time PCR experiments. Clin Chem 55 : 611–622.
88. EnrothH, KraazW, EngstrandL, NyrenO, RohanT (2000) Helicobacter pylori strain types and risk of gastric cancer: a case-control study. Cancer Epidemiol Biomarkers Prev 9 : 981–985.
89. ÅbergA, ShinglerV, BalsalobreC (2008) Regulation of the fimB promoter: a case of differential regulation by ppGpp and DksA in vivo. Mol Microbiol 67 : 1223–1241.
90. Del Peso-SantosT, BernardoLM, SkärfstadE, HolmfeldtL, TogneriP, et al. (2011) A hyper-mutant of the unusual sigma70-Pr promoter bypasses synergistic ppGpp/DksA co-stimulation. Nucleic Acids Res 39 : 5853–5865.
91. AlmRA, LingLS, MoirDT, KingBL, BrownED, et al. (1999) Genomic-sequence comparison of two unrelated isolates of the human gastric pathogen Helicobacter pylori. Nature 397 : 176–180.
92. BaltrusDA, AmievaMR, CovacciA, LoweTM, MerrellDS, et al. (2009) The complete genome sequence of Helicobacter pylori strain G27. J Bacteriol 191 : 447–448.
93. OlofssonA, VallströmA, PetzoldK, TegtmeyerN, SchleucherJ, et al. (2010) Biochemical and functional characterization of Helicobacter pylori vesicles. Mol Microbiol 77 : 1539–1555.
94. Yanisch-PerronC, VieiraJ, MessingJ (1985) Improved M13 phage cloning vectors and host strains: nucleotide sequences of the M13mp18 and pUC19 vectors. Gene 33 : 103–119.
95. Reznikoff WS, McClure WR (1986) E. coli promoters. Maximazing gene expression. Boston, MA: Butterswoths. 1–33 p.
96. de VriesN, KuipersEJ, KramerNE, van VlietAH, BijlsmaJJ, et al. (2001) Identification of environmental stress-regulated genes in Helicobacter pylori by a lacZ reporter gene fusion system. Helicobacter 6 : 300–309.
97. DatsenkoKA, WannerBL (2000) One-step inactivation of chromosomal genes in Escherichia coli K-12 using PCR products. Proc Natl Acad Sci U S A 97 : 6640–6645.
Štítky
Hygiena a epidemiologie Infekční lékařství LaboratořČlánek vyšel v časopise
PLOS Pathogens
2014 Číslo 7
- Parazitičtí červi v terapii Crohnovy choroby a dalších zánětlivých autoimunitních onemocnění
- Vakcíny proti klíšťové encefalitidě
- Kdy je nejlepší očkovat
- Možné vedlejší účinky očkování
- Imunogenita vakcín
Nejčtenější v tomto čísle
- Molecular and Cellular Mechanisms of KSHV Oncogenesis of Kaposi's Sarcoma Associated with HIV/AIDS
- Holobiont–Holobiont Interactions: Redefining Host–Parasite Interactions
- BCKDH: The Missing Link in Apicomplexan Mitochondrial Metabolism Is Required for Full Virulence of and
- Helminth Infections, Type-2 Immune Response, and Metabolic Syndrome
Zvyšte si kvalifikaci online z pohodlí domova
Mazová zátka a její řešení
nový kurzVšechny kurzy