
Characterization of the Largest Effector Gene Cluster of
In this study, we provide the first step to the functional analysis of the largest gene cluster in the Ustilago maydis genome encoding 24 secreted effectors. While the deletion of the entire cluster dramatically affected tumor formation and abolished anthocyanin induction, only one of the genes had a large contribution to tumor formation, while another effector gene was primarily responsible for the anthocyanin induction. Unexpectedly, the cluster mutant could still colonize plants and complete the life cycle, i.e. behaves like an endophyte. Despite only small contributions to tumor formation, individual effector mutants caused distinct plant responses, suggesting that they affect discrete plant processes. On these grounds we are proposing to use plant responses as a general readout to assess and compare effector gene function.
Published in the journal:
. PLoS Pathog 10(7): e32767. doi:10.1371/journal.ppat.1003866
Category:
Research Article
doi:
https://doi.org/10.1371/journal.ppat.1003866
Summary
In this study, we provide the first step to the functional analysis of the largest gene cluster in the Ustilago maydis genome encoding 24 secreted effectors. While the deletion of the entire cluster dramatically affected tumor formation and abolished anthocyanin induction, only one of the genes had a large contribution to tumor formation, while another effector gene was primarily responsible for the anthocyanin induction. Unexpectedly, the cluster mutant could still colonize plants and complete the life cycle, i.e. behaves like an endophyte. Despite only small contributions to tumor formation, individual effector mutants caused distinct plant responses, suggesting that they affect discrete plant processes. On these grounds we are proposing to use plant responses as a general readout to assess and compare effector gene function.
Introduction
U. maydis is a biotrophic fungal pathogen causing smut disease in maize. To cause disease, haploid cells of compatible mating type need to fuse on the plant surface and develop an infectious dikaryon [1], [2]. Upon perception of appropriate surface cues [3], the dikaryon differentiates non-melanized appressoria that penetrate plant cells directly, presumably aided by local secretion of lytic enzymes [4]. During penetration, the host plasma membrane invaginates and encases the fungal hyphae, a feature typical for biotrophs. This establishes an extended interaction interface for the exchange of signals and nutrients [5], [6]. Initial intracellular biotrophic growth of U. maydis is followed by intercellular growth during later stages of the infection, concomitant with massive proliferation in mesodermal tissue close to the veins. At this developmental stage, huge fungal aggregates form in cavities between plant cells followed by differentiation of ornamented diploid spores [6]. Fungal proliferation coincides with plant cell enlargement and resumption of mitotic divisions [6]. U. maydis can infect and cause symptoms on all above ground maize organs, with the infection staying locally confined. This is in contrast to related smut fungi that show systemic spread throughout the plant but produce symptoms only in the male and female inflorescences [7], [8].
During initial contact of U. maydis with the plant leaf and presumably triggered by fungal pathogen-associated molecular patterns (PAMPs), a number of plant defense genes are induced. This upregulation disappears during fungal penetration, suggesting that these initial defense responses are actively suppressed by the fungus during the plant colonization stages [9]. Also, several genes associated with suppression of plant cell death are induced. One of these, the maize cystatin CC9, has recently been functionally analyzed [10]. Silencing of CC9 enhanced maize defense gene expression and upon infection with U. maydis a hypersensitive response was observed. CC9 was shown to suppress apoplastic cysteine protease activity, illustrating that CC9 is a novel compatibility factor for the biotrophic interaction of maize with U. maydis [10]. After plant colonization the most dramatic transcriptional changes in the host affect hormone signaling, induction of antioxidants, secondary metabolism, as well as a block in the transition from a juvenile sink tissue to a mature, photosynthetically active source tissue normally observed during leaf establishment [9]. The latter supports the observation that U. maydis is able to colonize young meristematic maize tissue, but is unable to infect differentiated source tissue [11]. The changes in plant gene expression observed after host colonization are likely to be brought about by secreted fungal effector molecules. The genome of U. maydis encodes about 300 novel secreted effectors that are upregulated during plant colonization and largely lack known InterPro domains. Of these a significant percentage is arranged in gene clusters and deletion of entire clusters can have dramatic effects on virulence [12], [13]. Genome comparisons with the related smut fungi Sporisorium reilianum and U. hordei revealed that the majority of secreted effectors also exist in these relatives. With respect to conservation, effectors fall in two classes: approximately 34% are highly conserved in all smut fungi sequenced so far [8] and the remainder are poorly conserved, reflecting the arms race with the host. Furthermore, in U. hordei the tight clustering of effector genes seen in U. maydis and S. reilianum is largely disrupted [7], [8]. Effector genes in U. maydis are plant-induced [12], and work by Skibbe et al. [14] has revealed that the expression of some effector genes is tissue specific, i.e. is different when U. maydis colonizes seedlings, adult leaves or tassel, and the need for the corresponding effectors may be restricted to the respective tissues. So far the function of only very few of the many novel effectors has been elucidated in the U. maydis/maize pathosystem. Pep1, a conserved effector is needed for penetration [15] and affects plant defense responses by inhibiting apoplastic plant peroxidases [16]. Pit2, another conserved effector affects host defense responses [17] through inhibition of apoplastic plant cysteine proteases [18]. Cmu1 is a secreted chorismate mutase that is taken up by plant cells and lowers salicylic acid (SA) levels in infected tissue through metabolic priming [19].
Here we describe the beginning of the functional analysis of cluster 19A, the largest effector gene cluster in U. maydis. In a previous study, the entire cluster 19A comprising 23 putative effector genes in a 40 kb genomic region was deleted [12]. Cluster 19A mutants were severely attenuated in virulence and except for some ligula swelling, the mutants rarely elicited tumor formation [12]. In this study, we map the most important effectors for seedling infection in this cluster, and show that most strains deleted for individual effector genes show only minor reductions in virulence but elicit distinct plant responses.
Results
Mapping of cluster 19A genes contributing to tumor formation and anthocyanin induction after seedling infection
Cluster 19A was originally predicted to encode 23 secreted effectors [12]. The manual reannotation based on comparison with S. reilianum and U. hordei now predicts the presence of 24 effector genes, plus one gene related to a reverse transcriptase (um05313) presumably originating from a retrotransposon and one pseudogene (um05316) (http://mips.helmholtz-muenchen.de/genre/proj/ustilago) (Figure 1A).

Among the effector genes in cluster 19A, we detect five gene families based on amino acid sequence similarity (Figure 1A, Figure 2 and Figure S1). Um05294, Um05295, Um12302, Um10553 and Um10554 display between 34–48% similarity at the amino acid sequence level (Figure 1A). Another family (Figure 1A) comprises genes um05299, um05300 and um05301. The respective proteins show between 34–41% similarity. The two effector proteins encoded by the adjacent genes um05305 and um05306 display 30% amino acid similarity (Figure 1A). A three gene family codes for Um05309, Um05310, Um05311 with 35–86% amino acid sequence similarity and the largest family is comprised of Um05312, Um05314, Um10557, Um05317, Um05318 and Um05319 with 33–51% amino acid similarity (Figure 1A). Outside of cluster 19A the U. maydis genome does not contain paralogs to any of these gene families. The 24 effectors encoded by cluster 19A do not contain recognizable protein domains nor do they display a characteristic spacing of cysteine residues described for several other U. maydis effectors [13]. However, orthologs for most of these genes are found in the genomes of S. reilianum and U. hordei [7], [8] (http://mips.helmholtz-muenchen.de/genre/proj/sporisorium/) (http://mips.helmholtz-muenchen.de/genre/proj/MUHDB/) (Figure 2). Published expression data for cluster 19A genes from different U. maydis infected tissues [12], [14] are compiled in Figure 2. These studies revealed that except for two genes where expression could not be detected, genes in cluster 19A are differentially induced when different plant organs are colonized (Figure 2). Furthermore, only three of the cluster 19A genes are downregulated when the central regulator for pathogenic development, the bE/bW complex, is switched off during biotrophic development [20] (Figure 2). This illustrates, that the individual cluster genes are plant induced but do not appear to be co-regulated.

Given the strong virulence phenotype of cluster 19A mutants [12], we examined whether the cluster 19A mutant is impaired in biotrophic growth. To this end, we compared biotrophic development of the mutant strain SG200Δ19A and the progenitor strain SG200. To our surprise, SG200Δ19A formed appressoria on the plant surface, proliferated inside plant tissue and differentiated teliospores, at a late time point comparable to infections with SG200. This explains, why spores had not been detected in the previous study [12] and illustrated that the 19A mutant could undergo biotrophic development and complete the life cycle (Figure 1B). With respect to macroscopic symptoms, tumor formation was abolished and instead chlorotic and necrotic areas became apparent (Figure 1C). In addition, anthocyanin accumulation was completely abolished in mutant infected tissue, while prominent anthocyanin stained regions were observed in leaves infected by SG200 (Figure 1C).
To identify the genes contributing to the phenotype of the cluster 19A mutant, a series of strains was generated carrying sub-deletions of cluster 19A. At first, we divided cluster 19A into two parts which we designate 19A-1 (left half region of cluster 19A) and 19A-2 (right half region of cluster 19A) (Figure 1A) and generated respective deletion mutants. When tested for phenotype after seedling infection in comparison to SG200, SG200Δ19A-1 showed a dramatic reduction of tumor formation and loss of anthocyanin accumulation. The effects were comparable to infections with SG200Δ19A. Conversely, SG200Δ19A-2 was only weekly attenuated in virulence and was able to elicit anthocyanin accumulation (Figure 1C and Figure 3). To determine possible differences in the efficiency of plant colonization by SG200 and the different derived mutant strains, we analyzed fungal biomass in colonized tissue by quantitative real time PCR using U. maydis peptidylprolyl isomerase (ppi) and Z. mays glyceraldehyde 3-phosphate dehydrogenase (GAPDH) as reference genes for quantifying fungal and plant biomass, respectively [15], [21]. At 2 days post infection (dpi), fungal biomass of SG200Δ19A, SG200Δ19A-1 and SG200Δ19A-2 was comparable to the SG200 infection (Figure 1D, left panel). At 6 dpi, however, fungal biomass of SG200Δ19A and SG200Δ19A-1 was lower compared to SG200 (Figure 1D, right panel), suggesting growth defects of these mutant strains at this later time point where massive fungal proliferation inside tumors is observed in SG200 infected tissue. Fungal biomass of SG200Δ19A-2 lacking the right half of cluster 19A was not significantly different from SG200 (Figure 1D), consistent with the weak effect of this deletion on virulence. These results indicated that the major effector genes responsible for the phenotype of the cluster 19A mutant after seedling infection must reside in the left half of cluster 19A.

To determine the contribution to virulence of the 14 genes located in the left half of cluster 19A, we divided the region into four parts, 19A-1a, 19A-1b, 19A-1c and 19A-1d making sure that existing gene families were deleted simultaneously (Figure 3A). Respective deletion mutants were generated and assayed for tumor formation and ability to elicit anthocyanin accumulation (Figure 3B,C). Of these four mutants SG200Δ19A-1a and SG200Δ19A-1c did show a small reduction of tumor formation, but this was not statistically significant (Figure 3B). The deletion of 19A-1b and 19A-1d significantly lowered tumor formation with 19A-1d showing the strongest effect (Figure 3B). Anthocyanin accumulation was abolished by the deletion of 19A-1c and was unaffected in infections with the other sub-deletion mutants (Figure 3C). A triple deletion generated by combining 19A-1b, 19A-1c and 19A-1d deletions resulted in a mutant strain (SG200Δ19A-1bcd) that was severely reduced in tumor formation and failed to induce anthocyanin, comparable to the deletion strain lacking the left half of cluster 19A (SG200Δ19A-1). This firmly establishes that region 19A-1a does not measurably contribute to virulence (Figure 3B).
Based on the finding that the um05318 gene in U. maydis cluster 19A has three paralogous genes at a syntenic position in cluster 19A of S. reilianum [7] (Figure 2) that contribute to virulence in S. reilianum (H. Ghareeb and J. Schirawski, personal communication), we decided to delete the two rightmost genes in U. maydis cluster 19A (19A-2e, Figure 3A). This was done also to rule out that the lack of a virulence phenotype when deleting the entire right half (Δ19A-2, Figure 3B) is caused by balancing positive and negative effects of effector gene deletions on virulence [12]. The resulting strain designated SG200Δ19A-2e showed weakly attenuated tumor formation that was comparable to strain SG200Δ19A-2 deleted for the entire right half of the cluster and this was again not statistically relevant (Figure 3B).
Identification of major effector genes contributing to cluster 19A deletion phenotypes
To identify the major effector genes that contribute most strongly to the virulence phenotype of sub-clusters 19A-1b, 19A-1c, 19A-1d and 19A-2e, we initially generated overlapping sub-deletions and tested them for virulence (not shown). For example, the cluster 19A-1d region was subdivided into a double deletion of um05305/um05306 and a double deletion of um05306/um10556, respectively. These double mutants were tested for virulence and in this case only the double deletion of um05306/um10556 was affected in virulence, allowing the conclusion that um10556 is the responsible gene (not shown). This was then followed up by single deletions of the genes identified in this approach (Figure 4A). With respect to 19A-1b comprising five related genes designated tin1-1 to tin1-5, we were unable to identify the respective major individual effector gene(s), as the observed effects of further sub-deletions on tumor formation could no longer be assessed as being statistically relevant (data not shown). This suggested that these five members of the same gene family (Figure 2) contribute weakly but additively to virulence. Complementation experiments where all 5 genes were re-introduced in strain SG200Δ19A-1b revealed that the weak virulence phenotype of the 19A-1b deletion could be complemented (Figure 4B). For the region 19A-1c the deletion of um05302 (designated tin2) showed a comparable reduction in virulence to the deletion of the entire 19A-1c region. In addition, the deletion of tin2 abolished anthocyanin induction (Figure 4B,C). The introduction of a single copy of tin2 into SG200Δtin2 complemented the weakly reduced tumor formation as well as anthocyanin accumulation (Figure 4B,C). The single deletion of um10556 (designated tin3) significantly affected tumor formation (Figure 4B). Also in this case, tumor formation could be restored to a level comparable to SG200 by introducing tin3 in single copy (Figure 4B). After infection, the single gene deletion mutant of um05318 (designated tin4) showed a lower incidence of plants with stronger disease symptoms than SG200 infected plants (Figure 4B). Upon complementation, this disease category was increased compared to SG200Δtin4 and more plants showed heavy tumors and were stunted or dead (Figure 4B). This suggests a weak contribution of tin4 to tumor formation. With respect to um05319 (designated tin5), the single gene deletion had minor effects on virulence and the reintroduction of the gene did not significantly change the disease scores (Figure 4B).

Plant responses to cluster 19A mutants
The analysis of single effector gene mutants for cluster 19A revealed in general, that deletions of individual genes (with the exception of tin3) had only minor or statistically non-substantial effects on virulence (Figure 4B), suggesting that the strong virulence defect observed in the entire cluster 19A deletion is due to additive effects and/or concerted action of several effectors. To visualize this and to obtain evidence whether individual effectors target distinct plant processes, we decided to analyze the plant responses to infection by the 19A deletion strain as well as to several single effector gene mutants on the transcriptome level. Maize seedlings were infected by SG200Δ19A, SG200Δ19A-1b, SG200Δtin3, SG200Δtin4 and SG200Δtin5. RNA was extracted from infected plant material harvested at 4 dpi, a time point where the individual mutants should not differ in fungal biomass as assessed from the analysis of sub-deletions (Figure 1D). Three biological replicates were prepared and analyzed by Affymetrix maize genome microarrays. For technical reasons, the expression data for plants infected with the SG200Δtin2 mutant strain could not be included in this comparative transcriptome analysis.
Maize gene expression profiles of tissue infected with cluster mutant strains were compared to profiles of SG200 infected and mock-treated plants, which had been generated in our previous study on the transcriptional responses of maize to U. maydis and had been used as reference in the analysis of plant responses to pep1 and pit2 effector mutants [9], [15], [17]. RMA-normalized microarray data were then subjected to a one-way ANOVA and contrast gene lists were generated using a fold change of ±2 and a corrected p-value of 0.05 as cutoffs (Table S1). Expression of a set of 13 genes differentially regulated after infection with different mutant strains was subsequently analyzed by quantitative real-time PCR (qRT-PCR) with RNA from independently generated infected plant material, and this allowed validating the array results (Figure S2).
Compared to SG200 infected samples, 1816 maize genes were differentially regulated in response to SG200Δ19A (Table S1). A hierarchical clustering of these 1816 genes was performed for the whole data set to visualize the relations between the transcriptional responses to the individual U. maydis strains (Figure 5A). As expected, the maximal distance in gene expression was between SG200 infections and infections by the SG200Δ19A mutant, which caused only very weak disease symptoms and thus displayed the highest similarity to the mock-inoculated plants (Figure 5A). On the other hand SG200Δ19A-1b infections showed highest similarity to SG200 infections, illustrating that the 5 tin1 effector genes have only a weak contribution to plant responses, which is in line with their weak effect on virulence. Profiles of plant responses to strains carrying tin gene deletions clearly discriminated SG200Δtin3 and SG200Δ19A-1b, while responses to SG200Δtin4 and SG200Δtin5 infections were not separated by the hierarchical clustering (Figure 5A), indicating that similar responses were elicited by tin4 and tin5 mutants.
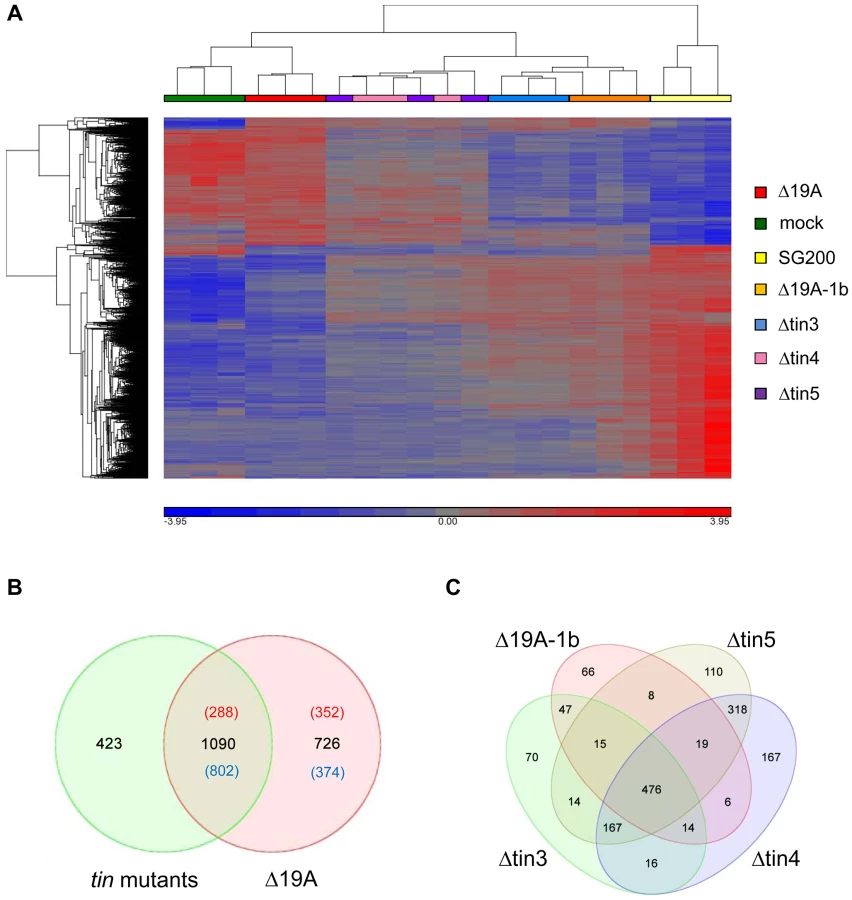
We also combined the transcriptional responses elicited by each of the four individual tin mutant strains to be able to compare this to the response elicited by SG200Δ19A, the strain carrying the full deletion of cluster 19A and to reveal contributions of genes not deleted individually. In total, 1513 maize genes were differentially regulated by the four tin mutants compared to SG200 infections, while 1816 genes were differentially regulated after infection with the cluster deletion mutant SG200Δ19A (Figure 5B). Interestingly, a comparison of these combined “responses to individual tin gene deletions” to the SG200Δ19A responsive genes showed only a partial overlap of differentially regulated transcripts (Figure 5B). Of the 726 genes differentially expressed in response to the whole cluster mutant but not detected in the “responses to individual tin gene deletions” 352 genes were induced and 374 genes were repressed (Figure 5B). Among the induced transcripts, particularly biotin synthesis genes were induced specifically in SG200Δ19A infected tissue, while plant cellulose synthesis genes were downregulated after infection by the Δ19A deletion strain (Table S2 and Figures S3 and S4). In addition, several anthocyanin biosynthesis related genes were downregulated after infection with the cluster 19A mutant while they were not included as differentially expressed in “responses to individual tin gene deletions” (Table S2). This most likely indicates a contribution of the Tin2 effector to anthocyanin induction, and reflects that plant responses to the tin2 deletion strain could not be included in “responses to individual tin gene deletions” for technical reasons. Of the 1090 “shared differentially regulated plant genes”, 288 genes were induced, while 802 genes were downregulated (Figure 5B). Induced genes comprised pathogen response genes such as PR4, PR5 and several oxidases, demonstrating an elevated plant defense in response to tin gene and cluster 19A mutant strains (Table S2). Downregulated transcripts were strongly enriched for genes involved in DNA-metabolism and DNA-modification, particularly histones and DNA-methyltransferases (Table S2 and Figure S5). This most likely reflects the reduced tumor formation observed in all the mutants compared to SG200. On the other hand, 423 genes were differentially regulated after infections with the tin mutant strains (Figure 5B) but these were not differentially regulated after infection with the cluster 19A mutant. Among these 423 genes, several chitinases and peroxidases were found (Table S2).
To get clues on the possible roles of the tin genes during host colonization we next visualized the differentially regulated plant genes in response to individual tin mutants. This analysis revealed that 476 maize genes were commonly regulated by all four mutants, while 1027 genes only responded to a subset of tin mutants (Figure 5C). The smallest number of specifically regulated maize genes was found after infections with the SG200Δ19A-1b mutant, which lacks the five related tin1 effector genes, i.e. this mutant shared 73% (476 out of 651) of differentially regulated genes with all other strains. Amongst the 66 plant genes that were specifically regulated after SG200Δ19A-1b infections, four maize endochitinase genes were significantly induced compared to SG200 infected leaves. In addition, transcript levels of two salicylic acid binding proteins and peroxidase-12, which was found to be involved in the maize apoplastic oxidative burst [16], were induced (Table S3). This suggests that tin1 genes modulate basal defenses.
The tin3 mutant specifically affected the differential regulation of 70 maize genes (Table S3). Conspicuously, sucrose synthase and several transcription factors including auxin-response factors were induced suggesting a link to the reduced ability for tumor formation.
After infections by tin4 and tin5 mutant strains the majority of differentially expressed maize genes were shared (Figure 5C), which is in accordance with the hierarchical clustering result which places these two strains closely together (Figure 5A). Nevertheless, 167 genes were only differentially regulated by the tin4 mutant and 110 maize transcripts were differentially regulated in infections by the tin5 mutant (Figure 5C and Table S3). Although tin4 and tin5 mutants displayed an indistinguishable virulence behavior, they elicited distinct molecular responses in maize. This appears to be a general feature and for example also holds for a strain carrying the 19A-1b deletion (Figure 3B) where virulence is only weakly attenuated. When the 10 most strongly induced host genes are compared after SG200Δ19A-1b infection, only one gene was among the top 10 genes upregulated after infection with SG200Δtin3, SG200Δtin4 or SG200Δtin5, respectively (Table S1).
Gene ontology enrichment analyses were performed for the plant genes upregulated after infection by the three single tin gene deletion strains SG200Δtin3, SG200Δtin4 and SG200Δtin5 (Figures S6, S7, S8). Differentially enriched functions for the individual effector deletion strains were visualized and in addition genes corresponding to the enriched functions are listed (Figure 6 and Table S4). This revealed that statistically distinct processes were induced in plants infected by the different mutants. For SG200Δtin3, oxidoreductases and carbonate dehydratases were enriched, while SG200Δtin4 infection induced plant genes significantly enriched for functions involved in iron ion binding. In SG200Δtin5 infection, on the other hand, lipoxygenases and serine-carboxypeptidases were induced, which were not as highly upregulated in the other mutants (Figure 6 and Table S4). These results illustrate that plant responses to effector mutants which show no or only weak reductions in macroscopic symptoms can be highly specific and can be used to describe and discriminate mutant phenotypes.

Discussion
In this communication, we have dissected the largest U. maydis effector gene cluster 19A, identified the most relevant effectors for seedling infection and present evidence, that individual effectors target distinct processes in the host plant. It was published before, that the deletion of cluster 19A abolishes tumor formation [12]. We now show that this dramatic phenotype is not associated with a block in biotrophic development. The cluster 19A mutant was still able to complete the life cycle up to the formation of teliospores. However, massive fungal proliferation observed at later stages in tumor tissue in infections with wild type strains was absent, suggesting that the effectors in this cluster are responsible for tumor induction either directly or indirectly but not for growth per se in the infected tissue. The analysis of plant responses elicited by the whole cluster mutant (SG200Δ19A) in comparison to responses to the progenitor strain SG200 revealed that 1816 of the 13,339 maize genes represented on the chip were differentially regulated. The analysis of the maize transcriptome changes observed for the individual effector mutant infections revealed that about 60% of these changes were shared by all mutants, suggesting that they are unspecific. Another aspect of the comparative transcriptome profiling was the finding that there is incomplete overlap between the genes affected by the individual mutants and genes altered in their regulation when the entire cluster is deleted. This could indicate that the effects of individual effector deletions cease to be visible when the entire cluster is deleted, i.e. the dramatic phenotype of the cluster deletion might bury the more subtle physiological changes caused by individual mutants. Our study has also revealed that effectors not studied individually because of their undetectable contribution to virulence after seedling infection, may profoundly affect the metabolic activity of the infected tissue. An example is the observed upregulation of biotin biosynthesis after infection with SG200Δ19A which is not observed in any of the tin mutant infections. In Arabidopsis thaliana it has been shown that biotin is critical for suppressing spontaneous cell death [22]. The fact that biotin biosynthesis appears upregulated may indicate a direct involvement of a specific effector for maintaining a certain level of this essential cofactor. Alternatively, biotin upregulation could be a secondary effect that allows the cluster 19A mutant to grow in the infected tissue. Future array analyses with mutants of cluster 19A not studied here with respect to the plant responses they elicit should allow to separate primary and secondary effects and allow to uncover the effector responsible for the regulation of glycolysis and biotin biosynthesis, respectively.
Among the common genes differentially expressed after infection with all tin mutant strains, we observe an enrichment of upregulated plant defense genes and downregulation of genes involved in DNA metabolism. This is likely to reflect insufficient suppression of plant defenses due to reduced fungal proliferation (or the absence of certain effectors) and reduced plant tumor formation, respectively. Similarly, genes for photosynthesis components were consistently higher expressed after infections with all mutant strains compared to SG200 infections. This is unlikely to reflect an induction of photosynthesis during mutant infections but presumably results from an incomplete shutdown of photosynthesis, usually observed during U. maydis wild type infection [9]. The reduction in plant cell wall biosynthesis gene expression after infection with the cluster 19A mutant, which is not seen in infections with individual tin mutants, likely reflects the reduced ability of the cluster mutant to induce tumors containing enlarged plant cells [15], while individual tin mutants can still induce tumors.
With a minor impact on tumor formation, Tin2 was specifically responsible for anthocyanin accumulation in infected tissue while all other individual mutants showed anthocyanin induction. The transcriptome analysis revealed that several anthocyanin biosynthesis genes were upregulated in all the individual tin mutant strains but not after infection with SG200Δ19A lacking the whole cluster including tin2 (Table S1). This suggests that Tin2 is directly responsible for inducing these anthocyanin biosynthesis genes. Anthocyanin has been hypothesized to have a protective role against abiotic stresses [23], and can be induced after biotic stress, although its role here is unclear [24].
While the virulence assays for tin4 and tin5 mutant strains were largely uninformative because of limited assay sensitivity, the transcriptome analysis revealed that tin4 and tin5 mutants elicited a series of plant responses that were mutant specific, but in addition 318 differentially regulated plant genes were differentially regulated by tin4 as well as tin5 mutant strains. Based on the fact that Tin4 and Tin5 share 19% identity and 39% amino acid similarity this could indicate that these effectors are in the process of diversification to different functions (167 tin4 specifically regulated transcripts, 110 tin5 specifically regulated transcripts) while still maintaining some of the original common functions (318 commonly regulated transcripts). This interpretation would also make sense in view of the fact that um05312, um05314, um10557 and um05317 which are also related to tin4 and tin5 (Fig. S1E) were not individually deleted in this study. If all of the genes in this family had redundant functions, we would not have expected to see differences in the host responses to the tin4 and tin5 mutants. The gene ontology enrichment analysis showed that several genes involved in iron metabolism/uptake were specifically upregulated when tin4 is missing. Elevated iron availability may directly affect the activity of the respiratory burst oxidase requiring a heme prosthetic group to generate superoxide [25]. Such effects on plant defense have also been described after infections by Erwinia crysanthemi [26] and Blumeria graminis f. sp. tritici [27]. After tin5 mutant infections lipoxygenases and serine-carboxypeptidases were specifically upregulated, and both types of enzymes have been associated with defense [28], [29]. OsBISCPL1, a serine-carboxypeptidase from rice, was up-regulated in incompatible interactions between rice and the blast fungus, and was implicated in regulation of defense responses from heterologous expression studies [30]. In S. reilianum three orthologs of tin4 are present (sr10075, sr10077 and sr10079; Figure 2). The simultaneous deletion of the neighboring genes sr10073, sr10075, sr10077 and sr10079 weakly affected S. reilianum virulence (H. Ghareeb and J. Schirawski, personal communication), similar to what we observe for the tin4, tin5 double mutant of U. maydis. As in U. maydis, the left half of cluster 19A contributes most strongly to virulence in S. reilianum (H. Ghareeb and J. Schirawski, personal communication). Based on the observation that cluster 19A effector genes of U. maydis are not essential for tumor formation in tassel (although tumor size in tassel was reduced after infection with SG200Δ19A) [14], we consider organ-specificity of effector function more likely to explain this finding. As S. reilianum does not induce tumors in leaves and develops disease symptoms only in the cob and in the tassel, this species may not need effector genes like tin3 for tumor induction in vegetative tissues of the maize plant. Consistent with this is our observation that the U. maydis cluster 19A mutant lacking all 24 effectors can still show biotrophic growth in plant tissue and thus behaves like S. reilianum (except for the systemic spread). Interestingly, two of the Tin4 orthologs of S. reilianum, sr10075 and sr10077, were recently shown to suppress apical dominance after maize infection (H. Ghareeb, F. Drechsler, C. Löfke, T. Teichmann and J. Schirawski, personal communication). The effect on apical dominance is a late phenotype observed about six weeks after infection of maize plants with S. reilianum, i.e. a time point not covered by our assays. To ascertain whether Tin4, Sr10075 and Sr10077 have conserved functions it would be interesting to test whether tin4 of U. maydis can complement the apical dominance phenotype of the respective S. reilianum mutants.
Tin1-1 to Tin1-5 is a group of weakly related U. maydis effectors, which could not be functionally separated because their individual effects on virulence were too small to be reliably detected. The transcriptome changes of plants infected with a mutant lacking all five related genes revealed specific, strong inductions of endochitinases, SA-binding proteins and the apoplastic peroxidase POX12. POX12 was recently shown to be inhibited by the U. maydis effector Pep1 leading to a suppression of the PAMP-triggered oxidative burst [16]. In addition, an NBS-LRR class disease resistance gene (Zm.3568.1) that could be involved in PAMP perception, showed transcriptional induction specifically after SG200Δ19A-1b infections. Together, these changes indicate an enhanced defense response against the 19A-1b deletion mutant, which suggests that the Tin1-1 to Tin1-5 effectors contribute to the suppression of basal host immunity. Interestingly, the immune response triggering avirulence factor, UhAvr1 (UHOR_10022, Figure 2), of U. hordei is most closely related to the U. maydis effector Tin1-2 and Tin1-3 [31]. With respect to virulence no specific contribution of UhAvr1 could be detected [31], which may be consistent with the very small contribution to virulence that is seen when all five tin1 genes are deleted.
Tin3 is the effector in cluster 19A, which contributes most strongly to virulence. The strong transcriptional induction of two sucrose synthases after infection with the tin3 mutant strain (as well as after infection with the cluster 19A mutant) is likely to reflect enhanced photosynthetic activity in contrast to infections with SG200 where the transition from a juvenile sink tissue to a mature, photosynthetically active source tissue is blocked in infected leaves [9]. If an interplay between sucrose and auxin signaling, which was established in A. thaliana [32] also exists in maize; this could explain the observed upregulation of several auxin response factors after infection with these mutant strains. The specific upregulation of a WRKY transcription factor after infection with the cluster 19A mutant as well as the tin3 mutant could indicate elevated defense responses [33], which are downregulated by Tin3 after infections with wild type strains. Alternatively, this regulatory gene might negatively control cell cycle and/or cell expansion, a feature of U. maydis induced tumors [9]. Another gene exclusively upregulated after infection with strains deleted for tin3 or cluster 19A is cytokinin oxidase 3, an enzyme involved in cytokinin degradation. Cytokinin oxidases have been shown to restrict cell division and to regulate the sink capacity of kernels [34]. Thus, the downregulation of these activities by Tin3, presumably after uptake of Tin3 by plant cells, might be necessary for tumor development.
The finding of discrete plant responses after infection with individual effector mutants provides important leads for the functional analyses that can now be followed. For example, the predicted changes in hormone levels attributed to Tin3 could be determined from metabolic profiles or directly connected with Tin3 by transiently expressing Tin3 in plants with appropriate reporter gene constructs. The expression of Tin3 in transgenic plants might even allow assessing, whether the predicted effects on photosynthesis are direct or indirect.
In more general terms our analyses reveal the power of studying pathogen effector mutants, by combining virulence assays with an assessment of plant responses to these mutants. Such comparisons do not only reveal common plant responses that reflect central processes targeted by the infection but in addition provide specific leads to the function of individual effectors. Furthermore, this approach does not rely on a significant virulence phenotype of the effector mutants studied and may thus be highly useful for the analysis of the vast majority of eukaryotic pathogen effectors that fall into this class [35], [36].
Materials and Methods
Fungal strains, growth conditions and plant infections
U. maydis strains were grown in YEPSL (0.4% yeast extract, 0.4% peptone, 2% sucrose) with shaking at 28°C at 200 rounds min−1 (rpm), to an optical density (OD600) of 0.6–0.8. Cells were centrifuged at 3000 g for 5 min, resuspended in H2O to an OD600 of 1 and used for syringe infection of 7-day-old maize seedlings (variety Early Golden Bantam, Olds Seeds, Madison). At least 3 biological replicates were tested for virulence and disease was scored 12 dpi following described protocols [12]. To demonstrate the statistical differences of disease symptoms in the mutants compared to SG200 each of the symptoms was tested by Student's t-test (** p-values<0.01.) and corrected by Bonferroni correction for multiple testing. The haploid solopathogenic strain SG200 [12] was used for virulence assays and all mutations were introduced into this background.
Strain construction
Standard molecular cloning strategies and techniques were applied [37]. All U. maydis strains (Table S5) are derived from the solopathogenic strain SG200 and were generated by a PCR-based gene replacement approach using primers listed in Table S6 or, for complementation experiments, by insertion of p123 derivatives into the ip locus as described [38]. Deletion endpoints are depicted in the respective Figures. Constructs used for complementation contained the respective gene plus the promoter region extending up to the next gene plus the Tnos terminator. All generated constructs were sequenced prior to U. maydis transformation (Table S7). Isolated U. maydis transformants were tested for integration events in the desired loci by southern analysis. For the complementation constructs, single copy integrations into the ip locus were selected by southern analysis. For 3 strains only derivatives containing two inserts could be obtained, this is marked in the strain list (Table S5).
Quantitative real time PCR
For quantification of relative fungal biomass in infected maize leaves 7-day-old maize seedlings were infected with SG200, SG200Δ19A, SG200Δ19A-1 and SG200Δ19A-2 and a section of the third leaf between 1 and 3 cm below the injection site was harvested after 2 dpi and 6 dpi. For genomic DNA extraction leaf material was frozen in liquid nitrogen, ground to powder, and extracted using a phenol-based protocol modified from Hoffman and Winston [39]. The qRT-PCR analysis was performed using an iCycler (Bio-Rad) in combination with the Platinum SYBR Green Supermix (Invitrogen). U. maydis biomass was quantified with primers PPI-fw (5′-ACATCGTCAAGGCTATCG-3′) and PPI-re (5′-AAAGAACACCGGACTTGG-3′) amplifying the fungal ppi gene. Maize glyceraldehyde dehydrogenase was amplified with primers GAPDH-F (5′ - CTTCGGCATTGTTGAGGGTTTG-3′) and GAPDH-R (5′ - TCCTTGGCTGAGGGTCCGTC-3′) [15] and served as reference gene for normalization. Relative amounts of fungal DNA (ppi) were then calculated relative to the amount of GAPDH DNA using the cycle threshold (Ct)2−ΔΔCt method [40]. Three biological replicates were combined and p-values were determined by using Student's t-test (** p-values<0.01.).
To validate the expression data of the microarray experiment 13 maize genes differentially regulated after infection with different mutant strains were subsequently analyzed by qRT-PCR. Infected plant material was generated as described for the microarray experiment and used for RNA extraction with Trizol (Invitrogen, Karlsruhe, Germany). After extraction, the first-strand cDNA synthesis kit (Invitrogen) was used to reverse transcribe 3 µg of total RNA with oligo(dT) Primers. The qRT-PCR analysis was performed using an iCycler (Bio-Rad) in combination with the SYBR Green Supermix (Invitrogen). Primers used for quantification of maize gene transcription levels are listed in Table S6. Gene expression levels were calculated relative to GAPDH expression levels using the cycle threshold (Ct)2−ΔΔCt method [40].
DNA microarray analysis
For the microarray experiments, maize plants (Early Golden Bantam) grown under defined conditions in a growth chamber were infected with SG200Δ19A-1b, SG200Δtin2, SG200Δtin3, SG200Δtin4 and SG200Δtin5 as described previously [15]. Samples of infected tissue were collected 4 dpi by excising a section of the third leaf between 1 and 3 cm below the injection site. For RNA extraction, material from >20 plants per experiment was combined, ground to powder on constant liquid nitrogen and RNA was extracted with Trizol (Invitrogen, Karlsruhe, Germany). RNA was purified applying the RNeasy kit (Qiagen, Hilden, Germany). Affymetrix maize genome microarrays were performed in three biological replicates, using standard Affymetrix protocols (Midi_Euk2V3 protocol on GeneChip Fluidics Station 450; scanning on Affymetrix GSC3000G). Expression data were submitted to GeneExpressionOmnibus (http://www.ncbi.nlm.nih.gov/geo/) (Accession Number: GSE48406).
Previously published Affymetrix data for SG200 infections [9] (GEO accession Number: GSE10023) and the microarrays performed in this study were analyzed together using the Partek microarray software suite version 6.12. Expression values were normalized using the RMA method. Criteria for significance were a corrected p-value (per sample) with a FDR of 0.05 and a fold-change of >2. Differentially expressed genes were calculated by a 1-way ANOVA model using method of moments [41].
Microscopy
For microscopic analysis of different life cycle stages of U. maydis strains SG200 and SG200Δ19A, a section of the third leaf between 1 and 3 cm below the injection site was excised after 1 dpi, 13 dpi and 30 dpi. We used a Zeiss Axiophot with differential interference contrast (DIC) optics for microscopic observations. The pictures were taken using a CCD camera (C4742-95, Hamamatsu). To visualize penetration events, appressoria were stained with calcofluor white (100 µg/ml; Fluorescent Brightener 28, Sigma-Aldrich, Deisenhofen) for 1 min. Intracellular growing fungal hyphae were stained with chlorazol black E using an established protocol [42].
Supporting Information
Zdroje
1. BrefortT, DoehlemannG, Mendoza-MendozaA, ReissmannS, DjameiA, et al. (2009) Ustilago maydis as a pathogen. Annu Rev Phytopathol 47 : 423–445.
2. VollmeisterE, SchipperK, BaumannS, HaagC, PohlmannT, et al. (2012) Fungal development of the plant pathogen Ustilago maydis. FEMS Microbiol Rev 36 : 59–77.
3. Mendoza-MendozaA, BerndtP, DjameiA, WeiseC, LinneU, et al. (2009) Physical-chemical plant-derived signals induce differentiation in Ustilago maydis. Mol Microbiol 71 : 895–911.
4. SchirawskiJ, BohnertHU, SteinbergG, SnetselaarK, AdamikowaL, et al. (2005) Endoplasmic reticulum glucosidase II is required for pathogenicity of Ustilago maydis. Plant Cell 17 : 3532–3543.
5. BauerR, OberwinklerF, VankyK (1997) Ultrastructural markers and systematics in smut fungi and allied taxa. Can J Bot 75 : 1273–1314.
6. DoehlemannG, WahlR, VranesM, de VriesRP, KaemperJ, et al. (2008) Establishment of compatibility in the Ustilago maydis/maize pathosystem. J Plant Physiol 165 : 29–40.
7. SchirawskiJ, MannhauptG, MuenchK, BrefortT, SchipperK, et al. (2010) Pathogenicity determinants in smut fungi revealed by genome comparison. Science 330 : 1546–1548.
8. LaurieJD, AliS, LinningR, MannhauptG, WongP, et al. (2012) Genome comparison of barley and maize smut fungi reveals targeted loss of RNA silencing components and species-specific presence of transposable elements. Plant Cell 24 : 1733–1745.
9. DoehlemannG, WahlR, HorstRJ, VollLM, UsadelB, et al. (2008) Reprogramming a maize plant: transcriptional and metabolic changes induced by the fungal biotroph Ustilago maydis. Plant J 56 : 181–195.
10. van der LindeK, HemetsbergerC, KastnerC, KaschaniF, van der HoornRAL, et al. (2012) A maize cystatin suppresses host immunity by inhibiting apoplastic cysteine proteases. Plant Cell 24 : 1285–1300.
11. WenzlerH, MeinsF (1987) Persistent changes in the proliferative capacity of maize leaf tissues induced by Ustilago infection. Physiol Mol Plant Pathol 30 : 309–319.
12. KaemperJ, KahmannR, BoelkerM, MaL-J, BrefortT, et al. (2006) Insights from the genome of the biotrophic fungal plant pathogen Ustilago maydis. Nature 444 : 97–101.
13. MuellerO, KahmannR, AguilarG, Trejo-AguilarB, WuA, et al. (2008) The secretome of the maize pathogen Ustilago maydis. Fungal Genet Biol 45: S63–S70.
14. SkibbeDS, DoehlemannG, FernandesJ, WalbotV (2010) Maize tumors caused by Ustilago maydis require organ-specific genes in host and pathogen. Science 328 : 89–92.
15. DoehlemannG, van der LindeK, AssmannD, SchwammbachD, HofA, et al. (2009) Pep1, a secreted effector protein of Ustilago maydis, is required for successful invasion of plant cells. PLoS pathogens 5: e1000290–e1000290.
16. HemetsbergerC, HerrbergerC, ZechmannB, HillmerM, DoehlemannG (2012) The Ustilago maydis effector Pep1 suppresses plant immunity by inhibition of host peroxidase activity. PLoS Pathog 8: e1002684 doi:10.1371/journal.ppat.1002684
17. DoehlemannG, ReissmannS, AssmannD, FleckensteinM, KahmannR (2011) Two linked genes encoding a secreted effector and a membrane protein are essential for Ustilago maydis-induced tumour formation. Mol Microbiol 81 : 751–766.
18. MuellerAN, ZiemannS, TreitschkeS, AssmannD, DoehlemannG (2013) Compatibility in the Ustilago maydis-maize interaction requires inhibition of host cysteine proteases by the fungal effector Pit2. PLoS Pathog 9: e1003177 doi:10.1371/journal.ppat.1003177
19. DjameiA, SchipperK, RabeF, GhoshA, VinconV, et al. (2011) Metabolic priming by a secreted fungal effector. Nature 478 : 395–398.
20. WahlR, ZahiriA, KaemperJ (2010) The Ustilago maydis b mating type locus controls hyphal proliferation and expression of secreted virulence factors in planta. Mol Microbiol 75 : 208–220.
21. van der LindeK, KastnerC, KumlehnJ, KahmannR, DoehlemannG (2011) Systemic virus-induced gene silencing allows functional characterization of maize genes during biotrophic interaction with Ustilago maydis. New Phytol 189 : 471–483.
22. LiJ, BraderG, HeleniusE, KariolaT, PalvaET (2012) Biotin deficiency causes spontaneous cell death and activation of defense signaling. Plant J 70 : 315–326.
23. Chalker-ScottL (1999) Environmental significance of anthocyanins in plant stress responses. Photochem Photobiol 70 : 1–9.
24. SteynWJ, WandSJE, HolcroftDM, JacobsG (2002) Anthocyanins in vegetative tissues: a proposed unified function in photoprotection. New Phytol 155 : 349–361.
25. VignaisPV (2002) The superoxide-generating NADPH oxidase: structural aspects and activation mechanism. Cell Mol Life Sci 59 : 1428–1459.
26. SegondD, DellagiA, LanquarV, RigaultM, PatritO, et al. (2009) NRAMP genes function in Arabidopsis thaliana resistance to Erwinia chrysanthemi infection. Plant J 58 : 195–207.
27. LiuG, GreenshieldsDL, SammynaikenR, HirjiRN, SelvarajG, et al. (2007) Targeted alterations in iron homeostasis underlie plant defense responses. J Cell Sci 120 : 596–605.
28. JooY-C, OhD-K (2012) Lipoxygenases: Potential starting biocatalysts for the synthesis of signaling compounds. Biotechnol Adv 30 : 1524–1532.
29. FengY, XueQ (2006) The serine carboxypeptidase like gene family of rice (Oryza sativa L. ssp japonica). Funct Integr Genomic 6 : 14–24.
30. LiuH, WangX, ZhangH, YangY, GeX, et al. (2008) A rice serine carboxypeptidase-like gene OsBISCPL1 is involved in regulation of defense responses against biotic and oxidative stress. Gene 420 : 57–65.
31. AliS, LaurieJD, LinningR, Cervantes-ChávezJA, GaudetD, et al. (2014) An immunity-triggering effector from the barley smut fungus Ustilago hordei resides in an Ustilaginaceae-specific cluster bearing signs of transposable element-assisted evolution. PLoS Pathog 10: e1004223.
32. StokesME, ChattopadhyayA, WilkinsO, NambaraE, CampbellMM (2013) Interplay between sucrose and folate modulates auxin signaling in arabidopsis. Plant Physiol 162 : 1552–1565.
33. MillerG, ShulaevV, MittlerR (2008) Reactive oxygen signaling and abiotic stress. Physiol Plantarum 133 : 481–489.
34. MassonneauA, Houba-HérinN, PetheC, MadzakC, FalqueM, et al. (2004) Maize cytokinin oxidase genes: differential expression and cloning of two new cDNAs. J Exp Bot 55 : 2549–2557.
35. RafiqiM, EllisJG, LudowiciVA, HardhamAR, DoddsPN (2012) Challenges and progress towards understanding the role of effectors in plant-fungal interactions. Curr Opin Plant Biol 15 : 477–482.
36. WinJ, KrasilevaKV, KamounS, ShirasuK, StaskawiczBJ, et al. (2012) Sequence divergent RXLR effectors share a structural fold conserved across plant pathogenic oomycete species. PLoS Pathog 8: e1002400 doi:10.1371/journal.ppat.1002400
37. Sambrook J, Fritsch EF, Maniatis T (1989) Molecular Cloning: A Laboratory Manual. Cold Spring Harbor, NY: Cold Spring Harbor Laboratory Press.
38. LoubradouG, BrachmannA, FeldbruggeM, KahmannR (2001) A homologue of the transcriptional repressor Ssn6p antagonizes cAMP signalling in Ustilago maydis. Mol Microbiol 40 : 719–730.
39. HoffmanCS, WinstonF (1987) A ten-minute DNA preparation from yeast efficiently releases autonomous plasmids for transformation of E. coli. Gene 57 : 267–272.
40. LivakKJ, SchmittgenTD (2001) Analysis of relative gene expression data using real-time quantitative PCR and the 2((−ΔΔC(T)) Method. Methods 25 : 402–408.
41. EisenhartC (1947) The assumptions underlying the analysis of variance. Biometrics 3 : 1–21.
42. BrachmannA, SchirawskiJ, MullerP, KahmannR (2003) An unusual MAP kinase is required for efficient penetration of the plant surface by Ustilago maydis. EMBO J 22 : 2199–2210.
43. ZhengQ, WangX-J (2008) GOEAST: a web-based software toolkit for Gene Ontology enrichment analysis. Nucleic Acids Res 36: W358–W363.
Štítky
Hygiena a epidemiologie Infekční lékařství LaboratořČlánek vyšel v časopise
PLOS Pathogens
2014 Číslo 7
- Parazitičtí červi v terapii Crohnovy choroby a dalších zánětlivých autoimunitních onemocnění
- Vakcíny proti klíšťové encefalitidě
- Kdy je nejlepší očkovat
- Možné vedlejší účinky očkování
- Imunogenita vakcín
Nejčtenější v tomto čísle
- Molecular and Cellular Mechanisms of KSHV Oncogenesis of Kaposi's Sarcoma Associated with HIV/AIDS
- Holobiont–Holobiont Interactions: Redefining Host–Parasite Interactions
- BCKDH: The Missing Link in Apicomplexan Mitochondrial Metabolism Is Required for Full Virulence of and
- Helminth Infections, Type-2 Immune Response, and Metabolic Syndrome
Zvyšte si kvalifikaci online z pohodlí domova
Mazová zátka a její řešení
nový kurzVšechny kurzy