
Targeted Ablation of and in Retinal Progenitor Cells Mimics Leber Congenital Amaurosis
Development in the central nervous system is highly dependent on the regulation of the switch from progenitor cell proliferation to differentiation, but the molecular and cellular events controlling this process remain poorly understood. Here, we report that ablation of Crb1 and Crb2 genes results in severe impairment of retinal function, abnormal lamination and thickening of the retina mimicking human Leber congenital amaurosis due to loss of CRB1 function. We show that the levels of CRB1 and CRB2 proteins are crucial for mouse retinal development, as they restrain the proliferation of retinal progenitor cells. The lack of these apical proteins results in altered cell cycle progression and increased number of mitotic cells leading to an increased number of late-born cell types such as rod photoreceptors, bipolar and Müller glia cells in postmitotic retinas. Loss of CRB1 and CRB2 in the retina results in dysregulation of target genes for the Notch1 and YAP/Hippo signaling pathways and increased levels of P120-catenin. Loss of CRB1 and CRB2 result in altered progenitor cell cycle distribution with a decrease in number of late progenitors in G1 and an increase in S and G2/M phase. These findings suggest that CRB1 and CRB2 suppress late progenitor pool expansion by regulating multiple proliferative signaling pathways.
Published in the journal:
. PLoS Genet 9(12): e32767. doi:10.1371/journal.pgen.1003976
Category:
Research Article
doi:
https://doi.org/10.1371/journal.pgen.1003976
Summary
Development in the central nervous system is highly dependent on the regulation of the switch from progenitor cell proliferation to differentiation, but the molecular and cellular events controlling this process remain poorly understood. Here, we report that ablation of Crb1 and Crb2 genes results in severe impairment of retinal function, abnormal lamination and thickening of the retina mimicking human Leber congenital amaurosis due to loss of CRB1 function. We show that the levels of CRB1 and CRB2 proteins are crucial for mouse retinal development, as they restrain the proliferation of retinal progenitor cells. The lack of these apical proteins results in altered cell cycle progression and increased number of mitotic cells leading to an increased number of late-born cell types such as rod photoreceptors, bipolar and Müller glia cells in postmitotic retinas. Loss of CRB1 and CRB2 in the retina results in dysregulation of target genes for the Notch1 and YAP/Hippo signaling pathways and increased levels of P120-catenin. Loss of CRB1 and CRB2 result in altered progenitor cell cycle distribution with a decrease in number of late progenitors in G1 and an increase in S and G2/M phase. These findings suggest that CRB1 and CRB2 suppress late progenitor pool expansion by regulating multiple proliferative signaling pathways.
Introduction
During vertebrate retina development, one type of glial cell and six types of neurons are formed by the orderly generation of post-mitotic cells from a common pool of retinal progenitor cells [1], [2]. In this temporally fine-tuned process, ganglion cells are generated first, followed by horizontal cells, cone photoreceptors and early born amacrine cells, rod photoreceptors and late born amacrine cells, and finally bipolar cells and Müller glial cells [2]. Retinal progenitor cells are elongated and polarized cells that extend along the apicobasal axis and connect to adjoining cells by adherens junctions via their apical processes. The proliferation of the progenitors is carefully regulated through a combination of intrinsic and extrinsic signals followed by a complete cessation of cell division around 10 days after birth in mice [3]. Many extrinsic soluble or membrane-bound factors directly promote proliferation activity such as Notch, sonic Hedgehog and Wnt signalling pathways [4]. In addition, intrinsic regulatory genes and transcription factors such as Chx10 regulate the cell cycle machinery [5].
Recent work suggests that cell adhesion and cell polarity complex proteins play a critical role in the maintenance of the proliferation of the progenitor cells [6]. The polarity proteins that form the Crumbs complex reside at the subapical region adjacent to the adherens junctions between retinal progenitor cells in the developing retina or between photoreceptors and Müller glial cells in mature retinas. The Crumbs protein was first identified in Drosophila as a key developmental regulator of apical-basal polarity [7]. In mammals, the Crumbs homologue family is composed of three genes, CRB1, CRB2 and CRB3. CRB proteins have a large extracellular domain (which is lacking in CRB3) composed of epidermal growth factor and laminin-globular domains, a single transmembrane domain, and an intracellular domain containing FERM and PDZ protein-binding motifs [8]. Through this PDZ motif CRB proteins interact with PALS1, which binds to MUPP1 or PATJ, thus forming the Crumbs complex [8]. Recently, it has been shown that the CRB-interacting partner PALS1 has a role in regulating the proliferation of neural progenitors. Deletion of PALS1 in the developing cortex caused premature exit of progenitors from the cell cycle and massive cell death leading to absence of the cortical structures [9].
Studies suggest a common function of CRB proteins and their partners in regulating growth factor signalling pathways, which orchestrate cell proliferation and cell fate decisions. It has been suggested that Drosophila Crumbs and human CRB2 inhibit Notch1 cleavage and signalling by binding to the presenilin complex, inhibiting γ-secretase activity [10], [11]. Zebrafish CRB extracellular domains can directly bind to the extracellular domain of Notch1 and inhibit its activation [12]. The Crumbs complex can negatively modulate the mammalian Target of Rapamycin Complex 1 (mTORC1) pathway via the direct interaction between PATJ and the tumour suppressor gene TSC2 and depletion of PALS1 protein results in loss of mTORC1 activity in the murine developing cortex [9], [13]. The Hippo pathway is a key regulator of organ size and tumorigenesis in humans and flies [6], [14]. Drosophila Crumbs has been shown to control the Hippo pathway by direct interaction of its FERM domain [15], [16]. Furthermore, PALS1 and PATJ can interact with the effectors of the Hippo pathway Yes-associated Protein (YAP) and transcriptional co-activator with PDZ-binding motif (TAZ) proteins and thus promote their inhibition and retention in the cytoplasm [17].
Mutations in the human CRB1 gene cause autosomal-recessive progressive retinitis pigmentosa and Leber congenital amaurosis (LCA) [18]. LCA is one of the most severe forms of retinal dystrophy leading to blindness around birth due to defects in the development or maturation of the retina [19]. CRB1-LCA retinas are remarkably thick and lack the distinct layers like immature retinas suggesting a developmental defect [20]. The functional roles of CRB proteins during mammalian development remain poorly understood. Both CRB1 and CRB2 are expressed from embryonic day (E)12.5 onwards in the developing murine retina at the subapical region adjacent to adherens junctions in retinal progenitor cells [21]–[23] suggesting a role of the CRB proteins during the development of the retina. Crb1 knockout, Crb1C249W/− knockin and the naturally occurring Crb1rd8/rd8 mutant mice show mild retinal disorganization in adulthood, limited to the inferior quadrant [24]–[27]. Crb2 conditional knockout (cKO) retinas show progressive abnormal lamination of newborn rod photoreceptors and disruption of adherens junctions in postnatal developing retina [22]. Here, we study the effects of loss of CRB1 and CRB2 and their potential overlapping functions during early retinal development. Loss of both CRB1 and CRB2 results in absence of a separate photoreceptor layer, misplaced cell types throughout the retina and loss of retinal function mimicking the phenotype observed in human LCA patients. Our data suggests that the pool of late progenitor cells during retinal development is suppressed by CRB1 and CRB2 through the regulation of mitogenic signaling pathways.
Results
Lack of CRB1 and CRB2 severely impairs retinal function in adult mice
We crossed Crb1 KO mice with conditionally floxed Crb2 mice [22], [24]. The mice were bred with Chx10Cre transgenic mice, which express Cre recombinase fused to GFP throughout the developing retina starting at E11.5 [28]. We showed previously that efficient recombination of the floxed Crb2 alleles occurred around E12.5 [22]. In this study, double homozygote Crb1−/−Crb2F/FChx10CreTg/+ conditional knockout retinas (Crb1Crb2 cKO) were compared to littermate Crb1−/−Crb2F/F and Crb1−/−Crb2F/+Chx10CreTg/+ retinas. Crb1+/−Crb2F/FChx10CreTg/+ (Crb1+/−Crb2 cKO) retinas were compared to littermate double heterozygote Crb1−/+Crb2F/+Chx10CreTg/+ (Crb1+/−Crb2F/+ cKO) retinas. We verified the loss of CRB1 and CRB2 proteins in the Crb1Crb2 cKO at E15.5 and P14 (Figures S4D and S3D).
In vivo functional and structural analysis were performed on 1 to 6 month (M) old Crb1Crb2 cKO, Crb1+/−Crb2 cKO and control mice, using electroretinography, spectral domain optical coherence tomography and scanning laser ophthalmoscopy. Already at 1M, Crb1+/−Crb2 cKO and Crb1Crb2 cKO mice showed more pronounced reduction in amplitudes of electroretinogram responses than Crb2 cKO mice (Figures 1A and S1A). Both scotopic and photopic responses were affected, which indicate alterations of both rod and cone system components. At 3 and 6M (Figures 1B and S1B–C), electroretinogram responses were below detection level, although Crb1+/−Crb2 cKO responses were more variable (Figures 1B and S1B).

In vivo imaging analysis revealed changes in Crb1+/−Crb2 cKO retinas in fundus appearance as well as in retinal layer morphology in contrast to Crb1+/−Crb2F/+ cKO control retinas (Figure S2). With native scanning laser ophthalmoscopy, many spots and patchy areas were visible throughout the retina, corresponding to pseudo-rosettes in the photoreceptor layer and in histological sections (Figures S2B and 2A–B). Already at 1M, spectral domain optical coherence tomography revealed an aberrant layering in Crb1Crb2 cKO retinas (Figure 3E–F). The retina consisted of a single inner plexiform layer, an abnormal thick ganglion cell layer and a second broad nuclear layer (Figure 2A–B). All retinal cell types appeared to be generated, but a separate photoreceptor nuclear layer, inner and outer segment layer and outer plexiform layer were not formed. Two types of rosettes in the broad nuclear layer could be identified and were primarily formed of photoreceptors or ganglion cells and inner nuclear layer cells (Figure 2A–B black arrowheads and asterisks, respectively). Using electron microscopy and immunohistochemistry, we found ectopically localized photoreceptor outer segments, delocalized basal bodies of cilia, adherens junctions and ribbon synapses in the Crb1Crb2 cKO at 1M (Figures 2E–F and S3A,C).
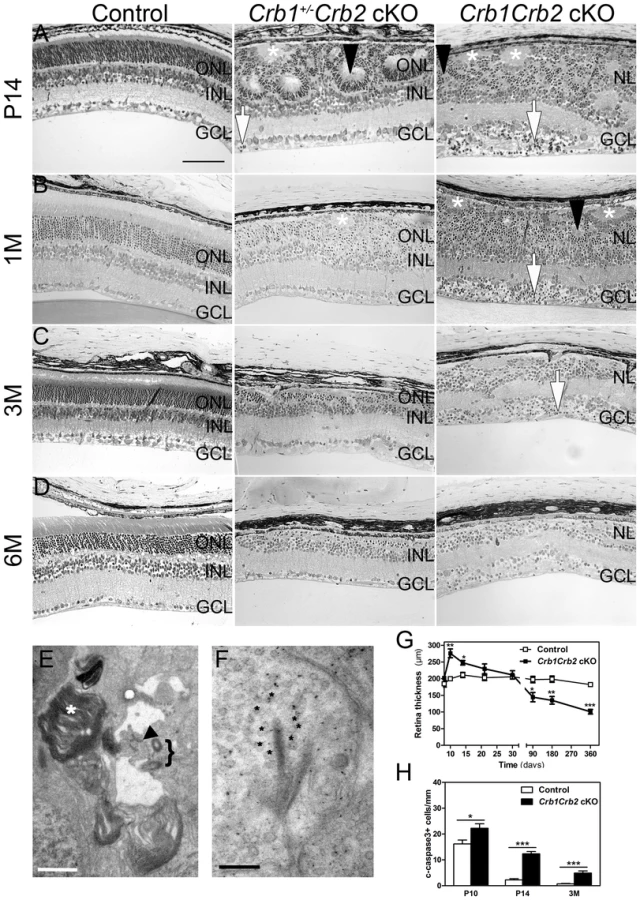

The retina thickness in the Crb1Crb2 cKO was significantly increased compared to control retinas at P10 (276.1±13.2 µm vs 199.7±5.4 µm, respectively) and P14 (247.8±6.9 µm vs 211±7.7 µm, respectively; Figure 2G). Both Crb1Crb2 cKO and Crb1+/−Crb2 cKO retinas degenerate rapidly after 1M, which was associated with retinal vasculature defects leading to the thinning of the retinas in 3–6M retinas (Figures 2C–D, S2 and 3). Quantification of cleaved caspase 3 positive cells showed an increase in the number of apoptotic cells in Crb1Crb2 cKO retinas at P10, P14 and 3M (Figure 2H). Cleaved caspase 3 positive cells at P10 and P14 were identified as rod photoreceptor cells and at 3M mainly as bipolar cells (Figure S3E–F).
CRB1 and CRB2 are essential for proper retinal development
As CRB1 and CRB2 are expressed in the retinal progenitor cells from E12.5 onwards at the subapical region adjacent to adherens junctions [21]–[22] and due to the severe disorganization of these retinas in adult, we analyzed control, Crb1+/−Crb2 cKO and Crb1Crb2 cKO mice from E11.5 to P5. Whereas no visible defects were observed at E11.5 and E12.5, perturbations at the outer limiting membrane and cellular mislocalizations near the retinal pigment epithelium were visible at E13.5 in Crb1Crb2 cKO retinas (Figure 4A, black arrowhead). Between E15.5 and E17.5 in Crb1Crb2 cKO, the adherens junctions were gradually lost and the nuclei of the retinal progenitors showed abnormal orientation, whereas in control retinas, progenitors were arranged radially along the apical-basal axis (Figures 4B–C and S4B). Electron microscopic analyses showed loss of adherens junctions in the neural retina and ectopic nuclei close to the retinal pigment epithelium (Figures 4F–G and S4E–F). During retinogenesis, the photoreceptor layer and the outer plexiform layer formed at P5. However, in the Crb1Crb2 cKO, this process never ensued, as no distinct photoreceptor layer was formed (Figure 4E).

In Crb1+/−Crb2 cKO, perturbations at the outer limiting membrane started at the periphery of the retina at E15.5 (Figure 4B, black arrowhead). It progressively extended to the centre of the retinas where rosettes also formed (Figure 4C–E). In late developmental stages, in addition to photoreceptor rosettes, ganglion cell nuclei and inner nuclear layer cells were found in the outer nuclear layer and some photoreceptor nuclei were found in the ganglion cell layer (Figure 2A). These retinas display intermediate phenotypes between the Crb2 cKO [22] and Crb1Crb2 cKO.
Increased number and mislocalization of late born cells in Crb1Crb2 cKO retinas
Due to the severe disorganisation of the retinas, we further investigated whether all retinal cell types formed in the absence of CRB1 and CRB2. Using specific markers for the different cell types, we found that all the different cell types formed and there were no indications for hybrid retinal cell types (Figure S5 and data not shown). Several of the retinal cell types appeared to localize ectopically. To further analyze this, we compared the localization of the cell nuclei in the top and bottom parts of the broad nuclear layer in Crb1Crb2 cKO mice to the outer and inner nuclear layer in control retinas (Figures 5A–F and S5A–F). The localization of the earliest born cell types, ganglion cells (marked by Brn3b), cone photoreceptors (Cone arrestin), horizontal cells (Calbindin) and the earliest born amacrine cells (ChAT) was less affected than the late born cell types, rod photoreceptors (Rhodopsin), Müller cells (Sox9 and glutamine synthetase) and bipolar cells (PKCα or Cre-GFP under the Chx10 promoter). In Crb1+/−Crb2 cKO retinas, rods, cones and bipolar cells localized ectopically in the ganglion cell layer (Figure S5G–H), and amacrine and ganglion cells surrounded by bipolar cells formed pseudo-rosettes in the photoreceptor layer (Figure S5I–J). These results suggest that all cell types are generated in retinas that lack CRB1 and CRB2 but their normal migration/localization is affected.

To test whether retinal cell types formed in normal numbers, we counted the different cell types at P14 (Figure 5G). The number of early born cells was unchanged whereas the number of late born cells was increased compared to control retinas: GABAergic amacrine cells (19.4±1.6 versus 14.8±0.6 cells/100 µm), late born GlyT1 positive amacrine (38.9±2.8 versus 20.9±1.4 cells/100 µm), Chx10+ bipolar cells (77.2±5.0 versus 46.7±2.8 cells/100 µm) and Sox9+ Müller cells (44.3±1.8 versus 18.8±0.6 cells/100 µm). At P14, the number of rod photoreceptors was not significantly increased due to ongoing apoptosis (Figures 3H and S3E). We found at P10 an increase in number of rods (695±44 in Crb1Crb2 cKO and 412±17 cells/100 µm in control; Figure 5H). This finding suggests that CRB1 and CRB2 may play a role in regulating the proliferation of the retinal progenitors.
Increased cell proliferation and apoptosis in developing Crb1Crb2 cKO retinas
In the Crb1Crb2 cKO retinas, the increased number of late born cells might be due to overproliferation of progenitors or reduced apoptosis. Therefore, in control, Crb1+/−Crb2 cKO and Crb1Crb2 cKO retinas from E13.5 to P5 animals, we analysed the number of phospho-Histone H3 (pH3) positive cells and cleaved caspase 3 positive cells, which are markers for mitotic cells and apoptotic cells respectively (Figures 6A–B and S6C–D). From E15.5 onwards, the number of M-phase cells was significantly increased in Crb1Crb2 cKO retinas, and the number of apoptotic cells was increased at E13.5 and E17.5 onwards. These data showed an increase in both mitosis and apoptosis in retinas lacking CRB1 and CRB2. Furthermore, cells in M-phase are normally located at the apical region in control retinas. However, in E17.5 Crb1Crb2 cKO retinas, where the apical region was almost completely lost, the cells in M-phase localized randomly throughout the entire thickness of the retina (Figure S6C–D). To test whether precursor cells formed in normal numbers, we counted at E17.5 early and late-born precursor cells. The number of Islet1+ early-born precursor cells (ganglion and amacrine cells) is unchanged in contrast to an increased number of Otx2+ late-born precursor cells (photoreceptors and bipolar cells; 139.3±5 cells/100 µm in Crb1Crb2 cKO retinas versus 110.9±4.1 cells/100 µm in control; Figure 6D).

At E17.5, in Crb1+/−Crb2 cKO retinas, the number of mitotic and apoptotic cells was increased like in Crb1Crb2 cKO retinas (Figure S6A–B). However, at P5 an increased number of mitotic cells and a decreased number of apoptotic cells were observed like in Crb2 cKO [22], indicating that the Crb1+/−Crb2 cKO showed intermediate features between Crb2 and Crb1Crb2 cKO.
Dysregulation of the cell cycle in Crb1Crb2 cKO retinas
We further investigated, at E17.5, which phases of the cell cycle were affected using a combination of 30 min pulse labelling with BrdU for the S-phase, phospho-Histone H3 (pH3) for the M-phase and Ki67 labelling, a marker for M, G2, S and late G1 phases of the cell cycle (Figures 6C, S6C and S6E). This showed that in Crb1Crb2 cKO retinas the number of pH3+ (6.1±0.2 in control versus 8.4±0.4 cells/100 µm in cKO retinas), BrdU+ (185.9±12.1 in control versus 238.8±17.5 cells/100 µm in cKO retinas) and Ki67+ cells (329±8.3 in control versus 384.5±15 cells/100 µm in cKO retinas) were increased. In mice, the proportion of dividing cells decreases dramatically at the centre of the retinas from P5 onwards, whereas the progenitors at the periphery of the retina still proliferate. Ultimately, mitosis is finished at the centre at P6 and at the periphery at P10 [3]. Surprisingly, in Crb1Crb2 cKO retinas the number of cells in M-phase (pH3+) was higher compared to the controls (Figure 6A). We further investigated this phenomenon using the Ki67 marker to analyse the proliferating cells in all phases of the cell cycle (Figure S6D,F) and found that the total number of cells was increased by a factor of two both in the centre and at the periphery at P5 (Figure S6H). In contrast to the control, some Ki67 positive cells were still present at the periphery of the retina at P10 in Crb1Crb2 cKO retinas (data not shown). These results suggest that active proliferating cells in Crb1Crb2 cKO retinas may reside longer than those in control retinas.
We performed flow cytometry analysis based on the DNA content and KI67 labelling at E17.5, P1 and P5 to study the proportion of cells at G1, S and G2/M phases of the cell cycle or which already exited the cell cycle in G0 (Figures 6E, G, H and S6G). At E17.5, the proportion of cells in G1 was reduced whereas the proportion of cells in S and G2/M was increased and G0 unchanged. At P1 and P5, the proportion of cells in Crb1Crb2 cKO returned to control proportion. In addition, levels of cyclin D1, cyclin E and c-myc transcripts (Figure 7A) were changed suggesting also an aberrant regulation of the cell cycle in Crb1Crb2 cKO retinas at E17.5.

We examined how the cell cycle exit was affected in the mutants by injecting BrdU at E16.5 and analysing 24 hours later (Figures 6F and S6F) [29]–[30]. The proportion of cells which exit the cell cycle (BrdU+KI67−) in the total population of BrdU labelled cells was significantly decreased in Crb1Crb2 cKO retinas (12.3±0.7%) compared to control (16.3±1.3%). However, the number of BrdU+KI67− cells per 100 µm is not significantly different (40.2±2.9) compared to control (35.3±1.8). In summary, our data suggest that the increased population of late progenitor cells and late born cells is due to dysregulation of the cell cycle at E17.5.
CRB1 and CRB2 restrain the overproliferation of the progenitors via the regulation of mitogenic signaling pathways
We investigated which proliferative signalling pathway(s) might be involved in the overproliferation of the murine progenitors in Crb1Crb2 cKO retinas at E17.5 and in early postnatal days.
The phospho-S6 ribosomal protein (pS6RB), a downstream target of mTOR signalling, localised in the post-mitotic cells in the retina and the number of the pS6RB positive cells or pS6RB protein levels at E17.5 and P1 were unchanged in Crb1Crb2 cKO retinas, suggesting that mTOR signalling is not affected in the retina upon removal of CRB1 and CRB2 (Figure S7D and data not shown).
No differences were observed in the primary downstream targets Gli1 and Ptch1 of sonic hedgehog signalling (Figure 7A). The downregulation of Smoothened and Gli2 might be due to a secondary effect of the loss of CRB proteins. The sonic hedgehog signalling seemed to not be directly involved in the increased number of progenitors.
In E17.5 and P1 retinas, whereas no difference in the amount of cleaved active intracellular form of Notch1 protein was detected, the transcript levels of Notch1 and its primary downstream targets Hey1 and Heyl were reduced in Crb1Crb2 cKO compared to control (Figures 7 and S7). The Notch1 signalling might be affected following loss of CRB1 and CRB2.
The role of Wnt-β-catenin canonical signalling in retinal proliferation remains controversial. In E17.5 control retinas, P120-catenin and β-catenin localized mainly in the adherens junctions at the subapical region whereas in the Crb1Crb2 cKO the adherens junctions were disrupted and the catenins are membrane-associated (Figure S7A–B, white arrowheads). At E17.5, levels of P120-catenin proteins were increased in Crb1Crb2 cKO retinas, in contrast to β-catenin, whereas transcript levels were unchanged (Figures 7 and S7E–F). Furthermore, we showed that the zinc finger protein Kaiso was expressed in E17.5 and P1 developing retinas, but that its protein levels were not affected in Crb1Crb2 cKO mice (Figures 7 and S7E). The presence of Kaiso in the retina and the increased levels of P120-catenin proteins are of interest as the inhibition of Kaiso on Wnt signalling is blocked through its interaction with P120-catenin (Figure 7E) [31], [32].
Only recently, YAP, the downstream effector of the Hippo pathway, has been reported to promote the proliferation of the murine progenitors in postnatal retinas, followed by downregulation around P5 during neuronal differentiation [33]. In control mice, YAP protein was detected in progenitor nuclei, overlapping with Chx10Cre-GFP localization (Figure S7C). YAP localized also at the apical region where the adherens junctions and the CRB complex were located. In the Crb1Crb2 cKO retinas, YAP localized at the remaining subapical region and only in the cytoplasm of the progenitors (Figure S7C). Phosphorylation of YAP causes its retention in the cytoplasm and binding to the adherens junctions, thus inactivating the protein [14]. Both YAP and phospho-YAP (pYAP) protein levels and the transcripts of the direct downstream targets genes CTGF and Cyr61 were reduced in Crb1Crb2 cKO retinas at E17.5 and P1 (Figure 7B,D). The YAP signalling is affected by the loss of CRB1 and CRB2.
Discussion
One key element in the construction of the retina during development is the tight control of the proliferation and differentiation of the retinal progenitor cells by a combination of extrinsic and intrinsic influences [2]. In this study, we analyzed the effect of ablation of CRB1 and CRB2 in the murine retina and showed that levels of CRB protein control the lamination and proliferation of the progenitors. Complete loss of CRB1 and CRB2 proteins in the mouse retina mimics human LCA due to mutations in the CRB1 gene.
The adherens junctions play a critical role in the migration of post-mitotic cells from the apical surface to their final destination [34]. Ganglion, bipolar and photoreceptor cells extend basal processes that guide nucleus translocation to their final destination. Bipolar and ganglion cells relinquish their apical attachment when translocation is complete whereas photoreceptors maintain adherens junctions with Müller glial cells. Amacrine and horizontal cells by contrast display active cellular migration without apical attachment by sensing their local environment [34]. Disruption of the apical adherens junctions/subapical region in Crb1+/−Crb2 cKO retinas at E15.5 leads to ectopic localization of some photoreceptor and bipolar cells in the ganglion cell layer and vice versa, ganglion, amacrine and bipolar cells in the outer nuclear layer. In Crb1Crb2 cKO mice, where the disruption occurs two days earlier, the lack of apico-basal axis leads to distribution of all the cell types in two nuclear layers and lack of a separate photoreceptor layer. Photoreceptor, ganglion and bipolar cells may undergo misguided migration due to the lack of apical attachment. The localization of the earliest born cells remains less affected, probably due to completion of migration prior to adherens junction disruption.
Apart from the role in orchestration of migration, we suggest a direct role of CRB proteins in regulation of proliferation of retinal progenitors. Crb1 KO retinas do not show an obvious developmental phenotype [24], and Crb2 cKO retinas show an increase in the number of progenitors only at P3 [22]. However, the Crb1Crb2 cKO showed increased number of mitotic cells from E15.5 to P10 and Crb1+/−Crb2 cKO retinas at E17.5 and P5. Thus, the uncontrolled proliferation of progenitors is proportional to the lack of CRB1 and CRB2 proteins. A study on CRB-interacting protein PALS1 has shown that the CRB complex might be involved in the control of progenitor proliferation in the developing mouse cortex [9]. However, in mouse retinas, conditional knockout or knockdown of Pals1 does not lead to increased proliferation of retinal progenitor cells [35], [36]. The role of CRB protein on the proliferation of the progenitors may be independent of PALS1 and involve other partners. Ablation of CRB1 and CRB2 proteins leads to an increased number of proliferating cells and abnormalities in the cell cycle. Hence, CRB proteins restrain the proliferation acting on the cell cycle machinery. Additionally, the lack of the apical CRB1 and CRB2 had an effect on the cell cycle exit potentially directing the decision to re-enter the cell cycle and explaining the increased number of progenitors. The reduced number of cells withdrawing the cell cycle may explain why retinal progenitor cells in Crb1Crb2 cKO retinas undergo several more cell cycles compared to control retinas, leading to an increase in number of late-born cell types and significant thickening of the retina.
Here, we report that CRB1 and CRB2 act on the proliferation of the retinal progenitor cells through dysregulation of the proliferative signalling pathways such as Notch1 and YAP/Hippo. In addition, we report the presence of Kaiso in the retina and increased level of P120-catenin at E17.5. We hypothesize that the lack of CRB1 and CRB2 leads to disruption of the adherens junction complex and release of available β - and P120-catenins in the cytoplasm and nuclei of progenitors. P120-catenin may retain Kaiso in the cytoplasm leading to the loss of inhibition of the Wnt target genes. Overexpression of P120-catenin and Kaiso has been linked to aberrant mitosis in cancer cells [37], [38]. Lack of CRB proteins affects the YAP/Hippo pathway. Despite its direct role on proliferation, YAP promotes cell survival by inhibiting apoptotic pathways [14]. The decrease in YAP signalling at E17.5 and P1 in Crb1Crb2 cKO might explain the increase in apoptosis observed.
Mutations in the CRB1 gene cause progressive autosomal-recessive retinitis pigmentosa and LCA. CRB1-LCA retinas are remarkably thick and lack distinct layers as detected by optical coherence tomography [20]. Mice lacking CRB1 function show limited and mild retinal disorganization in the inferior quadrant [24]–[27]. Prominent differences were found between the severe loss of retinal function in humans and the mild phenotype in mice [39]. In contrast, Crb2 cKO mice display a severe phenotype with progressive loss of photoreceptors and retinal activity mimicking CRB1-related retinitis pigmentosa [22]. Many genes involved in retinal dystrophies have been reported to show difference in temporal and spatial expression patterns and in their localization inside the retina [40], [41]. Furthermore, compensation by other members of the same protein family occurs frequently in mice and humans such as the tumor suppressor genes during retinal development [42]. Further investigations on CRB1 and CRB2 would be needed to completely understand the difference between mice and humans.
From Crb2 cKO, Crb1+/−Crb2 cKO and Crb1Crb2 cKO retina studies, the severity of the retinal disease is inversely proportional to the amount of CRB1 and CRB2 proteins which seemed to be critical for the development of the retina. As no genotype-phenotype correlation in CRB1 retinal dystrophies has been identified [43], additional down-regulation of CRB2 function in human CRB1-mutant retinas might range from CRB1-retinitis pigmentosa to CRB1-LCA. Several polymorphisms in highly conserved residues have been identified in the CRB2 gene but not directly linked to retinal dystrophies [44]. Further investigations on possible mutations in CRB complex member genes in CRB1-LCA versus CRB1-RP patients might address the question of the genotype-phenotype correlation.
Here, we report that Crb1Crb2 retinas display a thicker retina due to excessive proliferation of late-born retinal progenitor cells and also immature layering. Moreover, Crb1Crb2 and Crb1+/−Crb2 cKO animals show severe loss of retinal function. Crb1Crb2 and Crb1+/−Crb2 cKO retinas exhibit the characteristics of human CRB1-LCA retinopathies, and are therefore mouse LCA models for the development of therapeutic drugs.
Materials and Methods
Animals
Animal care and use of mice was in accordance with protocols approved by the Animal Care and Use Committee of the Royal Netherlands Academy of Arts and Sciences (KNAW). All mice used were maintained on a 50% C57BL/6JOlaHsd and 50% 129/Ola genetic background. Animals were maintained on a 12 h dark/dim light cycle and supplied with food and water ad libitum. Crb1 KO mice [24] and Crb2F/FChx10CreTg/+ clone P1E9 (Crb2 cKO) generated previously [22] were crossed to generate Crb1+/−Crb2F/FChx10CreTg/+ (Crb1+/−Crb2 cKO) and Crb1−/−Crb2F/FChx10CreTg/+ (Crb1Crb2 cKO). Crb1Crb2 cKO retinas were compared to littermate Crb1−/−Crb2F/F and Crb1−/−Crb2F/+Chx10CreTg/+ retinas and Crb1+/−Crb2 cKO to littermate Crb1+/−Crb2F/+ cKO. Chromosomal DNA isolation and genotyping were performed as previously described [22].
In vivo analysis
Scanning laser ophthalmoscopy (SLO), spectral domain optical coherence tomography (SD-OCT) and electroretinography (ERG) measurements were performed at 1, 3, 6 and 12 month in 4 to 6 animals of each genotype. Electroretinograms were recorded binocularly as described previously [45]. Single-flash responses were obtained under scotopic (dark-adapted overnight) and photopic (light-adapted with a background illumination of 30 cd/m2 starting 10 minutes before recording) conditions. Single white-flash stimuli ranged from −4 to 1.5 log cd s/m2 under scotopic and from −2 to 1.5 log cd s/m2 under photopic conditions. Ten responses were averaged with inter-stimulus intervals of 5 s (for −4 to −0.5 log cd s/m2) or 17 s (for 0 to 1.5 log cd s/m2). Retinal morphology of the anesthetized animals was visualized via SLO imaging with a HRA 1 and HRA 2 (Heidelberg Engineering, Heidelberg, Germany) according to previously described procedures (Text S1) [46]. SD-OCT imaging was performed with a commercially available Spectralis HRA+OCT device from Heidelberg Engineering. This equipment features a broadband superluminescent diode at λ = 870 nm as low coherent light source (Text S1) [47].
Morphological analysis
Eyes were collected from embryonic day E11.5 to 12M (n = 3–5/age/group) and were fixed at room temperature with 4% paraformaldehyde in PBS. Eyes were dehydrated in ethanol and embedded in Technovit 7100 (Kulzer, Wehrheim, Germany) and sectioned (3 µm). Slides were dried, counterstained with 0.5% toluidine blue and mounted under coverslips using Entellan (Merk, Darmstadt, Germany). The thickness of the retina in Crb1Crb2 cKO mice from P8 to 12M was measured from the outer limiting membrane to the inner limiting membrane (from top to bottom of Crb1Crb2 cKO retinas) at exactly 1 mm apart from the optic nerve and the average of the ventral and dorsal measurement was compared to the dorsal measurement of control mice.
Standard transmission electron microscopy
E17.5 and 1M old mice were perfused with 4% paraformaldehyde, 2% glutaraldehyde in 0.1 M cacodylate buffer pH 7.4. After the retinas were dissected free, they were post-fixed in 1% osmium tetroxide. Tissues were thoroughly rinsed and stained with 2% uranyl acetate in 70% ethanol. Samples were then dehydrated in a graded series of ethanol and embedded in epon 812 (Polysciences). Ultrathin sections were examined with a Zeiss 912 electron microscope.
Quantification of apoptotic, proliferating and retinal cells
Positive cells (Table S1) from 20–30 representative sections of the whole retina from 3–5 different control or experimental animals were manually counted and corrected by the length of each section (measured using ImageJ software fiji-win32). Retina sections of E13.5 to P5 were stained with cleaved Caspase 3 (cCasp3; marker for apoptotic cells) and phospho-Histone H3 (pH3; marker for M-phase mitotic cells) antibodies.
To examine the proportion of progenitors in S-phase, pregnant females were injected with BrdU (50 µg/g body weight) at E17.5 and embryos were collected 30 min after BrdU injection. To examine the number of progenitors which exit the cell cycle, pregnant females were injected with BrdU at E16.5 and embryos were collected 24 h later. The number of BrdU+Ki67− cells represents the number of cells which have exited the cell cycle. The number of retinal cells at P14 was counted on 20–30 representative pictures of retinas stained with specific antibodies for each cell type. Cones, rods, horizontal, Müller and ganglion cells were counted using cone arrestin, rhodopsin, calbindin, Sox9/glutamine synthetase and Brn3B antibodies, respectively. Bipolar cells were counted using PKCα staining and Cre-GFP expression (GFP is fused to the Cre in Chx10Cre mouse line). Subsets of amacrine cell types were stained using choline acetyltransferase (ChAT), GABA, and GlyT1 antibodies.
Flow cytometry
These experiments were performed similarly to [29]. Retinas from at least 4 controls and Crb1Crb2 cKO were isolated and mechanically dissociated with colagenase/DNAse I (370 U) at 37°C. Cells were fixed with 4% paraformaldehyde in PBS for 5 minutes followed by fixation in ethanol 70% one hour at 4°C. Cells were labelled with KI67 antibody diluted 1/50 in PBS-0.5% Tween-20-BSA 0.1% (PBS-TB) overnight at 4°C followed by goat anti-mouse-Alexa 488 antibody diluted 1/500 in PBS-TB. DNA content was labelled with PBS-TB containing 100 µg/ml RNase A 30 minutes at 37°C followed by 100 µg/ml propidium iodide 30 minutes. Cells analysis was performed using the flow cytometer BD LSR Fortessa. See more details about the analysis in Text S1.
Western blotting
The E17.5 and P1 retinas from at least 3 Crb1Crb2 cKO or control littermate mice were isolated, homogenized and incubated on ice in 20 µL of lysis buffer (10% glycerol, 150 mM NaCl, 1 mM EGTA, 0.5% Triton x-100, 1 mM PMSF, 1.5 mM MgCl2, 10 µg/µL aprotin, 50 mM Hepes pH 7.4 and protease inhibitor cocktail). Retina extracts from 3 independent control and Crb1Crb2 cKO animals were fractionated by SDS-PAGE electrophoresis, using 4–12% precast gels (NuPage Novex Bis-Tris Mini Gels, Invitrogen). After transfer to nitrocellulose membrane and blocking in 5% BSA in T-TBS buffer (Tris-HCL 50 mM pH7.5, 200 mM NaCl, 0.05% Tween-20), the primary antibodies (table S1) were diluted 1/1000 in T-TBS-5% BSA and incubated overnight at 4°C. After washing, they were incubated with the appropriate secondary antibodies (conjugated to DyLight Dye-800, Li-COR Odyssey or to cyanine 5) diluted 1/5000 in T-TBS buffer. After washing, the blots were then scanned using LI-COR Odyssey IR Imager. Densitometry of bands was performed in ImageJ. The densitometry for each band was subtracted to the background and normalized with GAPDH densitometry from the same sample.
Real-time quantitative PCR
RNA was isolated from 3–6 control and Crb1Crb2 cKO retinas using TRIZOL reagent (Gibco life technologies), according to the manufacturer manual, and after the final precipitation dissolved in RNase-free water. After genomic DNA degradation with RNase-free DNase I (New England Biolabs), 1 µg of total RNA was reverse transcribed into first-strand cDNA with Superscript III Plus RNase H-Reverse Transcriptase (Invitrogen) and 50 ng random hexamer primers, during 50 min at 50°C in a total volume of 20 µl. To the resulting cDNA sample, 14 µl of 10 mM Tris, 1 mM EDTA was added. From all samples, a 1∶20 dilution was made and used for qPCR analysis. For this analysis, primer pairs were designed with a melting temperature of 60–62°C, giving rise to an amplicon of 80–110 bp. Real-time qPCR was based on the real-time monitoring of SYBR Green I dye fluorescence on a ABI Prism 7300 Sequence Detection System (Applied Biosystems, Nieuwekerk a/d IJssel, The Netherlands). The PCR conditions were as follows: 12.5 µL SYBR Green PCR 2× mastermix (Applied Biosystems), 20 pmol of primers, and 2 µl of the diluted cDNA (ca 3 ng total RNA input). An initial step of 50°C for 2 min was used for AmpErase incubation followed by 15 min at 95°C to inactivate AmpErase and to activate the AmpliTaq. Cycling conditions were as follows: melting step at 95°C for 1 min, annealing at 58°C for 1 min and elongation at 72°C, for 40 cycles. At the end of the PCR run, a dissociation curve was determined by ramping the temperature of the sample from 60 to 95°C while continuously collecting fluorescence data. Non template controls were included for each primer pair to check for any significant levels of contaminants. Values were normalized by the mean of the 3 reference genes hypoxanthine-guanine phosphoribosyltransferase, elongation factor 1-a and ribosomal protein S27a.
Statistical analysis
Normality of the distribution was tested by Kolmogorov-Smirnov test. Statistical significance was calculated by using t-test of 3–5 independent retinas (20 sections)/genotype/age. Values are expressed as mean ± s.e.m. Values of *P<0.05, **P<0.01, ***P<0.001 were considered to be statistically significant. Calculations and graphs were generated using GraphPad Prism 5.
Supporting Information
Zdroje
1. AndreazzoliM (2009) Molecular regulation of vertebrate retina cell fate. Birth Defects Res C Embryo Today 87 : 284–295.
2. LiveseyFJ, CepkoCL (2001) Vertebrate neural cell-fate determination: lessons from the retina. Nat Rev Neurosci 2 : 109–118.
3. YoungRW (1985) Cell differentiation in the retina of the mouse. Anat Rec 212 : 199–205.
4. AgathocleousM, HarrisWA (2009) From progenitors to differentiated cells in the vertebrate retina. Annu Rev Cell Dev Biol 25 : 45–69.
5. BurmeisterM, NovakJ, LiangMY, BasuS, PloderL, et al. (1996) Ocular retardation mouse caused by Chx10 homeobox null allele: impaired retinal progenitor proliferation and bipolar cell differentiation. Nat Genet 12 : 376–384.
6. Martin-BelmonteF, Perez-MorenoM (2011) Epithelial cell polarity, stem cells and cancer. Nat Rev Cancer 12 : 23–38.
7. TepassU, TheresC, KnustE (1990) crumbs encodes an EGF-like protein expressed on apical membranes of Drosophila epithelial cells and required for organization of epithelia. Cell 61 : 787–799.
8. BulgakovaNA, KnustE (1990) The Crumbs complex: from epithelial-cell polarity to retinal degeneration. J Cell Sci 122 : 2587–2596.
9. KimS, LehtinenMK, SessaA, ZappaterraMW, ChoSH, et al. (2010) The apical complex couples cell fate and cell survival to cerebral cortical development. Neuron 66 : 69–84.
10. HerranzH, StamatakiE, FeiguinF, MilánM (2006) Self-refinement of Notch activity through the transmembrane protein Crumbs: modulation of gamma-secretase activity. EMBO Rep 7 : 297–302.
11. MitsuishiY, HasegawaH, MatsuoA, ArakiW, SuzukiT, et al. (2010) Human CRB2 inhibits gamma-secretase cleavage of amyloid precursor protein by binding to the presenilin complex. J Biol Chem 285 : 14920–14931.
12. OhataS, AokiR, KinoshitaS, YamaguchiM, Tsuruoka-KinoshitaS, et al. (2011) Dual roles of Notch in regulation of apically restricted mitosis and apicobasal polarity of neuroepithelial cells. Neuron 69 : 215–230.
13. Massey-HarrocheD, DelgrossiMH, Lane-GuermonprezL, ArsantoJP, BorgJP, et al. (2007) Evidence for a molecular link between the tuberous sclerosis complex and the Crumbs complex. Hum Mol Genet 16 : 529–536.
14. ZhaoB, TumanengK, GuanKL (2011) The Hippo pathway in organ size control, tissue regeneration and stem cell self-renewal. Nat Cell Biol 13 : 877–883.
15. ChenCL, GajewskiKM, HamaratogluF, BossuytW, Sansores-GarciaL, et al. (2010) The apical-basal cell polarity determinant Crumbs regulates Hippo signaling in Drosophila. Proc Natl Acad Sci U S A 107 : 15810–15815.
16. RobinsonBS, HuangJ, HongY, MobergKH (2010) Crumbs regulates Salvador/Warts/Hippo signaling in Drosophila via the FERM-domain protein Expanded. Curr Biol 20 : 582–590.
17. VarelasX, Samavarchi-TehraniP, NarimatsuM, WeissA, CockburnK, et al. (2010) The Crumbs complex couples cell density sensing to Hippo-dependent control of the TGF-β-SMAD pathway. Dev Cell 19 : 831–844.
18. RichardM, RoepmanR, AartsenWM, van RossumAG, den HollanderAI, et al. (2006) Towards understanding CRUMBS function in retinal dystrophies. Hum Mol Genet 15 : 235–243.
19. den HollanderAI, RoepmanR, KoenekoopRK, CremersFP (2008) Leber congenital amaurosis: genes, proteins and disease mechanisms. Prog Retin Eye Res 27 : 391–419.
20. JacobsonSG, CideciyanAV, AlemanTS, PiantaMJ, SumarokaA, et al. (2003) Crumbs homolog 1 (CRB1) mutations result in a thick human retina with abnormal lamination. Hum Mol Genet 12 : 1073–1078.
21. den HollanderAI, GhianiM, de KokYJ, WijnholdsJ, BallabioA, et al. (2002) Isolation of Crb1, a mouse homologue of Drosophila crumbs, and analysis of its expression pattern in eye and brain. Mech Dev 110 : 203–207.
22. AlvesCH, Sanz SanzA, ParkB, PellissierLP, TanimotoN, et al. (2013) Loss of CRB2 in the mouse retina mimics human Retinitis Pigmentosa due to mutations in the CRB1 gene. Hum Mol Genet 22 : 35–50.
23. van RossumAG, AartsenWM, MeulemanJ, KloosterJ, MalyshevaA, et al. (2006) Pals1/Mpp5 is required for correct localization of Crb1 at the subapical region in polarized Muller glia cells. Hum Mol Genet 15 : 2659–2672.
24. van de PavertSA, KantardzhievaA, MalyshevaA, MeulemanJ, VersteegI, et al. (2004) Crumbs homologue 1 is required for maintenance of photoreceptor cell polarization and adhesion during light exposure. J Cell Sci 117 : 4169–4177.
25. van de PavertSA, SanzAS, AartsenWM, VosRM, VersteegI, et al. (2007) Crb1 is a determinant of retinal apical Müller glia cell features. Glia 55 : 1486–1497.
26. van de PavertSA, MeulemanJ, MalyshevaA, AartsenWM, VersteegI, et al. (2007) A single amino acid substitution (Cys249Trp) in Crb1 causes retinal degeneration and deregulates expression of pituitary tumor transforming gene Pttg1. J Neurosci 27 : 564–573.
27. MehalowAK, KameyaS, SmithRS, HawesNL, DenegreJM, et al. (2003) CRB1 is essential for external limiting membrane integrity and photoreceptor morphogenesis in the mammalian retina. Hum Mol Genet 12 : 2179–2189.
28. RowanS, CepkoCL (2004) Genetic analysis of the homeodomain transcription factor Chx10 in the retina using a novel multifunctional BAC transgenic mouse reporter. Dev Biol 271 : 388–402.
29. SakagamiK, GanL, YangXJ (2009) Distinct effects of Hedgehog signaling on neuronal fate specification and cell cycle progression in the embryonic mouse retina. J Neurosci 29 : 6932–6944.
30. DasG, ChoiY, SicinskiP, LevineEM (2009) Cyclin D1 fine-tunes the neurogenic output of embryonic retinal progenitor cells. Neural Dev 4 : 15.
31. ParkJI, KimSW, LyonsJP, JiH, NguyenTT, et al. (2005) Kaiso/p120-catenin and TCF/beta-catenin complexes coordinately regulate canonical Wnt gene targets. Dev Cell 8 : 843–854.
32. ParkJI, JiH, JunS, GuD, HikasaH, et al. (2006) Frodo links Dishevelled to the p120-catenin/Kaiso pathway: distinct catenin subfamilies promote Wnt signals. Dev Cell 11 : 683–695.
33. ZhangH, DeoM, ThompsonRC, UhlerMD, TurnerDL (2012) Negative regulation of Yap during neuronal differentiation. Dev Biol 361 : 103–115.
34. ReeseBE (2011) Development of the retina and optic pathway. Vision Res 51 : 613–632.
35. ChoSH, KimJY, SimonsDL, SongJY, LeJH, et al. (2012) Genetic ablation of Pals1 in retinal progenitor cells models the retinal pathology of Leber congenital amaurosis. Hum Mol Genet 21 : 2663–2676.
36. ParkB, AlvesCH, LundvigDM, TanimotoN, BeckSC, et al. (2011) PALS1 is essential for retinal pigment epithelium structure and neural retina stratification. J Neurosci 31 : 17230–17241.
37. ChartierNT, OddouCI, LainéMG, DucarougeB, MarieCA, et al. (2007) Cyclin-dependent kinase 2/cyclin E complex is involved in p120 catenin (p120ctn)-dependent cell growth control: a new role for p120ctn in cancer. Cancer Res 67 : 9781–9790.
38. JiangG, WangY, DaiS, LiuY, StoeckerM, et al. (2012) P120-catenin isoforms 1 and 3 regulate proliferation and cell cycle of lung cancer cells via β-catenin and Kaiso respectively. PLoS One 7: e30303.
39. AlemanTS, CideciyanAV, AguirreGK, HuangWC, MullinsCL, et al. (2011) Human CRB1-associated retinal degeneration: comparison with the rd8 Crb1-mutant mouse model. Invest Ophthalmol Vis Sci 52 : 6898–6910.
40. TrifunovicD, KaraliM, CamposampieroD, PonzinD, BanfiS, et al. (2008) A high-resolution RNA expression atlas of retinitis pigmentosa genes in human and mouse retinas. Invest Ophthalmol Vis Sci 49 : 2330–2336.
41. BibbLC, HoltJK, TarttelinEE, HodgesMD, Gregory-EvansK, et al. (2001) Temporal and spatial expression patterns of the CRX transcription factor and its downstream targets. Critical differences during human and mouse eye development. Hum Mol Genet 10 : 1571–1579.
42. DonovanSL, SchweersB, MartinsR, JohnsonD, DyerMA (2006) Compensation by tumor suppressor genes during retinal development in mice and humans. BMC Biol 4 : 14.
43. BujakowskaK, AudoI, Mohand-SaïdS, LancelotME, AntonioA, et al. (2012) CRB1 mutations in inherited retinal dystrophies. Hum Mutat 33 : 306–315.
44. van den HurkJA, RashbassP, RoepmanR, DavisJ, VoesenekKE, et al. (2005) Characterization of the Crumbs homolog 2 (CRB2) gene and analysis of its role in retinitis pigmentosa and Leber congenital amaurosis. Mol Vis 11 : 263–273.
45. TanimotoN, MuehlfriedelRL, FischerMD, FahlE, HumphriesP, et al. (2009) Vision tests in the mouse: functional phenotyping with electroretinography. Front Biosci 14 : 2730–2737.
46. SeeligerMW, BeckSC, Pereyra-MuñozN, DangelS, TsaiJY, et al. (2005) In vivo confocal imaging of the retina in animal models using scanning laser ophthalmoscopy. Vision Res 45 : 3512–3519.
47. FischerMD, HuberG, BeckSC, TanimotoN, MuehlfriedelR, et al. (2009) Non invasive, in vivo assessment of mouse retinal structure using optical coherence tomography. PLoS One 4: e7507.
Štítky
Genetika Reprodukční medicínaČlánek vyšel v časopise
PLOS Genetics
2013 Číslo 12
- Kazuistika – Perspektivy využití precizované medicíny v rámci personalizované specifické terapie onkologických pacientů
- Nobelova cena za chemii pro genetické nůžky: Objev, který změní naši budoucnost?
- Technologie na bázi RNA v klinické praxi: od přebarvených petúnií k terapii vzácných a dosud jen obtížně léčitelných chorob u lidí
- „Nepředstavovali jsme si, že náš výzkum povede přímo ke vzniku nových léků, dokonce ještě za našeho života“
- Bezplatné služby pro diagnostiku ATTRv amyloidózy pro kardiology
Nejčtenější v tomto čísle
- The NuRD Chromatin-Remodeling Enzyme CHD4 Promotes Embryonic Vascular Integrity by Transcriptionally Regulating Extracellular Matrix Proteolysis
- MAN1B1 Deficiency: An Unexpected CDG-II
- Mutations in the UQCC1-Interacting Protein, UQCC2, Cause Human Complex III Deficiency Associated with Perturbed Cytochrome Protein Expression
- The Midline Protein Regulates Axon Guidance by Blocking the Reiteration of Neuroblast Rows within the Drosophila Ventral Nerve Cord
Zvyšte si kvalifikaci online z pohodlí domova
Mazová zátka a její řešení
nový kurzVšechny kurzy