
Genome-Wide Association Analysis Identifies Variants Associated with Nonalcoholic Fatty Liver Disease That Have Distinct Effects on Metabolic Traits
Nonalcoholic fatty liver disease (NAFLD) clusters in families, but the only known common genetic variants influencing risk are near PNPLA3. We sought to identify additional genetic variants influencing NAFLD using genome-wide association (GWA) analysis of computed tomography (CT) measured hepatic steatosis, a non-invasive measure of NAFLD, in large population based samples. Using variance components methods, we show that CT hepatic steatosis is heritable (∼26%–27%) in family-based Amish, Family Heart, and Framingham Heart Studies (n = 880 to 3,070). By carrying out a fixed-effects meta-analysis of genome-wide association (GWA) results between CT hepatic steatosis and ∼2.4 million imputed or genotyped SNPs in 7,176 individuals from the Old Order Amish, Age, Gene/Environment Susceptibility-Reykjavik study (AGES), Family Heart, and Framingham Heart Studies, we identify variants associated at genome-wide significant levels (p<5×10⁻⁸) in or near PNPLA3, NCAN, and PPP1R3B. We genotype these and 42 other top CT hepatic steatosis-associated SNPs in 592 subjects with biopsy-proven NAFLD from the NASH Clinical Research Network (NASH CRN). In comparisons with 1,405 healthy controls from the Myocardial Genetics Consortium (MIGen), we observe significant associations with histologic NAFLD at variants in or near NCAN, GCKR, LYPLAL1, and PNPLA3, but not PPP1R3B. Variants at these five loci exhibit distinct patterns of association with serum lipids, as well as glycemic and anthropometric traits. We identify common genetic variants influencing CT–assessed steatosis and risk of NAFLD. Hepatic steatosis associated variants are not uniformly associated with NASH/fibrosis or result in abnormalities in serum lipids or glycemic and anthropometric traits, suggesting genetic heterogeneity in the pathways influencing these traits.
Published in the journal:
. PLoS Genet 7(3): e32767. doi:10.1371/journal.pgen.1001324
Category:
Research Article
doi:
https://doi.org/10.1371/journal.pgen.1001324
Summary
Nonalcoholic fatty liver disease (NAFLD) clusters in families, but the only known common genetic variants influencing risk are near PNPLA3. We sought to identify additional genetic variants influencing NAFLD using genome-wide association (GWA) analysis of computed tomography (CT) measured hepatic steatosis, a non-invasive measure of NAFLD, in large population based samples. Using variance components methods, we show that CT hepatic steatosis is heritable (∼26%–27%) in family-based Amish, Family Heart, and Framingham Heart Studies (n = 880 to 3,070). By carrying out a fixed-effects meta-analysis of genome-wide association (GWA) results between CT hepatic steatosis and ∼2.4 million imputed or genotyped SNPs in 7,176 individuals from the Old Order Amish, Age, Gene/Environment Susceptibility-Reykjavik study (AGES), Family Heart, and Framingham Heart Studies, we identify variants associated at genome-wide significant levels (p<5×10⁻⁸) in or near PNPLA3, NCAN, and PPP1R3B. We genotype these and 42 other top CT hepatic steatosis-associated SNPs in 592 subjects with biopsy-proven NAFLD from the NASH Clinical Research Network (NASH CRN). In comparisons with 1,405 healthy controls from the Myocardial Genetics Consortium (MIGen), we observe significant associations with histologic NAFLD at variants in or near NCAN, GCKR, LYPLAL1, and PNPLA3, but not PPP1R3B. Variants at these five loci exhibit distinct patterns of association with serum lipids, as well as glycemic and anthropometric traits. We identify common genetic variants influencing CT–assessed steatosis and risk of NAFLD. Hepatic steatosis associated variants are not uniformly associated with NASH/fibrosis or result in abnormalities in serum lipids or glycemic and anthropometric traits, suggesting genetic heterogeneity in the pathways influencing these traits.
Introduction
NAFLD includes a spectrum of disease ranging from fatty infiltration of the liver (steatosis) to histologic evidence of inflammation (nonalcoholic steatohepatitis or NASH), to fibrosis or cirrhosis, without a history of excessive alcohol ingestion [1], [2]. NAFLD can lead to liver failure and is accompanied by substantial morbidity and mortality, with few known effective treatments [3]. Obesity is a primary risk factor for NAFLD, but not all obese individuals are affected [4]. Familial clustering of the disease has been identified [5]–[7], suggesting that NAFLD may be influenced by genetic variants. However, thus far only one genetic locus has been found to reproducibly associate with magnetic resonance measured steatosis [8], [9].
Liver attenuation measured using computed tomography (CT) is a quantitative measure that is inversely related to the amount of fat in the liver [10]–[12]. It is highly correlated (r = 0.92) with the macrovesicular hepatic steatosis and thus is a non invasive measure of NAFLD [12]. The purpose of the present study was to determine the heritability of CT measured hepatic steatosis and to search for associated genetic variants in a meta-analysis of 7,176 individuals of European descent from the Framingham Heart Study (FRAM), the Old Order Amish Study (Amish), the Family Heart Study (FamHS), and the Age, Gene/Environment Susceptibility-Reykjavik study (AGES), which together comprise the GOLD (Genetics of Obesity-related Liver Disease) consortium (See Table S1). To validate top associating variants for risk of histologically verified NAFLD, we utilized cases from the NASH Clinical Research Network (NASH CRN) that were genetically matched to healthy controls from the Myocardial Genetics Consortium (MIGen) consortium(See Table S1). We then further tested genome wide significant or replicating SNPs for associations with histologic NAFLD using the same cases from the NASH Clinical Research Network (NASH CRN) versus a different set of controls from the Illumina Control Database (iCONT) (See Table S1). Further, we report the association of these SNPs with other metabolic traits using data from the Global Lipids Genetics [13], GIANT [14], DIAGRAM [15], and MAGIC [16] Consortia, as well as investigate cis gene expression variation (eQTLs) in liver, subcutaneous and visceral fat from bariatric surgery patients from Massachusetts General Hospital [17](Figure 1).

Results
We estimated the heritability of CT hepatic steatosis in three family-based cohorts. We found that the heritability of CT hepatic steatosis was 0.27 (standard error, SE 0.08), 0.27 (SE = 0.04), and 0.26 (SE 0.04) in the Amish, FamHS, and FRAM cohorts respectively (n = 880–3,070) (See Materials and Methods and Table 1). These data suggest that CT hepatic steatosis, like other measures of fat has a genetic basis and that a search for influential genetic variants is warranted.

To identify specific genetic loci associated with CT hepatic steatosis, genome-wide association analyses were carried out in each of the four studies (See Materials and Methods and Tables S2, S3) and the results combined using a fixed effects meta-analysis (N = 7,176 in total). Variants at three loci emerged as being associated with CT hepatic steatosis at genome-wide significance levels (p<5×10⁻⁸; Table 2, Figure 2A). These included rs738409 in PNPLA3 (p = 4.3×10⁻³⁴), a locus previously reported as associated with magnetic resonance spectroscopy measured steatosis, [8] and two additional novel loci: rs4240624 near PPP1R3B (rs4240624, p = 3.68×10⁻¹⁸) and rs2228603 near NCAN (rs2228603, p = 1.22×10⁻¹⁸). The alleles associated with increasing CT hepatic steatosis ranged in frequency from 0.07 to 0.92 and together account for 4.4% of the variance in hepatic steatosis (Table 2; range 0.79–2.41%). After removing these genome-wide significant loci, a quantile-quantile plot of the results demonstrated an excess of low p-values compared to expectations under the null (Figure 2B), suggesting that additional variants among those with moderately low p-values may also be associated with this trait. Except for variants near PNPLA3, we did not observe any variants in the region of any of the previously reported liver function test associated regions [18]. We could not assess whether the recently reported NAFLD associated variants near APOC3 [19] associate with CT hepatic steatosis as they were not genotyped on the Affymetrix or Illumina platforms used by our studies and these variants do not have proxies that we could use in HapMap to impute them.
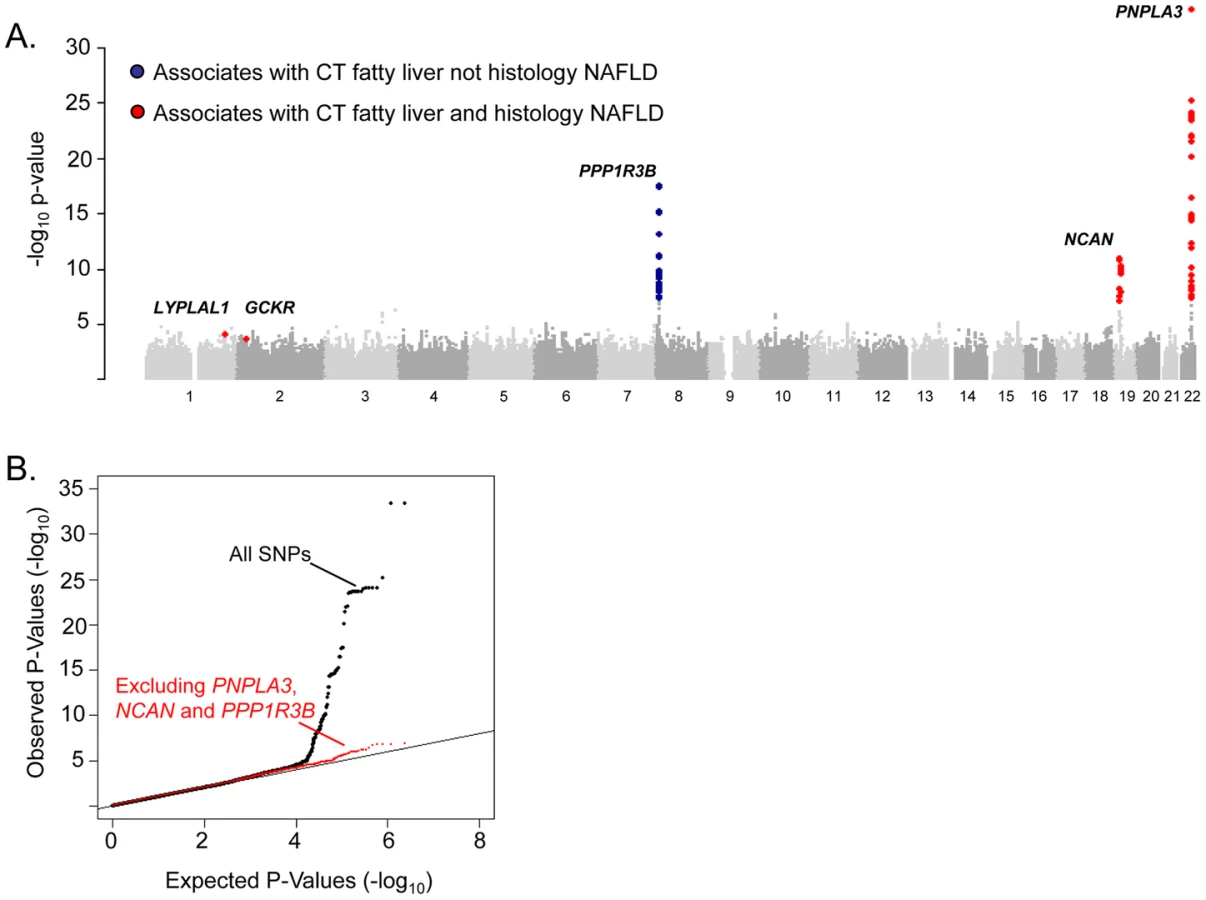

To determine whether SNPs with evidence of association with CT hepatic steatosis are also associated with histologic NAFLD, we genotyped 46 SNPs (independent SNPs with p<5×10⁻³, with independence defined as pairwise r2<0.1; See Table S4 for SNP details in GOLD and each cohort) in 592 subjects with biopsy-proven NAFLD from the NASH CRN (See Table S1). Using ancestry-informative genetic markers [20], we had previously matched these cases to 1,405 healthy controls [21] from the MIGen study [22] that had undergone GWAS genotyping and imputation (See Table S1). Forty-five of the 46 SNPs passed genotyping and imputation quality control in the NASH CRN and MIGen data sets respectively (See Table S3) and were tested for association with histologic NAFLD in this sample. Two of the three variants with genome-wide significant associations to CT hepatic steatosis were also significantly associated with histologic NAFLD (corresponding to a false discovery rate (FDR) p<0.001): rs738409 in PNPLA3 (OR = 3.26, p = 3.6×10−43) as we and others have recently reported [21], [23] and rs2228603 in NCAN (OR = 1.65, p = 5.29×10⁻⁵) which is a novel finding (Table 2; See Table S5). The rs4240624 variant near PPP1R3B was not associated with histologic NAFLD in this sample (OR = 0.93, p = 0.29). Of the 43 remaining SNPs showing suggestive association with CT hepatic steatosis, rs780094 in GCKR (OR = 1.45, p = 2.59×10⁻⁸) and rs12137855 near LYPLAL1 (OR = 1.37, p = 4.12×10⁻⁵) were also significantly associated with histologic NAFLD (Table 2; See Table S5).
To confirm that the effects on histologic NAFLD observed in the NASH CRN/MIGen analyses were not due to the characteristics of the controls, we performed a separate analysis of the NASH CRN cases with an alternate set of controls from the Illumina Control database (iCONT; http://www.illumina.com/science/icontroldb.ilmn). We found that the effects and p values of rs738409 in PNPLA3 (OR = 3.24, p = 2.16×10−64), rs2228603 in NCAN (OR = 1.90, p = 6.82×10⁻¹⁰), rs4240624 near PPP1R3B (OR = 0.86, p = 0.15), rs780094 in GCKR (OR = 1.18, p = 0.01), and rs12137855 near LYPLAL1 (OR = 1.21, p = 0.03) were similar to the effects seen in MIGen establishing that these results are not dependent on the choice of control sample (See Table S6). Furthermore, assessment of imputation accuracy with the SNPs in these control sets indicates that imputed genotypes at the associated SNPs are likely to be highly accurate (see Tables S7, S8).
The variants with the lowest p-values of association with CT hepatic steatosis at the PNPLA3(rs738408), NCAN (rs2228603), and GCKR (rs780094) loci are in high LD with or are themselves non-synonymous variants in PNPLA3 (rs738409; I148M, R2 = 1), NCAN (rs2228603; P91S, same as hepatic steatosis SNP), and GCKR (rs1260326; P446L; R2 = 0.93) (Figure 3). The variants with the lowest p-values of association with CT hepatic steatosis at LYPLAL1 and PPP1R3B lie downstream and upstream of the coding regions of these genes (Figure 3).

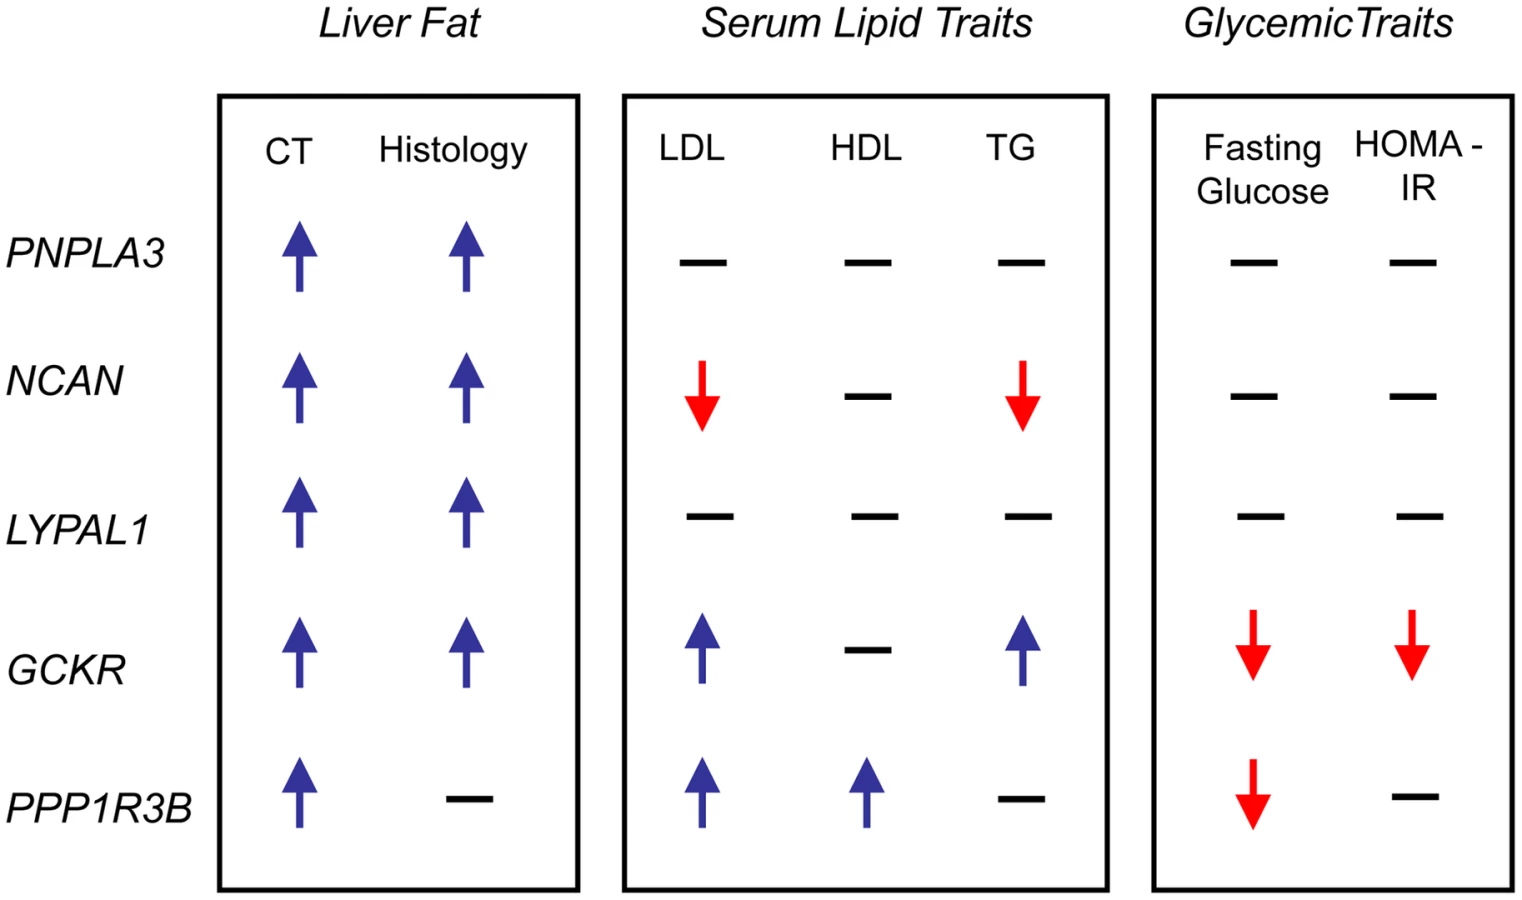
In epidemiologic studies NAFLD is associated with increased central obesity, higher low density lipoprotein (LDL) - cholesterol and lower high density lipoprotein (HDL)-cholesterol levels, impaired fasting glucose, increased risk of diabetes and increased insulin resistance. [24]In addition, variants in or near GCKR, NCAN, and PPP1R3B have been previously associated with lipid levels, GCKR with glycemic traits and LYPLAL1 with abdominal obesity [16], [25]–[29]. Therefore, we examined the associations of each of the CT hepatic steatosis-associated variants with serum LDL-cholesterol, HDL-cholesterol, triglycerides (TG), 2 hour glucose levels, 2 hour glucose levels controlled for body mass index (BMI), fasting glucose, homeostatic model for beta call function (HOMA-B), homeostatic model for insulin resistance (HOMA-IR), fasting insulin, BMI, waist to hip ratio (WHR) controlled for BMI, and diabetes in the largest analyses of these traits available from the Global Lipids Genetics [13], GIANT [14], DIAGRAM [15], and MAGIC [16] Consortia (see Table 2, Table S9) Interestingly, we observed several distinct patterns of association. The allele associated with increasing CT hepatic steatosis at NCAN was associated with lower triglycerides and plasma LDL-cholesterol levels. By contrast, the hepatic steatosis-increasing allele at GCKR was associated with higher levels of plasma LDL-cholesterol and triglycerides, lower fasting glucose, lower fasting insulin, lower HOMA-IR, but increased 2 hour glucose, increased 2 hour glucose controlled for BMI, and WHR controlled for BMI. The hepatic steatosis increasing allele at PPP1R3B was associated with increased HDL - and LDL-cholesterol levels and decreased fasting glucose.(Table 2, Figure 4). The variants near PNPLA3 and LYPLAL1 were not associated with any of the traits tested (See Table 2, Table S9 and Figure 4).
For PNPLA3 (rs738408), NCAN (rs2228603), and GCKR (rs780094) the variants with the lowest p-values of association with CT hepatic steatosis are either themselves missense SNPs or in high LD with missense SNPs. Thus, the most parsimonious model of how they may act is by directly affecting protein structure or function. However, the variants with the lowest p-values of association with CT hepatic steatosis near LYPLAL1 and PPP1R3B fall in non-coding regions and thus for these (as well as the other three loci above) we tested whether they have effects on the expression of nearby genes in liver and adipose tissue from a sample of bariatric surgery patients [17] (See Table S10). We found that that the hepatic steatosis increasing variant (rs4240624) at the PPP1R3B locus increased liver mRNA expression of PPP1R3B and AW673036_RC and decreased expression of AK055863. The hepatic steatosis increasing variant (rs780094) at the GCKR locus increased expression of C2orf16 mRNA in liver. In these cases the eQTL with the lowest p-value of affecting these transcripts in the region was the same or highly correlated with the allele that had the lowest p-value of association with CT hepatic steatosis consistent with the possibility that these SNPs may function by affecting expression of nearby genes. For all other cases, the eQTL with the lowest p-value of affecting transcript expression at the locus was not eliminated by controlling for the variant that had the lowest p - value of association with CT hepatic steatosis and thus in these cases, the data do not support an expression effect as mediating the association with steatosis. Because alteration of PPP1R3B expression has been shown to affect serum lipid levels [13] one possibility is that changes in expression of this gene could mediate its effect on hepatic steatosis. For GCKR, the variant with the lowest p-value of association with CT hepatic steatosis is in high LD with a missense variant in GCKR which has been shown to affect GCKR function [30]. Thus, at GCKR an alternate model of action of how the CT hepatic steatosis associated variant affects hepatic steatosis is via altering GCKR function rather than via altering expression of C2orf16. Further functional work will be needed to prove that these variants exert their effects on hepatic steatosis via these possible mechanisms.
Discussion
We have identified variants in three novel loci (NCAN, GCKR, and LYPLAL1) and one previously reported locus (PNPLA3) that are associated with both increasing CT hepatic steatosis and histologic NAFLD. PPP1R3B is associated with CT steatosis but not histologic NAFLD that includes individuals mostly with inflammation and fibrosis. These variants all have distinct patterns of effects on NAFLD and metabolic traits.
We have shown that CT hepatic steatosis is heritable and that GWA meta-analysis led to the identification of variants associated not only with CT hepatic steatosis but, also, with more severe NASH/fibrosis mostly present in the NASH CRN sample. Because CT hepatic steatosis measurements can be obtained noninvasively, much larger sample sizes can be accumulated, thereby increasing power to identify variants that associate with NAFLD compared with only studying individuals that have histology diagnosed disease. Follow-up association testing in samples with histologic phenotypes remains useful however. We did observe one variant near PPP1R3B that was associated with CT–assessed liver attenuation but not histology-proven NAFLD. Possible reasons for why the variant near PPP1R3B is associated with CT liver steatosis but not histology-proven NAFLD include 1. It influences steatosis only, not progression to NASH/fibrosis: 2. its association with CT fat may be a false positive: 3. the NASH CRN/MIGen sample is underpowered to see an effect on histologic NAFLD: or 4. the variant is associated with something other than fat reflected in the CT scan (eg. glycogen content). Further work is needed to differentiate among these possibilities.
We show that some of the variants that are associated with increased CT hepatic steatosis have distinct patterns of effects on metabolic traits that, when taken together, give us insight into their functional clustering. For example, unlike the other three loci, variants in or near PNPLA3 and LYPLAL1 do not affect any of the other metabolic traits and interestingly PNPLA3 and LYPLAL1-related proteins have been predicted to play a role in consecutive steps in triglyceride breakdown [31], [32]. Thus these could increase hepatic steatosis by preventing breakdown of triglycerides, as recently shown for PNPLA3(I148M) [33]. The apparent discordance between the strong effect on hepatic steatosis and modest, if any, effect on serum lipid levels suggests that these genes, if they are involved in lipid metabolism, exert their effects within the liver in ways that are not well reflected in serum measurements. Thus, similarities in the pattern of pleiotropic effects on other traits may provide insights into the functional clustering of the genes that these variants effect.
Unlike PNPLA3 and LYPLAL1, variants near NCAN(which encodes for an adhesion molecule [34]), PPP1R3B (which encodes for a protein that regulates glycogen breakdown [35]), and GCKR (which, through inhibition of glucokinase, regulates glucose storage/disposal and provides substrates for de novo lipogenesis [30]), are associated with distinct changes in serum and liver lipids as well as glycemic traits. Indeed, these data may provide new insights into how obesity can lead to metabolic complications in some but not all individuals - some but not all of these individuals carry variants that predispose them both to liver fat deposition and to metabolic dysregulation. Further, our data show that the alleles of SNPs that associate with increased liver steatosis are also associated with a diverse pattern of metabolic phenotypes including different combinations of increased or decreased serum LDL-cholesterol, increased serum HDL-cholesterol, increased serum TG, decreased serum fasting glucose and insulin, decreased insulin resistance, and increased WHR adjusted for BMI. In addition, some hepatic steatosis-associated variants are not strongly associated with any of these metabolic traits (PNPLA3 and LYPLAL1). These results indicate that hepatic steatosis is likely to be influenced by different metabolic pathways, based on these various patterns of association. Thus it may be possible to resolve genetic heterogeneity in the etiology of hepatic steatosis, which may present unique opportunities for personalized therapies.
Compared with earlier efforts, this study is well-powered, using more than 7,176 individuals for discovery of variants that affect NAFLD. Thus, noninvasive measures of hepatic steatosis such as CT scanning can provide valuable information for use in population - and family-based studies aimed at identifying genetic risk factors for NAFLD. Although the identities of nearby genes and effects on lipid levels provide important clues, functional studies will be needed to further understand the mechanisms by which these risk factors influence the development and progression of NAFLD. Overall however, our work gives us new insights into the biology and genetics of NAFLD and opens up avenues for biological, diagnostic, and therapeutic research for this condition in humans.
Materials and Methods
Ethics statement
All work done in this paper was approved by local institutional review boards or equivalent committees.
GOLD studies and genetic analyses
Each of the participating studies had the overarching objective of investigating cardiovascular disease and its risk factors. The studies are population based and 3 of the 4 are family studies. Genome-wide SNP data were available in each case, and the platforms and quality control measures are described in Tables S2 and S3.
Age Gene-Environment Susceptibility—Reykjavik Study (AGES-Reykjavik)
The AGES-Reykjavik Study is a single center prospective population-based cohort nested in the original Rykjavik Study, a cohort of 30,795 randomly sampled persons living in Reykjavik, Iceland. The cohort included 19,381 men and women born between 1907 and 1935. Re-examination of a sample of surviving members of the Reykjavik Study was initiated in 2002 as the AGES-Reykjavik Study. This study included imaging by computerized tomography, from which liver attenuation was measured from a 1mm thick slice at the level of the L1/L2 vertebrae by calculating the average Hounsfield Unit in a region of interest with a diameter of 1 cm located 10% of the distance from where a tangent from the mid-anterior of the spinal canal bisected a line between the second and third rib. Four thousand seven hundred and seventy two individuals were assessed for hepatic steatosis using CT scanning. Liver attenuation controlled for an external phantom was inverse normally transformed and residuals created from a linear regression model in Proable [36]/R with covariates of age, age2, gender and drinks along with the SNPs in an additive genetic model (See Tables S2, S3).
The Amish
Subjects were identified from 2 studies of cardiovascular health in the Old Order Amish community in Lancaster County: the Amish Family Calcification Study (2001–2006) [37] and the Amish Longevity Study (2000–2006) [38]. In total, 541 individuals had both genome-wide SNP data and CT-assessed hepatic steatosis. Thoracic electron-beam computerized tomography (EBCT) scans were obtained as part of the Amish Family Calcification Study by an Imatron C-150 EBCT scanner. Measurements from two regions-of-interest, the liver and spleen, were obtained. The spleen measurements were used as an attenuation standard. Accu View (Accuimage Corp.) software was used to calculate the attenuation coefficient in Hounsfield Units for each region-of-interest. Two 1.0-cm2 region-of-interest measurements were obtained from the liver and one was obtained from the spleen. The average of the liver attenuation measurements divided by the spleen attenuation measurement was then calculated. The region-of-interest measurements were placed in such a manner that minimized measurements from vessels, focal lesions, areas of artifact or near the edges of the organs.
The liver attenuation/spleen attenuation ratio was inverse normally transformed and association was tested with genotypes in an additive genetic model controlling for age, age2, and gender and relatedness; alcohol is generally not consumed in this population. A (n-1)-degree-of-freedom t test was used to assess the significance of the measured genotype. The polygenic component was modeled using the relationship matrix derived from the complete 14-generation pedigree structure, to properly control for the relatedness of all subjects in the study.
The Family Heart Study
The Family Heart Study (https://dsgweb.wustl.edu/PROJECTS/MP1.html) recruited 1,200 families, half randomly sampled, and half selected because of an excess of coronary heart disease (CHD) or risk factor abnormalities as compared with age - and sex-specific population rates [39] from four population-based parent studies: the Framingham Heart Study, the Utah Family Tree Study, and two Atherosclerosis Risk in Communities centers (Minneapolis, and Forsyth County, NC). Study participants belonging to the largest pedigrees were invited for a second clinical exam, at which time coronary artery calcification was assessed using computed tomography, which included imaging of the liver. A total of 2,767 Caucasian subjects in 508 extended families were examined; the heritability was estimated in this sample . A two-stage design was adopted for the GWAS. In the first stage, 1,016 subjects were chosen, equally distributed between the highest and lowest quartiles of age - and sex-adjusted values for coronary artery calcification, assessed by CT scan. These subjects were chosen to be largely unrelated with 200 subjects having 1 or more siblings selected into the sample. We report association results based on 886 subjects after excluding 130 subjects ascertained from the Framingham Massachusetts to avoid any possible overlap with the Framingham Heart Study participants.
Participants underwent a cardiac multidetector CT exam with four detectors using a standardized protocol as described previously [40]. For participants weighing 100 kg (220 lbs) or greater, the milliamperes were increased by 25%. Participants received two sequential scans of the heart with ECG gating in late diastole. A phantom with either 3 or 4 samples of calcium hydroxylapatite was included in each participants scan. CT images from all study centers were sent electronically to the central CT reading center located at Wake Forest University Health Sciences, Winston Salem, NC, USA.
CT images were analyzed using Medical Image Processing, Analysis, and Visualization (MIPAV) software (McAuliffe 2009) with custom programmed subroutines (a.k.a.“plug-ins”) coded at Wake Forest University Health Sciences. CT images of the chest were used to measure liver attenuation corresponding to superior aspects of the right and medial lobes or hepatic segments 4a, 7 and 8 using the Couinaud system. An external calcium standard was used as a control for penetrance of the films.
The liver attenuation was regressed on age, age2, age3, field center, phantom average, alcohol consumption and 10 genetic principal components, by sex, using a stepwise procedure and retaining terms significant at the 5% level. We then applied an inverse normal rank transformation to the adjusted phenotype within sex strata and association was assessed assuming an additive model using PROC MIXED in SAS to account for the siblings.
The Framingham Heart Study
The Framingham Heart Study recruited 5,209 residents in 1948 from the population in Framingham, Massachusetts [41]. These individuals have had serial examinations and collection of respective data since. In 1971, 5,124 offspring from the original residents and their spouses were recruited into the Offspring Study and have been followed for four to eight years since [42]. In 2002, 4,095 third generation members and their spouses were enrolled [43].
Between 2002 and 2005, 1,400 individuals from the Offspring Study and 2,011 individuals from third generation underwent multidectector computed tomograms on which we evaluated liver attenuation as previously described [44]. Inclusion criteria favored individuals who lived in the New England area and included 755 families. Minimum age was 35 in men and 40 in women. Women of childbearing age were screened and pregnant women and individuals >160 kilograms were excluded from scanning. Individuals with scans that could not be interpreted for hepatic steatosis or did not attend offspring examination 7 as they lacked covariate data were not used for analysis. The average of the liver attenuation measures and a high density external calcium control were used to create a liver/phantom ratio to control for scan penetrance.
For GWAS analysis, inverse normally transformed liver attenuation/phantom ratio was used in a mixed linear model (controlling for relatedness) in R [45]with covariates of age, age squared, gender, and alcoholic drinks (4 oz = 1 drink) with the first ten principal components (as determined in Eigenstrat [46]) as covariates. Principal components were first generated using an unrelated sample of 718 and then projected to the rest of the cohort. Individuals who deviated from the mean of the principal components of more than six standard deviations were removed prior to analysis (n = 1).
Heritability analyses
Three of the four studies participating in this consortium were family studies and the family structure characteristics used for heritability are shown in Table 1. Liver attenuation adjusted for scan penetrance and then inverse normally transformed and corrected for age gender and number of alcoholic drinks (drinks in FamHS, and FRAM only as the Amish do not drink) was estimated in each of the studies and then heritability assessed using a variance components method as implemented in the software SOLAR [47]. Despite the diverse character of these family studies, there was remarkable consistency in the estimates of the proportion of variance due to genetic effects, and the magnitude of the heritabilities is comparable to many complex quantitative traits and suggests that a search for underlying genetic variants is warranted.
Meta-analysis and GWAS
Association data from the four studies above were filtered for SNPs that had a minor allele frequency >1% and for SNPs that had an imputation quality score of >0.3. All files were GC corrected after filtering and before meta-analysis. The inflation factor for the AGES study was 1.01, for the Amish was 1.05, for the Family Heart Study was 1.03, for the Framingham Heart Study was 1.02. Meta-analysis was conducted using a fixed effects model with a beta and standard error as implemented in METAL (http://www.sph.umich.edu/csg/abecasis/metal/). After meta-analysis, SNPs present in fewer than 3 studies were eliminated from analysis. The inflation factor for the overall meta-analysis was 1.03. The meta-analysis was GC corrected before the final p values were reported. The variation in CT hepatic steatosis explained by the tested SNPs was estimated from stage 2 analyses using 2f (1 – f) a2, where f is the frequency of the variant and a is its additive effect in units of standard deviations from the meta analysis [48].
Selection of SNPs for validation/replication with histologic NAFLD
To define independently associated SNPs, the LD was required to be R2<0.10 and the SNPs located at least 1 megabase from each other. From among these, the SNP with the strongest association was chosen for follow up (P<0.0001). Two iPlex pools consisting of 46 SNPs were designed and were successfully genotyped in the NASH CRN samples. Of these, only 45 were imputed well in MIGen, and only these SNPs were analyzed. Variants with a false discovery rate of q <0.05 were considered associated with NAFLD.
NASH CRN samples
Study: The NASH CRN samples were collected from eight different centers in the U.S. as previously described [2], [49]. Adults from both the Database and the PIVENS trial (Pioglitazone versus Vitamin E versus Placebo for the Treatment of Nondiabetic Patients with Nonalcoholic Steatohepatitis) were used for analysis. Briefly, individuals from the Database were part of an observational study of nonalcoholic fatty liver disease. Inclusion criteria included age >18, histologic diagnosis for NAFLD, or histologic diagnosis for cryptogenic cirrhosis or suspected NAFLD on the basis imaging studies suggestive of NAFLD, or clinical evidence of cryptogenic cirrhosis. No subjects reported regular excessive use of alcohol within two years prior to the initial screening period. Exclusion criteria included histologic evidence of liver disease besides nonalcoholic liver disease, known HIV positivity, and conditions that would interfere with study follow up. Individuals in the PIVENS database were part of a multicenter placebo controlled study with three parallel groups examining the effects of pioglitazone vs. vitamin E vs. placebo on NAFLD. Inclusion and exclusion criteria were as described previously [2], [49]. For this analysis, we excluded individuals who did not describe their race as being white and non-Hispanic. There were 678 adults who matched these criteria. Finally, individuals without histology available for central review were excluded, leaving 592 adults for the current study.
Histology determination in NASH CRN
Histologic diagnoses were determined in the NASH CRN by central review by NASH CRN hepatopathologists using previously published criteria [2], [49]. Predominantly macrovesicular steatosis was scored from grade 0–3. Inflammation was graded from 0–3 and cytologic ballooning from 0–2. The fibrosis stage was assessed from a Masson trichrome stain and classified from 0–4 according to the NASH CRN criteria. Individuals could contribute to more than one of these outcomes. The NASH CRN samples were genotyped and analyzed as described in Tables S2 and S3.
Analysis in NASH CRN/MIGen samples
MIGen controls were matched to the NASH CRN samples for genetic background. As previously described, the MIGen samples were collected from various centers in the US and Europe by the Myocardial Infarction Genetics Consortium (MIGen) [22] as controls for individuals with early onset MI. The genetic ancestry the MIGen samples was explored by using the program Eigenstrat [46]; the first principal component was the most significant and correlated with the commonly observed Northwest - Southeast axis within Europe [20] and genetic ancestry along this principal component is correlated with reported country of origin in the MIGen sample [22]. From this analysis, 120 unlinked SNPs were chosen from the MIGen genotype data that were most strongly correlated with the first principal component. These SNPs were genotyped in the NASH CRN samples to enable matching of MIGen controls to the NASH CRN [20] cases for genetic background. PLINK [50] was used to match individuals based on identity by state (IBS) distance using a pairwise population concordance test statistic of >1×10⁻³ for matching. The SNPs selected for validation were tested in this case-control sample using logistic regression controlling for age, age2, gender, and the first 5 principal components as covariates in PLINK [50]. We report the p-values, odds ratios and confidence intervals.
iCONT samples
We obtained 3,294 population based control samples with genotypes from Illumina (see http://www.illumina.com/science/icontroldb.ilmn). These individuals were used as controls in various case control analyses. Individuals were removed as described in Table S4 and 3,212 individuals were then used as controls for the NASH CRN/iCONT analyses.
Analysis in NASH CRN/iCONT samples
The 592 individuals from the NASH CRN described above were used as cases and 3,212 individuals from the iCONT database were used as controls. Genome wide significant or replicating SNPs were tested in this case-control sample using logistic regression controlling for gender in PLINK [50]. We report the p-values, odds ratios and confidence intervals.
Concordance analysis of imputed SNPs in MIGen and iCONT with the HapMap3 TSI sample
To assess the concordance of imputed SNPs in the MIGen and iCONT samples we obtained the genotyped SNPs from the HapMap3 TSI (Tuscans from Italy) sample. Using only the SNPs present on the Affymetrix 6.0 platform (used to genotype MIGen) or only the SNPs present on the Illumina platform (used to genotype iCONT samples) and the LD information from HapMap2 we imputed the remainder of the SNPs using MACH(1.0.16) and compared the imputed calls to the actual genotypes stratified by imputation quality score (R2 hat).
Evaluation of effects on other metabolic traits
To obtain data on whether CT hepatic steatosis SNPs affect other metabolic traits we obtained data from four consortia that had the largest and most powered analyses of these traits. Association results for HDL-, LDL - cholesterol levels and triglycerides (TG) were obtained from publicly available data of the GLOBAL Lipids Genetics Consortium (http://www.sph.umich.edu/csg/abecasis/public/Teslovich et al. 2010) [13]. Association results for fasting insulin, glucose, 2 hr-glucose, HOMA-IR and HOMA-B were obtained from the MAGIC Investigators. Association results for risk of type 2 diabetes were obtained from the DIAGRAM consortium [15].
Association results for risk of BMI and waist to hip ratio controlled for BMI were obtained from the GIANT consortium [14]. We used a conservative nominal p<0.0008 corresponding to a bonferroni correction of 12 phenotypes tested for 5 SNPs to determine significance.
Expression QTL analyses
The expression QTL analyses in liver, subcutaneous and omental fat tissue have been described in detail previously [17]. Tissue were obtained from patients who underwent bariatric surgery, and RNA expression assessed using a custom Agilent 44,000 feature microarray composed of 39,280 oligonucleotide probes targeting transcripts representing 34,266 known and predicted genes. Patients were also genotyped on the Illumina 650Y SNP genotyping arrays. SNPs were tested for cis-associations with transcripts within a 1 Mb region, assuming an additive effect of the CT hepatic steatosis increasing allele adjusting for age, race, gender, and surgery year using linear regression. Cis-associations between each SNP and the adjusted gene expression data were tested, and only associations with a nominal p-value <3.5×10⁻⁵ corresponding to a bonferroni correction for 284 gene transcripts x 5 SNPs tested are shown in Table S10. Conditional analyses were performed by conditioning the CT hepatic steatosis associated SNP on the most significant cis-associated SNP for that particular gene transcript and vice versa.
Supporting Information
Zdroje
1. ClarkJM
2006 The epidemiology of nonalcoholic fatty liver disease in adults. J Clin Gastroenterol 40 S5 10
2. KleinerDE
BruntEM
Van NattaM
BehlingC
ContosMJ
2005 Design and validation of a histological scoring system for nonalcoholic fatty liver disease. Hepatology 41 1313 1321
3. HarrisonSA
Neuschwander-TetriBA
2004 Nonalcoholic fatty liver disease and nonalcoholic steatohepatitis. Clin Liver Dis 8 861 879
4. FanJG
ZhuJ
LiXJ
ChenL
LuYS
2005 Fatty liver and the metabolic syndrome among Shanghai adults. J Gastroenterol Hepatol 20 1825 1832
5. StrubenVM
HespenheideEE
CaldwellSH
2000 Nonalcoholic steatohepatitis and cryptogenic cirrhosis within kindreds. Am J Med 108 9 13
6. WillnerIR
WatersB
PatilSR
ReubenA
MorelliJ
2001 Ninety patients with nonalcoholic steatohepatitis: insulin resistance, familial tendency, and severity of disease. Am J Gastroenterol 96 2957 2961
7. SchwimmerJB
CeledonMA
LavineJE
SalemR
CampbellN
2009 Heritability of nonalcoholic fatty liver disease. Gastroenterology 136 1585 1592
8. RomeoS
KozlitinaJ
XingC
PertsemlidisA
CoxD
2008 Genetic variation in PNPLA3 confers susceptibility to nonalcoholic fatty liver disease. Nat Genet 40 1461 1465
9. KotronenA
JohanssonLE
JohanssonLM
RoosC
WesterbackaJ
2009 A common variant in PNPLA3, which encodes adiponutrin, is associated with liver fat content in humans. Diabetologia 52 1056 1060
10. IwasakiM
TakadaY
HayashiM
MinamiguchiS
HagaH
2004 Noninvasive evaluation of graft steatosis in living donor liver transplantation. Transplantation 78 1501 1505
11. SaadehS
YounossiZM
RemerEM
GramlichT
OngJP
2002 The utility of radiological imaging in nonalcoholic fatty liver disease. Gastroenterology 123 745 750
12. LimanondP
RamanSS
LassmanC
SayreJ
GhobrialRM
2004 Macrovesicular hepatic steatosis in living related liver donors: correlation between CT and histologic findings. Radiology 230 276 280
13. TeslovichTM
MusunuruK
SmithAV
EdmondsonAC
StylianouIM
2010 Biological, clinical and population relevance of 95 loci for blood lipids. Nature 466 707 713
14. SpeliotesEK
WillerCJ
BerndtSI
MondaKL
ThorleifssonG
2010 Association analyses of 249,796 individuals reveal 18 new loci associated with body mass index. Nat Genet 42 937 948
15. VoightBF
ScottLJ
SteinthorsdottirV
MorrisAP
DinaC
2010 Twelve type 2 diabetes susceptibility loci identified through large-scale association analysis. Nat Genet 42 579 589
16. DupuisJ
LangenbergC
ProkopenkoI
SaxenaR
SoranzoN
2010 New genetic loci implicated in fasting glucose homeostasis and their impact on type 2 diabetes risk. Nat Genet 42 105 116
17. ZhongH
YangX
KaplanLM
MolonyC
SchadtEE
2010 Integrating pathway analysis and genetics of gene expression for genome-wide association studies. Am J Hum Genet 86 581 591
18. YuanX
WaterworthD
PerryJR
LimN
SongK
2008 Population-based genome-wide association studies reveal six loci influencing plasma levels of liver enzymes. Am J Hum Genet 83 520 528
19. PetersenKF
DufourS
HaririA
Nelson-WilliamsC
FooJN
2010 Apoliporpotein C3 gene variants in nonalcoholic fatty liver disease. N Engl J Med 362 1082 1089
20. PriceAL
ButlerJ
PattersonN
CapelliC
PascaliVL
2008 Discerning the ancestry of European Americans in genetic association studies. PLoS Genet 4 e236 doi:10.1371/journal.pgen.0030236
21. SpeliotesEK
ButlerJL
PalmerCD
VoightBF
ConsortiumtG
2010 PNPLA3 variants specifically confer increased risk for histologic NAFLD but not metabolic disease. Hepatology 52 904 912
22. KathiresanS
VoightBF
PurcellS
MusunuruK
ArdissinoD
2009 Genome-wide association of early-onset myocardial infarction with single nucleotide polymorphisms and copy number variants. Nat Genet 41 334 341
23. ValentiL
Al-SerriA
DalyAK
GalmozziE
RamettaR
Homozygosity for the patatin-like phospholipase-3/adiponutrin I148M polymorphism influences liver fibrosis in patients with nonalcoholic fatty liver disease. Hepatology 51 1209 1217
24. SpeliotesEK
MassaroJM
HoffmannU
RamachandranV
MeigsJB
2010 Fatty liver is associated with dyslipidemia and dysglycemia independent of visceral fat: The Framingham Heart Study. Hepatology 51 1979 1987
25. SaxenaR
VoightBF
LyssenkoV
BurttNP
de BakkerPI
2007 Genome-wide association analysis identifies loci for type 2 diabetes and triglyceride levels. Science 316 1331 1336
26. WillerCJ
SannaS
JacksonAU
ScuteriA
BonnycastleLL
2008 Newly identified loci that influence lipid concentrations and risk of coronary artery disease. Nat Genet 40 161 169
27. KathiresanS
WillerCJ
PelosoGM
DemissieS
MusunuruK
2009 Common variants at 30 loci contribute to polygenic dyslipidemia. Nat Genet 41 56 65
28. KathiresanS
MelanderO
GuiducciC
SurtiA
BurttNP
2008 Six new loci associated with blood low-density lipoprotein cholesterol, high-density lipoprotein cholesterol or triglycerides in humans. Nat Genet 40 189 197
29. LindgrenCM
HeidIM
RandallJC
LaminaC
SteinthorsdottirV
2009 Genome-wide association scan meta-analysis identifies three Loci influencing adiposity and fat distribution. PLoS Genet 5 e1000508 doi:10.1371/journal.pgen.1000508
30. BeerNL
TribbleND
McCullochLJ
RoosC
JohnsonPR
2009 The P446L variant in GCKR associated with fasting plasma glucose and triglyceride levels exerts its effect through increased glucokinase activity in liver. Hum Mol Genet 18 4081 4088
31. BurkeJE
DennisEA
2009 Phospholipase A2 structure/function, mechanism, and signaling. J Lipid Res 50 Suppl S237 242
32. BurkeJE
DennisEA
2009 Phospholipase A2 biochemistry. Cardiovasc Drugs Ther 23 49 59
33. HeS
McPhaulC
LiJZ
GarutiR
KinchLN
2009 A sequence variation (I148M) in PNPlA3 associated with nonalcoholic fatty liver disease disrupts triglyceride hydrolysis. J Biol Chem 285 6706 6715
34. RauchU
FengK
ZhouXH
2001 Neurocan: a brain chondroitin sulfate proteoglycan. Cell Mol Life Sci 58 1842 1856
35. AgiusL
2008 Glucokinase and molecular aspects of liver glycogen metabolism. Biochem J 414 1 18
36. AulchenkoYS
RipkeS
IsaacsA
van DuijnCM
2007 GenABEL: an R library for genome-wide association analysis. Bioinformatics 23 1294 1296
37. RampersaudE
BielakLF
ParsaA
ShenH
PostW
2008 The association of coronary artery calcification and carotid artery intima-media thickness with distinct, traditional coronary artery disease risk factors in asymptomatic adults. Am J Epidemiol 168 1016 1023
38. SorkinJ
PostW
PollinTI
O'ConnellJR
MitchellBD
2005 Exploring the genetics of longevity in the Old Order Amish. Mech Ageing Dev 126 347 350
39. HigginsM
ProvinceM
HeissG
EckfeldtJ
EllisonRC
1996 NHLBI Family Heart Study: objectives and design. Am J Epidemiol 143 1219 1228
40. CarrJJ
NelsonJC
WongND
McNitt-GrayM
AradY
2005 Calcified coronary artery plaque measurement with cardiac CT in population-based studies: standardized protocol of Multi-Ethnic Study of Atherosclerosis (MESA) and Coronary Artery Risk Development in Young Adults (CARDIA) study. Radiology 234 35 43
41. DawberT
1980 The Framingham Study: The Epidemiology of Atherosclerotic Disease. Cambridge, MA Harvard University Press
42. KannelWB
FeinleibM
McNamaraPM
GarrisonRJ
CastelliWP
1979 An investigation of coronary heart disease in families. The Framingham offspring study. Am J Epidemiol 110 281 290
43. SplanskyGL
CoreyD
YangQ
AtwoodLD
CupplesLA
2007 The Third Generation Cohort of the National Heart, Lung, and Blood Institute's Framingham Heart Study: design, recruitment, and initial examination. Am J Epidemiol 165 1328 1335
44. SpeliotesEK
MassaroJM
HoffmannU
FosterMC
SahaniDV
2008 Liver fat is reproducibly measured using computed tomography in the Framingham Heart Study. J Gastroenterol Hepatol 23 894 899
45. ChenMH
LarsonMG
HsuYH
PelosoGM
GuoCY
2010 A three-stage approach for genome-wide association studies with family data for quantitative traits. BMC Genet 11 40
46. PriceAL
PattersonNJ
PlengeRM
WeinblattME
ShadickNA
2006 Principal components analysis corrects for stratification in genome-wide association studies. Nat Genet 38 904 909
47. AlmasyL
BlangeroJ
1998 Multipoint quantitative-trait linkage analysis in general pedigrees. Am J Hum Genet 62 1198 1211
48. ThorleifssonG
WaltersGB
GudbjartssonDF
SteinthorsdottirV
SulemP
2009 Genome-wide association yields new sequence variants at seven loci that associate with measures of obesity. Nat Genet 41 18 24
49. ChalasaniNP
SanyalAJ
KowdleyKV
RobuckPR
HoofnagleJ
2009 Pioglitazone versus vitamin E versus placebo for the treatment of non-diabetic patients with non-alcoholic steatohepatitis: PIVENS trial design. Contemp Clin Trials 30 88 96
50. PurcellS
NealeB
Todd-BrownK
ThomasL
FerreiraMA
2007 PLINK: a tool set for whole-genome association and population-based linkage analyses. Am J Hum Genet 81 559 575
Štítky
Genetika Reprodukční medicínaČlánek vyšel v časopise
PLOS Genetics
2011 Číslo 3
- Kazuistika – Perspektivy využití precizované medicíny v rámci personalizované specifické terapie onkologických pacientů
- Nobelova cena za chemii pro genetické nůžky: Objev, který změní naši budoucnost?
- Technologie na bázi RNA v klinické praxi: od přebarvených petúnií k terapii vzácných a dosud jen obtížně léčitelných chorob u lidí
- „Nepředstavovali jsme si, že náš výzkum povede přímo ke vzniku nových léků, dokonce ještě za našeho života“
- Bezplatné služby pro diagnostiku ATTRv amyloidózy pro kardiology
Nejčtenější v tomto čísle
- Whole-Exome Re-Sequencing in a Family Quartet Identifies Mutations As the Cause of a Novel Skeletal Dysplasia
- Origin-Dependent Inverted-Repeat Amplification: A Replication-Based Model for Generating Palindromic Amplicons
- FUS Transgenic Rats Develop the Phenotypes of Amyotrophic Lateral Sclerosis and Frontotemporal Lobar Degeneration
- Limited dCTP Availability Accounts for Mitochondrial DNA Depletion in Mitochondrial Neurogastrointestinal Encephalomyopathy (MNGIE)
Zvyšte si kvalifikaci online z pohodlí domova
Mazová zátka a její řešení
nový kurzVšechny kurzy