
A Molecular Phylogeny of Living Primates
Comparative genomic analyses of primates offer considerable potential to define and understand the processes that mold, shape, and transform the human genome. However, primate taxonomy is both complex and controversial, with marginal unifying consensus of the evolutionary hierarchy of extant primate species. Here we provide new genomic sequence (∼8 Mb) from 186 primates representing 61 (∼90%) of the described genera, and we include outgroup species from Dermoptera, Scandentia, and Lagomorpha. The resultant phylogeny is exceptionally robust and illuminates events in primate evolution from ancient to recent, clarifying numerous taxonomic controversies and providing new data on human evolution. Ongoing speciation, reticulate evolution, ancient relic lineages, unequal rates of evolution, and disparate distributions of insertions/deletions among the reconstructed primate lineages are uncovered. Our resolution of the primate phylogeny provides an essential evolutionary framework with far-reaching applications including: human selection and adaptation, global emergence of zoonotic diseases, mammalian comparative genomics, primate taxonomy, and conservation of endangered species.
Published in the journal:
. PLoS Genet 7(3): e32767. doi:10.1371/journal.pgen.1001342
Category:
Research Article
doi:
https://doi.org/10.1371/journal.pgen.1001342
Summary
Comparative genomic analyses of primates offer considerable potential to define and understand the processes that mold, shape, and transform the human genome. However, primate taxonomy is both complex and controversial, with marginal unifying consensus of the evolutionary hierarchy of extant primate species. Here we provide new genomic sequence (∼8 Mb) from 186 primates representing 61 (∼90%) of the described genera, and we include outgroup species from Dermoptera, Scandentia, and Lagomorpha. The resultant phylogeny is exceptionally robust and illuminates events in primate evolution from ancient to recent, clarifying numerous taxonomic controversies and providing new data on human evolution. Ongoing speciation, reticulate evolution, ancient relic lineages, unequal rates of evolution, and disparate distributions of insertions/deletions among the reconstructed primate lineages are uncovered. Our resolution of the primate phylogeny provides an essential evolutionary framework with far-reaching applications including: human selection and adaptation, global emergence of zoonotic diseases, mammalian comparative genomics, primate taxonomy, and conservation of endangered species.
Introduction
The human genome project has revolutionized such fields as genomics, proteomics and medicine. Markedly absent from these many advances however, is a formal evolutionary context to interpret these findings, as the phylogenetic hierarchy of primate species has only modest local (family and genus level) molecular resolution with little consensus on overall primate radiations. The exact number of primate genera is controversial and species counts range from 261–377 [1]-[3]. Although whole genome sequencing of 12 primate species are now completed, or nearly so, broader genome representation of man's closest relatives is necessary to interpret human evolution, adaptation and genome structure to assist in biomedical advances.
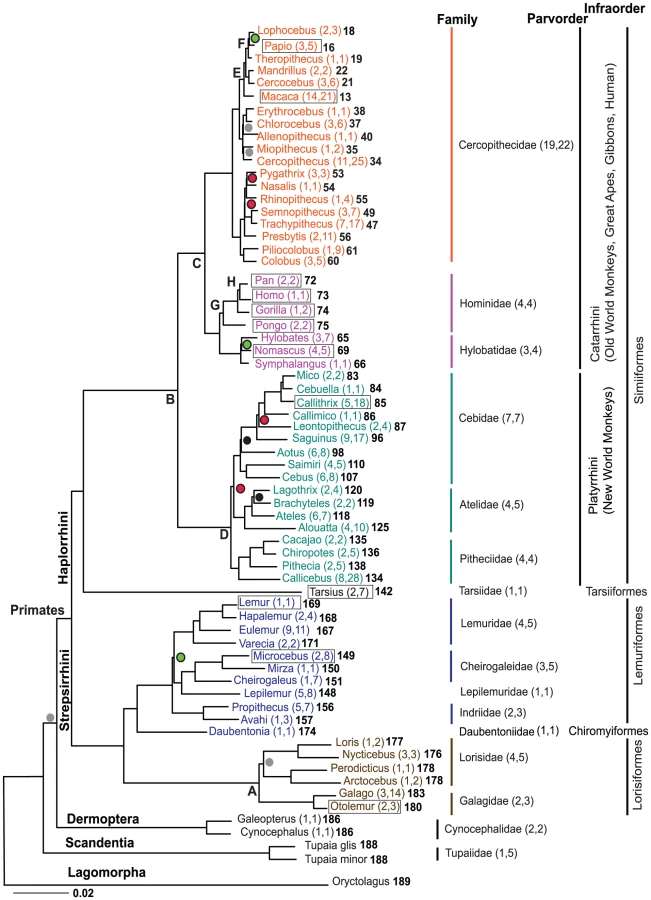
Primate taxonomy has undergone considerable revision but current views [1]-[3] concur that 67–69 primate genera originated from a common ancestor during the Cretaceous/Paleocene boundary roughly 80–90 MYA. An Eocene expansion formed the major extant lineages of 1) Strepsirrhini, which is composed of Lorisiformes (galagos, pottos, lorises), Chiromyiformes (Malagasy aye-aye) and Lemuriformes (Malagasy lemurs); 2) Tarsiiformes (tarsiers) and 3) Simiiformes composed of Platyrrhini (New World monkeys) and Catarrhini, which includes Cercopithecoidea (Old World monkeys) and Hominoidea (human, great apes, gibbons) (see Figure 1). Primate taxonomy, initially imputed from morphological, adaptive, bio-geographical, reproductive and behavioral traits, with inferences from the fossil record [1]-[3] is complex. Recent application of molecular genetic data to resolve primate systematics has been informative, but limited in scope and constrained to just specific subsets of taxa. Efforts to overcome this deficiency using a supermatrix approach [4], [5] with published sequences culled from these prior studies are inherently flawed by a prohibitively large proportion of missing data for each taxon (e.g. 59–85% see [5]).


Here we employ large-scale sequencing and extensive taxon sampling to provide a highly resolved phylogeny that affirms, reforms and extends previous depictions of primate speciation. In turn, the clarity of the primate phylogeny forms a solid framework for a novel depiction of diverse patterns of genome evolution among primate lineages. Such insights are essential in ongoing and future comparative genomic investigation of adaptation and selection in humans and across primates.
Results/Discussion
A comprehensive molecular phylogeny based on 34,927 bp (after correction for ambiguous sites from the original dataset of 43,493 bp per operational taxonomic unit, OTU) amplified from 54 nuclear genes in 191 taxa including 186 primates representing 61 genera is presented (Figure 1, Figure 2, Figure S1, Table S1, and Table S2). The phylogeny is highly resolved, with bootstrap values of 90–100% and Bayesian posterior probabilities of 0.9–1.0 at 166 of the 189 nodes (88%)(Table 1, Table 2, Table 3). Further, only 3 of 189 nodes (nodes 28, 38, 158) are polytomies in the bootstrap analyses (Table 1 and Table 3; Figure 2, Figure S1). (Note: nodes listed hereafter refer to Figure 2, Figure S1, Table 1, Table 2, Table 3). Roughly equal amounts of coding (14742 bp) and non-coding (17185 bp) genomic regions were sampled from X chromosome (4870 bp), Y chromosome (2630 bp) and autosomes (27427 bp) (Table 4) using newly developed PCR primers derived from a bioinformatics approach specific to primates in addition to primers from previous large-scale phylogenetic analyses (Materials and Methods, Tables S2, S3, S4).

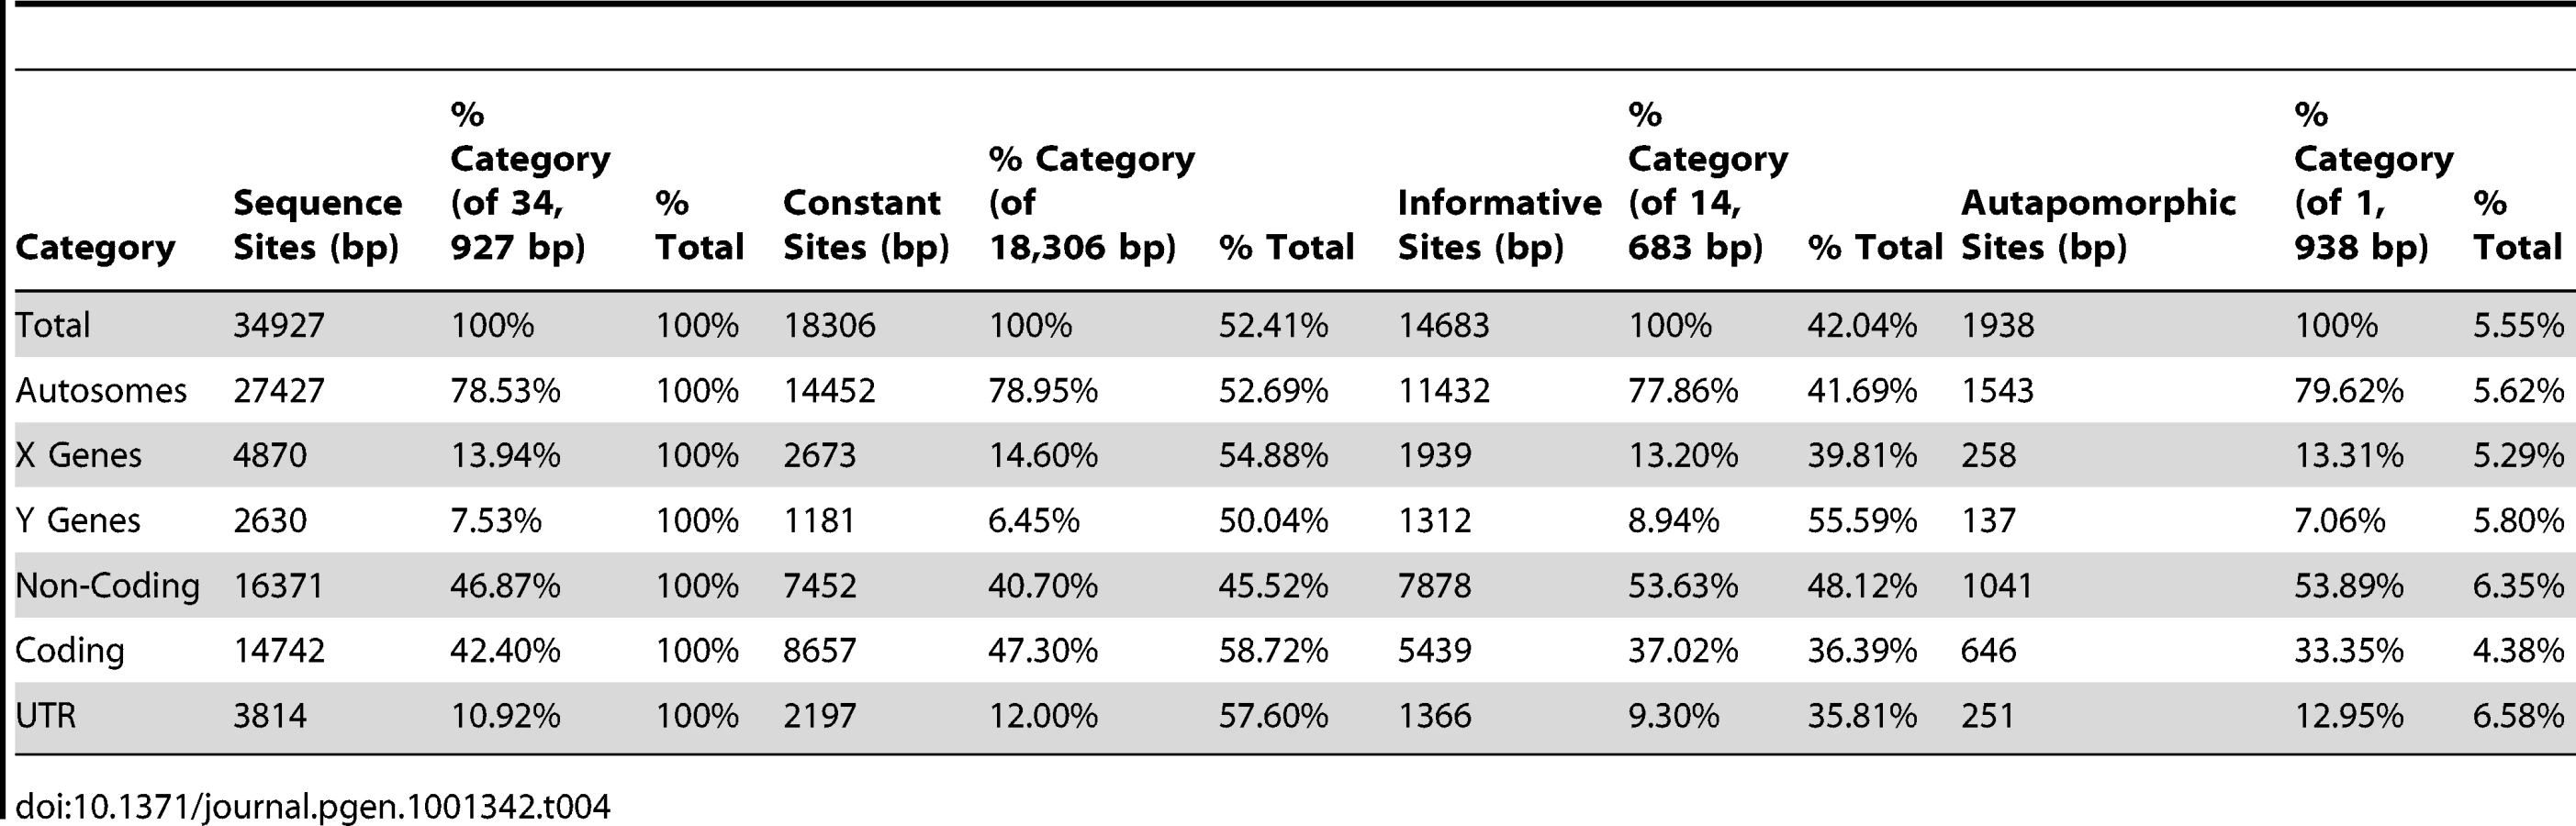
Separate phylogenetic analyses of these data partitions are generally concordant. The greatest proportion of phylogenetically informative sites occurred in Y-linked genes (56%) compared with regions sequenced from the X-chromosome (40%) and autosomes (42%) (Table 4, Table S4), a finding also observed in carnivores [6], [7]. However, greater frequency of phylogenetic inconsistencies or unresolved nodes occur in these subset trees (Figures S2, S3, S4, S5, S6, S7, S8, S9, S10, S11, S12, S13), compared with the entire concatenated data set (Figure 2, Figure S1). Thus, these findings illustrate the need for both genome-wide datasets and maximum representation of species to resolve differences among previous studies that used only single genes, the uniparentally inherited mtDNA molecular marker and smaller numbers of primate taxa.
Resolution of Early Primate Divergence
The relative placement of suborder Strepsirrhini and infraorder Tarsiiformes at an early stage of primate evolution has been difficult to resolve [8]-[11]. Presently distributed in the islands of Borneo, Sumatra, Sulawesi and the Philippines, Tarsiiformes had a broad Holarctic distribution during the Eocene [10]. Phylogenetic placement of tarsiers has alternatively been defined as 1) sister taxa to Strepsirrhini to form Prosimii [2], [8], [12], 2) allied with Simiiformes (Anthropoidea) to form Haplorrhini [1], [13], [14] and 3) a separate relict lineage with an independent origin [15]. Here we provide strong evidence that strepsirrhines split with suborder Haplorrhini approximately 87 MYA (node 185). The ancient lineage is monophyletic and defined by a long branch and eight shared insertions/deletions (indels) (node 144). Rooted by Lagomorpha, the phylogeny affirms Dermoptera as the closest mammalian order relative to Primates, followed by Scandentia [16], [17].
A long continuous Tarsiiformes branch (node 142), marked by 25 synapomorphic indels, is consistent with a relict lineage of ancient origin. The sequence phylogeny unambiguously supports tarsiers as a sister lineage (albeit distant) to Simiiformes (BS = 85 MP; 98 ML; 0.99 PP) to form Haplorrhini (node 143). A few indels (Table S5) define alternate evolutionary topologies, such as tarsiers aligned with Strepsirrhini (1 indel, ZFX) or Scandentia (1 indel, DCTN2), compared with those that support an ancestral grouping of Tarsiiformes +Strepsirrhini +Dermoptera +Scandentia (2 indels, PLCB4, POLA1). These incongruent alternatives suggest further investigation of more complex rare genomic changes as cladistic markers of ancient speciation is needed [17], [18].
Strepsirrhini
Aided by samples of rare taxa, the phylogeny expands upon recent findings [19]-[21] to better resolve long-standing questions on the evolution of Lorisiformes and the two endemic Madagascar infraorders of Chiromyiformes and Lemuriformes. Our data affirm the ancient split of Strepsirrhini, approximately 68.7 MYA (node 144), into the progenitors of Lemuriformes/Chiromyiformes (origin 58.6 MYA, node 174) and Lorisiformes (origin 40.3 MYA, node 184).
Lorisiformes evolution includes the radiation of Lorisidae (pottos and lorises, 37 MYA, node 179) and Galagidae (19.9 MYA, node 183) species. Within Lorisidae, the four extant genera split into the African subfamily Perodicticinae (Arctocebus, Perodictus) and the Asian subfamily Lorisinae (Nycticebus, Loris) and are the most divergent within all of primates. For example, mean nucleotide divergence between Lorisidae species is 4–5 times that observed in family Hominidae (Figure 3) and significantly (p<0.05) exceed the average genetic divergence across all of Strepsirrhini (nodes 176–178, Table S7, Figure 3). Galagidae are found only in Africa and currently are divided into four genera. However, the Otolemur lineage (node 180) is placed as part of a paraphyletic grouping (node 182) along with two other extant Galago lineages (nodes 181, 183), suggesting that further taxonomic investigation of Galago is warranted.

Common ancestors of Chiromyiformes and Lemuriformes likely colonized the island of Madagascar prior to 58.6 MYA (node 174). Noted for extensive adaptive evolution, the relative hierarchical branching patterns of the four Lemuriformes families (Indriidae, Lepilemuridae, Lemuridae, Cheirogaleidae) recognized by taxonomists, has proven difficult to resolve conclusively. Inferences on species versus subspecies classification are controversial with as many as 97 Malagasy lemurs [22] under taxonomic review. Chiromyiformes diverged from a common ancestor with Lemuriformes shortly after colonisation of Madagascar [14], [19] and today consists of a single relict genus Daubentonia defined by a long branch with high indel frequency (N = 14) (Figure 2, Figure S1, Table S7). The evolution of the four Lemuriformes families began 38.6 MYA (node 173) with the emergence of Lemuridae, followed by Indriidae and a monophyletic lineage that split 32.9 MYA (node 152) to form the sister lineages of Lepilemuridae and Cheirogaleidae. This branching pattern among families agrees with earlier nuclear gene segment findings [20] that differ from studies using mtDNA sequence and Alu insertion variation which were unable to resolve these hierarchical associations [19]. Further, relatively weak nodal support here collapses Lemuriformes into an unresolved trichotomy of Lemuridae, Indriidae, and the Lepilemuridae + Cheirogaleidae lineage (node 158). Optimal resolution of this node is observed with exon sequences (Figures S8 and S9), indicating that intron sites may be saturated, while more conserved coding regions remain informative and reflect the ancient rapid radiation of Lemuriformes families.
New World Primates (Platyrrhini)
The phylogeny clarifies formerly unresolved questions concerning New World primate evolution including branching order among families, relative divergence of genera within families, and phylogenetic placement of Aotus, and provides genetic support for examples of adaptive evolution that led to nocturnalism, “phyletic dwarfism” and species diversification within the Amazonian rainforest. Here, Platyrrhini clearly diverged from a common ancestor with Catarrhini (node 141) roughly 43.5 MYA during the Eocene. Although questions remain about the route and nature of primate colonization of the New World [23], [24] and the impact of historic global climate change in neotropical regions [25], [26], the phylogeny unambiguously resolves the relative divergence pattern among families from a common ancestor 24.8 MYA (node 78).
The common ancestor to Pitheciidae (uakaris, titis and sakis) originated 20.2 MYA (node 140) and the majority of these species currently are distributed in the neotropical Amazonian basin extending from the Andean slopes to the Atlantic. Next to radiate are the Atelidae (node 126), with the most basal lineage leading to Alouatta (howler monkeys), currently widely distributed from Mexico to northern Argentina, followed by the divergence of Ateles (spider monkeys) from South American lineage comprised of sister genera (node 121) of Lagothrix (woolly monkeys) and Brachyteles (muriquis).
The Cebidae radiation initiated with the emergence of sister taxa Cebus (Cebinae) and Saimiri (Saimirinae) approximately 20 MYA (node 113), in agreement with other molecular studies [27]-[30]. Subsequently, during a relatively brief interval (∼700,000 years) a lineage arose (node 112) that split to form the Callitrichinae (marmosets and tamarins) and Aotus (night monkeys). The Aotus lineage (node 98) radiated with unusually high numbers of synapomorphic indels (N = 15), the most observed in Simiiformes (Table 2 and Table 3), to form a complex species group of controversial taxonomic designation as subfamily or family and uncertainty over its exact placement relative to other Cebidae lineages. Here, Aotus is the sister lineage to Callitrichinae (marmosets, tamarins) as originally hypothesized by Goodman (1998) [1], [28]. Aotus species divide into sister lineages, with the “grey-necked” species (A. trivirgatus + A. lemurinus griseimembra) distributed north of the Amazon River, and “red-necked” species A. nancymaae, A. azarae species and associated subspecies located most to the south (nodes 98, 101, 102). The unusual depth of divergence (i.e. sizeable nucleotide substitutions/site; high indel frequency) may exemplify adaptive speciation as Aotus are the only nocturnal Simiiformes [31], and thereby may have reduced competition with diurnal small-bodied platyrrhines inhabiting the same neotropical environments.
Another case of adaptation termed “phyletic dwarfism,” defined as a gradient in morphological size partially correlated with evolutionary time [32], is supported in Cebidae. Aotus, Cebus and Saimiri species are larger than the more derived and smaller squirrel-sized Callitrichinae of Saguinus, Leontopithecus, Callimico, Mico, Cebuella and Callithrix. In Callitrichinae, Saguinus is the first to diverge with S. fuscicollis currently distributed south of the Amazon River. Subsequently, the genus diversified into northern (S. bicolor, S. midas, S. martinsi, S. geoffroyi, S. oedipus) and south Amazonian species (S. imperator, S. mystax, S. labiatus); a trend generally similar to findings based on mtDNA [33] and single nuclear genes [34]. The hierarchical branching order among the remaining Callitrichinae of Leontopithecus, Callimico, Callithrix and Mico mirrors decreasing body size and culminates with the smallest platyrrhine species, Cebuella pygmaea, as most derived. This phylogenetic depiction of Callitrichinae is concordant with several other morphological and reproductive traits [32], [35] related to dwarfism and perhaps reflects adaptive evolution selected by fluctuating resource availability within the Amazon and Atlantic coast rainforests [36].
Old World Primates (Cercopithecoidea)
Cercopithecoidea (family Cercopithecidae) speciation patterns are confounded by symplesiomorphic traits in morphology, behavior and reproduction, and are further confused by hybridization between sympatric species, subspecies and populations (summarized in [2]). Cercopithecidae includes two subfamilies, Colobinae and Cercopithecinae, which diverged 18 MYA (node 62), but classification schemes [2] are marked by inconsistencies between morphological [37], [38] and genetic data, as well as differences among genetic data studies [4], [27], [39]-[44].
Colobinae radiation started approximately 12 MYA (node 42) with species adapted to an arboreal, leaf-eating existence. Asian (tribe Presbytini) and African (tribe Colobini) genera are monophyletic (nodes 53 and 61, respectively), supporting earlier genetic findings [4], [40] over morphology-based taxonomy [2], [45]. Whilst African genera Piliocolobus and Colobus are commonly recognized, the taxonomic schemes for the critically endangered Asian langur and leaf monkeys, all sharing digestive adaptations for an arboreal folivorous diet, have ranged from a single genus Presbytis to three distinct genera (Trachypithecus, Semnopithecus, Presbytis). Here, the Presbytis lineage, distinguished by 3 indel events (node 56), diverged first within Asian Colobinae, followed by the odd-nosed group (Rhinopithecus, Nasalis, Pygathrix), Trachypithecus and Semnopithecus. As odd-nosed species are not exclusively arboreal and folivorous, the results indicate either 1) morphological convergence between Presbytis with Trachypithecus and Semnopithecus, 2) adaptation for an expanded diet in the odd-nosed group, or 3) that a folivorous diet is a symplesiomorphic trait within Asian colobines.
Trachypithecus and Semnopithecus genera consist of closely related, often sympatric species (node 51), distributed in the Indian subcontinent and SE Asia, with inconsistent phylogenetic resolution among species [4], [27], [40], [44], [46]. Nonetheless, all genetic studies, including the present, place Trachypithecus vetulus (monticola) nested within the Semnopithecus clade (node 50), suggesting the need for taxonomic revision. Further, previously ambiguous associations between Trachypithecus and Semnopithecus (nodes 43–51) are clarified. Inter-specific genetic differences are roughly half those observed among other colobine genera (Figure 2, Figure S1, Table 3, Table S9) and may indicate that recent speciation, taxonomic over-splitting, reticulate evolution, or a combination thereof, (e. g. see [40], [44], [46]) are common within the Asian Colobinae radiation.
The remainder of Old World monkeys (tribes Papionini and Cercopithecini) [2] arose from a common ancestor approximately 11.5 MYA (node 41). Considerable interest in Cercopithecinae speciation is motivated not only by primate conservation, but increased biomedical surveillance for novel zoonotic agents and comparative research of host-pathogen adaptation relevant to the study of deadly human viral pandemics such as HIV/SIV.
Cercopithecini (guenons, patas monkey, talapoin, green monkeys) include lineages rooted by divergent monotypic genera followed by more recent speciation, characterized by transition from an arboreal to a terrestrial lifestyle. Generally arboreal, Miopithecus and Allenopithecus are early offshoots with respect to the two Cercopithecini subclades formed approximately 7 MYA. The Cercopithecus lineage (node 34) radiated after Miopithecus and retained an arboreal lifestyle. The second, rooted by Allenopithecus, forms a terrestrial clade of Erythrocebus patas and Chlorocebus species, with Cercopithecus l'hoesti separated the other Cercopithecus. This paraphyly, also reported in earlier genetic studies [39], [47], [48] and counter to initial morphological classifications [2], suggests taxonomic revision of Cercopithecus. Further, resolution of Allenopithecus (node 40) and Miopithecus (node 35) speciation herein suggests a single evoluiontary transition from an arboreal to a terrestrial lifestyle in E. patas, C. l'hoesti, and Chlorocebus species.
Papionini (macaques, mandrills, drills, baboons, geladas, mangabeys) is a taxonomically complex tribe [2]. One of the more familiar genera within Cercopithecoidea, Macaca (macaques) diverged 5.1 MYA and today is represented by an African lineage comprised of a single species M. sylvanus, and an Asian lineage consisting of well-defined species groups (fascicularis, sinica, mulatta, nemestrina, Sulawesi) inhabiting India and Asia, SE Asia and Sundaland [49]. With the exception of the fascicularis group, which is split in this study whereby M. arctoides [fascicularis] is more closely aligned with M. thibetana [sinica] rather than M. fascicularis as expected, our data otherwise strongly support these macaque species groups (nodes 6, 11). Moreover, the phylogeny affirms Groves [2] proposal that Lophocebus and Theropithecus are distinct clades apart from Papio (nodes 18, 19), although the average nucleotide divergence among these three genera are generally less than between other recognized Papionin genera (Macaca, Mandrillus, Cercocebus) (Figure 2, Figure S1, Table 3, Table S9). Lastly, sequence divergence between tribes is unequal with Cercopithecini nearly twice that of Papionini (mean branch length = 13.1, 7.43, respectively, p<0.005) and there are numerous instances of discordance between the present phylogeny with previous mtDNA studies [4], [5] suggesting that continued resolution of Cercopithecinae speciation and of Papionini in particular, will likely include evidence of reticulate evolution represented by ongoing and historic episodes of hybridization (e.g. see [39], [48]).
Hominoidea
Once contentiously debated, the closest human relative of chimpanzee (Pan) within subfamily Homininae (Gorilla, Pan, Homo) is now generally undisputed. The branch forming the Homo and Pan lineage apart from Gorilla is relatively short (node 73, 27 steps MP, 0 indels) compared with that of the Pan genus (node 72, 91 steps MP, 2 indels) and suggests rapid speciation into the 3 genera occurred early in Homininae evolution. Based on 54 gene regions, Homo-Pan genetic distance range from 6.92 to 7.90×10⁻³ substitutions/site (P. paniscus and P. troglodytes, respectively), which is less than previous estimates based on large scale sequencing of specific regions such as chromosome 7 [50]. The highly endangered orangutan forms the single genus Pongo in subfamily Ponginae (nodes 75–76), the sister lineage to Homininae. Currently restricted to the islands of Borneo and Sumatra, orangutans once inhabited all of Southeast Asia during the Pleistocene [51]. Differences in behavior, morphology, karyology, and genetic data between the two island populations [2] support the taxonomic designation as two separate species of Bornean (P. pygmaeus) and Sumatran orangutans (P. abelii), and these designations are upheld by the data presented here.
Hylobatidae (siamang, gibbons, hoolock) are noted for exceptional rates of chromosome re-arrangement [52], [53], 10–20 times faster than in most mammals [54]. Classification schemes of the 12 species range from two genera (Hylobates and Symphalangus) to four subgenera and/or genera (Hylobates, Nomascus, Symphalangus, Hoolock), defined by unique numbers of chromosomes [54], [55]. The eight species included in this study form three clades that coincide with genus designation (absent is Hoolock; nodes 64–69) that diverged rapidly 8.9 MYA. Moreover, Nomascus species appear more recent than Symphalangus and Hylobates, with node divergence dates estimated at less than 1 MY (Table 3, Table S9, Figure 2). Thus, Hylobatidae exhibits episodes of rapid divergence perhaps related to excessive genome re-organization and warrants additional investigation.
Genome Divergence, Rate Heterogeneity, and Indels
The clarity of the primate phylogeny here can be used to assess nucleotide divergence patterns, rates of substitution and accumulation of synapomorphic and autapomorphic indels. Genome divergence varies across primate lineages, with the least inter-specific differences observed in Cercopithecidae lineages and the most in Lorisidae, reflecting recent speciation in the former and the more ancient origins of the latter (Figure 3, Table 1, Table 3, Tables S7 and S9).
The global rate of nucleotide substitution across the entire primate phylogeny is 6.163×10⁻⁴ substitutions/ site/ MY, but exhibits significant heterogeneity across lineages (Figure 3) and among branches (Table 1, Table 2, Table 3; Tables S6, S7, S8). For example, the “hominoid slow-down” hypothesized to have occurred in human evolution, is confounded by the reduced rates observed in all Catarrhini (not just Homininae) compared with Platyrrhini and Strepsirrhini (Figure 3, Table S10). By contrast, the “phyletic dwarfism” of the Callitrichinae (nodes 97, 85) and the evolution of nocturnalism in Aotinae are correlated with increased rates along specific branches (see nodes 99, 100) rather than an being a function of an average rate among all branches within the lineage (Figure 3), suggesting that an adaptive “speed-up” occurred in the common ancestors of these extant species.
The genome accumulates indels over evolutionary time, altering the degree of sequence homology between taxa. Further, large-scale genome sequence analysis demonstrate that indel formation is an indicator of genome plasticity, positively correlated with adjacent nucleotide substitution rate [56], [57], gene segmental duplication, chromosomal position, hybridization between species and speciation, and is enhanced by molecular mechanisms of recombination among repetitive elements [58]-[60]. Here, the distribution of indels is ubiquitous in both coding and noncoding segments (Tables S4, S5, S6), but is markedly disjunct among primate lineages (Figure 3). Excluding the infraorders Tarsiiformes (25 indels) and Chiromyiformes (14 indels) due to statistically inadequate sampling, the indel frequency per branch varies by a factor of 20 (Table 1, Table 2, Table 3; Tables S7, S8, S9) with the greatest accumulation within Lorisidae (particularly Arctocebus calabarensis) and the least in Cercopithecidae (Figure 3). The major correlate of indel frequency is not substitution rate, but overall genome divergence represented by branch length (R-square = 0.659 Lorisiformes; 0.610 Lemuriformes; 0.3286 Simiiformes; P<0.05).
Conclusions
The molecular genetic resolution of the primate phylogeny provides a robust comparative genomic resource to affirm, alter, and extend previous taxonomic inferences. Approximately half of the 261–377 species and 90% of the genera are included facilitating resolution of long-standing phylogenetic ambiguities. Early events within primate evolution are resolved such as: Dermoptera is the closest mammalian order to Primates; Tarsiiformes are sister taxa with Simiiformes to form Haplorrhini; Chiromyiformes (Daubentoniidae) and Lemuriformes are monophyletic indicating a common ancestral lineage colonized the island of Madagascar once; and the hierarchical divergence pattern among New World families Pitheciidae, Atelidae, and Cebidae is clarified.
Additional insights are possible because the relative branching patterns among infraorders, parvorders, superfamilies, families, subfamilies, genera and species are resolved with high measures of support for all but three nodes. For example, Old World monkeys (Cercopithecoidea) display remarkably low levels of divergence, particularly within Papionini, consistent with reticulate evolution, recent speciation and possibly augmented by taxonomic over-splitting. By contrast, the Lorisidae are marked by extraordinary divergence relative to other primate lineages. In the New World, the phylogenetic placement of the unique, nocturnal Aotinae is unambiguously resolved, diverging rapidly after the sister lineage of Cebinae+Saimirinae and prior to the Callitrichinae within the family Cebidae. Further, the pattern of divergence of Callitrichinae is correlated with a gradation in species size, supporting “phyletic dwarfism” [32], [35]. In the context of human evolution, the large amount of sequence available here for each well-recognized species in Hominidae provides a baseline estimate of average genetic divergence per taxonomic level in primates. However, deviations from these values observed across diverse lineages illustrate the remarkable biodiversity and species richness within the Primate order.
One of the more intriguing unresolved questions is the origin of primates. Generally concordant, most molecular data suggest extant primates arose approximately 85 MYA from a common ancestor. However, the debate continues over the geographic locale most consistent with the existing fossil record [9], [10], [12], [16], [23], [26], [61]-[63]. A parsimonious interpretation of the present data would suggest an Asian origin as the ancient Asian Tarsiiformes and the strepsirrhine Lorisinae are most basal and the closest relatives of primates, Dermoptera and Scandentia, are also exclusive to Asia.
Primate genomes harbor remarkable differences in patterns of speciation, genome diversity, rates of evolution and frequency of insertion/deletion events that are fascinating in their own right, but also provide needed insight into human evolution. Advances in human biomedicine including those focused on changes in genes triggered or disrupted in development, resistance/susceptibility to infectious disease, cancers, mechanisms of recombination and genome plasticity, cannot be adequately interpreted in the absence of a precise evolutionary context or hierarchy. Resolution of the primate species phylogeny here provides a validated framework essential in the development, interpretation and discovery of the genetic underpinnings of human adaptation and disease.
Materials and Methods
Ethics Statement
Primate DNA samples were obtained following the guidelines of Institutional Animal Care and Use Committee policies of respective research institutions (see Table S1). All tissue samples for the Laboratory of Genomic Diversity were collected in full compliance with specific Federal Fish and Wildlife permits from the Conservation of International Trade in Endangered Species of Wild flora and Fauna: Endangered and Threatened Species, Captive Bred issued to the National Cancer Institute (NCI)-National Institutes of Health (NIH) (S.J.O. principal officer) by the U.S. Fish and Wildlife Services of the Department of the Interior. Duke University Lemur samples (J.E.H.) were collected under research project BS-4-06-1 and Institutional Animal Care and Use Committee (IACUC) project A094-06-03, and this paper is Duke Lemur Center publication #1192.
DNA Specimens
A complete list of individual and source DNA are presented in Table S1. DNA was extracted from whole blood, buffy coat, hair or buccal swab samples using DNeasy Blood & Tissue Kit (Qiagen) following manufacture's protocol. DNA from different tissues (muscle, kidney etc) or cell culture pellets was extracted using standard phenol∶chloroform extraction methods. Proteinase K digestion in lysis buffer (100 mM NaCl, 10 mM Tris-HCl pH 8.0, 25 mM EDTA pH 8.0, 0.6% SDS, 100 µg/ml RNAse A) at 56 °C for 3–12 hours rotating was followed by 30 minute phenol, phenol∶chloroform 70∶30, and chloroform extractions using phase-lock gel tubes (Eppendorf) followed by ethanol precipitation and 70% ethanol wash. Dried DNA was reconstituted in TE pH 7.4 buffer and stored at 4 °C. DNA was quantified using Nanodrop (Thermo Scientific) and its quality was assessed using 0.7% agarose gel electrophoresis.
DNA of limited quantity was used for whole-genome amplification using REPLI-g Midi Kit (Qiagen). 50–100 ng of genomic DNA (depending on its quality) was used per one 50 µl reaction according to the manufacturer's protocol. A negative control (no template) was included in every WGA and was verified by downstream PCR and sequencing. Some strepsirrhine DNA was extracted and/or whole genome amplified as previously described [21].
Amplification of Gene Segments
A complete list of 54 primer sets used in this study is presented in Table S2. This list includes primers from earlier studies [12], [16], [21], [64]-[68], as well as those designed specifically for this study using a unique bioinformatics approach (Pontius, unpublished data). A panel of species representing the breadth of primate diversity was used in the testing and optimization of PCR primers and included: Gorilla gorilla, Pan paniscus, Nomascus leucogenys, Symphalanges syndactylus, Erythrocebus patas, Macaca fuscata, Macaca tonkeana, Chiropotes satanas, Saimiri boliviensis, Saimiri sciureus, Callithrix jacchus, Ateles fusciceps, Saguinus fuscicollis, Cheirogaleus medius, Lemur catta and Tupaia minor.
All nuclear gene regions in all the samples were amplified with the following conditions. Either 30 ng of genomic DNA or 1 µl of WGA product was diluted 1∶10 with 0.1XTE per PCR reaction. DNA quantity was increased for poor quality DNA. Genomic and WGA DNA was aliquoted into plates, dried at room temperature and stored at 4 °C. Each 15 µl PCR reaction contained 2 mM MgCl2, 250 µM of each dNTP, 150 µM of each forward and reverse primer, 0.8 units of AmpliTaq Gold polymerase (ABI) with 1X GeneAmp 10X PCR Gold Buffer. PCR was performed in PE ABI GeneAmp 9700 and Biometra T1 thermal cyclers. PCRs were carried out using a touchdown program with the following parameters: initial denaturation for 10 min at 95 °C; followed by 10 cycles of 95 °C for 15 s, 60–52 °C (2 cycles for each of the five down gradient annealing temperature steps: 60 °C, 58 °C, 56 °C, 54 °C and 52 °C) for 30 s, and 72 °C for 1 min; and followed by 25 cycles of 95 °C for 15 s, 50 °C for 30 s, and 72 °C for 1 min; and a final extension at 72 °C for 30 min. PCR products were analyzed on 2% agarose gels. Only PCR products that produced single bands were sequenced. PCR products were purified using AMPure kit (Agencourt) or Mag-Bind EZ Pure (OMEGA). PCR products were sequenced directly in two reactions with forward and reverse primers. The sequencing reactions were carried out with the BigDye Terminator v1.1 cycle sequencing kit (Applied Biosystems, Inc.). For 10 µl sequencing reactions we used 0.25 µl of BigDye, 2 µl of 5X Sequencing buffer, 0.32 µM primer and 2.5 µl of PCR product (we diluted PCR product if bands on the gel were too bright). Sequencing reactions were performed as following: 25 cycles of 96 °C for 10 s, 50 °C for 5 s, 60 °C for 4 minutes. Sequencing products were purified using paramagnetic sequencing clean-up CleanSEQ (Agencourt) or Mag-bind SE DTR (OMEGA). PCR and sequencing cleanups were performed on Beckman Coulter Biomek FX laboratory automation workstation. The sequencing products were analyzed with an ABI PRISM 3730 XL 96-well capillary sequencer. Some of the prosimian PCR products and sequences were obtained following earlier published methods [21]. Consensus sequences for each individual were generated from sequences in forward and reverse directions using Sequencher 4.9 program (Gene Codes Corporation). All sequences were deposited in GenBank under accession numbers presented in Table S11.
DNA Sequence Analyses
Multiple sequence files for each gene segment amplified were aligned by MAFFT version 6 [69], [70], imported into Se-Al ver 2.0a11 [71] and verified by eye. Regions of sequence ambiguity within the alignment were identified by GBLOCK version 0.91b [72], and removed from subsequent phylogenetic analyses. A FilemakerPro database was created to manage all sequence records for each individual DNA specimen and the concatenated dataset was exported. The final, post-GBLOCK, edited, annotated PAUP* nexus alignment of the 54 concatenated genes used for this study is publically available at the following website:
http://lgdfm3.ncifcrf.gov/190Taxa_Rabbit_PAUP.zip
The file is a compressed zip file that can be viewed in either a generic text editor, PAUP*, or alignment programs that read large nexus format files.
Phylogenetic Reconstruction of Primates
Gene partitions were analyzed separately, as well as combined, for genome comparison and phylogenetic reconstruction. Six gene partitions were created, corresponding to X-chromosome, Y-chromosome, autosome, intron, exon and UTR segments. A separate phylogenetic analysis was conducted for each of the six data partitions to compare the concordance among tree topologies derived from each partition. It should be noted that the Y-chromosome tree is not directly comparable to the topologies of the other data partitions because the number of males (N = 127) was a subset of the total (N = 191). In the concatenated data set of all 54 genes, females were coded as “missing” for the Y-chromosome gene sequence. Aligned multiple sequence files of either combined data or gene partitions were imported into ModelTest ver 3.7 [73] and the optimal model of nucleotide substitution was selected using the AIC criterion. Models are listed in Table S12.
Phylogenetic trees based on nucleotide data were obtained using a heuristic search with different optimality criteria of maximum likelihood (ML) and maximum parsimony (MP) as implemented in PAUP* ver 4.0a109 [74] for Macintosh (X86) and additional runs of ML as implemented in GARLI ver 0.96 [75]. In PAUP*, conditions for the ML analysis included starting trees obtained by stepwise addition, and branch swapping using the tree-bisection-reconnection (TBR) algorithm. The MP analyses used step-wise addition of taxa, TBR branch swapping and excluded indels. Support for nodes within the phylogeny used bootstrap analysis with identical settings established for each method of phylogenetic reconstruction and values greater than 50% were retained. The number of bootstrap iterations consisted of 1000 for MP methods and 100 for ML. Detailed control files used for GARLI ML analyses are available from corresponding author.
Bayesian Analyses of Primate Sequences: Posterior Probability, Node Support, and Divergence Dating
We estimated the phylogeny and divergence time splits simultaneously using a Bayesian approach as implemented in the program BEAST ver 1.5.3 [76], [77]. Due to computational constraints, analyses were performed with 5 different sets of species: 1) genus-level data set including 61 Primate genera, two Dermoptera genera and one Scandentia genus rooted by Lagomorpha, 2) Catarrhini species with outgroups, 3) Platyrrhini species with outgroups, 4) Strepsirrhini species with outgroups and 5) genus-level analysis with a partitioned data set allowing for rate heterogeneity and different substitution models for autosome, X-chromosome, and Y-chromosome sequences.
By using the uncorrelated lognormal relaxed-clock model, rates were allowed to vary among branches without the a priori assumption of autocorrelation between adjacent branches. This model allows sampling of the coefficient of variation of rates, which reflects the degree of departure from a global clock. Based on the results of ModelTest, we assumed a GTR+I+G model of DNA substitution with four rate categories. Uniform priors were employed for GTR substitution parameters (0, 100), gamma shape parameter (0, 100) and proportion of invariant sites parameter (0, 1). The uncorrelated lognormal relaxed molecular clock model was used to estimate substitution rates for all nodes in the tree, with uniform priors on the mean (0, 100) and standard deviation (0, 10) of this clock model. We employed the Yule process of speciation as the tree prior and a Unweighted Pair Group Method with Arithmetic Mean (UPGMA) tree to construct a starting tree, with the ingroup assumed to be monophyletic with respect to the outgroup. To obtain the posterior distribution of the estimated divergence times, nine calibration points were applied as normal priors to constrain the age of the following nodes (labeled A-H in Figure 1 of main text): A) mean = 40.0 MYA, standard deviation (stdev) = 3.0 for time to most recent common ancestor (TMRCA) of galagids and lorisids [78], B) mean = 43.0 MYA, stdev = 4.5 for TMRCA of Simiiformes [79], [80], C) mean = 29.0 MYA, stdev = 6.0 for TMRCA of Catarrhini [80], D) mean = 23.5 MYA, stdev = 3.0 for TMRCA of Platyrrhini [26], [81], E) mean = 7 MYA, stdev = 1.0 for TMRCA of Papionini [82], F) mean = 4.0 MYA, stdev = 0.4 for TMRCA of Theropithecus clade [40], [83], G) mean = 15.5 MYA, stdev = 2.5 for TMRCA of Hominidae [14] and H) mean = 6.5 MYA, stdev = 0.8 for TMRCA of Homo-Pan [84]. A normal prior for the mean root height of 90.0 MYA with stdev = 6.0 was used based on molecular estimates of MRCA of all Primates [14], [82], [85]. The calibration points selected are based on fossil dates that have undergone extensive review in previous publications and are supported by a consensus of paleoanthropologists. Rather than re-iterate the considerable amount of information forming the basis for each calibration point, we list the respective citations with the most detailed overview and attendant references.
Four to seven independent Markov chain Monte Carlo (MCMC) runs for each analysis were run for 20–100 million generations to ensure sampling of estimated sample size (ESS) values. The Auto Optimize Operators function was enabled to maximize efficiency of MCMC runs. Trees were saved every 1000 generations. Log files from each run were imported into Tracer ver 1.4.1, and trees sampled from the first 1 million generations were discarded. Mixing of trees was assessed in Tracer by examination of ESS values. Analysis of these parameters in Tracer suggested that the number of MCMC steps was more than adequate, with ESS of all parameters often exceeding 200, and Tracer plots showing strong equilibrium after discarding burn-in. Tree files from the individual runs were combined using LogCombiner ver 1.5.3 after removing 1000 trees from each sample. The maximum-clade-credibility tree topology and mean node heights were calculated from the posterior distribution of the trees. Final summary trees were produced in TreeAnnotator ver 1.5.3 and viewed in FigTree ver 1.3.1.
Computation of Nucleotide Substitution Rates
Heterogeneity in nucleotide substitution rates among primate taxa was assessed by a Bayesian approach, allowing for unequal rates of nucleotide substitution among lineages as implemented in BEAST. Rate estimates provided for each branch within the primate phylogeny were analyzed by ANOVA as implemented in SAS (SAS Institute Inc., SAS 9.1.3). Significant differences among means used the Duncan multiple means test.
Statistical Analyses of Insertion/Deletion Events among Primate Lineages
Indels were assessed as possible indicators of genome plasticity among primate lineages. An a priori approach was developed that used the derived primate phylogenetic tree (Figure 2) as a guide for identification of synapomorphic and autapomorphic indels. First, all indels were identified using FASTGAP on GBLOCKED alignments and verified by eye. Second, only indels that correctly conformed to the species associations of the primate phylogeny (Figure 2) were used and identified as a subset of synapomorphic events (Table 1, Table 2, Table 3; Tables S5, S6). Third, another subset of autapomorphic indels were identified and assessed as potential signatures of genome plasticity for a given species (Tables S7, S8, S9). Infrequently, some indels included in the analysis were positioned in regions that did not amplify across all species. In these cases, indels were identified as synapomorphic for a lineage providing ∼70% of the relevant species were successfully PCR amplified, and that species with missing sequence for the indel did not all occur on the same node within the lineage. The hypothesis that patterns of nucleotide substitution are influenced by indel frequency was tested by regression of ln-transformed branch length against ln-transformed indels per branch. Tests of the association between genome rates of evolution and indel frequency were conducted by regression of the rate of nucleotide substitution (substitution/site/MY) versus ln-transformed indel frequency per branch. Statistical software used was SAS (SAS Institute Inc., SAS 9.1.3).
Supporting Information
Zdroje
1. GoodmanM
PorterCA
CzelusniakJ
PageSL
SchneiderH
1998
Toward a phylogenetic classification of Primates based on DNA evidence complemented by fossil evidence.
Molecular Phylogenetics and Evolution
9
585
598
2. GrovesCP
2001
Primate taxonomy.
Washington, DC
Smithsonian Institution Press
350
3. WilsonDE
ReederDM
2005
Mammal species of the world : a taxonomic and geographic reference.
Baltimore
Johns Hopkins University Press
2142
4. ChatterjeeHJ
HoSYW
BarnesI
GrovesC
2009
Estimating the phylogeny and divergence times of primates using a supermatrix approach.
BMC Evolutionary Biology
9
259
5. FabrePH
RodriguesA
DouzeryEJP
2009
Patterns of macroevolution among Primates inferred from a supermatrix of mitochondrial and nuclear DNA.
Molecular Phylogenetics and Evolution
53
808
825
6. Pecon-SlatteryJ
WilkersonAJP
MurphyWJ
O'BrienSJ
2004
Phylogenetic assessment of introns and SINEs within the Y chromosome using the cat family Felidae as a species tree.
Molecular Biology and Evolution
21
2299
2309
7. JohnsonWE
EizirikE
Pecon-SlatteryJ
MurphyWJ
AntunesA
2006
The Late Miocene radiation of modern Felidae: A genetic assessment.
Science
311
73
77
8. Eizirik EMW
SpringerMS
O'BrienSJ
2004
Molecular Phylogeny and Dating of Early Primate Divergences.
Ross CFKR
Anthropoid Origins: New Visions
New York
Kluwer Academic/Plenum
45
65
9. BajpaiS
KayRF
WilliamsBA
DasDP
KapurVV
2008
The oldest Asian record of Anthropoidea.
Proceedings of the National Academy of Sciences of the United States of America
105
11093
11098
10. KayRF
RossC
WilliamsBA
1997
Anthropoid origins.
Science
275
797
804
11. NowakRM
1999
Walker's mammals of the world.
Baltimore
Johns Hopkins University Press
1936
12. MurphyWJ
EizirikE
JohnsonWE
ZhangYP
RyderOA
2001
Molecular phylogenetics and the origins of placental mammals.
Nature
409
614
618
13. SchmitzJ
OhmeM
ZischlerH
2001
SINE insertions in cladistic analyses and the phylogenetic affiliations of Tarsius bancanus to other primates.
Genetics
157
777
784
14. MatsuiA
RakotondraparanyF
MunechikaI
HasegawaM
HoraiS
2009
Molecular phylogeny and evolution of prosimians based on complete sequences of mitochondrial DNAs.
Gene
441
53
66
15. ArnasonU
AdegokeJA
BodinK
BornEW
EsaYB
2002
Mammalian mitogenomic relationships and the root of the eutherian tree.
Proceedings of the National Academy of Sciences of the United States of America
99
8151
8156
16. JaneckaJE
MillerW
PringleTH
WiensF
ZitzmannA
2007
Molecular and genomic data identify the closest living relative of primates.
Science
318
792
794
17. KriegsJO
ChurakovG
JurkaJ
BrosiusJ
SchmitzJ
2007
Evolutionary history of 7SL RNA-derived SINEs in supraprimates.
Trends in Genetics
23
158
161
18. ChurakovG
KriegsJO
BaertschR
ZemannA
BrosiusJ
2009
Mosaic retroposon insertion patterns in placental mammals.
Genome Research
19
868
875
19. RoosC
SchmitzJ
ZischlerH
2004
Primate jumping genes elucidate strepsirrhine phylogeny.
Proceedings of the National Academy of Sciences of the United States of America
101
10650
10654
20. HorvathJE
WillardHF
2007
Primate comparative genomics: lemur biology and evolution.
Trends in Genetics
23
173
182
21. HorvathJE
WeisrockDW
EmbrySL
FiorentinoI
BalhoffJP
2008
Development and application of a phylogenomic toolkit: resolving the evolutionary history of Madagascar's lemurs.
Genome Research
18
489
499
22. MittermeierR
GanzhornJ
KonstantW
GlanderK
TattersallI
2008
Lemur Diversity in Madagascar.
International Journal of Primatology
29
1607
1656
23. TakaiM
AnayaF
ShigeharaN
SetoguchiT
2000
New fossil materials of the earliest new world monkey, Branisella boliviana, and the problem of platyrrhine origins.
American Journal of Physical Anthropology
111
263
281
24. TakaiM
AnayaF
1996
New specimens of the oldest fossil platyrrhine, Branisella boliviana, from Salla, Bolivia.
American Journal of Physical Anthropology
99
301
317
25. PouxC
ChevretP
HuchonD
de JongWW
DouzeryEJP
2006
Arrival and diversification of caviomorph rodents and platyrrhine primates in South America.
Systematic Biology
55
228
244
26. HodgsonJA
SternerKN
MatthewsLJ
BurrellAS
JaniRA
2009
Successive radiations, not stasis, in the South American primate fauna.
Proceedings of the National Academy of Sciences of the United States of America
106
5534
5539
27. OsterholzM
WalterL
RoosC
2008
Phylogenetic position of the langur genera Semnopithecus and Trachypithecus among Asian colobines, and genus affiliations of their species groups.
BMC Evolutionary Biology
8
58
28. OpazoJC
WildmanDE
PrychitkoT
JohnsonRM
GoodmanM
2006
Phylogenetic relationships and divergence times among New World monkeys (Platyrrhini, Primates).
Molecular Phylogenetics and Evolution
40
274
280
29. SteiperME
RuvoloM
2003
New World monkey phylogeny based on X-linked G6PD DNA sequences.
Molecular Phylogenetics and Evolution
27
121
130
30. OsterholzM
WalterL
RoosC
2009
Retropositional events consolidate the branching order among New World monkey genera.
Molecular Phylogenetics and Evolution
50
507
513
31. Ankel-SimonsF
RasmussenDT
2008
Diurnality, Nocturnality, and the Evolution of Primate Visual Systems.
American Journal of Physical Anthropology
100
117
32. FordSM
DavisLC
1992
Systematics and body size: implications for feeding adaptations in New World monkeys.
American Journal of Physical Anthropology
88
415
468
33. CroppSJ
LarsonA
CheverudJM
1999
Historical biogeography of tamarins, genus Saguinus: The molecular phylogenetic evidence.
American Journal of Physical Anthropology
108
65
89
34. CanavezFC
MoreiraMAM
SimonF
ParhamP
SeuanezHN
1999
Phylogenetic relationships of the callitrichinae (Platyrrhini, Primates) based on beta(2)-microglobulin DNA sequences.
American Journal of Primatology
48
225
236
35. FordSM
1980
Callitrichids as phyletic dwarfs, and the place of Callitrichidae in Platyrrhini.
Primates
21
31
43
36. MoynihanM
1976
The New World primates : adaptive radiation and the evolution of social behavior, languages, and intelligence.
Princeton, N.J.
Princeton University Press
262
37. FleagleJG
1988
Primate adaptation and evolution.
San Diego
Academic Press
486
38. DelsonE
1992
Evolution of Old World Monkeys.
Jones SMR
PilbeamD
The Cambridge Encyclopedia of Human Evolution
Cambridge UK
Cambridge University Press
217
222
39. XingJ
WangH
ZhangY
RayDA
TosiAJ
2007
A mobile element-based evolutionary history of guenons (tribe Cercopithecini).
BMC Biology
5
5
40. TingN
TosiAJ
LiY
ZhangYP
DisotellTR
2008
Phylogenetic incongruence between nuclear and mitochondrial markers in the Asian colobines and the evolution of the langurs and leaf monkeys.
Molecular Phylogenetics and Evolution
46
466
474
41. PageSL
GoodmanM
2001
Catarrhine phylogeny: Noncoding DNA evidence for a diphyletic origin of the mangabeys and for a human-chimpanzee clade.
Molecular Phylogenetics and Evolution
18
14
25
42. PageSL
ChiuCH
GoodmanM
1999
Molecular phylogeny of old world monkeys (Cercopithecidae) as inferred from gamma-globin DNA sequences.
Molecular Phylogenetics and Evolution
13
348
359
43. MoulinS
Gerbault-SeureauM
DutrillauxB
RichardFA
2008
Phylogenomics of African guenons.
Chromosome Research
16
783
799
44. KaranthKP
SinghL
ColluraRV
StewartCB
2008
Molecular phylogeny and biogeography of langurs and leaf monkeys of South Asia (Primates : Colobinae).
Molecular Phylogenetics and Evolution
46
683
694
45. GrovesCP
1989
Cercopithecus and company: a primate radiation.
Science
244
860
861
46. KaranthKP
2008
Primate numts and reticulate evolution of capped and golden leaf monkeys (Primates: Colobinae).
Journal of biosciences
33
761
770
47. TosiAJ
MelnickDJ
DisotellTR
2004
Sex chromosome phylogenetics indicate a single transition to terrestriality in the guenons (tribe Cercopithecini).
Journal of Human Evolution
46
223
237
48. TosiAJ
DisotellTR
MoralesJC
MelnickDJ
2003
Cercopithecine Y-chromosome data provide a test of competing morphological evolutionary hypotheses.
Molecular Phylogenetics and Evolution
27
510
521
49. ZieglerT
AbeggC
MeijaardE
Perwitasari-FarajallahD
WalterL
2007
Molecular phylogeny and evolutionary history of Southeast Asian macaques forming the M. silenus group.
Molecular Phylogenetics and Evolution
42
807
816
50. ElangoN
ThomasJW
YiSV
PrograNCS
2006
Variable molecular clocks in hominoids.
Proceedings of the National Academy of Sciences of the United States of America
103
1370
1375
51. SteiperME
2006
Population history, biogeography, and taxonomy of orangutans (Genus : Pongo) based on a population genetic meta-analysis of multiple loci.
Journal of Human Evolution
50
509
522
52. MullerS
HollatzM
WienbergJ
2003
Chromosomal phylogeny and evolution of gibbons (Hylobatidae).
Human Genetics
113
493
501
53. JauchA
WienbergJ
StanyonR
ArnoldN
TofanelliS
1992
Reconstruction of genomic rearrangements in great apes and gibbons by chromosome painting.
Proceedings of the National Academy of Sciences of the United States of America
89
8611
8615
54. MisceoD
CapozziO
RobertoR
Dell'OglioMP
RocchiM
2008
Tracking the complex flow of chromosome rearrangements from the Hominoidea Ancestor to extant Hylobates and Nomascus Gibbons by high-resolution synteny mapping.
Genome Research
18
1530
1537
55. RoosC
GeissmannT
2001
Molecular phylogeny of the major hylobatid divisions.
Molecular Phylogenetics and Evolution
19
486
494
56. ZhuLC
WangQ
TangP
ArakiH
TianDC
2009
Genomewide Association between Insertions/Deletions and the Nucleotide Diversity in Bacteria.
Molecular Biology and Evolution
26
2353
2361
57. TianDC
WangQ
ZhangPF
ArakiH
YangSH
2008
Single-nucleotide mutation rate increases close to insertions/deletions in eukaryotes.
Nature
455
105-U170
58. VolfovskyN
OleksykTK
CruzKC
TrueloveAL
StephensRM
2009
Genome and gene alterations by insertions and deletions in the evolution of human and chimpanzee chromosome 22.
BMC Genomics
10
51
59. ChenJQ
WuY
YangHW
BergelsonJ
KreitmanM
2009
Variation in the Ratio of Nucleotide Substitution and Indel Rates across Genomes in Mammals and Bacteria.
Molecular Biology and Evolution
26
1523
1531
60. Kehrer-SawatzkiH
CooperDN
2007
Understanding the recent evolution of the human genome: insights from human-chimpanzee genome comparisons.
Human Mutation
28
99
130
61. SchmitzJ
RoosC
ZischlerH
2005
Primate phylogeny: molecular evidence from retroposons.
Cytogenetic and Genome Research
108
26
37
62. TabuceR
MarivauxL
LebrunR
AdaciM
BensalahM
2009
Anthropoid versus strepsirhine status of the African Eocene primates Algeripithecus and Azibius: craniodental evidence.
Proceedings of the Royal Society B-Biological Sciences
276
4087
4094
63. YoderAD
BurnsMM
ZehrS
DelefosseT
VeronG
2003
Single origin of Malagasy Carnivora from an African ancestor.
Nature
421
734
737
64. TeelingEC
ScallyM
KaoDJ
RomagnoliML
SpringerMS
2000
Molecular evidence regarding the origin of echolocation and flight in bats.
Nature
403
188
192
65. VentaPJ
BrouilletteJA
Yuzbasiyan-GurkanV
BrewerGJ
1996
Gene-specific universal mammalian sequence-tagged sites: application to the canine genome.
Biochemical Genetics
34
321
341
66. LyonsLA
LaughlinTF
CopelandNG
JenkinsNA
WomackJE
1997
Comparative anchor tagged sequences (CATS) for integrative mapping of mammalian genomes.
Nature Genetics
15
47
56
67. MoreiraMAM
2002
SRY evolution in Cebidae (Platyrrhini: Primates).
Journal of Molecular Evolution
55
92
103
68. FlynnJJ
NedbalMA
1998
Phylogeny of the Carnivora (Mammalia): Congruence vs incompatibility among multiple data sets.
Molecular Phylogenetics and Evolution
9
414
426
69. KatohK
TohH
2008
Recent developments in the MAFFT multiple sequence alignment program.
Brief Bioinform
9
286
298
70. KatohK
AsimenosG
TohH
2009
Multiple alignment of DNA sequences with MAFFT.
Methods in Molecular Biology
537
39
64
71. RambautA
2007
Se-Al. Sequence Alignment Editor.
Oxford
University of Oxford
72. TalaveraG
CastresanaJ
2007
Improvement of phylogenies after removing divergent and ambiguously aligned blocks from protein sequence alignments.
Systematic Biology
56
564
577
73. PosadaD
CrandallKA
1998
MODELTEST: testing the model of DNA substitution.
Bioinformatics
14
817
818
74. SwoffordDL
2002
PAUP*. Phylogenetic Analysis Using Parsimony (*and Other Methods). Version 4. Sinauer Associates, Sunderland, Massachusetts
75. ZwicklDJ
2006
Genetic algorithm approaches for the phylogenetic analysis of large biological sequence datasets under the maximum likelihood criterion.
Austin
The University of Texas
76. DrummondAJ
RambautA
2007
BEAST: Bayesian evolutionary analysis by sampling trees.
BMC Evolutionary Biology
7
214
77. DrummondAJ
HoSYW
PhillipsMJ
RambautA
2006
Relaxed phylogenetics and dating with confidence.
PLoS Biol
4
e88
doi:10.1371/journal.pbio.0040088
78. SeiffertER
SimonsEL
AttiaY
2003
Fossil evidence for an ancient divergence of lorises and galagos.
Nature
422
421
424
79. FranzenJL
GingerichPD
HabersetzerJ
HurumJH
von KoenigswaldW
2009
Complete primate skeleton from the Middle Eocene of Messel in Germany: morphology and paleobiology.
PLoS ONE
4
e5723
doi:10.1371/journal.pone.0005723
80. PouxC
DouzeryEJ
2004
Primate phylogeny, evolutionary rate variations, and divergence times: a contribution from the nuclear gene IRBP.
American Journal of Physical Anthropology
124
1
16
81. KayRF
FleagleJG
MitchellTRT
ColbertM
BownT
2008
The anatomy of Dolichocebus gaimanensis, a stem platyrrhine monkey from Argentina.
Journal of Human Evolution
54
323
382
82. SteiperME
YoungNM
SukarnaTY
2004
Genomic data support the hominoid slowdown and an Early Oligocene estimate for the hominoid-cercopithecoid divergence.
Proceedings of the National Academy of Sciences of the United States of America
101
17021
17026
83. TosiAJ
DetwilerKM
DisotellTR
2005
X-chromosomal window into the evolutionary history of the guenons (Primates : Cercopithecini).
Molecular Phylogenetics and Evolution
36
58
66
84. VignaudP
DuringerP
MackayeHT
LikiusA
BlondelC
2002
Geology and palaeontology of the Upper Miocene Toros-Menalla hominid locality, Chad.
Nature
418
152
155
85. TavareS
MarshallCR
WillO
SoligoC
MartinRD
2002
Using the fossil record to estimate the age of the last common ancestor of extant primates.
Nature
416
726
729
Štítky
Genetika Reprodukční medicínaČlánek vyšel v časopise
PLOS Genetics
2011 Číslo 3
- Kazuistika – Perspektivy využití precizované medicíny v rámci personalizované specifické terapie onkologických pacientů
- Nobelova cena za chemii pro genetické nůžky: Objev, který změní naši budoucnost?
- Technologie na bázi RNA v klinické praxi: od přebarvených petúnií k terapii vzácných a dosud jen obtížně léčitelných chorob u lidí
- „Nepředstavovali jsme si, že náš výzkum povede přímo ke vzniku nových léků, dokonce ještě za našeho života“
- Bezplatné služby pro diagnostiku ATTRv amyloidózy pro kardiology
Nejčtenější v tomto čísle
- Whole-Exome Re-Sequencing in a Family Quartet Identifies Mutations As the Cause of a Novel Skeletal Dysplasia
- Origin-Dependent Inverted-Repeat Amplification: A Replication-Based Model for Generating Palindromic Amplicons
- FUS Transgenic Rats Develop the Phenotypes of Amyotrophic Lateral Sclerosis and Frontotemporal Lobar Degeneration
- Limited dCTP Availability Accounts for Mitochondrial DNA Depletion in Mitochondrial Neurogastrointestinal Encephalomyopathy (MNGIE)
Zvyšte si kvalifikaci online z pohodlí domova
Mazová zátka a její řešení
nový kurzVšechny kurzy