
The Influence of Age and Sex on Genetic Associations with Adult Body Size and Shape: A Large-Scale Genome-Wide Interaction Study
Adult body size and body shape differ substantially between men and women and change over time. More than 100 genetic variants that influence body mass index (measure of body size) or waist-to-hip ratio (measure of body shape) have been identified. While there is evidence that some genetic loci affect body shape differently in men than in women, little is known about whether genetic effects differ in older compared to younger adults, and whether such changes differ between men and women. Therefore, we conducted a systematic genome-wide search, including 114 studies (>320,000 individuals), to specifically identify genetic loci with age - and or sex-dependent effects on body size and shape. We identified 15 loci of which the effect on BMI was different in older compared to younger adults, whereas we found no evidence for loci with different effects in men compared to women. The opposite was seen for body shape as we identified 44 loci of which the effect on waist-to-hip ratio differed between men and women, but no difference between younger and older adults were observed. Our observations may provide new insights into the biology that underlies weight change with age or the sexual dimorphism of body shape.
Published in the journal:
. PLoS Genet 11(10): e32767. doi:10.1371/journal.pgen.1005378
Category:
Research Article
doi:
https://doi.org/10.1371/journal.pgen.1005378
Summary
Adult body size and body shape differ substantially between men and women and change over time. More than 100 genetic variants that influence body mass index (measure of body size) or waist-to-hip ratio (measure of body shape) have been identified. While there is evidence that some genetic loci affect body shape differently in men than in women, little is known about whether genetic effects differ in older compared to younger adults, and whether such changes differ between men and women. Therefore, we conducted a systematic genome-wide search, including 114 studies (>320,000 individuals), to specifically identify genetic loci with age - and or sex-dependent effects on body size and shape. We identified 15 loci of which the effect on BMI was different in older compared to younger adults, whereas we found no evidence for loci with different effects in men compared to women. The opposite was seen for body shape as we identified 44 loci of which the effect on waist-to-hip ratio differed between men and women, but no difference between younger and older adults were observed. Our observations may provide new insights into the biology that underlies weight change with age or the sexual dimorphism of body shape.
Introduction
Body size and shape are independent risk factors for morbidity and mortality [1–6]. They change as people grow older and these changes differ substantially between men and women [7–12]. Subtle sexual dimorphisms are already apparent during early childhood, but differences become more apparent during puberty due, at least in part, to the increasing influence of sex steroid hormones [12–14]. After puberty, sex-differences are largely maintained over the adult life-course. As women age a decline in sex steroid hormones, which coincides with menopause, affects their body shape and composition, resulting in a more android fat distribution [8, 12, 15]. When younger, women tend towards an hourglass body shape with gynoid fat distribution, storing proportionally more fat at thighs and hip than around the waist [12, 16, 17]. At a later age, often after menopause, women’s fat storage shifts more upwards around the waist [12, 16, 17]. In men, changes in body fat distribution are subtler than in women, showing a slow but steady increase in waist circumference with age [12]. Thus, after the menopause, the sex-differences in body shape between men and women decrease [12].
This intricate interplay between age and sex on body size and shape is driven by underlying biological processes, involving environmental and genetic factors [7–12, 15]. Elucidating sex - and age-specific genetic effects on body size and shape may provide insights into the biological processes that are involved in the regulation of body weight and fat distribution.
More than 100 genetic loci have been identified for body mass index (BMI), a measure for body size, and for waist-to-hip ratio adjusted for BMI (WHRadjBMI), a measure of body shape, most of which were identified through our own work in the Genetic Investigation of ANthropometric Traits (GIANT) Consortium [18, 19]. In a recent sex-stratified genome-wide association meta-analysis (up to 133,723 individuals in discovery stage), we searched for variants with sex-specific effects on BMI and WHRadjBMI and identified several loci for which the association with WHRadjBMI differed between men and women, whereas no such loci were observed for BMI [10]. However, so far, no GWAS efforts have aimed to identify genetic loci that contribute to differences in body size and shape observed in younger versus older adults, particularly across the menopausal period in women.
We conducted a genome-wide search for loci that exhibit age - and/or sex-specific differences in BMI and WHRadjBMI. For this, we utilized study-specific genome-wide association statistics separately by sex and by two age groups in each of the studies participating in the GIANT consortium. The two age groups focus on those below and above 50 years of age, as this cut-off coincides with the average age at which women transition through menopause and experience changes in body fat distribution [20–25]. We hypothesize that genetic loci may contribute to the observed differences in body size/shape before age 50y and after age 50y, and that these differences may be sex-specific.
Results
Stratified GWAS identifies age - and sex-specific loci for BMI and WHRadjBMI
Our total sample comprised up to 320,485 adults (≥18y) of European ancestry from 114 studies with genome-wide array data imputed to the HapMap reference or genotyped Illumina Metabochip array data including up to 2.8 million autosomal variants. Details on study-specific analyses, genotyping methods and phenotypic descriptives are given in S1–S3 Tables. To systematically search for genetic loci that influence body size or shape in an age - and sex-specific manner, we first conducted study-specific GWA analyses for BMI and WHRadjBMI by four strata (men ≤50y, men >50y, women ≤50y, women >50y), and subsequently performed stratified meta-analyses (comprising up to 50,095 men ≤50y, 93,201 men >50y, 70,692 women ≤50y, and 106,497 women >50y) and derived pooled stratum-specific association results (Pmen≤50, Pmen>50, Pwomen≤50, Pwomen>50) for each trait. This strategy allowed us to test for three types of interactions: (1) SNPs that demonstrate age-specific effects (SNP x AGE, Pagediff), (2) SNPs that show sex-specific effects (SNP x SEX, Psexdiff), and (3) SNPs that show age-specific effects that differ between men and women (SNP x AGE x SEX, Pagesexdiff). We first performed genome-wide screens using an a priori filter; i.e. we examined interaction effects on SNPs that showed evidence of an overall main-effect association (POverall < 10−5). This screen is known to have better power to identify loci with age - or sex-specific effects that are directionally concordant [10, 26]. In a second screen, we examined interaction effects for all SNPs, irrespective of their main-effect association, which allows identification of loci with opposite effect direction in older vs younger adults or in men vs women.
As such, 15 loci with age-specific effects for BMI and 44 loci with sex-specific effects for WHRadjBMI reached significance after accounting for multiple testing (controlling false-discovery rate, FDR <5%) (Figs 1 and S1). No loci were identified with evidence for three way SNP x AGE x SEX interaction.

In addition to the stratum-specific meta-analyses, we performed (a) a main effect meta-analysis that combined the four pooled effect estimates (one from each stratum), providing results for the overall association (POverall), assuming effects in age - and sex-groups are the same, and (b) a joint (main + interaction) meta-analysis approach (Pjoint) allowing for simultaneous testing of overall association, SNP-by-age and SNP-by-sex interactions [27]. These two screens revealed 83 novel loci of which the association with BMI or WHRadjBMI reached genome-wide significance (P<5x10⁻⁸) (S2 Fig). This extended discovery is enabled through power augmentation achieved by simultaneously testing main and interaction effects, and/or by accounting for potentially different effects of age and sex on the respective phenotype in the four strata.
BMI-novel loci with differential effects in younger and older individuals
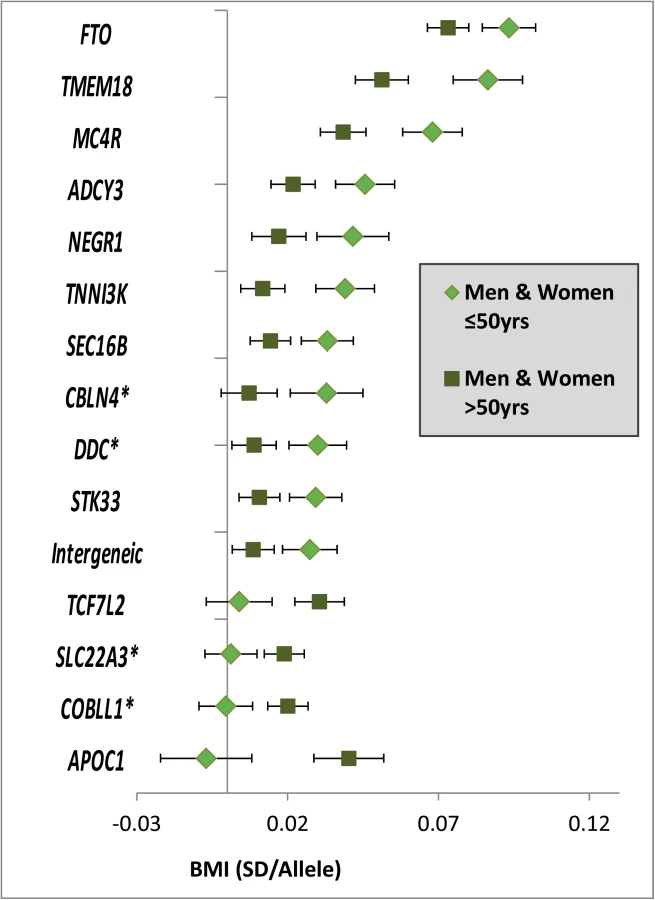
Among the 15 loci with significantly different effects (at 5% FDR) on BMI in the younger versus the older individuals, four were novel (near COBLL1, DDC, SLC22A3 and CBLN4) and 11 were previously established as BMI loci in large-scale main effect GWA meta-analyses (near NEGR1, TNNI3K, SEC16B, TMEM18, ADCY3, AC016194.1, TCF7L2, STK33, FTO, MC4R, APOC1) (S3 Fig and Tables 1 and S4) [19, 28]. Eleven of the 15 age-dependent BMI loci (73%, Pbinomial = 0.06 for divergence from 50%) showed stronger effects in the younger than in the older group, while the four remaining loci had effects that were more pronounced in the older than in the younger group (Figs 2 and S4). We did not identify BMI-associated loci that showed effects in opposite direction between the younger versus the older group, nor did we find any sex-specific BMI effects. A sensitivity analysis excluding studies with self-report BMI found similar results (S5 Fig).

WHRadjBMI–additional genetic loci contribute to differences between men and women
Unlike for BMI, no WHRadjBMI-associated loci with significant difference between the age-groups were observed. Yet, 44 loci showed significantly different effects on WHRadjBMI between women and men of which 17 loci were novel (near TTN, IRS1, CDH10, IQGAP2, SIM1, ISPD, KLF14, SGCZ, PTPRD, RXRA, GANAB, SLC2A3, LEMD3, GNPNAT1, RPS6KA5, CECR2, HMGXB4) and 27 loci had been previously established in main-effect GWA meta-analyses for WHRadjBMI (S6 Fig and Tables 2 and S5). Of the 27 previously established WHRadjBMI loci, sex-differences had already been reported for 17 loci [10, 29] [18]. Our genome-wide screen established sex-specific effects for an additional 10 of the previously established loci with a main-effect on WHRadjBMI (near GORAB, LY86, ITPR2, PIGU, EYA2, KCNJ2, MEIS, EYA1, CCDC92, NSD1). Of the 44 sex-specific loci, 11 loci showed opposite effect directions in women versus men and 33 showed a significant effect in one and a smaller or no effect in the other sex. Consistent with previous observations, almost all of these 33 loci (28 out of the 33, Pbinomial = 3.3x10⁻⁵) showed more pronounced effects in women than in men (Figs 3 and S7). Again, a sensitivity analysis excluding studies with self-report waist and hip circumference found similar results (S8 Fig).


No evidence for loci with simultaneous age - and sex-specific effects
We searched for loci with sex-specific effects on WHRadjBMI that differ between the two age-groups and for loci with age-specific effect on BMI that differ between men and women by testing a three-way interaction (SNP x AGE x SEX, Pagesexdiff). We first tested for this three-way interaction in the 59 SNPs identified with an age-difference (15 loci for BMI) or a sex-difference (44 loci for WHRadjBMI), as described above. However, none of these 59 loci showed a significant three-way interaction (Pagesexdiff > 0.00084 = 0.05/59, Bonferroni corrected) (S4 and S5 Tables). When screening for the three-way interaction genome-wide, no such loci were identified (at 5% FDR) (Fig 1).
Detecting loci with age - or/and sex-interaction requires extremely large sample sizes
We analytically computed the statistical power of our screens to identify SNP x AGE, SNP x SEX or SNP x AGE x SEX interaction effects, assuming a total sample size of 300,000 individuals distributed across four equally sized strata and considering a range of effect size configurations informed by previous observations (S9, S10 and S11 Figs). For example, for a medium genetic effect on BMI (R2 = 0.037% as observed previously for a locus near MAP2K5 [28]), our screens had (i) sufficient power to identify genetic loci with two-way SNP x AGE or SNP x SEX interactions (i.e. loci with effect in one stratum and not in the other, so-called pure two-way interaction, power = 86%, or loci with effect in both strata, but with opposite effect direction, power = 99%), (ii) sufficient power to detect extreme three-way interaction SNP x AGE x SEX, typically involving a biologically-unlikely scenario with opposite effect directions across both AGE and SEX (power = 99%), but (iii) insufficient power to identify loci with biologically more plausible three-way interactions (in the range of R2 of 0.01–0.05%), i.e., loci that have an effect in only one stratum and not in the other three strata, 1-stratum interaction, power = 2%, or those with a similar effect in three strata and not in the fourth, 3-strata interaction, power = 21% (Fig 4). Identification of loci with medium 1-stratum (R2 = 0.037% in one stratum and R2 = 0 in the other three strata) or 3-strata (R2 = 0.037% in three strata and R2 = 0 in one stratum) interaction effects with a power of 80%, would require a total sample size of 750,000 or 600,000 individuals, respectively.

Reducing the multiple testing burden by applying a filter on the overall meta-analysis to first identify SNPs with main effects (POverall < 10−5) improved the statistical power to identify loci with specific interaction scenarios: (i) loci with pure two-way interaction effects (e.g. 30% power increase to detect SNP x AGE with R2 = 0.037% and R2 = 0 in the two strata), or (ii) loci with 3-strata interaction effects (e.g. 21% power increase for loci with R2 = 0.037% in three strata and R2 = 0 in one stratum) (Figs 4 and S9).
With our sample size of 300,000 subjects and equally sized strata we had 80% power to detect (i) 1-stratum interaction with R² = 0.09% in one stratum (R² = 0 in the other three strata), (ii) 3-strata interaction with R² = 0.07% in three strata (R² = 0 in one stratum), or (iii) pure two-way interaction with R² = 0.03% in one stratum (R² = 0% in the other stratum).
In summary, this analysis suggests that our study is sufficiently powered to detect even subtle two-way interaction effects, and would certainly include effect-sizes that would be considered biologically or clinically important. While even more subtle interactions may be occurring, it appears likely that in this effort, we have detected the most important age - and sex - interactions for body size and shape.
Association of identified loci with other traits
To examine whether the age - and sex-specific effects of the identified BMI and WHRadjBMI loci translate into similar age - and sex-effects on obesity-related cardiometabolic traits, we gathered results from the ICBP, CHARGE and Global-BPGen consortia (age-specific and sex-specific effects in blood pressure) [30], Global Lipids Genetics Consortium (GLGC) (sex-specific effects in lipids) [31], DIAGRAM (sex-specific effects for type 2 diabetes) [32]and MAGIC (sex-specific effects of glycemic traits, personal communication) [33](S6–S10 Tables). Only CHARGE, Global-BPGen and ICBP had previously performed GWAS searching for age-specific effects on blood pressure [34]. None of the 15 age-specific BMI-associated loci influenced blood pressure in an age-specific manner (PSNPxAGE > 0.0033 = 0.05/15) (S6 Table). Eight of the 44 sexually dimorphic WHRadjBMI loci show directionally consistent female-specific effects in other traits (S10 Table), but none attained significant sex-difference (Psexdiff > 0.0011 = 0.05/44).
In addition, we performed a systematic search in the National Human Genome Research Institute (NHGRI) GWAS Catalog (www.genome.gov/gwastudies) to examine previously reported GWAS-associations for potential age - or sex-specificity for the loci we identified for BMI and WHRadjBMI, respectively [35]. While no associations have been reported that corroborate the sex - or age-specificity of our findings, largely because few sex-stratified and no age-stratified genome-wide studies have been performed to date (this study is among the first ones), many main-effect associations with a wide range of traits and disease have been reported for our age - or sex-specific BMI or WHRadjBMI loci (S11 and S12 Tables). For example, the four loci that showed a larger effect in the older group are known for their association with type 2 diabetes (T2D, near TCF7L2 and COBLL1) or with coronary artery disease (CAD, near SLC22A3 and APOC1). The fact that disease status may correlate both with age and obesity traits may confound our age - or sex-specific findings. To reduce this possibility we repeated the meta-analyses restricted to population-based samples (excluding all case-control studies) and observed similar effect sizes compared to the original meta-analysis (S13 and S14 Tables).
Age-specific effects of BMI loci extend across the life course
We then examined whether the age-specific effects of the 15 BMI loci extend to younger ages and across the life course by performing look-ups in (i) a GWAS for birth weight [36] and for childhood obesity [37] from the Early Growth Genetics (EGG) Consortium, (ii) a GWAS for BMI of individuals aged 16–25 years [38], and (iii) a GWAS for weight change during adulthood (personal communication).
We found no evidence of association with birth weight (N = 26,836) for any of our 15 age-dependent BMI-associated loci (S15 Table) [36]. In contrast, we observed nominal significant associations with risk of childhood obesity (N = 13,648) for 10 of the 11 variants with stronger effect on BMI in the younger adults (Tables 3 and S16). The four loci that only showed association with BMI in the older adults were not associated with childhood obesity risk (S16 Table) [37].

Furthermore, nine of the 11 variants with stronger effect on BMI in the younger adults (18-50y) showed directionally consistent association with increased BMI in the youngest 16–25y age-group (N = 29,880, Tables 3 and S17). A more detailed experimental examination of effect sizes across the three age-groups did not reveal significant trends (S12 Fig, S17 Table, and S1 Text).
Finally, we speculated that a higher genetic BMI effect in the younger adults would translate into weight loss and a higher genetic BMI effect in the older adults would translate into weight gain with increasing age (Methods). Five of the 15 loci with age-specific effects on BMI showed a nominal significant association accompanied by the hypothesized direction on weight change (N = 39,041, Tables 3 and S18).
In summary, the age-dependency of the 15 loci is supported by directionally consistent enrichment of nominal significant associations (P < 0.05) with childhood obesity, with BMI in the 16–25y age-group and with weight changes across adulthood (PBinomial ranging from 2.4 x 10⁻⁵ to 1.0 x 10⁻¹⁵, Table 3).
eQTL analysis
eQTLs in humans
We performed sex-specific cis eQTL analyses in lymphoblastoid cell lines of the combined Groningen and EGCUT studies (1,450 men and 910 women) [39, 40] for the 44 SNPs showing sex-specific effects for WHRadjBMI to determine whether there is evidence to support sex-specific regulatory effects of the index variants on adjacent gene expression. Two SNP-gene associations displayed significant differences in genetic effects on expression between men and women (FDR(PSexdiff) < 5% with and without initial filtering on overall expression effects):rs6088552–ACSS2 and rs6088735–MYH7B (S19 Table). While both SNPs were associated with WHRadjBMI in men-only (and no effect in women), the first SNP showed no effect on gene expression in men but was associated with gene expression in women, and the second SNP rs6088735 was associated with gene expression in both sexes, but higher in men and lower in women. The two loci were located at only 519kb from each other (rs6088552 near PIGU, rs6088735 near EDEM2, at chr20 : 33-34Mb, r2 = 0.07), each showing independent sex-specific associations with WHRadjBMI and each also showing independent sex-specific association with the expression of two different genes (ACSS2 and MYH7B, respectively) (S13 Fig). ACSS2 (acyl-CoA synthetase short-chain family member 2) is a cytosolic enzyme, transcribed by SREB-proteins, that catalyzes the production of acetyl-CoA for use in both lipid synthesis and energy generation acids [41]. MYH7B (myosin, heavy chain 7B, cardiac muscle, beta) encodes a heavy chain subunit for slow-twitch myosin, largely expressed in heart and skeletal muscle tissue, and is involved in ATP-hydrolysis.
Age-stratified analysis were not performed for EGCUT as the study participants were relatively young (mean age: 37y), with too few individuals in the >50y age-group. Instead, we examined association between the 15 age-specific loci and gene expression using data from 3,489 unrelated individuals (N = 2,531 for <50y, N = 958 for ≥50y) from the NESDA and NTR cohorts [42, 43]. No SNP showed a significant age-specific effect on gene expression (FDR(Pagediff) > 5% for all SNP-gene expression combinations).
eQTLs in mice
We compared expression of genes harboured by the identified loci in inguinal and gonadal fat in age-matched male, female or ovariectomized female (OVX) C57/BL6 mice maintained on a high-fat (HF) diet [44].
For genes located in the 15 age-specific BMI-associated loci, we compared expression in OVX female mice with the expression in the other male and female mice, but no differences in gene expression were observed.
For genes located in the 44 sex-specific WHRadjBMI-associated loci, we compared expression in female mice (OVX and non-OVX) with the expression in male mice. The expression of two genes reached significance (P < 6.4x10-4 = 0.05/(39 x 2)), corrected for testing 39 genes with homologous regions, and two tissues). The expression of IQGAP2, which regulates cell adhesion and motility, (rs2069664) was higher (P = 2.3x10⁻⁷) in gonadal fat tissue of male compared to female mice, whereas the expression of TP53INP2, a co-factor for the thyroid hormone receptor, (rs6088552) was higher (P = 2.3x10⁻⁶) in inguinal fat tissue of male compared to female mice. TP53INP2 is located in the same chromosomal region for which we found evidence for sex-specific associations with the expression of ACSS2 and MYH7B in humans. Interestingly, Tp53inp2 has also been named the DOR (Diabetes and Obesity Related) gene, as its expression is substantially reduced in skeletal muscle of obese diabetic fa/fa Zucker rats [45]. Muscle-specific overexpression of Tp53inp2 in mice leads to reduced muscle mass, whereas a deletion leads to muscle hypertrophy [46]. TP53INP2 expression was markedly reduced in muscle from individuals with type 2 diabetes and in rodent diabetes models [46].
Pathway analyses
We applied pathway analyses to gain insight into mechanisms that might be involved in the age - and sex-specific difference in body size and body shape. We assumed that loci even with moderate evidence for age - or sex-difference for BMI and WHRadjBMI, respectively, are enriched for genes that contribute to the age-specific BMI association or sex-specific WHRadjBMI association (Methods). We used the DEPICT software to perform gene set enrichment and gene expression analyses [47] (S20 and S21 Tables and S1 Text), and QIAGEN’s Ingenuity Pathway Analysis (IPA, QIAGEN Redwood City, www.qiagen.com/ingenuity) tool for pathway analysis and functional annotation (S22–S26 Tables and S1 Text). Both the DEPICT and the IPA analyses identify the possible influence of sex-specific WHRadjBMI loci in androgen biosynthesis, a hormone known to decrease the storage of lipids in adipose tissue [48]. Additionally, PPARα/RXRα activation, the most significant canonical pathway for loci with a greater effect on WHRadjBMI in women, may be inhibited in the presence of estrogen, thus decreasing the breakdown of lipids through competitive receptor binding [49]. To fully understand the possible age - and sex - specific regulatory effects these identified genes may have in the identified pathways, gene sets, and biological functions, further analyses are needed.
Heritability and explained variance analyses
To assess whether the age-group differences observed for BMI and the sex-differences observed for WHRadjBMI extend to the contribution of all 2.5M variants (narrow-sense heritability), we calculated heritability using the GCTA method [50] in several large studies (N = up to 29,232 individuals) for all, for women and men, for the younger and older adult groups. The variance explained by the 2.5M variants was 21% for BMI and 10% for WHRadjBMI, with no significant difference between age groups for BMI (Pagediff = 0.19) or between men and women for WHRadjBMI (Psexdiff = 0.48) (S27 Table).
To further investigate differences between subgroups, we calculated the variance explained in the discovery data set for subsets of SNPs based on varying thresholds of overall association on BMI or WHRadjBMI (S14 Fig). When we included only SNPs that reached genome-wide significance for BMI (POverall < 5x10⁻⁸), the variance explained in the younger adults (3.4%) was significantly larger than in the older (2.45%) adults. As we increased the significance threshold and included more SNPs with less significant overall association, the difference between the two age groups reduced and became non-significant once SNPs with a POverall > 3x10⁻⁵ were included. We observed similar significant differences in explained variance for WHRadjBMI between men and women, with the most pronounced difference for genome-wide significant SNPs (POverall < 5x10⁻⁸, women 1.60%; men: 0.70%) that reduced and became non-significant for SNPs with a POverall > 1x10⁻⁵. Consistent with the observed interactions, we found no difference in explained variance between men and women for BMI or between the younger and the older group for WHRadjBMI at any POverall cut-off (S14 Fig).
Family-based heritability estimates, from the Family Heart Study (N = 1,810, 454 families), showed similar (but non-significant) trends for younger versus older adults for BMI (60% vs 45%, Pagediff = 0.24), for women and men for WHRadjBMI (43% vs 38%, Psexdiff = 0.68) (S27 Table).
Collectively, these observations are consistent with the results of our genome-wide search, showing that genetic variants contribute more to BMI variation in younger than in older adults and more to WHRadjBMI variation in women than in men. These differences are most pronounced when we test genome-wide significant SNPs only, while differences are minimized as more SNPs with weaker associations are included.
Joint testing of main - and interaction effects yield novel loci for BMI and WHRadjBMI
Our stratified analysis approach also offered an opportunity for discovery of novel variants influencing BMI and WHRadjBMI by (i) using a joint 4df test of the main SNP effect in the presence of interaction [27] and (ii) by overall meta-analysis of the 4 strata. Both approaches increase statistical power to detect a main effect if there is evidence of heterogeneity across the strata. Of the 164 loci that reached genome-wide significance for BMI (P < 5x10⁻⁸), 73 are novel (S28 Table and S1, S2 and S15 Figs). Of the 73 loci, 45 were only identified in the overall test and 26 were identified in both tests. The remaining two loci were only identified in the joint test and either displayed evidence for difference between men and women (near CXXC5, Psexdiff = 2.7x10⁻⁵) or between age-groups (near DDC, Pagediff = 6.2x10⁻⁴) suggesting that its identification may have been aided by allowing for interaction. We identified 53 loci with significant associations with WHRadjBMI, of which 10 were novel (S29 Table and S1, S2 and S16 Figs). It can be speculated that the yield of novel SNP associations for BMI was greater than that of WHRadjBMI, because age-dependent effects have not been sought systematically before, whereas sex-specific screens have been performed previously [10].
Discussion
Our genome-wide search for age - and sex-specific loci in up to 320,485 adults of European ancestry identified 15 loci that were associated with BMI in an age-dependent manner, with predominantly larger effects in the younger than in the older adults. Notably, despite sufficient statistical power, we did not identify BMI-associated loci with sex-dependent effects. The largest association study on BMI [19] identified two SNPs with different impact on BMI in men and women: rs543874 (SEC16B) and rs6091540 (ZFP64). While these SNPs show more modest trends towards sex-different effect (Psexdiff = 2.4x10⁻⁴ and 1.3x10⁻⁴, respectively) in our study, they were not picked up by our analysis due to the different pre-filtering strategy. In contrast to BMI and consistent with previous observations for WHRadjBMI, we identified 44 WHRadjBMI associated loci with sex-specific effects of which the majority have a larger effect in women compared with men. No age-specific WHRadjBMI loci were discovered.
Our work is the first large-scale genome-wide association study to interrogate the influence of both age and sex, simultaneously, on genetic effects for BMI and WHRadjBMI. While our meta-analysis had sufficient power to identify SNP-by-age or SNP-by-sex interactions, we only discovered loci influenced by age for BMI. Studies that followed up on previously established BMI loci in longitudinal and cross-sectional designs support our findings regarding the age-dependency of the majority of these loci [38, 51–57]. Indeed, for 11 of the 15 loci identified in our study, the effect on BMI was 1.5 to 3.5 times smaller in the older adults than in the younger adults, which may reflect a greater culmination of environmental and lifestyle factors on adiposity in older adults that overwhelm the genetic effects. While none of these loci were associated with birth weight, all—but one—were nominally associated with increased risk of childhood obesity. Results from a GWAS on BMI in 16-to-25 year-olds [58] provide preliminary evidence that some loci exert their largest effects relatively early in life, whereas others become more pronounced in young adulthood. Notwithstanding the predominance of BMI loci with larger genetic effects in younger individuals we identified four loci with stronger genetic effects in older adults. Interestingly, these four loci have been previously associated with either type 2 diabetes [32] or coronary artery disease [59]. Sensitivity analyses precluded potential ascertainment bias introduced by disease studies in the older group. These loci may influence BMI through mechanisms that are distinct from other BMI-associated loci; mechanisms that may be more closely related to processes more directly involved in the pathogenesis obesity-related diseases. Furthermore, the directional consistent genetic effects of our loci on weight change during adult life from longitudinal studies supports our finding.
Indeed, the stratification into age-groups may introduce a cohort effect that implies a different genetic or environmental make-up of cohorts with older vs younger adults. For example, the obesogenic environment that has fueled the obesity epidemic that westernized societies have experienced during the past 30 years may have affected older individuals differently than younger individuals. To examine the contribution of such cohort effects and to obtain more accurate age-dependent effect estimates, large-scale genetic longitudinal studies would be required that measure BMI at multiple time points with individuals born across a wide range of birth years.
While our study provides some first insights into age-dependent genetic effects, in particular before and after menopause, more data from larger studies with longitudinal data spanning from childhood through late adulthood are desirable to accurately assess the influence of these loci on BMI across the life course. Indeed, identifying the time of life when variants affect body weight the most may help us determine the mechanisms of their influence on body weight and potential for intervention.
In contrast to the observations for BMI, our genome-wide interaction analyses did not identify loci with age-dependent effects for WHRadjBMI but there was strong novel evidence for sex-influenced effects in 44 loci. For 27 of the 44 loci, the sexual dimorphism is reported for the first time, with 17 being completely novel associations for WHRadjBMI. Due to increased sample size and optimized SNP selection approaches, we more than doubled the number of loci with established sex-difference for WHRadjBMI [10, 18, 29]. The 44 loci divide into 11 loci with opposite effects between men and women, 28 loci with a stronger effect in women and five loci with a stronger effect in men. This is the first report to highlight loci with opposite effects and the enrichment of women-specific WHRadjBMI associations is consistent with previous findings.
We examined whether the sex-dependent effects on WHRadjBMI were mediated through sex-specific effects on the expression of genes located within these loci, using data available from eQTL analyses in humans and mice. Of particular interest is a region at chromosome 20q11.22 in which two independent WHRadjBMI lead SNPs near PIGU and near EDEM2 showed independent sex-specific associations with the expression of ACSS2 and MYH7B, respectively, in humans. While we found no direct evidence of sex-specific action of ACSS2 or MYH7B, based on current knowledge, both proteins seem to be involved in peripheral energy metabolism. In addition, we observed that the expression of Tp53inp2 (Tumor Protein 53 Inducible Nuclear Protein 2), of which the human TP53INP2 ortholog is also located in the PIGU locus, had significantly higher expression levels in the inguinal fat of male than female mice. This observation is consistent with a previous study, showing that Tp53inp2 expression in white adipose tissue is significantly higher in male than in female mice [60]. The authors speculated that this sex-specificity might be due to differences is fat distribution with females storing proportionally more fat in subcutaneous/inguinal and males more in intra-abdominal depots [60]. Taken together, the sex-specific association with WHRadjBMI of two independent loci at chr20q11.22 may be mediated through any or all three genes for which we found sex-specific expression. While all three genes are good candidates, experimental follow up will be needed to pinpoint the causal gene(s) and to elucidate the function and sex-specificity.
Our broad-sense (family-based analyses) or narrow-sense (GCTA including all 2.5M variants) heritability estimates showed no difference in explained variance between men or women, or between younger and older adults for either outcome. However, when considering subsets of variants displaying overall significant associations (POverall < 1x10⁻⁵), we observed a significant difference between age - but not sex - groups for BMI, with a larger explained variance among the younger than the older adults, and between sex - but not age groups for WHRadjBMI, with a larger explained variance in women than in men. These observations further corroborate the predominance of age-dependent loci for BMI and sex-dependent loci for WHRadjBMI identified through a genome-wide screen.
Even though our study is likely the largest GxE and the first GxE1xE2 interaction GWAS meta-analysis ever conducted, we did not detect loci with sex-specific effects for BMI (SNP x SEX), age-specific effects for WHRadjBMI (SNP x AGE) or three-way interactions effects (SNP x AGE x SEX). Three-way interactions are biologically plausible when considering that sex-specific effects might be exerted through hormones and that the hormonal status particularly of women changes at menopause (i.e., around the age of 50 years). This would result in a 1-stratum interaction (i.e., genetic effect only present in younger women) or a 3-strata interaction (i.e., genetic effect present in all but in younger women). While our study had sufficient power (power > 80%) to identify any kind of two-way interaction (SNP x SEX or SNP x AGE) even for effects as small as those observed for established BMI or WHRadjBMI loci, our power was limited specifically for the biologically plausible three-way effects (1-stratum or 3-strata-interaction). To detect subtle effects appearing in only one of the four strata will require specialized study designs or alternative approaches. We provide a detailed analytical perspective on the power to detect different interaction signals that may inform other studies aiming at detecting interaction effects.
We acknowledge that our power estimations are expressed as a function of previously observed explained variances, incorporating measurement error. As measurement error increases, the variance of the phenotype increases and—because the genetic effect is not affected—the explained variance of the genetic variants decreases. While a random measurement error in the dependent variable of a linear regression model would not lead to a biased effect size estimate, such an error would increase the standard errors of the effect size estimates compared to a measurement error free outcome. Under the alternative hypothesis, this results in smaller statistical power. This would imply, for our analysis, that we have potentially missed some true associations, which could have been detected with smaller measurement error.
With the growing sample-size and thus statistical power, measurement error is often larger than the variant-wise effect size estimate for many human traits currently under investigation in large-scale GWAS. Thus, an individual variant’s effect may not have clinical significance by itself in predictive models. However, its ultimate significance should be evaluated in the context of the biological mechanism it reveals along with other discovered variants, and the potential of such a mechanism as a therapeutic target; this is yet to be determined. In order to discover more disease-associated genetic variants, reducing measurement error by repeated and/or more accurate measurements is a viable alternative to only increasing sample size–especially when the measurement error relative to the outcome variability is high.
For technical reasons, variants on the X-chromosome were not screened. Yet, an interesting hypothesis is that sex-linked variants contribute to a sex-dependent architecture of body size and shape, both of which exhibit obvious sexual dimorphism. These analytic challenges are being addressed currently, and exploration of X-linked variation is warranted. Further, we have included only individuals of European-ancestry and thus cannot report on the generalizability of our findings to other race or ethnic groups. While we examined age-dependent effects by binning individuals below and above age 50 years—an average age of menopause—it is possible that modeling of age as a continuous trait might have had superior power. This approach poses more complex harmonization issues that should be addressed in a follow-up study. In addition, we recognize that environmental modifiers may further influence the effect of trait-related loci, and that some of the interactions we identified may be proxies for interactions with other environmental factors that are correlated with either age or sex.
In summary, our findings further distinguish the genetics of BMI from the genetics of WHRadjBMI. Previously described aspects of distinction include the enrichment of neural pathways versus insulin-related pathways and sexual consistency versus sexual dimorphism, respectively [61, 62]. Our findings suggest that genetic BMI effects can change by age possibly depicting different mechanisms of genetic BMI effects that either increase or decrease during adult age. The knowledge of such mechanisms might guide the development of more effective intervention programs that are desperately sought after.
Methods
Anthropometric phenotypes
The anthropometric traits examined are body mass index (BMI, kg/m²), which is a measure of body mass and a surrogate for total body fat, and waist-to-hip-ratio adjusted for BMI (WHRadjBMI), which is a measure of body fat distribution. Traits were transformed before analyses; we first created age - (and BMI) adjusted residuals (including age and age² into the regression for BMI, and additionally BMI for WHRadjBMI) for each of the four strata separately (men ≤50y, men >50y, women ≤50y, and women >50y) and subsequently applied an inverse normal transformation.
Study-specific analyses
We included up to 92 studies (totalling up to 21,989 men ≤50y, 74,324 men >50y, 41,386 women ≤50y, and 88,625 women >50y) with genome-wide genotyping chip data using either Affymetrix or Illumina arrays. To enable meta-analyses across different SNP panels, each study group performed genotype imputation using HapMap II CEU (build 21 or 22) via MACH [63], IMPUTE [64] or BimBam [65] yielding ~2.8 Million SNPs. In addition, we included 22 studies (up to 28,106, 18,877, 29,306, 17,872 individuals for each of the strata, respectively) for BMI and WHRadjBMI that were genotyped using the custom iSELECT Metabochip array containing ~195K SNPs designed to support large-scale follow-up of putative associations with metabolic and cardiovascular traits [66].
In each study, SNP associations were tested separately by age-group and sex (men ≤50y, men >50y, women ≤50y and women >50y) for autosomal variants. The additive genetic effect for each SNP on each phenotype was estimated via linear regression using MACH2QTL [67], SNPTEST [64], ProbABEL [68], GenABEL [69], Merlin [70], PLINK [71] or QUICKTEST [72]. For studies with a case-control design, cases and controls were analysed separately. See S1, S2 and S3 Tables for study specific genotyping, imputation, analysis, quality control and phenotypic descriptive information. In total we gathered association data from up to 92 studies with imputed GWAS data and 22 studies genotyped on the Metabochip array for BMI including up to 320,485 individuals and 64 studies with imputed GWAS data and 20 studies genotyped on the Metabochip array for WHRadjBMI including up to 216,654 individuals.
All studies were conducted according to the principles expressed in the Declaration of Helsinki. The studies were approved by the local Review Boards and all study participants provided written informed consent for the collection of samples and subsequent analysis.
Quality control of study-specific aggregated data
All study-specific files were processed in the meta-analysis centers through a standardized quality-control (QC) pipeline [73]. This involved QC checks on file completeness, range of test statistics, allele frequencies, trait transformation and population stratification as well as filtering on low quality data. Briefly, we excluded monomorphic SNPs, SNPs with MAF*N ≤ 3 (minor allele frequency multiplied by sample size), imputed SNPs with poor imputation quality: r2_hat < 0.3 in MACH, observed/expected dosage variance < 0.3 in BIMBAM, proper_info < 0.4 in IMPUTE, information < 0.8 in PLINK [64, 65, 67, 71]; genotyped SNPs with low call-rate (< 95%), and genotyped SNPs that were out of Hardy-Weinberg equilibrium (HWE, P-Value testing for HWE < 10−5). To increase the overlap in the number of SNPs between imputed GWAS and MetaboChip data, we transferred all SNP identifiers to unique SNP names consisting of chromosomal and base position, e.g. using chr1 : 217820132 instead of rs2820443 in the meta-analysis. Sex - and age-specific standard errors and P-values from each participating study were genomic-control (GC) corrected using study - and strata-specific lambda factors [74], whereas the lambdas were estimated from all genome-wide available SNPs for imputed GWAS and form a subset of 4,427 QT-interval SNPs for MetaboChip studies.
The meta-analyses
Generally, beta-estimates and standard errors were meta-analyzed using an inverse-variance weighted fixed effect model as implemented in METAL [75].
We meta-analyzed effect estimates and standard errors from all available studies in each of the four strata separately, yielding bM≤50y, bM>50y, bF≤50y, bF>50y and SEM≤50y, SEM>50y, SEF≤50y, SEF>50y. By meta-analyzing bM≤50y and bM>50y we obtained the effect and standard error for men (bM,SEM) and women (bF,SEF). Similar meta-analyses yielded the age group-specific association statistics, b≤50y and b>50y with standard errors SE≤50y and SE>50y. Meta-analysis of all four strata provided the overall association effect estimate boverall, standard error SEoverall, and P-value Poverall. A joint meta-analysis based on the pooled stratum-specific estimates was performed according to Aschard et al [27].
After the meta-analyses, we performed an additional quality control step on the meta-analytic results: We only included SNPs (i) being available in at least half of the maximum sample size in all strata; and (ii) having chromosome and position annotation in dbSNP.
Genome-wide screening approaches to detect interaction effects
Our study aimed at discovering SNPs with (1) age-different effects, (2) sex-different effects, and (3) age-dependent sex-different effects or sex-dependent age-different effects.
To find age-different genetic effects, we computed age-difference P-values (Pagediff) by testing for difference between the age group-specific meta-analyzed beta-estimates b≤50y and b>50y using

The correlation rage between b≤50y and b>50y computed as the Spearman rank correlation coefficient across all SNPs for BMI and WHRadjBMI was 0.123 and 0.049, respectively. The analogous test statistic for sex-different effects was

To test for the three-way interaction of age - and sex-differences, we introduced for the first time a test of difference between age groups in the sex-difference, which is mathematical equivalent to a test of difference between sexes in the age group-difference using the age-sex-difference statistic as

To maximize statistical power we did not split our samples (artificially) into discovery and replication sets, but meta-analyzed all studies together and verified the absence of cross-study heterogeneity. We screened genome-wide for Pagediff, Psexdiff, and Pagesexdiff for each of the two traits (BMI, WHRadjBMI). These screens have ideal power to detect effects that are of opposite direction across the four strata (S9 Fig). However, searching for effects that are prominent in one or some strata, but not existent or directionally consistent and less pronounced in other strata profits from an a priori filter on the overall association (Poverall < 10−5) as shown previously [10, 26] (Fig 4). The rationale behind this filter is that SNPs with unequal effects in the different strata have non-zero overall effect when tested in all strata combined. This is true unless these effects are the same magnitude, but in opposite direction (i.e. cancel out in the combined analysis). Hence filtering on overall association P-value possibly enriches our selection with SNPs showing interaction effects. For BMI and WHRadjBMI 7,382 and 2,014 SNPs passed this filter.
For each trait and for each of the 6 approaches (Pagediff, Psexdiff, Pagesexdiff; with and without a priori filtering), we controlled the False Discovery Rate (FDR) at 5% to account for the multiple testing [76]. Importantly, controlling the FDR of each single analysis at 5% implies a global FDR control at 5% for the ensemble of discoveries resulting from all the different approaches together.
Sensitivity analyses using population-based studies only
To ensure the association of none of our age - or sex-specific loci were driven by ascertainment bias through inclusion of case-series of individuals with type 2 diabetes or coronary artery disease, we performed additional meta-analyses restricted to population-based (i.e. no ascertainment bias) studies and compared the effect-sizes between the original meta-analyses and the meta-analyses restricted to population-based studies.
Sensitivity analyses excluding studies with self-reported BMI or WHR
Self-reported BMI or WHR may cause systematic measurement error that might lead to biased effect estimates. Few of our studies assessed BMI and WHR by self-report in the sense that they told study participants how to measure BMI and WHR for themselves. In order to ensure that the age - or sex-differences of our identified loci was not driven by the few studies that used self-report data (13 of our 114 studies), which may introduce bias [77–79], we conducted sensitivity meta-analyses limited to studies that measured anthropometric phenotypes (S5 and S8 Figs).
Power computations
To illustrate the strength and characteristics of the various screens outlined, we analytically computed power by scan (S9 Fig) and for all scans combined (Figs 4, S10 and S11), for varying configurations of effect size combinations and directions across the four strata. More specifically, we assumed equally sized strata, a total sample size approximately corresponding to the maximum sample size of our study and modelled three categories of SNPs explaining realistic fractions of the phenotypic variance, i.e. small, medium and large effects from Speliotes et al [28] and from Heid et al [29]. The power shown in any of the heatplots was calculated based on a fixed effect in women ≤50y (set to the known effect), a fixed effect in men >50y (set to 0), and varying effects in women >50y and men ≤50y (varying from negative to positive magnitude of the known effect). This strategy allowed us to depict power for most important interaction effects (i.e. for pure sex-difference, pure age-difference, 1-strata interaction and 3-strata interaction) in a single heatplot (see legend of Fig 4).
Genome-wide screening approaches to detect main effects accounting for interaction
To identify novel genetic association for BMI and WHRadjBMI, we screened (i) the POverall gathered from a four-way meta-analysis of the stratified results and (ii) the PJoint gathered from a four-way joint meta-analysis of the stratified results according to Aschard et al [27]. We used a genome-wide significance level (P<5x10⁻⁸) for both approaches to correct for the multiple testing and compared the detected regions to previously established loci using a 500kb distance criterion.
Establishing enrichment for sex-specific or age-dependent genetic effects
For WHRadjBMI, we counted among the sex-different associations (disregarding the opposite effect loci) how many were significantly stronger in men or women. To test whether the observed counts represent significant imbalances between sexes we compared them to the expected binomial distribution (with p = 0.5). Similar exercise was done for age-specific associations for BMI.
Lookup of age - and sex-specific associations with other phenotypes
Age-group specific association results of the identified loci were requested for blood-pressure measures (diastolic and systolic blood pressure, mean arterial pressure and pulse pressure) from the Global-BPGen consortium [30]. The provided effect size and standard error estimates for six age bins (20–29, 30–29, …, 70–79 years) were combined to derive SNP x AGE interaction effect sizes and P-Values (S6 Table) using meta-regression [34].
Sex-specific associations of the identified loci were requested for lipid traits (HDL-C, LDL-C, Total Cholesterol and Triglycerides) from the Global Lipids Genetics Consortium [31], for type 2 diabetes (T2D) from the DIAGRAM consortium[32], for glycemic traits (fasting insulin, fasting glucose, HOMA-B, HOMA-IR) from the Meta-Analyses of Glucose and Insulin-related traits (MAGIC) Consortium[33](personal communication), and for blood-pressure measures (diastolic and systolic blood pressure) from the Global-BPGen consortium [30] (S7, S8 and S9 Tables). The provided men - and women-specific estimates were used to derive sex-difference P-Values.
NHGRI GWAS catalog lookups
To further investigate the identified genetic variants in this study and to gain additional insight into their functionality and possible pleiotropic effects, we searched for previous SNP-trait associations nearby our lead SNPs. PLINK was used to find all SNPs within 500 kb of any of our lead SNPs using 1000 Genomes Project Pilot I genotype data from the CEPH (Utah residents with ancestry from northern and western Europe) population (CEU) [80, 81]. To identify previous associations, all SNPs within the specified regions were compared with the NHGRI (National Human Genome Research Institute) catalog for overlap and distances between the two SNPs were obtained using SAS, Version 9.2 [citation info below for SAS and PLINK] [82]. The NHGRI’s (National Human Genome Research Institute) GWAS catalog contains only the top 30 most significant SNP-trait associations from recent GWAS published results from studies with at least 100,000 SNPs with resulting P-values of less than P<1x10⁻⁵ [82]. For previous GWAS results not reported in the Catalog when accessed on 10/15/2014, additional SNP-trait associations were pulled from the literature and compared to our lead SNPs using the same PLINK output file to obtain distance and r2 values [83–91]. All previous associations within 500 kb and with an r2>0.1 with our lead SNP that reached genome-wide significance in the previous publication were retained for further interrogation.
Association of age-specific BMI loci with birth weight and childhood obesity
Summary statistics from a genome-wide association meta-analyses previously performed by EGG Consortium (www.egg-consortium.org) were used to examine whether the 15 age-specific BMI loci associate with birth weight and/or childhood obesity risk. Birth weight (BW) had been transformed to z-scores. Association between each SNP and the birth weight was tested using linear regression assuming an additive genetic model, with sex and, where available, gestational age as covariables [36]. In the genome-wide association meta-analysis for childhood obesity risk, cases were defined as having an age - and sex-specific BMI > 95th percentile, and controls as having an age - and sex-specific BMI < 50th percentile in children of European ancestry. SNP associations were assessed in a case-control design assuming an additive genetic model [37].
Comparison of effect sizes for age-dependent BMI loci with younger individuals aged 16–25 years
We compared the effect sizes for 15 loci with age related differences in BMI for each of the age strata (≤50y and >50y) in men and women combined with the BMI in young adults ages 16–25 years [58]. Nine out of the 14 studies included in the young adult analysis had overlapping samples with the current sample, although the BMI measurements utilized were different (i.e. adolescence/early adulthood versus middle-aged to older adulthood). We used t-tests to compare effect estimates (β) from the younger adults aged 16–25 years (A) to each of our age strata (≤50y or >50y) (B) adjusting for the correlation due to overlapping samples such that:

Look-up of age-dependent BMI loci for weight change across adulthood
We also evaluated the 15 BMI loci showing age-dependent results from genome-wide analyses with weight change across adulthood. Using growth curves generated from multiple measures of weight in individuals between the ages of 20 and 65 years, weight change trajectories were calculated by sex using age as both a random and fixed effect. For each of the 15 loci showing age-differences in BMI, we observationally compared the direction of the effect estimate in the weight change results with the direction of effect seen between our adults aged 18–50 years and adults >50 years. While assuming constant height across adulthood and no cohort effect between the two age-groups, we hypothesized that for loci where we find a stronger effect for BMI in the adults ages 18–50 years compared to adults >50 years, the direction of effect estimate in the weight change data would be negative. For the loci where we found a stronger effect for BMI in the adults >50 years compared to the adults ages 18–50 years we hypothesized that the direction of effect estimate in the weight change data would be positive.
Expression QTL analyses in human tissue
We examined transcript expression of genes nearby (+/ - 1Mb) the 44 identified WHRadjBMI SNP in lymphoblastoid human cell lines available in 2,360 human samples from the EGCUT and Groningen cohorts (910 women and 1,450 men) [39, 40]. We computed sex-specific associations between each of the 44 variants and all genes in their 1Mb vicinity and tested the men - and women-specific eQTLs for sex-difference (FDRsexdiff<5% calculated with/without initial filter on overall expression effect FDRoverall<20%).
We next examined whether the 15 SNPs identified to be age-dependently associated with BMI impact nearby (+/ - 1Mb) transcripts differently in younger (<50y) than in older individuals (≥50y). As such, we analyzed human whole blood transcription in 3,489 unrelated individuals from NESDA and NTR cohorts [42, 43], which were divided in a ≥50y group (N = 958) and a <50y group (N = 2,531). Cis-eQTL analysis for the 15 SNPs was conducted for the two groups separately and age-group specific eQTLs were compared for age-difference (FDRagediff<5% calculated with/without initial filter on overall expression effect FDRoverall<20%).
Expression QTL analyses of adipose tissues in high-fat-diet-induced obese mice
We performed a microarray analysis on data from an experiment previously published [44]. Briefly, 21 male, 21 female, and 21 ovariectomized (OVX) female C57/BL6 mice were fed from day 21 for 12 weeks on an high fat diet (45% calories from fat; Research Diets, Inc., New Brunswick, NJ). All mice (male, female, and OVX) were exposed to sham or OVX surgery. Animals were sacrificed and tissues collected during the first 2h of the beginning of the light cycle after a 12h fast.
GeneChip microarray (Affymetrix, Santa Clara, CA) was performed according to manufacturer’s instructions on 7 independent pooled samples (3 mice per pooled sample) per experimental group (male, female, OVX) from gonadal adipose tissue (GWAT) and inguinal adipose tissue (IWAT) fat pads. AMC Project Report Version 12 (6/27/07) GeneChip Operating System parameters α1 and α2 were set to 0.05 and 0.065, respectively. Normalized expression values from the Affymetrix identifier were analyzed with the online software server Genesifter (VizX Labs, Inc., Seattle, WA, USA). For comparisons of microarray data sets, multiple t-tests were used to identify genes with at least a twofold difference in gene expression (with Benjamini and Hochberg correction; P<0.05) and at least an expression level of 100. Genes populated from the GWAS studies were compared to this list of genes that met the minimum criteria of expression, fold difference, and p-value. Those identified as being statistically significant were further validated by qPCR.
Pathway analyses
DEPICT
We used a recently developed pathway enrichment method, DEPICT [47]. The methodology first selects all lead SNPs below a certain threshold with respect to a target P-value (available genome-wide). We tested multiple hypotheses corresponding to different lead SNP selection scenarios. First, we selected SNPs with Psexdiff <0.001. Second, focusing on SNPs with concordant effect size direction (CED), but different magnitude we added a marginal filter to boost power by selecting SNPs with Psexdiff <0.01 and Poverall <0.01. In case of CED, SNPs with stronger effect in women may fall into separate pathways from SNPs with stronger effect in men. Hence, we have derived gender-specific sex-difference P-values (Psexdiff_F, Psexdiff_M). We then looked for women-specific pathway enrichment by selecting SNPs with Psexdiff_F <0.01 and Poverall <0.01 (given the CED framework). Similarly, we created a separate list for men-specific SNPs by a filter of Psexdiff_M <0.01 and Poverall <0.01. All above lists were also created for age-dependent BMI associations by replacing Psexdiff by Pagediff, Psexdiff_F by Pagediff_younger and Psexdiff_M by Pagediff_older.
For each of the eight SNP lists, leads SNPs were identified. For each lead SNP locus a target region is defined as the smallest interval containing all SNPs with LD>0.5 with the lead SNP of the locus. All genes encompassed in the target regions represent the “GWAS genes”, thereby assuming that either the lead SNP is in LD with a functional coding SNP within a gene or that the lead SNP marks a cis-acting regulatory region. We then used the following pre-defined gene sets and pathways: Gene Ontology (GO), Reactome, InWeb protein complexes, Mouse knock-out phenotypes. Gene sets were re-annotated based on co-expression in a large collection (80,000) of gene expression compendium from GEO. Then, for each gene-set the pair-wise similarity between GWAS genes was calculated and compared to that of matching sets of non-GWAS genes to assess significance of enrichment.
DEPICT also generated a prioritized set of genes at each locus. Briefly, genes within associated loci that are functionally similar to genes from other associated loci are the more likely candidates. DEPICT prioritizes genes in three steps: gene scoring, bias adjustment, and false discovery rate estimation. In the scoring step, the method quantifies the similarity of a given gene to genes from other associated loci. The bias adjustment step controls confounding factors that may bias the gene scores, e.g. gene length. In the last step, experiment-wide false discovery rates are estimated by repeating the scoring and bias adjustment steps 20 times based on top SNPs from pre-computed null GWAS.
Ingenuity Pathway Analysis (IPA)
Significantly associated loci were further explored using QIAGEN’s Ingenuity Pathway Analysis (IPA, QIAGEN Redwood City, www.qiagen.com/ingenuity) to determine if there was an over-arching functional or disease relationship among these loci and their associated genes using the age and sex specific SNP lists described above. IPA uses publicly available databases (e.g. NHGRI GWAS Catalog, NCBI databases, KEGG) and proprietary databases of gene/protein interaction, expression, and function to identify possible pathways, networks, and overlapping functions of genes. For our analysis, IPA identified potential genes as those genes with coding regions within 2kb upstream or 0.5kb downstream of our list of input dbSNP ids that can unambiguously be mapped to these ids. To perform the analyses, only Ingenuity Knowledge Base genes were used, both direct and indirect relationships that are observed or predicted in mammals (humans, mice, and rats) are strictly considered. All canonical pathways and functional/disease categories and annotations that were statistically significant (P < 0.05 using the Fisher’s exact test) are reported; however, those that meet significance for multiple test correction (Benjamin-Hochberg corrected P <0.05) are highlighted in the table. Only the top ten predicted networks containing up to 140 genes or endogenous molecules were requested. Only those networks with a score of greater than 2 (Fisher’s Exact Test result of P <0.01) are considered significant [92].
Estimation of heritability
We estimated the broad heritability (H2) of BMI and WHRadjBMI within the Family Heart Study (FHS) to assess how much of each trait’s total phenotypic variance may be genetic. A random sample of 1,810 individuals (454 families) was used for this analysis. The sample was stratified by age and sex into 9 groups (all, all ≤50y, all >50y, men, women, men ≤50y, men >50y, women ≤50y, women >50y) to assess how each trait’s genetic variance may differ across strata. Within each group, BMI and WHRadjBMI were adjusted for age, age2, genotyping chips (Illumina 560K, 1,000,000K, 610K), 10 principal components and 3 study centers. Residuals for BMI and WHRadjBMI were ranked and an inverse normal transformation was applied. Subsequently, SOLAR was used to estimate the H2 of BMI and WHRadjBMI within each group (S28 Table).
Genome-wide Complex Trait Analysis for proportion of variance explained
To explore the contribution of all common (genotyped) SNPs genome-wide to each trait of interest, BMI and WHRadjBMI, we estimated the variance explained by all the autosomal SNPs in the combined ARIC, KORA S3/S4, CoLaus, EGCUT and SHIP studies within each of the sex and age strata, using the method proposed by Yang et al [93] and implemented in the Genome-wide Complex Trait Analysis software package (GCTA http://www.complextraitgenomics.com/software/gcta/). Each phenotypic trait was transformed in the same form as was used for all meta-analyses.
Estimation of explained variance
We estimated the age-group and sex-specific polygenic variance explained by various subsets of SNPs that were based on varying thresholds of overall association (POverall) with BMI or WHRadjBMI. First, each subset of SNPs was clumped into independent regions using a physical distance criterion <500kb and for each region the most significantly overall associated SNP (i.e. top SNP) was taken further. For each top SNP, the explained variance was calculated according to

Search for biological and functional knowledge of the identified association regions
We examined whether SNPs known to provide reliable tags for Copy-Number-Variations (CNVs) in subjects of European-descent (combining four catalogues including 60,167 CNV-tagging SNPs as described previously [95]) correlated with our lead SNPs. We also performed several online database searches to establish whether known variants within a 500kb-window on both sides of each lead SNP, that are in high linkage disequilibrium (r² > 0.8) with our lead SNPs (using SNAP Proxy search [96]), might have putative or predicted function. (i) We searched the SIFT database [97] to determine whether any of these SNPs were predicted to affect protein function. (ii) We used Annovar [98] to investigate predicted and putative function in several functional classes, including splicing regulation, stop codons, polyphen predictions. (iii) We used the regulome database (http://regulome.stanford.edu/) to search for known and predicted regulatory elements (DNAase hypersensitivity, binding sites of transcription factors, and promoter regions) in the intergenic regions of our age-specific BMI and sex-specific WHRadjBMI loci. Additionally, we searched for estrogen, androgen or progesterone receptor motifs around our sex-specific WHRadjBMI loci. Source of these data include public datasets from GEO, the ENCODE project, and published literature [99].
Supporting Information
Zdroje
1. Vazquez G., et al., Comparison of body mass index, waist circumference, and waist/hip ratio in predicting incident diabetes: a meta-analysis. Epidemiol Rev, 2007. 29: p. 115–28. 17494056
2. Pischon T., et al., General and abdominal adiposity and risk of death in Europe. N Engl J Med, 2008. 359(20): p. 2105–20. doi: 10.1056/NEJMoa0801891 19005195
3. Mokdad A.H., et al., Prevalence of obesity, diabetes, and obesity-related health risk factors, 2001. JAMA, 2003. 289(1): p. 76–9. 12503980
4. Must A., et al., The disease burden associated with overweight and obesity. JAMA, 1999. 282(16): p. 1523–9. 10546691
5. Yusuf S., et al., Obesity and the risk of myocardial infarction in 27,000 participants from 52 countries: a case-control study. Lancet, 2005. 366(9497): p. 1640–9. 16271645
6. Canoy D., et al., Body fat distribution and risk of coronary heart disease in men and women in the European Prospective Investigation Into Cancer and Nutrition in Norfolk cohort: a population-based prospective study. Circulation, 2007. 116(25): p. 2933–43. 18071080
7. De Mello J.J., et al., Gender Differences In The Evaluation Of Adult Body Composition. Medicine and Science in Sports and Exercise, 2005. 37: p. S299–S299.
8. Kirchengast S., Gender Differences in Body Composition from Childhood to Old Age: An Evolutionary Point of View. Journal of Life Sciences, 2010. 2(1): p. 1–10.
9. Legato M.J., Beyond women's health the new discipline of gender-specific medicine. Med Clin North Am, 2003. 87(5): p. 917–37, vii. 14621324
10. Randall J.C., et al., Sex-stratified Genome-wide Association Studies Including 270,000 Individuals Show Sexual Dimorphism in Genetic Loci for Anthropometric Traits. Plos Genetics, 2013. 9(6): p. e1003500. doi: 10.1371/journal.pgen.1003500 23754948
11. Walter A.A., et al., Sarcopenia Indices: Age - And Gender-related Differences In Body Composition, Strength, And Muscle Quality. Medicine and Science in Sports and Exercise, 2012. 44: p. 98–98.
12. Wells J.C., Sexual dimorphism of body composition. Best Pract Res Clin Endocrinol Metab, 2007. 21(3): p. 415–30. 17875489
13. Loomba-Albrecht L.A. and Styne D.M., Effect of puberty on body composition. Curr Opin Endocrinol Diabetes Obes, 2009. 16(1): p. 10–5. 19115520
14. Rogol A.D., Roemmich J.N., and Clark P.A., Growth at puberty. J Adolesc Health, 2002. 31(6 Suppl): p. 192–200. 12470915
15. Rosenbaum M. and Leibel R.L., Clinical review 107: Role of gonadal steroids in the sexual dimorphisms in body composition and circulating concentrations of leptin. J Clin Endocrinol Metab, 1999. 84(6): p. 1784–9. 10372664
16. Kuk J.L., et al., Age-related changes in total and regional fat distribution. Ageing Res Rev, 2009. 8(4): p. 339–48. doi: 10.1016/j.arr.2009.06.001 19576300
17. Mott J.W., et al., Relation between body fat and age in 4 ethnic groups. American Journal of Clinical Nutrition, 1999. 69(5): p. 1007–1013. 10232643
18. Shungin D., et al., New genetic loci link adipose and insulin biology to body fat distribution. Nature, 2015. 518(7538): p. 187–96. doi: 10.1038/nature14132 25673412
19. Locke A.E., et al., Genetic studies of body mass index yield new insights for obesity biology. Nature, 2015. 518(7538): p. 197–206. doi: 10.1038/nature14177 25673413
20. Abdulnour J., et al., The effect of the menopausal transition on body composition and cardiometabolic risk factors: a Montreal-Ottawa New Emerging Team group study. Menopause, 2012. 19(7): p. 760–7. doi: 10.1097/gme.0b013e318240f6f3 22395454
21. Douchi T., et al., Precedence of bone loss over changes in body composition and body fat distribution within a few years after menopause. Maturitas, 2003. 46(2): p. 133–138. 14559384
22. Morita Y., et al., Precedence of the shift of body-fat distribution over the change in body composition after menopause. Journal of Obstetrics and Gynaecology Research, 2006. 32(5): p. 513–516. 16984520
23. Bromberger J.T., et al., Prospective study of the determinants of age at menopause. Am J Epidemiol, 1997. 145(2): p. 124–33. 9006309
24. Gold E.B., et al., Factors associated with age at natural menopause in a multiethnic sample of midlife women. Am J Epidemiol, 2001. 153(9): p. 865–74. 11323317
25. Gold E.B., et al., Factors Related to Age at Natural Menopause: Longitudinal Analyses From SWAN. Am J Epidemiol, 2013. 178(1): p. 70–83. doi: 10.1093/aje/kws421 23788671
26. Kooperberg C. and Leblanc M., Increasing the power of identifying gene x gene interactions in genome-wide association studies. Genet Epidemiol, 2008. 32(3): p. 255–63. doi: 10.1002/gepi.20300 18200600
27. Aschard H., et al., Genome-wide meta-analysis of joint tests for genetic and gene-environment interaction effects. Hum Hered, 2010. 70(4): p. 292–300. doi: 10.1159/000323318 21293137
28. Speliotes E.K., et al., Association analyses of 249,796 individuals reveal 18 new loci associated with body mass index. Nat Genet, 2010. 42(11): p. 937–48. doi: 10.1038/ng.686 20935630
29. Heid I.M., et al., Meta-analysis identifies 13 new loci associated with waist-hip ratio and reveals sexual dimorphism in the genetic basis of fat distribution. Nature Genetics, 2010. 42(11): p. 949–60. doi: 10.1038/ng.685 20935629
30. Newton-Cheh C., et al., Genome-wide association study identifies eight loci associated with blood pressure. Nat Genet, 2009. 41(6): p. 666–76. doi: 10.1038/ng.361 19430483
31. Teslovich T.M., et al., Biological, clinical and population relevance of 95 loci for blood lipids. Nature, 2010. 466(7307): p. 707–13. doi: 10.1038/nature09270 20686565
32. Morris A.P., et al., Large-scale association analysis provides insights into the genetic architecture and pathophysiology of type 2 diabetes. Nat Genet, 2012. 44(9): p. 981–90. doi: 10.1038/ng.2383 22885922
33. Scott R.A., et al., Large-scale association analyses identify new loci influencing glycemic traits and provide insight into the underlying biological pathways. Nat Genet, 2012. 44(9): p. 991–1005. doi: 10.1038/ng.2385 22885924
34. Simino J., et al., Gene-Age Interactions in Blood Pressure Regulation: A Large-Scale Investigation with the CHARGE, Global BPgen, and ICBP Consortia. Am J Hum Genet, 2014. 95(1): p. 24–38. doi: 10.1016/j.ajhg.2014.05.010 24954895
35. Hindroff, L.A., et al., A Catalog of Published Genome-Wide Association Studies Available at www.genome.gov/gwastudies. 2010.
36. Horikoshi M., et al., New loci associated with birth weight identify genetic links between intrauterine growth and adult height and metabolism. Nat Genet, 2013. 45(1): p. 76–82. doi: 10.1038/ng.2477 23202124
37. Bradfield J.P., et al., A genome-wide association meta-analysis identifies new childhood obesity loci. Nat Genet, 2012. 44(5): p. 526–31. doi: 10.1038/ng.2247 22484627
38. Graff M., et al., The influence of obesity-related single nucleotide polymorphisms on BMI across the life course: the PAGE study. Diabetes, 2013. 62(5): p. 1763–7. doi: 10.2337/db12-0863 23300277
39. Leitsalu L., et al., Cohort Profile: Estonian Biobank of the Estonian Genome Center, University of Tartu. Int J Epidemiol, 2014.
40. Fehrmann R.S., et al., Trans-eQTLs reveal that independent genetic variants associated with a complex phenotype converge on intermediate genes, with a major role for the HLA. PLoS Genet, 2011. 7(8): p. e1002197. doi: 10.1371/journal.pgen.1002197 21829388
41. Luong A., et al., Molecular characterization of human acetyl-CoA synthetase, an enzyme regulated by sterol regulatory element-binding proteins. J Biol Chem, 2000. 275(34): p. 26458–66. 10843999
42. Wright F.A., et al., Heritability and genomics of gene expression in peripheral blood. Nat Genet, 2014. 46(5): p. 430–7. doi: 10.1038/ng.2951 24728292
43. Jansen R., et al., Sex differences in the human peripheral blood transcriptome. BMC Genomics, 2014. 15: p. 33. doi: 10.1186/1471-2164-15-33 24438232
44. Grove K.L., et al., A microarray analysis of sexual dimorphism of adipose tissues in high-fat-diet-induced obese mice. Int J Obes (Lond), 2010. 34(6): p. 989–1000.
45. Baumgartner B.G., et al., Identification of a novel modulator of thyroid hormone receptor-mediated action. PLoS One, 2007. 2(11): p. e1183. 18030323
46. Sala D., et al., Autophagy-regulating TP53INP2 mediates muscle wasting and is repressed in diabetes. J Clin Invest, 2014. 124(5): p. 1914–27. doi: 10.1172/JCI72327 24713655
47. Pers T.H., et al., Biological interpretation of genome-wide association studies using predicted gene functions. Nat Commun, 2015. 6: p. 5890. doi: 10.1038/ncomms6890 25597830
48. Veilleux A., et al., Glucocorticoid-induced androgen inactivation by aldo-keto reductase 1C2 promotes adipogenesis in human preadipocytes. Am J Physiol Endocrinol Metab, 2012. 302(8): p. E941–9. doi: 10.1152/ajpendo.00069.2011 22275760
49. Yoon M., The role of PPARalpha in lipid metabolism and obesity: focusing on the effects of estrogen on PPARalpha actions. Pharmacol Res, 2009. 60(3): p. 151–9. doi: 10.1016/j.phrs.2009.02.004 19646654
50. Yang J., et al., Common SNPs explain a large proportion of the heritability for human height. Nat Genet, 2010. 42(7): p. 565–9. doi: 10.1038/ng.608 20562875
51. Hardy R., et al., Life course variations in the associations between FTO and MC4R gene variants and body size. Hum Mol Genet, 2010. 19(3): p. 545–52. doi: 10.1093/hmg/ddp504 19880856
52. Hertel J.K., et al., FTO, type 2 diabetes, and weight gain throughout adult life: a meta-analysis of 41,504 subjects from the Scandinavian HUNT, MDC, and MPP studies. Diabetes, 2011. 60(5): p. 1637–44. doi: 10.2337/db10-1340 21398525
53. den Hoed M., et al., Genetic susceptibility to obesity and related traits in childhood and adolescence: influence of loci identified by genome-wide association studies. Diabetes, 2010. 59(11): p. 2980–8. doi: 10.2337/db10-0370 20724581
54. Graff M., et al., Estimation of genetic effects on BMI during adolescence in an ethnically diverse cohort: The National Longitudinal Study of Adolescent Health. Nutr Diabetes, 2012. 2: p. e47. doi: 10.1038/nutd.2012.20 23168566
55. Murphy R.A., et al., Candidate Gene Association Study of BMI-Related Loci, Weight, and Adiposity in Old Age. J Gerontol A Biol Sci Med Sci, 2013. 68(6): p. 661–6. doi: 10.1093/gerona/gls227 23160366
56. Elks C.E., et al., Adult obesity susceptibility variants are associated with greater childhood weight gain and a faster tempo of growth: the 1946 British Birth Cohort Study. Am J Clin Nutr, 2012. 95(5): p. 1150–6. doi: 10.3945/ajcn.111.027870 22456663
57. Sovio U., et al., Association between common variation at the FTO locus and changes in body mass index from infancy to late childhood: the complex nature of genetic association through growth and development. PLoS Genet, 2011. 7(2): p. e1001307. doi: 10.1371/journal.pgen.1001307 21379325
58. Graff M., et al., Genome-wide analysis of BMI in adolescents and young adults reveals additional insight into the effects of genetic loci over the life course. Hum Mol Genet, 2013. 22(17): p. 3597–607. doi: 10.1093/hmg/ddt205 23669352
59. Do R., et al., Common variants associated with plasma triglycerides and risk for coronary artery disease. Nat Genet, 2013. 45(11): p. 1345–52. doi: 10.1038/ng.2795 24097064
60. Fromm-Dornieden C., et al., Extrinsic and intrinsic regulation of DOR/TP53INP2 expression in mice: effects of dietary fat content, tissue type and sex in adipose and muscle tissues. Nutr Metab (Lond), 2012. 9(1): p. 86.
61. McCarthy M.I., Genomics, type 2 diabetes, and obesity. N Engl J Med, 2010. 363(24): p. 2339–50. doi: 10.1056/NEJMra0906948 21142536
62. Travers M.E. and McCarthy M.I., Type 2 diabetes and obesity: genomics and the clinic. Hum Genet, 2011. 130(1): p. 41–58. doi: 10.1007/s00439-011-1023-8 21647602
63. Li Y., et al., Genotype Imputation. Annual Review of Genomics and Human Genetics, 2009. 10(1): p. 387–406.
64. Marchini J., et al., A new multipoint method for genome-wide association studies by imputation of genotypes. Nat Genet, 2007. 39(7): p. 906–913. 17572673
65. Guan Y. and Stephens M., Practical Issues in Imputation-Based Association Mapping. PLoS Genet, 2008. 4(12): p. e1000279. doi: 10.1371/journal.pgen.1000279 19057666
66. Voight B.F., et al., The metabochip, a custom genotyping array for genetic studies of metabolic, cardiovascular, and anthropometric traits. PLoS Genet, 2012. 8(8): p. e1002793. doi: 10.1371/journal.pgen.1002793 22876189
67. Li Y., et al., MaCH: using sequence and genotype data to estimate haplotypes and unobserved genotypes. Genetic Epidemiology, 2010. 34(8): p. 816–34. doi: 10.1002/gepi.20533 21058334
68. Aulchenko Y.S., Struchalin M.V., and van Duijn C.M., ProbABEL package for genome-wide association analysis of imputed data. BMC Bioinformatics, 2010. 11: p. 134. doi: 10.1186/1471-2105-11-134 20233392
69. Aulchenko Y.S., et al., GenABEL: an R library for genome-wide association analysis. Bioinformatics, 2007. 23(10): p. 1294–6. 17384015
70. Abecasis G.R. and Wigginton J.E., Handling marker-marker linkage disequilibrium: pedigree analysis with clustered markers. Am J Hum Genet, 2005. 77(5): p. 754–67. 16252236
71. Purcell S., et al., PLINK: a tool set for whole-genome association and population-based linkage analyses. The American Journal of Human Genetics, 2007. 81: p. 559–575. 17701901
72. Kutalik Z., et al., Methods for testing association between uncertain genotypes and quantitative traits. Biostatistics, 2011. 12(1): p. 1–17. doi: 10.1093/biostatistics/kxq039 20543033
73. Winkler T.W., et al., Quality control and conduct of genome-wide association meta-analyses. Nat Protoc, 2014. 9(5): p. 1192–212. doi: 10.1038/nprot.2014.071 24762786
74. Devlin B. and Roeder K., Genomic control for association studies. Biometrics, 1999. 55(4): p. 997–1004. 11315092
75. Willer C.J., Li Y., and Abecasis G.R., METAL: fast and efficient meta-analysis of genomewide association scans. Bioinformatics, 2010. 26(17): p. 2190–1. doi: 10.1093/bioinformatics/btq340 20616382
76. Benjamini Y. and Hochberg Y., Controlling the False Discovery Rate—a Practical and Powerful Approach to Multiple Testing. Journal of the Royal Statistical Society Series B-Methodological, 1995. 57(1): p. 289–300.
77. Rowland M.L., Self-reported weight and height. Am J Clin Nutr, 1990. 52(6): p. 1125–33. 2239790
78. Elgar F.J., et al., Validity of self-reported height and weight and predictors of bias in adolescents. J Adolesc Health, 2005. 37(5): p. 371–5. 16227121
79. Keith S.W., et al., Use of self-reported height and weight biases the body mass index-mortality association. Int J Obes (Lond), 2011. 35(3): p. 401–8.
80. Purcell S., et al., PLINK: a tool set for whole-genome association and population-based linkage analyses. Am J Hum Genet, 2007. 81(3): p. 559–75. 17701901
81. Genomes Project, C., et al., A map of human genome variation from population-scale sequencing. Nature, 2010. 467(7319): p. 1061–73. doi: 10.1038/nature09534 20981092
82. Hindorff, L.A., et al., A Catalog of Published Genome-Wide Association Studies. 2010.
83. Lango Allen, H., et al., Hundreds of variants clustered in genomic loci and biological pathways affect human height. Nature, 2010. 467(7317): p. 832–8. doi: 10.1038/nature09410 20881960
84. Kamatani Y., et al., Genome-wide association study of hematological and biochemical traits in a Japanese population. Nature Genetics, 2010. 42(3): p. 210–5. doi: 10.1038/ng.531 20139978
85. Franke A., et al., Genome-wide meta-analysis increases to 71 the number of confirmed Crohn's disease susceptibility loci. Nature Genetics, 2010. 42(12): p. 1118–25. doi: 10.1038/ng.717 21102463
86. Sawcer S., et al., Genetic risk and a primary role for cell-mediated immune mechanisms in multiple sclerosis. Nature, 2011. 476(7359): p. 214–9. doi: 10.1038/nature10251 21833088
87. Wang K.S., Liu X.F., and Aragam N., A genome-wide meta-analysis identifies novel loci associated with schizophrenia and bipolar disorder. Schizophr Res, 2010. 124(1–3): p. 192–9. doi: 10.1016/j.schres.2010.09.002 20889312
88. Cirulli E.T., et al., Common genetic variation and performance on standardized cognitive tests. Eur J Hum Genet, 2010. 18(7): p. 815–20. doi: 10.1038/ejhg.2010.2 20125193
89. Estrada K., et al., Genome-wide meta-analysis identifies 56 bone mineral density loci and reveals 14 loci associated with risk of fracture. Nature Genetics, 2012. 44(5): p. 491–501. doi: 10.1038/ng.2249 22504420
90. Gieger C., et al., New gene functions in megakaryopoiesis and platelet formation. Nature, 2011. 480(7376): p. 201–8. doi: 10.1038/nature10659 22139419
91. Need A.C., et al., A genome-wide study of common SNPs and CNVs in cognitive performance in the CANTAB. Hum Mol Genet, 2009. 18(23): p. 4650–61. doi: 10.1093/hmg/ddp413 19734545
92. Calvano S.E., et al., A network-based analysis of systemic inflammation in humans. Nature, 2005. 437(7061): p. 1032–7. 16136080
93. Yang J., et al., GCTA: a tool for genome-wide complex trait analysis. Am J Hum Genet, 2011. 88(1): p. 76–82. doi: 10.1016/j.ajhg.2010.11.011 21167468
94. Kutalik Z., et al., Novel method to estimate the phenotypic variation explained by genome-wide association studies reveals large fraction of the missing heritability. Genet Epidemiol, 2011. 35(5): p. 341–9. doi: 10.1002/gepi.20582 21465548
95. Heid I.M., et al., Meta-analysis identifies 13 new loci associated with waist-hip ratio and reveals sexual dimorphism in the genetic basis of fat distribution. Nat Genet, 2010. 42(11): p. 949–960. doi: 10.1038/ng.685 20935629
96. Johnson A.D., et al., SNAP: a web-based tool for identification and annotation of proxy SNPs using HapMap. Bioinformatics, 2008. 24(24): p. 2938–9. doi: 10.1093/bioinformatics/btn564 18974171
97. Kumar P., Henikoff S., and Ng P.C., Predicting the effects of coding non-synonymous variants on protein function using the SIFT algorithm. Nat Protoc, 2009. 4(7): p. 1073–81. doi: 10.1038/nprot.2009.86 19561590
98. Wang K., Li M., and Hakonarson H., ANNOVAR: functional annotation of genetic variants from high-throughput sequencing data. Nucleic Acids Res, 2010. 38(16): p. e164. doi: 10.1093/nar/gkq603 20601685
99. Boyle A.P., et al., Annotation of functional variation in personal genomes using RegulomeDB. Genome Res, 2012. 22(9): p. 1790–7. doi: 10.1101/gr.137323.112 22955989
Štítky
Genetika Reprodukční medicínaČlánek vyšel v časopise
PLOS Genetics
2015 Číslo 10
- Kazuistika – Perspektivy využití precizované medicíny v rámci personalizované specifické terapie onkologických pacientů
- Nobelova cena za chemii pro genetické nůžky: Objev, který změní naši budoucnost?
- Technologie na bázi RNA v klinické praxi: od přebarvených petúnií k terapii vzácných a dosud jen obtížně léčitelných chorob u lidí
- „Nepředstavovali jsme si, že náš výzkum povede přímo ke vzniku nových léků, dokonce ještě za našeho života“
- Bezplatné služby pro diagnostiku ATTRv amyloidózy pro kardiology
Nejčtenější v tomto čísle
- Single Strand Annealing Plays a Major Role in RecA-Independent Recombination between Repeated Sequences in the Radioresistant Bacterium
- The Rise and Fall of an Evolutionary Innovation: Contrasting Strategies of Venom Evolution in Ancient and Young Animals
- Genome Wide Identification of SARS-CoV Susceptibility Loci Using the Collaborative Cross
- DCA1 Acts as a Transcriptional Co-activator of DST and Contributes to Drought and Salt Tolerance in Rice
Zvyšte si kvalifikaci online z pohodlí domova
Mazová zátka a její řešení
nový kurzVšechny kurzy