
Genome-Scale Mapping of σ Reveals Widespread, Conserved Intragenic Binding
Bacterial RNA polymerases must associate with a σ factor to bind to promoter DNA sequences upstream of genes and initiate transcription. There are two families of σ factor: σ70 and σ54. Members of the σ54 family are distinct from members of the σ70 family in their ability to bind promoter DNA sequences, in association with RNA polymerase, in a transcriptionally inactive state. We have determined positions in the Escherichia coli genome that are bound by σ54, the archetypal member of the σ54 family. Surprisingly, we identified 135 binding sites for σ54, a huge increase over the number of previously described sites. Our data suggest that there are more than 250 σ54 sites in total. Strikingly, most σ54 binding sites are located inside genes, whereas only one intragenic σ54 binding site has previously been described. The location and orientation of intragenic σ54 binding sites is non-random, and many intragenic σ54 binding sites are conserved in other bacterial species. We conclude that many intragenic σ54 binding sites are likely to be functional. Consistent with this notion, we identify three σ54 promoters in E. coli that are located inside genes but drive transcription of unusual mRNAs for the neighboring genes.
Published in the journal:
. PLoS Genet 11(10): e32767. doi:10.1371/journal.pgen.1005552
Category:
Research Article
doi:
https://doi.org/10.1371/journal.pgen.1005552
Summary
Bacterial RNA polymerases must associate with a σ factor to bind to promoter DNA sequences upstream of genes and initiate transcription. There are two families of σ factor: σ70 and σ54. Members of the σ54 family are distinct from members of the σ70 family in their ability to bind promoter DNA sequences, in association with RNA polymerase, in a transcriptionally inactive state. We have determined positions in the Escherichia coli genome that are bound by σ54, the archetypal member of the σ54 family. Surprisingly, we identified 135 binding sites for σ54, a huge increase over the number of previously described sites. Our data suggest that there are more than 250 σ54 sites in total. Strikingly, most σ54 binding sites are located inside genes, whereas only one intragenic σ54 binding site has previously been described. The location and orientation of intragenic σ54 binding sites is non-random, and many intragenic σ54 binding sites are conserved in other bacterial species. We conclude that many intragenic σ54 binding sites are likely to be functional. Consistent with this notion, we identify three σ54 promoters in E. coli that are located inside genes but drive transcription of unusual mRNAs for the neighboring genes.
Introduction
Transcription initiation, the first step in gene expression, is highly regulated to ensure correct timing of developmental processes and the response to environmental stimuli. In bacteria, transcription initiation involves association of RNA polymerase (RNAP) with promoter DNA. Core RNAP must associate with a Sigma (σ) factor to make sequence-specific contacts with promoter DNA [1]. Following promoter escape, σ factors are released from the elongating RNAP [2].
Bacterial cells often express a single “primary” σ factor and multiple “alternative” σ factors. The primary σ factor is constitutively active and is responsible for transcription of most genes. Alternative σ factors are typically expressed or activated under specific growth conditions and recognize promoters with nucleotide sequences distinct from those recognized by the primary σ factor [3]. Consequently, alternative σ factors govern the transcription of different sets of genes (regulons). Depending on the growth phase, environmental conditions, and developmental stage experienced by the cell, the composition of the pool of active σ factors can vary, allowing for dynamic and rapid expression of different regulons as needed. Escherichia coli has one primary σ factor (σ70) and six alternative σ factors (σ19, σ24, σ28, σ32, σ38 and σ54) [3].
There are two families of σ factor in bacteria: the σ70 family and the σ54 family. σ54 proteins differ dramatically from those in the σ70 family, both in sequence and domain structure. σ54 promoter elements consist of conserved nucleotides located at -12 and -24 with respect to the transcription start site [4]. This contrasts with members of the σ70 family, which recognize conserved promoter elements located at roughly -10 and -35 with respect to the transcription start site [3]. Unlike the members of the σ70 family, σ54 proteins have been shown to bind promoter DNA independent of core RNAP in vitro [5]. Another distinguishing characteristic of σ54 proteins is their absolute requirement for activator proteins, known as bacterial enhancer binding proteins (bEBPs), to initiate transcription [4,6]. bEBPs act in a manner distinct from typical σ70 transcriptional activator proteins: rather than helping to recruit RNAP, like most activators of σ70, bEBPs use ATP hydrolysis to drive isomerization of RNAP already bound at the promoter [4]. Thus, both active and inactive forms of RNAP:σ54 are bound at promoters. The archetypal member of the σ54 family is σ54 from E. coli. Originally identified as a regulator of genes involved in nitrogen metabolism and assimilation under nitrogen limiting conditions [7], E. coli σ54 has since been shown to play important regulatory roles in a variety of other cellular processes. Similarly, σ54 homologues in other species regulate a wide range of processes, including flagellar synthesis and virulence [8]. E. coli, and most other bacterial species, have only one σ54 family protein [9].
Genome-wide DNA binding studies have been performed for a handful of σ factors in different bacteria. σ factors show a wide range in the number of sites bound, from just a few sites for extracytoplasmic function (ECF) σ70 family factors [10,11] to more than a thousand sites for E. coli σ70 [12,13]. These studies have revealed new promoters and often help to clarify gene expression changes that are a direct result of proximal RNAP:σ binding. Unexpectedly, some σ factors have been shown to bind extensively inside genes [14,15,16,17,18]. Notably, 58% of the σ54 binding sites described in Salmonella Typhimurium occur inside genes [14]. Interestingly, in Vibrio cholerae, only 10% of the described σ54 binding sites occur inside genes [19], suggesting variation in the regulatory capacity of σ54 across bacterial species. The function, if any, of σ54 binding events inside genes is unknown, with the exception of one promoter that has been shown to drive transcription of an mRNA for the downstream gene, with the RNA having an unusually long 5ʹ UTR [20].
In this study we use chromatin immunoprecipitation (ChIP) followed by deep sequencing (ChIP-seq) to determine the genome-wide binding profile of σ54 in E. coli. We confirm all but one previously reported promoter and identify 116 novel, high confidence σ54 binding sites. Notably, two thirds of the σ54 binding sites occur inside genes. These intragenic sites are oriented non-randomly, with the majority oriented in the same direction as the overlapping gene. We show that three intragenic binding sites are functional promoters, and conservation analysis suggests that many others are functional under different growth conditions.
Results
Genome-scale identification of σ54 binding sites using ChIP-seq
We predicted that all σ54-transcribed promoters would be bound by RNAP:σ54 under all growth conditions in which σ54 is expressed. Therefore, we mapped the binding of σ54 using ChIP-seq for cells grown to mid-logarithmic phase in M9 minimal medium. Using a high stringency analysis, we identified 145 ChIP-seq peaks that correspond to putative sites of σ54 binding (Tables 1 and 2 and S1 Table). The identified peaks have a bimodal shape, typical of ChIP-seq data (Fig 1A) [21]. We used MEME [22] to identify enriched sequence motifs in the 150 bp regions surrounding each of the putative σ54 binding sites. A motif closely resembling the known σ54–24/-12 promoter elements [6] was identified in 135 of the regions (Fig 1B). This represents a highly significant enrichment for the motif within these sequences (MEME E-value 1.8e-213). Furthermore, the distribution of motif positions within the ChIP-based query sequences was non-random: motifs were far more likely to be located at the center of the query sequence than expected by chance (p = 1.1e-61; Fig 1C), as would be expected for genuine σ54 binding sites. ChIP-seq peaks without an associated motif are listed in S1 Table. We selected 13 putative σ54 binding sites for validation. All of these sites are associated with a motif identified by MEME. We used quantitative PCR to measure enrichment of these sites by ChIP (ChIP-qPCR) of σ54 in wild type cells or cells in which rpoN is deleted. In all cases, we detected robust enrichment in wild type cells that was significantly higher than that in ΔrpoN cells (Fig 2A). Moreover, ChIP-qPCR enrichment scores correlated well with enrichment measured by ChIP-seq (R2 = 0.71; Fig 2B). We also selected five of the ten regions for which we detected a ChIP-seq peak but no motif. We suspected that these were false positives that are commonly found in ChIP-seq datasets for regions that are highly transcribed [12,23,24,25]. We used ChIP-qPCR of σ54 in wild type cells and ΔrpoN cells. We observed no significant difference in enrichment levels between the wild type and ΔrpoN cells (S1 Fig), consistent with these sites being false positives. We conclude that nearly all of the binding sites identified by ChIP-seq, for which we also detected a motif, represent genuine sites of σ54 binding. For all further analyses, we required that the ChIP-enriched sequences include a σ54 promoter motif identified by MEME to be called as a genuine σ54 binding site (Tables 1 and 2). We refer to these 135 binding sites as “high stringency sites”. Note that we use the term “binding site” rather than “promoter” because we do not know which sites represent functional promoters, as opposed to σ54 binding sites that never lead to productive transcription.


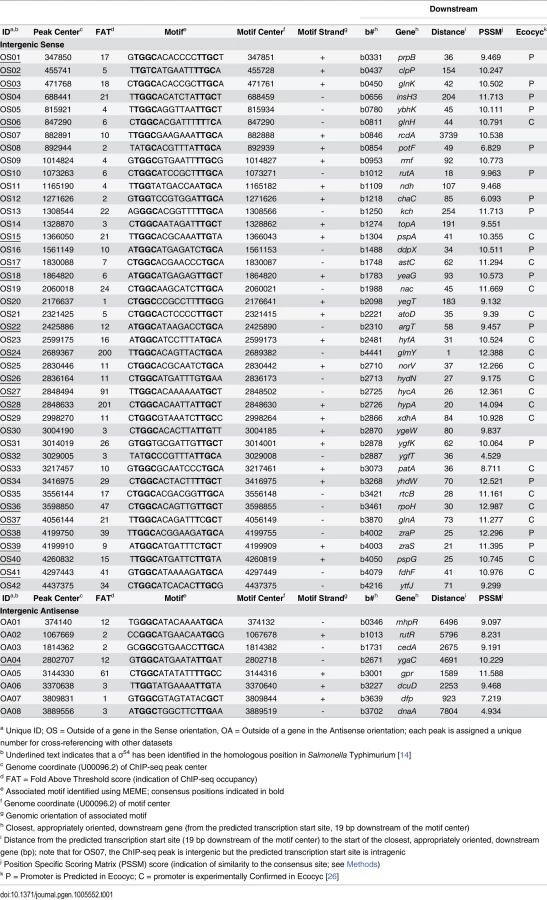

135 σ54 binding sites represents a very large increase over previously described, experimentally confirmed σ54 promoters, of which there are only 20 [26]. Nonetheless, we suspected that our stringent peak-calling algorithm may have missed some genuine σ54 promoters. Consistent with this, we failed to call a peak upstream of crl, despite two independent reports of σ54 binding [27,28]. Visual analysis of the ChIP-seq data for the region upstream of crl indicated a small peak, below the threshold used for peak calling (S2 Fig). We reduced the stringency of our peak-calling algorithm such that it identified an additional 204 “low stringency” peaks (i.e. 349 total peaks), including the site upstream of crl. We then analyzed the sequences surrounding these low stringency peaks using MEME [22]. We identified a highly enriched motif that closely resembles the known σ54–24/-12 promoter elements (S3A Fig). This motif is present in 149 of the 204 sequences (S2 Table) and is centrally enriched (p = 9.6e-41; S3B Fig). This is a smaller fraction than for the 135 sites identified using the stringent cut-off, indicative of a higher false positive rate. Nevertheless, it suggests that σ54 binds more than 250 sites in the E. coli genome.
Comparison to previously described σ54 promoters
A recent study using ChIP-chip to map the binding of σ54 across the E. coli genome identified 161 putative σ54 binding sites [29]. We compared putative σ54 binding sites identified in the ChIP-chip study to the 135 high stringency σ54 binding sites we identified, in addition to the 10 sites we identified by ChIP-seq but which lacked a detectable motif. Strikingly, only 67 putative σ54 binding sites overlapped with our own list (S3 Table). We searched for enriched sequence motifs in the remaining 94 putative sites that were unique to the ChIP-chip study. The three most significantly enriched motifs identified by MEME [22] are all repetitive sequences from insertion elements (S4A Fig) and are not centrally enriched. There were no significantly enriched motifs that resembled the known σ54 promoter elements [6]. We also used MEME to search for enriched sequence motifs in the putative σ54 binding sites that were unique to our high stringency list. MEME detected a highly enriched motif that resembles the known σ54 promoter elements (MEME E-value = 5.7e-83; S4B Fig) [6]. This motif is centrally enriched (p = 4.8e-28; S4C Fig). We conclude that the majority of the σ54 binding sites identified using ChIP-chip are false positives and that many genuine sites were missed.
We compared our high stringency list of 135 σ54 binding sites to those identified in other studies. The EcoCyc database [26] lists 20 σ54 promoters that have been experimentally confirmed. We identified 18 of these (Table 1). Thus, our approach validates almost all known σ54 promoters. For one of the “known” σ54 promoters that we failed to identify, that for ibpB, we detected background levels of σ54 ChIP signal, suggesting that this is not a genuine σ54 promoter and is misannotated. The EcoCyc database [26] also lists 76 predicted σ54 promoters that have not been experimentally confirmed. These promoters have been predicted based on either DNA sequence or expression microarray data. We confirmed 15 of these predicted sites (Table 1).
A previous study used microarrays to compare expression of cells lacking σ54 to cells transiently overexpressing σ54 [28]. They identified 22 putative, novel σ54 promoters with high confidence. We identified appropriately orientated ChIP-seq peaks ≤500 bp upstream of only five of these genes (norV, xdhA, ygfK, rutA and ddpX). We used MEME [22] to search for enriched motifs in the regions upstream of the 22 putative, novel σ54-transcribed genes identified by [28] (including the five confirmed by our data). There were no significantly enriched motifs that resembled the known σ54 promoter elements (S5 Fig) [6]. We conclude that the majority of the σ54 binding sites identified using microarray analysis of RNA levels are false positives and that many genuine sites were missed.
σ54 binding is associated with diverse gene functions
We selected all genes for which there was a σ54 binding site positioned <300 bp upstream in the same orientation as the gene. We then searched for enriched Gene Ontology (GO) terms using FuncAssociate [30]. We failed to identify any significantly enriched GO terms (p < 0.05 with multiple hypothesis testing correction), indicating that σ54-transcribed genes are not, as a group, strongly associated with any specific functions. This is consistent with previous studies that have identified a wide variety of functions for σ54-transcribed genes [6].
Widespread intragenic σ54 binding with a non-random distribution
With one exception [20], all previously described, experimentally confirmed σ54 binding sites in E. coli are located in intergenic regions. The distribution with respect to gene position of the 135 high stringency σ54 binding site locations we identified is shown in Fig 3A. As expected, σ54 binding sites as a group are closer to annotated gene starts than random genomic positions (Fig 3B). Surprisingly, 85 of the 135 σ54 binding sites (62%) are located inside genes (Fig 3A). Furthermore, of the 50 σ54 binding sites in intergenic regions, 8 are oriented away from the neighboring gene(s), indicating that they are not promoters for the immediately adjacent genes. Further analysis of the σ54 binding sites inside genes showed that 58 (68%) of these sites are positioned in the sense orientation with respect to the overlapping gene (Fig 3A). This is far more than expected by chance (Binomial test p = 5e-4, assuming a 50% random chance of sense/antisense orientation). We observed a similar, significant bias (79/129; 61%) for the low stringency sites (Binomial test p = 0.007; S2 Table). The distance of intragenic σ54 binding sites from the nearest appropriately oriented gene start is also non-random. Specifically, there are many more sites between 360 and 760 bp upstream of an available gene start than expected by chance (36.5% of all intragenic sites as compared to 14.3% of all intragenic coordinates genome-wide; Fig 3B).

σ54 typically binds in the context of transcriptionally inactive RNAP holoenzyme
σ54 can bind promoter DNA in the absence of core RNAP in vitro, although the affinity is lower than that in the context of RNAP holoenzyme [5]. To determine whether σ54 binding in vivo is in the context of RNAP holoenzyme, we used ChIP-seq to map the genome-wide distribution of the β subunit of core RNAP under the same growth conditions used for σ54 ChIP-seq. As shown in Fig 1A, we detected increased local signal for β at sites of σ54 binding. In some cases, especially for intragenic σ54 binding sites, the σ54 peak is located within a transcribed region. Hence, it is more difficult to ascertain σ54-dependent RNAP binding at these positions. Therefore, we determined the median occupancy of RNAP at each of the positions in the 1 kbp region surrounding all σ54 binding sites (Fig 4; note that each σ54 peak contributes equally in this analysis, regardless of the ChIP-seq signal for σ54). RNAP binding is substantially greater at the exact site of σ54 binding than in the flanking sequence. Furthermore, RNAP binding at the motif center is enriched compared to RNAP binding at randomly selected positions throughout the genome (Fig 4). We conclude that most or all σ54 binding in vivo is in the context of RNAP holoenzyme. We also noted that the distribution of RNAP binding at σ54 binding sites is symmetric (Figs 1A and 4), indicative of RNAP that is not actively transcribing RNA. Thus, our data strongly suggest that most or all RNAP:σ54 is transcriptionally inactive under the conditions tested. Furthermore, as described in more detail below, little RNA initiates from identified σ54 binding sites under the conditions used in our study (Fig 5 and S4 Table).


σ54 binding to intragenic sites does not impact expression of the overlapping genes
It is intriguing that (i) a large proportion of σ54 binding sites is intragenic (Fig 3A), (ii) 52% of σ54 binding sites are >500 bp from an annotated gene start (Fig 3B), (iii) σ54 binding at most sites appears to be transcriptionally inactive (Fig 4), and (iv) σ54 has been previously shown to repress transcription when its binding site overlaps another promoter [27,31]. Based on these observations, we postulated that intragenic σ54 binding may reduce expression of the overlapping genes by acting as a transcriptional “roadblock” [32]. To test this hypothesis, we compared the expression of all genes using RNA-seq in cells lacking σ54 and cells transiently overexpressing σ54. We observed significant (≥ 2-fold regulation with an estimated False Discovery Rate ≤ 0.01) expression differences for 465 genes. 272 genes were up-regulated following σ54 overexpression, while 193 were down-regulated (Fig 5 and S4 Table). Of the 85 genes with intragenic σ54 binding sites, only ybaT, erfK and clpB were significantly down-regulated (S4 Table). Down-regulation of three out of 85 genes is not significantly more than expected by chance given the total number of down-regulated genes (Fisher’s exact test p = 0.47). Therefore, it is unlikely that RNAP:σ54 acts as a transcriptional roadblock under these conditions.
We also examined the genes that were up-regulated upon σ54 overexpression. Only 5 genes with intergenic σ54 binding sites upstream were significantly up-regulated. These genes are all known to be transcribed by RNAP:σ54. For each gene, regulation by a known bEBP has been described previously: glnA and glnH by NtrC [33], pspA and pspG by PspF [34] and glmY by GlrR (Fig 5) [35]. No other known RNAP:σ54-transcribed genes were significantly up-regulated. Ten genes with intragenic σ54 sites were significantly up-regulated following σ54 overexpression. Up-regulated genes carB, purK, wbbK, yhbE and rplD contain a σ54 motif in the sense orientation relative to the overlapping gene. However, genes immediately upstream were also up-regulated, suggesting an indirect effect of σ54 overexpression on whole operons. rpmJ, metQ, yajG and cysK were also up-regulated by σ54 overexpression. However, the motif associated with these binding sites is in the antisense orientation. Finally, metF, a gene up-regulated upon σ54 overexpression, contains an intragenic σ54 binding site in the sense orientation that is not associated with up-regulation of an upstream gene. However, the σ54 site is located near the 3ʹ-end of the gene, suggesting that it is not responsible for the observed increase in expression. We conclude that up-regulation of genes that contain intragenic σ54 binding sites is not due to binding of σ54 at these positions, but rather to indirect effects of σ54 overexpression.
Some intragenic σ54 binding sites are functional promoters
Our RNA-seq analysis indicates that only three bEBP activators, NtrC, PspF and GlrR, are active under the conditions used, most likely at a very low level (Fig 5 and S4 Table). A single condition where most bEBPs are induced has not been determined; hence, most σ54 promoters will be inactive under a given condition. The bEBP NtrC is highly active in nitrogen-limiting conditions [20]. We compared our ChIP-seq data to published microarray data from E. coli grown under nitrogen-rich conditions (NtrC inactive), and conditions known to induce activity of NtrC [36]. Not all of the σ54 initiated genes are expected to be up-regulated under these conditions, just those under control of NtrC. There are 15 previously described NtrC-regulated operons in E. coli [20,37]. All of these operons are associated with a σ54 ChIP-seq peak (our study), and most are associated with observed increases in expression in nitrogen-limiting conditions, e.g. nac (Fig 6A) [29]. We observed two additional intergenic ChIP-seq peaks associated with increased expression of the downstream genes, hypA and zraP, in nitrogen-limiting conditions (Fig 6A). hypA and zraP are both known to be transcribed by RNAP:σ54; however, transcription of these genes is activated by bEBPs other than NtrC. Specifically, transcription of hypA is activated by FhlA in response to anaerobiosis and the presence of formate [38], and transcription of zraP is activated by ZraR in response to high zinc concentrations [39]. Thus, our data suggest either that hypA and zraP are regulated by multiple bEBPs (i.e. NtrC and at least one other), or that bEBPs other than NtrC are activated under the growth conditions tested. The latter is more likely since no NtrC binding was detected upstream of hypA or zraP by ChIP-seq [20]. We also observed three transcripts induced under low nitrogen conditions that initiate from intragenic σ54 binding sites. These σ54 binding sites, within nagB, yqeC and rlmD, are located immediately upstream of the start sites for the transcripts induced by nitrogen limitation, and the predicted -24 and -12 motifs are oriented in the same direction as the associated RNAs (Fig 6B). In each case, the RNA that appears to be transcribed by RNAP:σ54 extends through the adjacent gene (Fig 6B). Thus, these RNAs appear to be mRNAs with unusually long 5ʹ UTRs. A recent study identified an NtrC-activated σ54 promoter inside rlmD [20]. This promoter is an exact match to the one we identified, and drives transcription of the entire relA gene (adjacent to rlmD), consistent with our analysis.

To further investigate the intragenic σ54 binding sites within nagB and yqeC, we constructed strains with epitope tags fused to 3ʹ ends of nagE or yqeB. We then constructed derivatives of these strains with mutations in the σ54 binding site inside nagB, or yqeC, respectively (one silent change and one His → Lys codon change in nagB; two silent changes in yqeC; Fig 7A). We measured association of σ54 with the wild type and mutated sites using ChIP-qPCR. Our data indicate that mutating the putative binding sites greatly reduces binding of σ54, confirming that these are genuine σ54 binding sites (Fig 7B). The microarray data described above strongly suggested that each of these intragenic σ54 binding sites is a promoter for an mRNA for the downstream gene. To test this hypothesis, we used qRT-PCR to measure mRNA levels of the downstream gene for each putative promoter (nagE and yqeB) in wild type cells and cells in which the binding site is disrupted (Fig 7C). These data indicate that mutation of either σ54 binding site results in a large decrease in the mRNA level for the downstream gene. Lastly, we used Western blotting with an antibody specific to the epitope tags to measure NagE and YqeB protein levels in cells with wild type and mutant promoters. Consistent with the qRT-PCR data, mutation of either promoter resulted in a decrease in the protein level for the downstream gene (Fig 7D). In the case of NagE, the decrease in protein level was modest (~2-fold), whereas YqeB was undetectable in the promoter mutant. We conclude that the σ54 binding sites within nagB and yqeC represent promoters for nagE and yqeB, respectively, with the mRNAs having unusually long 5ʹ UTRs.

Conservation of σ54 binding sites suggests that many intragenic σ54 binding sites are functional
We speculated that other intragenic σ54 binding sites represent genuine promoters. We therefore compared each site across a range of bacterial species, mostly from the family Enterobacteriaceae. σ54 is well conserved across these species (e.g. 62% identical, 79% similar amino acid sequence between E. coli and V. cholerae), suggesting that it binds with similar DNA sequence specificity. Furthermore, ChIP-seq of σ54 in V. cholerae identified a very similar motif to the E. coli σ54 motif identified here (Fig 1B) [19], despite the two species having diverged >600 million years ago [40]. Therefore, we used a position weight matrix derived from our MEME analysis (Fig 1B) to score sequences, from other species, that correspond to homologous regions to those surrounding the 135 high stringency σ54 binding sites in E. coli. In some cases, no homologous region was identified. A summary of the conservation analysis is shown in Fig 8, and a complete list of conservation scores is shown in S5 Table. Our analysis indicated that, as a group, intergenic binding sites (Fig 8A) are better conserved than intragenic sites (Fig 8B). However, many intragenic σ54 binding sites are conserved, suggesting that these sites are functional. Importantly, the computationally determined motif score correlates well with in vivo binding of σ54 (Fig 8C): the Spearman’s Rank Correlation Coefficient for the “OS” class of binding site (intergenic, oriented towards a gene) is 0.67, and for the rest of the binding sites is 0.38.

Functional conservation of intragenic σ54 binding sites in Salmonella Typhimurium
The sequence-based phylogenetic analysis described above predicted that many of the σ54 sites we detected in E. coli are functionally conserved in Salmonella enterica. To test this prediction, we used ChIP-qPCR to measure association of σ54 with 14 sites in Salmonella enterica serovar Typhimurium that were predicted on the basis of sequence conservation. Only five of these sites are in the classical “outside sense” orientation (intergenic, oriented towards a gene). As a control, we performed ChIP-qPCR without antibody. In all cases, we detected robust association of σ54, dependent upon the presence of antibody in the ChIP (Fig 9). We conclude that many intragenic σ54 binding sites are functionally conserved in S. enterica. Moreover, these data validate the sequence-based predictions of conservation (Fig 8).

Discussion
A greatly expanded set of σ54 binding sites
Unlike members of the σ70 family, σ54 proteins can bind promoters, in the context of RNAP holoenzyme, in a transcriptionally inactive state. Therefore, while σ54-dependent transcription will only occur under conditions that activate the relevant bEBPs, the binding of σ54:RNAP holoenzyme to promoter DNA is not condition-dependent. Our work takes full advantage of this characteristic to map the σ54 promoters of the E. coli genome using ChIP-seq. In contrast, we reasoned that genome-wide expression levels of most σ54-transcribed genes are unlikely to differ in cells lacking σ54, since most bEBPs are inactive in standard growth media. This is supported by our RNA-seq analysis, which identified only 5 σ54-transcribed RNAs (Fig 5 and S4 Table), and by a genome-scale analysis of σ54 in V. cholerae [19]. Only 20 σ54 promoters have previously been experimentally validated in E. coli [26]. Using ChIP-seq, we have confirmed 19 of these and have vastly expanded the list of known σ54 binding sites to 135. Moreover, our ChIP-seq data analysis with a relaxed cut-off is consistent with >250 σ54 binding sites, based on those for which we identified a motif. Our data indicate that, for the conditions we used, σ54 binds most or all sites in the context of transcriptionally inactive RNAP holoenzyme (Figs 4 and 5). As discussed below, many of the novel sites are likely to be non-functional, but there is strong evidence that a substantial subset has conserved function.
In addition to the 19 previously described σ54 promoters verified by our work, we confirmed 15 predicted σ54 promoters. Our data are inconsistent with most of the previous predicted σ54 promoters [26]; false negatives due to the conditions we used are possible, but unlikely since σ54 is expected to bind all DNA sites under all growth conditions in which σ54 is expressed. We have also identified 8 novel σ54 binding sites in intergenic regions, close to an appropriately oriented gene (Table 1). This brings the total of canonical σ54 binding sites, i.e. those that are intergenic and likely to represent promoters for the downstream gene, to 42. The identities of these genes support a role for σ54 in transcribing genes involved in a wide range of cellular functions.
Extensive intragenic σ54 binding
The majority of the 135 high stringency σ54 binding sites we identified are located inside genes. Moreover, eight of the intergenic σ54 binding sites are located far (>300 bp) from the nearest appropriately oriented gene (Fig 3A). A recent ChIP-chip study of σ54 in Salmonella enterica also suggested the existence of intragenic binding sites, although the resolution of that study was at the level of whole genes due to the microarray design (PCR products for entire genes) [14]. A ChIP-seq study of σ54 in V. cholerae identified only 7 intragenic σ54 binding sites [19], suggesting that the function of σ54 in some species may be more restricted. This is consistent with our analysis of σ54 binding site conservation, which showed conservation of very few binding sites between E. coli and V. cholerae (Fig 8).
Only a few other alternative σ factors have been mapped using ChIP-chip or ChIP-seq [10,11,13,15,16,17,41,42], and in most cases the large majority of reported binding sites were intergenic. However, E. coli σ32, σ28, and Mycobacterium tuberculosis σF were reported to bind large numbers of intragenic sites [15,16,17,18]. In all three cases, a few intragenic binding sites were associated with transcription of RNAs that initiate inside a gene, sometimes in the antisense orientation [15,16,18].
Conservation of many intragenic σ54 binding sites suggests extensive biological function
Intragenic σ54 binding sites as a group have significantly lower σ54 occupancy, as measured by ChIP-seq, than intergenic binding sites (Mann Whitney U Test p < 1e-8). This suggests that many intragenic σ54 binding sites represent “biological noise”, binding sites created by chance due to sequence constraints imposed by other factors such as coding sequence. However, our data indicate that σ54 binding site function and the level of σ54 binding do not correlate well. For example, σ54 binding sites within nagB, rlmD and yqeC are associated with transcription of mRNAs (Figs 6 and 7) but have relatively low binding scores (Fold Above Threshold scores (see Methods) of 8, 2 and 7, respectively).
Our bioinformatic analysis indicates widespread sequence conservation of many intragenic σ54 binding sites (Fig 8), strongly suggesting important biological functions for these sites. In some cases, conservation is restricted to a few species. Nonetheless, even conservation solely in S. enterica, one of the closest relatives to E. coli that we analyzed, is a strong indication of function, since E. coli and S. enterica diverged from a common ancestor ~100 million years ago [43]. We compared the σ54 binding sites identified in our study to those identified by ChIP-chip in S. enterica [14]. Some predicted σ54 binding sites in S. enterica are shared with those in E. coli. In particular, 20 intergenic σ54 binding sites are common to both species (Table 1). Only six intragenic σ54 binding sites described in S. enterica correspond to genes for which we detected an intragenic site in E. coli (Table 2). However, this low degree of overlap is likely due to technical limitations of the ChIP-chip method on sensitivity and resolution. Indeed, many more of the σ54 binding sites that we identified in E. coli are conserved at the sequence level in S. enterica (Fig 8). Consistent with this, we detected association of σ54 with five such sites in S. enterica as well as four of the sites identified in the S. enterica ChIP-chip study (Fig 9). Thus, many σ54 binding sites are not only conserved between E. coli and S. enterica at the sequence level, but are also functionally conserved.
It is possible that conservation of some σ54 binding sites could be explained by sequence constraints imposed by the amino acid sequence of the overlapping protein, e.g. for the binding site within the highly conserved gene rpmJ. However, in many cases, the predicted level of σ54 binding is similar between species even though the DNA sequence changes. For example, changes can occur at positions that do not contribute to σ54 binding (e.g. position 9 in Fig 1B). To specifically address this question, we compared conservation of “important” bases within intragenic σ54 sites (i.e. those that rarely deviate from the consensus; positions 3, 4, 14, 15 and 16 in Fig 1B) to that of ‘unimportant” bases (i.e. those with low information content in the σ54 motif; positions 1, 8, 9, 10 and 12 in Fig 1B). If the σ54 binding site is the subject of positive selection, the unimportant bases should be less well conserved than the important bases, reflecting the sequence requirements for σ54 binding. In contrast, if selection is acting on the amino acid coding capacity in the region encompassing the σ54 binding site, the unimportant and important bases should be conserved to a similar degree. For each intragenic σ54 binding site in E. coli (Table 2), we selected all strong predicted sites (PSSM score >6; S5 Table) that are located at the equivalent position within homologous genes in other species. We then determined the number of times important base positions differed between E. coli and non-E. coli species (S6 Fig; note that we only analyzed positions for which the E. coli motif matched the consensus). Very few (35 out of a possible 1603) substitutions occurred at these important positions. This low frequency of substitution was expected since we selected only strong predicted σ54 sites. In contrast, we observed an 8.6-fold higher rate of substitution (309 out of a possible 1640) at unimportant positions (S6 Fig). We conclude that, in most cases, conservation of intragenic σ54 sites is limited to the important base positions, and that intragenic σ54 promoters are the target of positive selection rather than the surrounding protein-coding sequence.
Many intragenic σ54 binding sites likely represent promoters for mRNAs
The conditions used in our RNA-seq analysis are not associated with the activity of most E. coli bEBPs (Fig 5). Hence, it is not possible to use these data to identify those σ54 binding sites that represent promoters. Nonetheless, our analysis of published microarray data for nitrogen-rich and nitrogen-limiting conditions suggested three σ54 binding sites inside nagB, rlmD and yqeC, as promoters for mRNAs for nagE, relA and yqeB, respectively (Fig 6). Targeted mutations in the σ54 binding sites inside nagB and yqeC confirmed they are genuine promoters (Fig 7). In each case, the promoter drives transcription of an mRNA for the downstream gene, and the 5ʹ UTR is unusually long. The third σ54 binding site, that within rlmD, was recently described by another group as a promoter for the downstream gene, relA [20]. This mRNA also has an unusually long 5ʹ UTR. The functional importance of the three intragenic σ54 promoters identified thus far in E. coli is emphasized by their conservation in other species (Fig 8) [14].
The functions of RelA and NagE are consistent with regulation of their respective genes by NtrC. Transcription of relA under nitrogen-limiting conditions couples nitrogen stress to the stringent response [20]. NagE helps to scavenge nitrogen by importing N-acetyl-D-glucosamine 6-phosphate, which can be metabolized by NagA and NagB to yield nitrogen in the form of ammonium [26]. In contrast, there is no obvious connection between nitrogen starvation and YqeB, a putative selenium-dependent molybdenum hydroxylase [44].
It is striking that there is a significant enrichment for intragenic σ54 binding sites that are in the sense orientation relative to the overlapping gene (Fig 3A). In most cases, this places them in the sense orientation relative to the downstream gene. Furthermore, there is an enrichment for intragenic σ54 binding sites 360–760 bp upstream of the downstream gene (Fig 3B). All three of the confirmed RNAP:σ54-transcribed mRNAs that initiate inside genes have 5ʹ UTRs between 360 and 760 nt long. Together, these observations strongly suggest that many intragenic σ54 binding sites represent promoters for the downstream gene, and the corresponding mRNAs include 5ʹ UTRs that are between 360 and 760 nt long.
What is the functional significance of σ54-transcribed mRNAs that have long 5ʹ UTRs? In the case of mRNAs that initiate antisense to other genes, the σ54-transcribed mRNAs or the act of their transcription could regulate expression of the overlapping gene. Indeed, mRNAs with long 5ʹ UTRs that are antisense to adjacent genes have been described in Listeria monocytogenes, and have been proposed to regulate expression of the overlapping genes [45], and regulation by antisense RNAs through base-pairing interactions or by transcriptional interference has been extensively described [46,47]. For mRNAs with long 5ʹ UTRs that initiate inside genes in the sense orientation, the functional significance is less clear. However, our data suggest that 5ʹ UTR length may be important for control of translational efficiency. In the case of nagE, mRNA levels were greatly reduced by mutation of the σ54 promoter in nagB, but protein levels decreased only ~2-fold (Fig 7). This is consistent with the presence of a second, σ54-independent nagE mRNA that is more efficiently translated. We propose that the long 5ʹ UTRs of σ54-transcribed mRNAs allow for more extensive control of translation efficiency. An alternative function for the long 5ʹ UTRs of σ54-transcribed mRNAs is as regulators: regulation by an mRNA 5ʹ UTR has been recently described for an mRNA in Streptococcus mutans [48].
Other possible functions of intragenic σ54 binding sites
An alternative explanation for the overrepresentation of “sense” intragenic σ54 binding sites is that antisense binding sites interfere with transcription of the overlapping gene and are selected against. A recent study compared our list of σ54 binding sites with RNA-seq data for cells with or without rpoN [49]. This comparison suggested (i) competition between σ54 and other Sigma factors for binding to sites in intergenic regions, and (ii) regulation by RNAP:σ54 binding within genes. Our RNA-seq data are consistent with regulation by competition between Sigma factors at intergenic sites (Fig 5 and S4 Table), but we observed no effect of intragenic σ54 binding sites on expression of the overlapping gene (Fig 5 and S4 Table), effectively ruling out the possibility of roadblock repression. However, for the conditions used in our study, RNAP:σ54 bound at intragenic sites is not transcriptionally active (Fig 5). Hence, we cannot rule out transcriptional interference from active intragenic σ54 promoters.
Recent studies have identified many novel binding sites for transcription factors that are located far from gene starts [50,51,52,53,54]. Various functions have been suggested for non-canonical transcription factor binding sites, including acting as “decoys” to buffer the transcriptional response at regulatory targets [51,55], and mediating chromosome structure by forming long-range interactions with other DNA-bound transcription factors [56]. These are also possible functions of intragenic σ54 binding sites. We also propose that some intragenic σ54 binding sites are non-functional and thus represent biological noise. This is more likely for σ54 family members than σ70 family members since RNAP:σ54 requires a nearby bEBP in order to transcribe RNA. Genome-scale mapping of bEBP binding will be a powerful approach for distinguishing functional σ54 binding sites from non-functional sites since the likelihood of non-functional σ54 and bEBP binding sites being in close proximity is very low.
Materials and Methods
Strains and plasmids
All strains and plasmids used in this work are listed in S6 Table. All oligonucleotides used in this work are listed in S7 Table. E. coli MG1655 has been described previously [57]. Our laboratory version of MG1655 lacks an insertion element upstream of flhD, rendering the strain non-motile [18]. To generate E. coli MG1655ΔrpoN (RPB146), the ΔrpoN::kanR allele and flanking sequence was amplified by colony PCR using primers JW4588 and JW4589 from BW25113 ΔrpoN::kanR [58]. The PCR product was recombined into the chromosome of MG1655 ΔthyA containing plasmid pKD46 [59] by recombineering [60]. Following stable chromosomal integration and curing of pKD46, the kanR gene was resolved using with FLP-recombinase encoded on pCP20 and cured of the plasmid, as described previously [60]. Wild-type thyA was replaced at its native locus by P1 transduction from MG1655 (thyA+) with selection on M9 minimal medium lacking thymine.
Derivatives of MG1655 with C-terminally 3x FLAG-tagged NagE (RPB220) and YqeB (RPB232) were generated using FRUIT [59]. Promoter mutants within the nagB (RPB277) and yqeC (RPB279) genes were constructed in the context of RBP220 and RPB232, respectively, using FRUIT [59].
Salmonella enterica subspecies enterica serovar Tyhpimurium strain 14028s [61] was used for S. enterica ChIP-qPCR.
Plasmid pBAD24 has been described previously [62]. Plasmid pRpoN was created by colony PCR amplification of the E. coli rpoN gene with primers JW3439 and JW3440 and cloning of this product using the InFusion method (Clontech) into the NcoI restriction site of pBAD24.
Media and growth conditions
Cultures for ChIP-seq and RNA-seq were grown in M9 minimal media supplemented with 0.4% glycerol at 30°C with shaking (225 rpm) to mid-exponential phase (OD600 ~0.5). When necessary, the media was supplemented with 100 μg/mL ampicillin to select for plasmid retention. Arabinose was added to a final concentration of 0.2% for 10 minutes to strains carrying pRpoN or pBAD24 to induce over-expression of the rpoN gene, or as a negative control, respectively, for RNA-seq analysis. For analysis of intragenic promoter mutants under nitrogen limiting conditions (Fig 7), cultures were grown in Gutnick medium [63] at 30°C and supplemented with 2 mM NH4Cl. Cultures were harvested 60 minutes after growth ceased (nitrogen depleted), typically at an OD600 between 0.6 and 0.7. S. enterica cultures were grown in LB medium at 30°C to mid-log phase.
ChIP-seq
ChIP-seq libraries were constructed as previously described [13] using MG1655. σ54 and RNAP were immunoprecipitated using 5 μL anti-σ54 or 1 μL anti-β antibody (Neoclone), respectively. Libraries were sequenced using a HiSeq 2000 sequencer (Illumina; University at Buffalo Next Generation Sequencing Core Facility). Alignment of sequence reads and identification of enriched regions (“peaks”) in the ChIP-seq data were performed as previously described [18]. “Fold Above Threshold” (FAT) scores indicate relative enrichment of regions in the ChIP-seq data, with a value of 1 being the threshold used to call peaks. To identify low stringency peaks, we reduced the threshold values 5-fold.
RNA-seq
DNA-free RNA was prepared from two independent biological replicates of E. coli MG1655 ΔrpoN containing pBAD24 (RPB152) or pRpoN (RPB149), using the hot phenol method described previously [64]. rRNA was removed using the RiboZero kit (Epicentre) followed by preparation of strand-specific DNA libraries for Illumina sequencing using the ScriptSeq 2.0 kit (Epicentre). Libraries were sequenced as described above for ChIP-seq. Sequences were aligned to the E. coli MG1655 genome, and differences in expression between strains were determined using Rockhopper [65] with default settings.
σ54 binding site conservation analysis
To find E. coli rpoN corresponding motifs in other species, we first created a Position Specific Scoring Matrix (PSSM) based on the alignment of all motifs found in E. coli. The PSSM was calculated by importing the nucleotide frequencies from each position in the motif using PSSM-convert [66]. This matrix was used to score the relative level of conservation of putative motifs found in other genomes of interest. To assess if each particular motif present in E. coli is also present and conserved in other corresponding genomes, we first screened for motifs that were found inside coding genes in E. coli. For this, we extracted a 300 nt fragment from the E. coli genome, centered on the position of the motif. We used BLASTX [67] to find if the query genomes contain a homologous protein using an E-value cutoff of 1e-04 (turning off the low complexity filter). From the genome position of the top BLAST hit, we calculated the PSSM score at the exact location where the motif is found in E. coli as well as any other potential conserved motif at alternate positions 100 bp upstream to 100 bp downstream from the E. coli position. For motifs that are located in non-coding regions, we first used BLASTN with a 300 bp fragment from E. coli to screen for the presence of homologous regions in the query genomes. If no hits were discovered, we refined the search by taking the corresponding gene-encoding sequence downstream of the motif in E. coli, and used BLASTX to search for a homologous protein. We used the position of the top hit to locate the corresponding position of the motif upstream of the gene. We then calculated the PSSM score for the exact location and at alternate positions using the same strategy from the in-ORF motifs. Conservation scores for the motifs were displayed using TreeView [68].
σ54 binding site motif detection and positional analysis relative to ChIP-seq peaks
Motif enrichment analysis for ChIP-seq and ChIP-chip data was performed using MEME (default parameters for MEME-ChIP) [22,69]. For ChIP-seq data, 150 bp regions centered on the peak were used for MEME analysis. Centrimo (default parameters) was used to determine central enrichment of motifs [70]. Motif enrichment analysis for data from [28] was performed using MEME (default parameters for MEME-ChIP except that sequence was only searched on one strand) using regions 500 bp upstream of each gene.
Phylogenetic conservation analysis for specific positions within intragenic σ54 binding sites
For each E. coli intragenic σ54 binding site, we counted the number of differences at “important” positions (positions 3, 4, 14, 15 and 16 from Fig 1B) and unimportant positions (positions 1, 8, 9, 10 and 12 from Fig 1B) between the E. coli site sequence and the sequence of equivalent sites in other species where the non-E. coli site had a PSSM score >6 and was perfectly aligned in the BLAST analysis. We did not examine important positions where the E. coli site differed from the consensus (example shown in S6B Fig).
Analysis of RNAP occupancy at σ54 binding sites
RNAP (β) ChIP-seq sequence read counts were determined for the positions from -500 to +500 bp relative to each of the 135 high stringency σ54 ChIP-seq peaks (orientation defined by the associated σ54 binding site motif). All values were normalized to the value at position 0. “Median Occupancy Score” was calculated by determining the median value at each of the 1001 positions for all 135 high stringency σ54 ChIP-seq peaks. As a control we repeated this analysis using 135 randomly selected genome coordinates.
qRT-PCR
RNA was prepared from nitrogen-depleted cultures as described for RNA-seq. RNA was reverse transcribed using SuperScript III reverse transcriptase (Invitrogen) with 150 ng random hexamer, according to the manufacturer's instructions. A control reaction, omitting reverse transcriptase, was performed. 0.5% of the cDNA (or negative control) was used as a template in a quantitative real time PCR using an ABI 7500 Fast real time PCR machine, with appropriate primers (S7 Table). Expression levels in the mutant strains were determined relative to wild type and normalized to expression of a control gene (glnA).
Western blotting
Cell pellets from nitrogen-depleted cultures (1 mL) were resuspended in loading buffer based on OD600. Equal volumes were separated on a 4–20% acrylamide gradient gel (Bio-Rad). Proteins were transferred to PVDF membrane and probed with M2 mouse anti-FLAG antibody (Sigma; 1 in 2,000 dilution) or mouse anti-β’ antibody (Neoclone; 1 in 7,000 dilution), and HRP-conjugated goat anti-mouse antibody (1 in 10,000 dilution). Tagged proteins were visualized using the Clarity Western Substrate kit (Bio-Rad).
ChIP-qPCR
ChIP and input samples were prepared as previously described [64]. For validation of putative σ54 binding sites in E. coli (MG1655 and RPB146) and S. enterica (14028s), cells were grown in LB medium. For NtrC-activating conditions, cells were grown in Gutnick medium with 2 mM NH4Cl. 2 μL anti-σ54 antibody (Neoclone) was used for ChIP in all cases. A “no antibody” control was performed in parallel for S. enterica since an isogenic deletion of the rpoN gene was not available. Enrichment was measured by quantitative PCR (qPCR) using an ABI 7500 Fast real time PCR machine, with appropriate primers (S7 Table). Enrichment was calculated relative to a control region within the bglB gene for MG1655, or STM14_2479 for S. enterica, and normalized to values for input DNA. Occupancy units were calculated as background-subtracted, fold-enrichment. Relative σ54 occupancy at nagB and yqeC intragenic promoters (Fig 7B) was calculated as the ratio of occupancy units to the value for the glnA promoter.
Supporting Information
Zdroje
1. Gross CA, Chan C, Dombroski A, Gruber T, Sharp M, et al. (1998) The functional and regulatory roles of sigma factors in transcription. Cold Spring Harb Symp Quant Biol 63 : 141–155. 10384278
2. Wade JT, Struhl K (2004) Association of RNA polymerase with transcribed regions in Escherichia coli. Proc Natl Acad Sci USA 101 : 17777–17782. 15596728
3. Gruber T, Gross CA (2003) Multiple Sigma subunits and the partitioning of bacterial transcription space. Annu Rev Microbiol 57 : 441–466. 14527287
4. Wigneshweraraj S, Bose D, Burrows PC, Joly N, Schumacher J, et al. (2008) Modus operandi of the bacterial RNA polymerase containing the sigma54 promoter-specificity factor. Mol Microbiol 38 : 538–546.
5. Buck M, Cannon W (1992) Specific binding of the transcription factor sigma-54 to promoter DNA. Nature 358 : 422–424. 1641025
6. Shingler V (2011) Signal sensory systems that impact σ54-dependent transcription. FEMS Microbiol Rev 35 : 425–440. doi: 10.1111/j.1574-6976.2010.00255.x 21054445
7. Hunt TP, Magasanik B (1985) Transcription of glnA by purified Escherichia coli components: core RNA polymerase and the products of glnF, glnG, and glnL. Proc Natl Acad Sci USA 82 : 8453–8457. 2867543
8. Tsang J, Hoover TR (2014) Themes and Variations: Regulation of RpoN-Dependent Flagellar Genes across Diverse Bacterial Species. Scientifica 2014 : 681754. doi: 10.1155/2014/681754 24672734
9. Mittenhuber G (2002) An inventory of genes encoding RNA polymerase sigma factors in 31 completely sequenced eubacterial genomes. J Mol Microbiol Biotechnol 4 : 77–91. 11763973
10. Markel E, Butcher BG, Myers CR, Stodghill P, Cartinhour S, et al. (2013) Regulons of three Pseudomonas syringae pv. tomato DC3000 iron starvation sigma factors. Appl Environ Microbiol 79 : 725–727. doi: 10.1128/AEM.02801-12 23124242
11. Markel E, Maciak C, Butcher BG, Myers CR, Stodghill P, et al. (2011) An extracytoplasmic function sigma factor-mediated cell surface signaling system in Pseudomonas syringae pv. tomato DC3000 regulates gene expression in response to heterologous siderophores. J Bacteriol 193 : 5775–5783. doi: 10.1128/JB.05114-11 21840980
12. Myers KS, Yan H, Ong IM, Chung D, Liang K, et al. (2013) Genome-scale analysis of Escherichia coli FNR reveals complex features of transcription factor binding. PLoS Genet 9: e1003565. doi: 10.1371/journal.pgen.1003565 23818864
13. Singh S, Singh N, Bonocora RP, Fitzgerald DM, Wade JT, et al. (2014) Widespread suppression of intragenic transcription initiation by H-NS. Genes Dev 28 : 214–219. doi: 10.1101/gad.234336.113 24449106
14. Samuels DJ, Frye JG, Porwollik S, McClelland M, Mrázek J, et al. (2013) Use of a promiscuous, constitutively-active bacterial enhancer-binding protein to define the σ54 (RpoN) regulon of Salmonella Typhimurium LT2. BMC Genomics 14 : 602. doi: 10.1186/1471-2164-14-602 24007446
15. Wade JT, Roa DC, Grainger DC, Hurd D, Busby SJW, et al. (2006) Extensive functional overlap between Sigma factors in Escherichia coli. Nat Struct Mol Biol 13 : 806–814. 16892065
16. Hartkoorn RC, Sala C, Uplekar S, Busso P, Rougemont J, et al. (2012) Genome-wide definition of the SigF regulon in Mycobacterium tuberculosis. J Bacteriol 194 : 2001–2009. doi: 10.1128/JB.06692-11 22307756
17. Waldminghaus T, Skarstad K (2010) ChIP on Chip: surprising results are often artifacts. BMC Genomics 11 : 414. doi: 10.1186/1471-2164-11-414 20602746
18. Fitzgerald DM, Bonocora RP, Wade JT (2014) Comprehensive mapping of the Escherichia coli flagellar regulatory network. PLoS Genet 10: e1004649. doi: 10.1371/journal.pgen.1004649 25275371
19. Dong TG, Mekalanos JJ (2012) Characterization of the RpoN regulon reveals differential regulation of T6SS and new flagellar operons in Vibrio cholerae O37 strain V52. Nucleic Acids Res 40 : 7766–7775. doi: 10.1093/nar/gks567 22723378
20. Brown DR, Barton G, Pan Z, Buck M, Wigneshweraraj S (2014) Nitrogen stress response and stringent response are coupled in Escherichia coli. Nat Commun 5 : 4115. doi: 10.1038/ncomms5115 24947454
21. Kharchenko PV, Tolstorukov MY, Park PJ (2008) Design and analysis of ChIP-seq experiments for DNA-binding proteins. Nature Biotech 26 : 1351–1359.
22. Bailey TL, Elkan C (1994) Fitting a mixture model by expectation maximization to discover motifs in biopolymers. Proc Int Conf Intell Syst Mol Biol 2 : 28–36. 7584402
23. Teytelman L, Thurtle DM, Rine J, van Oudenaarden A (2013) Highly expressed loci are vulnerable to misleading ChIP localization of multiple unrelated proteins. Proc Natl Acad Sci USA 110 : 18602–18607. doi: 10.1073/pnas.1316064110 24173036
24. Park D, Lee Y, Bhupindersingh G, Iyer VR (2013) Widespread Misinterpretable ChIP-seq Bias in Yeast. PLoS One 8: e83506. doi: 10.1371/journal.pone.0083506 24349523
25. Jain D, Baldi S, Zabel A, Straub T, Becker PB (2015) Active promoters give rise to false positive 'Phantom Peaks' in ChIP-seq experiments. Nucleic Acids Res in press. doi: 10.1093/nar/gkv637 26117547
26. Keseler IM, Collado-Vides J, Gama-Castro S, Ingraham J, Paley S, et al. (2005) EcoCyc: a comprehensive database resource for Escherichia coli. Nucleic Acids Res 33: D334–337. 15608210
27. Zafar MA, Carabetta VJ, Mandel MJ, Silhavy TJ (2014) Transcriptional occlusion caused by overlapping promoters. Proc Natl Acad Sci USA 111 : 1557–1561. doi: 10.1073/pnas.1323413111 24474781
28. Zhao K, Liu K, Burgess RR (2010) Promoter and regulon analysis of nitrogen assimilation factor, σ54, reveal alternative strategy for E. coli MG1655 flagellar biosynthesis. Nucleic Acids Res 38 : 1273–1283. doi: 10.1093/nar/gkp1123 19969540
29. Cho BK, Kim D, Knight EM, Zengler K, Palsson BO (2014) Genome-scale reconstruction of the sigma factor network in Escherichia coli: topology and functional states. BMC Biol 12 : 4. doi: 10.1186/1741-7007-12-4 24461193
30. Berriz GF, King OD, Bryant B, Sander C, Roth FP (2003) Characterizing gene sets with FuncAssociate. Bioinformatics 19 : 2502–2504. 14668247
31. Boucher JC, Schurr MJ, Deretic V (2000) Dual regulation of mucoidy in Pseudomonas aeruginosa and sigma factor antagonism. Mol Microbiol 36 : 341–351. 10792721
32. Shearwin KE, Callen BP, Egan JB (2005) Transcriptional interference—a crash course. Trends Genet 21 : 339–345. 15922833
33. Ninfa AJ, Reitzer LJ, Magasanik B (1987) Initiation of transcription at the bacterial glnAp2 promoter by purified E. coli components is facilitated by enhancers. Cell 50 : 1039–1046. 3304660
34. Jovanovic G, Weiner L, Model P (1996) Identification, nucleotide sequence, and characterization of PspF, the transcriptional activator of the Escherichia coli stress-induced psp operon. J Bacteriol 178 : 1936–1945. 8606168
35. Reichenbach B, Göpel Y, Görke B (2009) Dual control by perfectly overlapping sigma 54 - and sigma 70 - promoters adjusts small RNA GlmY expression to different environmental signals. Mol Microbiol 74 : 1054–1070. doi: 10.1111/j.1365-2958.2009.06918.x 19843219
36. Cho BK, Zengler K, Qiu Y, Park YS, Knight EM, et al. (2009) The transcription unit architecture of the Escherichia coli genome. Nat Biotechnol 27 : 1043–1049. doi: 10.1038/nbt.1582 19881496
37. Zimmer DP, Soupene E, Lee HL, Wendisch VF, Khodursky AB, et al. (2000) Nitrogen regulatory protein C-controlled genes of Escherichia coli: scavenging as a defense against nitrogen limitation. Proc Natl Acad Sci USA 97 : 14674–14679. 11121068
38. Hopper S, Babst M, Schlensog V, Fischer HM, Hennecke H, et al. (1994) Regulated expression in vitro of genes coding for formate hydrogenlyase components of Escherichia coli. J Biol Chem 269 : 19597–19604. 8034728
39. Leonhartsberger S, Huber A, Lottspeich F, Böck A (2001) The hydH/G Genes from Escherichia coli code for a zinc and lead responsive two-component regulatory system. J Mol Biol 307 : 93–105. 11243806
40. Yamamoto T, Gojobori T, Yokota T (1987) Evolutionary origin of pathogenic determinants in enterotoxigenic Escherichia coli and Vibrio cholerae O1. J Bacteriol 169 : 1352–1357. 3546273
41. Blanka A, Schulz S, Eckweiler D, Franke R, Bielecka A, et al. (2014) Identification of the alternative sigma factor SigX regulon and its implications for Pseudomonas aeruginosa pathogenicity. J Bacteriol 196 : 345–356. doi: 10.1128/JB.01034-13 24187091
42. Bibb MJ, Domonkos A, Chandra G, Buttner MJ (2012) Expression of the chaplin and rodlin hydrophobic sheath proteins in Streptomyces venezuelae is controlled by σ(BldN) and a cognate anti-sigma factor, RsbN. Mol Microbiol 84 : 1033–1049. doi: 10.1111/j.1365-2958.2012.08070.x 22582857
43. Ochman H, Wilson AC (1987) Evolution in bacteria: evidence for a universal substitution rate in cellular genomes. J Mol Evol 26 : 74–86. 3125340
44. Haft DH, Self WT (2008) Orphan SelD proteins and selenium-dependent molybdenum hydroxylases. Biol Direct 3 : 4. doi: 10.1186/1745-6150-3-4 18289380
45. Wurtzel O, Sesto N, Mellin JR, Karunker I, Edelheit S, et al. (2012) Comparative transcriptomics of pathogenic and non-pathogenic Listeria species. Mol Syst Biol 8 : 583. doi: 10.1038/msb.2012.11 22617957
46. Georg J, Hess WR (2011) cis-antisense RNA, another level of gene regulation in bacteria. Microbiol Mol Biol Rev 75 : 286–300. doi: 10.1128/MMBR.00032-10 21646430
47. Thomason MK, Storz G (2010) Bacterial antisense RNAs: how many are there, and what are they doing? Annu Rev Genet 44 : 167–188. doi: 10.1146/annurev-genet-102209-163523 20707673
48. Liu N, Niu G, Xie Z, Chen Z, Itzek A, et al. (2015) The Streptococcus mutans irvA gene encodes a trans-acting riboregulatory mRNA. Mol Cell 57 : 179–190. doi: 10.1016/j.molcel.2014.11.003 25574948
49. Schaefer J, Engl C, Zhang N, Lawton E, Buck M (2015) Genome wide interactions of wild-type and activator bypass forms of σ54. Nucleic Acids Res in press. doi: 10.1093/nar/gkv597 26082500
50. Bonocora RP, Fitzgerald DM, Stringer AM, Wade JT (2013) Non-canonical protein-DNA interactions identified by ChIP are not artifacts. BMC Genomics 14 : 254. doi: 10.1186/1471-2164-14-254 23586855
51. Göpel Y, Görke B (2014) Lies and deception in bacterial gene regulation: the roles of nucleic acid decoys. Mol Microbiol 92 : 641–647. doi: 10.1111/mmi.12604 24707963
52. Shimada T, Ishihama A, Busby SJ, Grainger DC (2008) The Escherichia coli RutR transcription factor binds at targets within genes as well as intergenic regions. Nucleic Acids Res 36 : 3950–3955. doi: 10.1093/nar/gkn339 18515344
53. Galagan J, Lyubetskaya A, Gomes A (2013) ChIP-Seq and the Complexity of Bacterial Transcriptional Regulation. Curr Top Microbiol Immunol 363 : 43–68. doi: 10.1007/82_2012_257 22983621
54. Galagan JE, Minch K, Peterson M, Lyubetskaya A, Azizi E, et al. (2013) The Mycobacterium tuberculosis regulatory network and hypoxia. Nature 499 : 178–183. doi: 10.1038/nature12337 23823726
55. Plumbridge J, Bossi L, Oberto J, Wade JT, Figueroa-Bossi N (2014) Interplay of transcriptional and small RNA-dependent control mechanisms regulates chitosugar uptake in Escherichia coli and Salmonella. Mol Microbiol 92 : 648–658. doi: 10.1111/mmi.12573 24593230
56. Qian Z, Dimitriadis EK, Edgar R, Eswaramoorthy P, Adhya S (2012) Galactose repressor mediated intersegmental chromosomal connections in Escherichia coli. Proc Natl Acad Sci U S A 109 : 11336–11341. doi: 10.1073/pnas.1208595109 22733746
57. Blattner FR, Plunkett G III, Bloch CA, Perna NT, Burland V, et al. (1997) The complete genome of Escherichia coli K-12. Science 277 : 1453–1474. 9278503
58. Baba T, Ara T, Hasegawa M, Takai Y, Okumura Y, et al. (2006) Construction of Escherichia coli K-12 in-frame, single-gene knockout mutants: the Keio collection. Mol Syst Biol 2 : 0008. 16738554
59. Stringer AM, Singh N, Yermakova A, Petrone BL, Amarasinghe JJ, et al. (2012) FRUIT, a scar-free system for targeted chromosomal mutagenesis, epitope tagging, and promoter replacement in Escherichia coli and Salmonella enterica. PLoS One 7: e44841. doi: 10.1371/journal.pone.0044841 23028641
60. Datsenko KA, Wanner BL (2000) One-step inactivation of chromosomal genes in Escherichia coli K-12 using PCR products. Proc Natl Acad Sci USA 97 : 6640–6645. 10829079
61. Jarvik T, Smillie C, Groisman EA, Ochman H (2010) Short-term signatures of evolutionary change in the Salmonella enterica serovar Typhimurium 14028 genome. J Bacteriol 192 : 560–567. doi: 10.1128/JB.01233-09 19897643
62. Guzman L-M, Belin D, Carson MJ, Beckwith JR (1995) Tight regulation, modulation, and high-level expression by vectors containing the arabinose PBAD promoter. J Bacteriol 177 : 4121–4130. 7608087
63. Gutnick D, Calvo JM, Klopotowski T, Ames BN (1969) Compounds which serve as the sole source of carbon or nitrogen for Salmonella typhimurium LT-2. J Bacteriol 100 : 215–219. 4898986
64. Stringer AM, Currenti SA, Bonocora RP, Petrone BL, Palumbo MJ, et al. (2014) Genome-Scale Analyses of Escherichia coli and Salmonella enterica AraC Reveal Non-Canonical Targets and an Expanded Core Regulon. J Bacteriol 196 : 660–671. doi: 10.1128/JB.01007-13 24272778
65. McClure R, Balasubramanian D, Sun Y, Bobrovskyy M, Sumby P, et al. (2013) Computational analysis of bacterial RNA-Seq data. Nucleic Acids Res 41: e140. doi: 10.1093/nar/gkt444 23716638
66. Klucar L, Stano M, Hajduk M (2010) phiSITE: Database of Gene Regulation in Bacteriophages. Nucleic Acids Res 38: D366–D370. doi: 10.1093/nar/gkp911 19900969
67. Altschul SF, Gish W, Miller W, Myers EW, Lipman DJ (1990) Basic local alignment search tool. J Mol Biol 215 : 403–410. 2231712
68. Eisen MB, Spellman PT, Brown PO, Botstein D (1998) Cluster analysis and display of genome-wide expression patterns. Proc Natl Acad Sci U S A 95 : 14863–14868. 9843981
69. Machanick P, Bailey TL (2011) MEME-ChIP: motif analysis of large DNA datasets. Bioinformatics 27 : 1696–1697. doi: 10.1093/bioinformatics/btr189 21486936
70. Bailey TL, Machanick P (2012) Inferring direct DNA binding from ChIP-seq. Nucleic Acids Res 40: e128. 22610855
71. Muse WB, Bender RA (1998) The nac (nitrogen assimilation control) gene from Escherichia coli. J Bacteriol 180 : 1166–1173. 9495755
Štítky
Genetika Reprodukční medicínaČlánek vyšel v časopise
PLOS Genetics
2015 Číslo 10
- Kazuistika – Perspektivy využití precizované medicíny v rámci personalizované specifické terapie onkologických pacientů
- Nobelova cena za chemii pro genetické nůžky: Objev, který změní naši budoucnost?
- Technologie na bázi RNA v klinické praxi: od přebarvených petúnií k terapii vzácných a dosud jen obtížně léčitelných chorob u lidí
- „Nepředstavovali jsme si, že náš výzkum povede přímo ke vzniku nových léků, dokonce ještě za našeho života“
- Bezplatné služby pro diagnostiku ATTRv amyloidózy pro kardiology
Nejčtenější v tomto čísle
- Single Strand Annealing Plays a Major Role in RecA-Independent Recombination between Repeated Sequences in the Radioresistant Bacterium
- The Rise and Fall of an Evolutionary Innovation: Contrasting Strategies of Venom Evolution in Ancient and Young Animals
- Genome Wide Identification of SARS-CoV Susceptibility Loci Using the Collaborative Cross
- DCA1 Acts as a Transcriptional Co-activator of DST and Contributes to Drought and Salt Tolerance in Rice
Zvyšte si kvalifikaci online z pohodlí domova
Mazová zátka a její řešení
nový kurzVšechny kurzy