
CD39/Adenosine Pathway Is Involved in AIDS Progression
HIV-1 infection is characterized by a chronic activation of the immune system and suppressed function of T lymphocytes. Regulatory CD4+ CD25high FoxP3+CD127low T cells (Treg) play a key role in both conditions. Here, we show that HIV-1 positive patients have a significant increase of Treg-associated expression of CD39/ENTPD1, an ectoenzyme which in concert with CD73 generates adenosine. We show in vitro that the CD39/adenosine axis is involved in Treg suppression in HIV infection. Treg inhibitory effects are relieved by CD39 down modulation and are reproduced by an adenosine-agonist in accordance with a higher expression of the adenosine A2A receptor on patients' T cells. Notably, the expansion of the Treg CD39+ correlates with the level of immune activation and lower CD4+ counts in HIV-1 infected patients. Finally, in a genetic association study performed in three different cohorts, we identified a CD39 gene polymorphism that was associated with down-modulated CD39 expression and a slower progression to AIDS.
Published in the journal:
. PLoS Pathog 7(7): e32767. doi:10.1371/journal.ppat.1002110
Category:
Research Article
doi:
https://doi.org/10.1371/journal.ppat.1002110
Summary
HIV-1 infection is characterized by a chronic activation of the immune system and suppressed function of T lymphocytes. Regulatory CD4+ CD25high FoxP3+CD127low T cells (Treg) play a key role in both conditions. Here, we show that HIV-1 positive patients have a significant increase of Treg-associated expression of CD39/ENTPD1, an ectoenzyme which in concert with CD73 generates adenosine. We show in vitro that the CD39/adenosine axis is involved in Treg suppression in HIV infection. Treg inhibitory effects are relieved by CD39 down modulation and are reproduced by an adenosine-agonist in accordance with a higher expression of the adenosine A2A receptor on patients' T cells. Notably, the expansion of the Treg CD39+ correlates with the level of immune activation and lower CD4+ counts in HIV-1 infected patients. Finally, in a genetic association study performed in three different cohorts, we identified a CD39 gene polymorphism that was associated with down-modulated CD39 expression and a slower progression to AIDS.
Introduction
HIV-1 infection is characterized by chronic immune activation which, in combination with the progressive depletion of CD4+ T cells, profoundly perturbs antigen-specific T cell responses [1]. The population of CD4+CD25high FoxP3+ regulatory T cells (Treg) suppresses antigen-specific T cell responses and controls inappropriate or exaggerated immune activation induced by pathogens, thereby influencing the outcome of various infections [2], [3]. In particular, these cells suppress in vitro HIV-1-specific CD4+ and CD8+ effector T-cell responses [2], [4]. We, and others, have reported an HIV-1-driven expansion of Treg expression in chronic and acute HIV-1 infection [5], [6], including a relationship between the expansion of Treg, the level of cellular immune activation and the depletion of CD4+ T cells in acute HIV infection [5].
The molecular mechanisms by which Treg mediate their suppressive activity remain poorly understood. In humans, the Treg population exhibits considerable diversity. Phenotypically and functionally distinct subsets of Treg can mediate suppression through distinct mechanisms from secretion of IL-10, TGF-ß, IL-35, Granzyme B, perforin, to CTLA-4 and GITR interactions [7], [8], [9]. Recently, it has been reported that CD39 is expressed on human and murine Treg, while CD73 is found only on the surface of murine Treg [10], [11], [12]. CD39, a member of the ectonucleotidase triphosphate diphosphohydrolase family (ENTPD), also referred to as ENTPD-1 (EC 3.6.1.5), is the dominant immune system ectonucleotidase that hydrolyses extracellular ATP and adenosine diphosphate (ADP) into adenosine monophosphate (AMP) at the sites of immune activation. CD73 is an ecto-5′-nucleotidase (5′NT) that exists in a soluble or membrane-bound form and catalyzes the dephosphorylation of AMP to adenosine [13], [14], [15]. Adenosine is a critical regulator of innate and adaptive immune responses [16], [17], inhibiting T lymphocyte proliferation and the secretion of inflammatory cytokines including IL-2, TNFa, and IFN-γ [13], [14], [15]. These effects are mediated through A2A receptors stimulating the generation of cAMP, and are mimicked by adenosine agonists [18]. CD39 has also been described as an activation marker of lymphoid cells [19]. Therefore, the CD39/Adenosine pathway may be important to the balance between activation and regulation of effector immune responses.
Here we tested the hypothesis that the CD39/adenosine pathway is involved in the pathogenesis of HIV-1 disease. First, we investigated the phenotype and the function of Treg-expressing CD39 molecules in a cohort of chronically HIV-positive patients and determined whether these characteristics are associated with clinical outcomes. Second, to assess our hypothesis in an in vivo context, we investigated whether CD39 genetic polymorphisms were associated with rates of HIV-1 disease progression in three independent cohorts.
Results
CD4+CD25high Treg, but not CD4+CD25low activated T cells, from HIV-positive subjects express high density of cell membrane CD39 molecules
In order to discriminate between Treg and activated T cells, we further characterized Treg population as gated T cells expressing CD4+CD25high FoxP3+high and CD127low (gating strategy is shown in Fig. S1). These cells are designated thereafter as Treg cells while CD4+CD25lowCD127high T cells are designated as activated CD4+CD25low T cells (T act). First, we confirmed a significant increase in the percentages of Treg cells in a cohort of HIV-positive individuals, receiving either a combination of antiretroviral drugs (c-ART+, n = 39) or not (c-ART−, n = 39), as compared to healthy controls (n = 25) (mean 5.8% and 6.2% respectively vs 2.4%, P<0.0001) (Fig. 1a). As shown in Fig. 1b and 1c, percentages of Treg expressing CD39+ (Treg CD39+) were significantly higher in both c-ART+ and c-ART − patients, as compared to healthy controls (mean 2.79% and 2.26% vs 0.97%, P<0.001, Fig. 1b). Moreover, Treg from both c-ART − and c-ART+ subjects expressed a higher density of CD39 molecules as compared to those from HIV-1 negative controls (mean fluorescence intensity (MFI) 1327 and 1203, respectively, vs. 652, P<0.001 and P<0.01) (Fig. 1c).

Phenotypic analyses were performed in 16 HIV-1 positive patients before and 12 months following c-ART initiation. Among them, 9 patients experienced a good response to c-ART (group A; undetectable plasma viral load at month 12), while in 7 patients (group B) viral replication remained detectable (above 50 copies/ml). No significant decrease of CD39 expression was observed in group A: % Treg CD39+ (mean ± SD): 2.4±1.2 vs.1.8±1.0 at baseline; TregCD39+ MFI (mean ± SD): 1557±360 vs. 1261±656 at baseline, (P>0.05 for both). Moreover, in patients with on-going viral replication %Treg CD39+ increased significantly in spite of ART (6.1±2.4 versus 3.4±2.3 at baseline; P = 0.043).
CD39 has also been described as an activation marker of lymphoid cells [19]. Therefore, we looked at the percentages of Tact in HIV-1 positive patients and controls. As expected, the frequency of activated CD4+CD25low T cells was significantly higher in both populations of patients as compared to controls (Fig.S1b). Consequently, percentages of CD4+CD25lowCD39+ were significantly higher in HIV-1 positive patients as compared to controls (Fig.S1c). In contrast to Treg, CD4+CD25 − T cells from both HIV-positive subjects and controls did not express CD39 (not shown). Thus, an expansion of CD39+CD4+ T cells in both Treg and T act T cell populations, which persist in patients with controlled viral load under c-ART, is observed in HIV-1 positive patients. In HIV-positive subjects and in HIV-negative controls, Treg cells were mostly of CD45RA−CD28+ memory phenotype (mean 75%). CD45RA−CD28+ Treg contained a higher percentage of CD39+ cells as compared to CD45RA+CD28+ Treg cells (mean 65% vs. 28%, respectively, P<0.05) (Fig. S2).
Down-modulation of CD39 expression on Treg relieves Treg-mediated inhibition of CD8 T cell proliferation and HIV specific responses
We next investigated whether down-modulation of the CD39 enzyme can impact Treg function. First, by exposing cells to a blocking anti-CD39 (BY40) mAb, we induced a down-modulation of CD39 expression at the surface of the YT2C2 NK line cells (Fig. S3a). Next, BY40 mAb down-modulated the expression of CD39 on ex-vivo purified peripheral blood Treg from HIV-negative controls as compared to untreated cells or cells treated with an IgG1 control mAb (% of positive cells (mean ± SD): 32±11% vs 44±13%, and 42±14%, respectively) (Fig. 2a,b). In these experiments, CD39 expression following in vitro incubation with BY40 mAb was assessed using a commercial PE anti-CD39 (clone TU66) which has been previously checked to be non-competitive with BY40 (Fig. S4). Finally, we found that this down modulation effect of BY40 was associated with decreased CD39 ATPase activity on primary monocytes (Fig. S3b).

The functional consequences of CD39 down-modulation were investigated in co-culture assays developed to evaluate the suppressive effects of Treg on T cell proliferation [5], [6], [20]. As shown in Fig. 3a and b (for one representative experiment and pooled data from 6 HIV-positive subjects), the Treg-mediated inhibition of anti-CD3 induced CD8 T cell proliferation was significantly higher in HIV-positive subjects (n = 6) as compared to HIV-negative controls (n = 6), (mean inhibition 56% vs 22.5%; P<0.01) (Fig. 3b). Pre-incubation with anti-CD39 BY40 mAb reversed by ∼50% the suppressive effect of Treg from HIV-positive subjects (average suppression rate of 28% in the presence of Treg pre-treated with BY40 as compared to 56% and 57% for Treg pre-treated or not with IgG1 control mAb, (P = 0.01; one-way ANOVA and paired T-test P = 0.01 for group by group comparisons). Interestingly, although the suppression mediated by Treg from HIV-negative controls was less significant, a similar effect of anti-CD39 BY40 mAb was noted (average inhibition 12.3% as compared to 22.5%, one-way ANOVA P<0.01 and paired T-test P<0.01). These results are in accordance with the higher density of CD39 molecules expressed by Treg from HIV-positive subjects and indicate that this enzyme is involved, at least in part, in the Treg-mediated inhibition of CD8+ T cell proliferation.

Next, we evaluated the effects of Treg on the cytokine production of CD8 T cells in response to HIV-1 antigens. Cytokine production (IFN-γ, TNFα and IL-2) of CD8-gated T cells was analyzed by intra cytoplamic staining and flow cytometry after overnight stimulation with a pool of whole Gag 15mer peptides (2 µg/ml). As shown in Fig. 4, the percentages (mean ± SD) of CD8+ Cytokines+ T cells were 2.1+/−0.7% vs. 3.3%+/−1% (n = 5) in the presence of Treg and CD4+CD25 − respectively (P = 0.05). Pre-incubation of Treg with anti-CD39 mAbs, but not with isotype control, relieved this suppressive effect: 3.2+/−0.8%, (P = 0.05).

Together, these results indicate that CD39 enzyme participates in the Treg-mediated suppression on CD8 T cell proliferation and responses to HIV peptides.
T cells from untreated HIV-positive subjects are more susceptible to CD39/adenosine mediated inhibition due to increased expression of A2A receptor
To further investigate the involvement of CD39/adenosine in the Treg-mediated inhibition of CD8+ T cell proliferation in HIV-1 positive subjects, we studied the effects of the A2AR agonist CGS21680 on proliferation of anti-CD3 stimulated T cells. The mean (±SD) inhibition of CD4+ T cells was 47% (±11) and 57% (±8.3) in the presence of 0.1 and 1 mM of CGS, respectively in c-ART − HIV positive patients. Similarly, the same doses of CGS inhibited by 47% and 65% the proliferation of anti-CD3 activated CD8+ T cells from c-ART − HIV-positive subjects (P<0.05) (Fig. 5a,b). In contrast, the proliferation of CD4+ and CD8+ T cells from HIV-negative controls and c-ART+ HIV-positive subjects was much lower and below 20% at the highest dose of CGS21680 (1 mM) (Fig. 5a,b) (P = 0.015 and P = 0.027 respectively; one-way ANOVA and P<0.05 unpaired T-test for comparison between c-ART−HIV-positive patients and the two other groups (Fig. 5a,b).

In accordance with this, we found that both CD4+ and CD8+ purified T cells from c-ART − HIV-positive subjects (n = 7) expressed a significantly higher level of A2AR mRNA than c-ART+ subjects (n = 5) or HIV-negative controls (n = 6) (Fig. 5c).
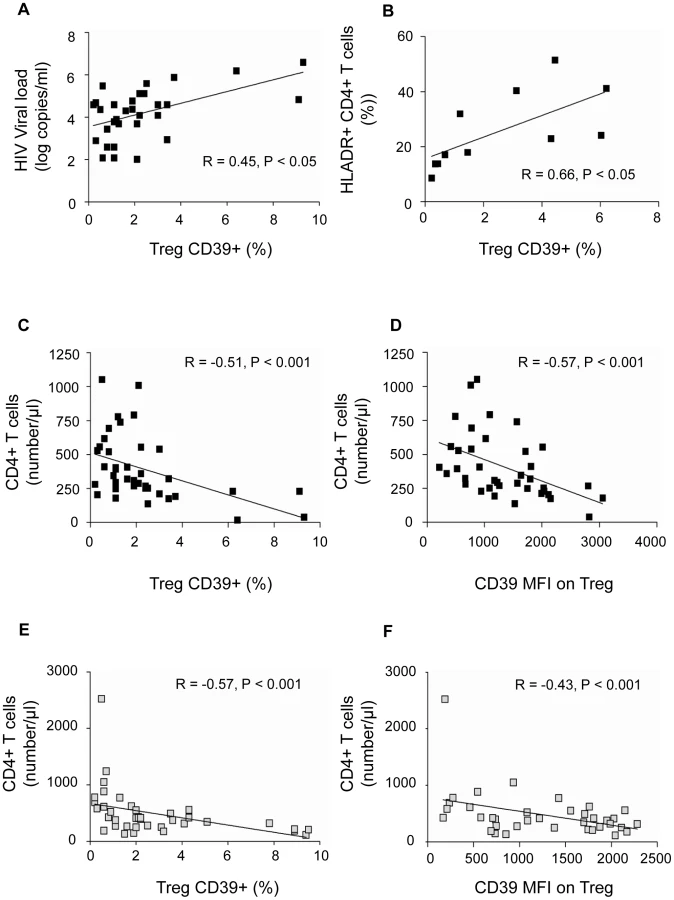
Expansion of Treg CD39+ correlates directly with immune activation and inversely with CD4+ T cell absolute counts in HIV-positive subjects
Since the HIV-positive subjects we studied were heterogeneous in terms of disease duration and clinical stage, we assessed whether CD39 expression correlated with established markers of disease progression. The frequency of the Treg CD39+ subset correlated directly with plasma HIV-1 viral load in the group of c-ART − subjects (P<0.05, R = 0.45) (Fig. 6a). Moreover, the percentage of Treg CD39+ subset correlated directly with the activation of CD4+ T cells in c-ART − subjects, assessed by the percentage of CD4+HLA-DR+ (P<0.05, R = 0.66) (Fig. 6b). Finally, the percentage of Treg CD39+ cells and CD39 MFI correlated inversely with absolute CD4+ T cell count in c-ART − subjects (P<0.001, R = −0.51 and P<0.001, R = −0.57, respectively) (Fig. 6 c,d) as well as in c-ART+ subjects (P<0.001 , R = −0.57 and P<0.01, R = −0.43) (Fig. 6 e,f).
The independent prognostication value of CD39 expression on Treg for CD4 T cell counts was studied in c-ART − and in c-ART+ patients, using multiple linear regression models (SPSS v.17.0). The frequencies of Treg, Treg CD39+, Tact, Tact CD39+, and viral load (for c-ART − group only) were included as predictors of CD4 absolute count. For c-ART+HIV-positive patients, in a full model (R2 = 0,398, ANOVA P = 0.02) the percentage of Treg CD39+ had the most important partial predictive effect (partial correlation coefficient −0.479), confirmed by sequential multiple regression analysis of the same set of variables (partial correlation coefficient −0.612 vs. 0.360 for Tact, ANOVA P = 0.001).
For c-ART−HIV-positive patients, in a full model (R2 = 0,392, ANOVA sig. = 0.045), again the percentage of TregCD39+ had the most important contribution as predictor for CD4 absolute count, followed by CD39Tact (partial correlation coefficients −0.375, and 0. 265 respectively).
These results indicate that the frequency of Treg CD39+ is an independent predictive factor for CD4 cell count variability.
A genetic variant of CD39 associated with a lower gene expression is involved in slower progression to AIDS
Our results highly suggest that the frequency of Treg CD39+ cells, as well as the density of the enzyme molecule at the surface of those cells, predict disease progression. Recently, CD39 gene polymorphisms associated with the level of enzyme expression have been shown to be associated with susceptibility to Crohn's disease [21]. In order to assess the role of CD39 on HIV-1 disease progression, we investigated whether CD39 gene polymorphisms could be associated with clinical outcomes. For that, we exploited the GRIV cohort, comprising subjects exhibiting extreme profiles of AIDS progression (LTNP, long-term non-progressors and RP, rapid progressors) [20], [22], [23]. We thus performed a genetic case-control association study on the candidate gene CD39 using the genotype data collected from our previous genome-wide association studies [22], [23] (see Methods).
Fourteen SNPs were identified in the CD39 gene. No polymorphism was significantly associated with rapid progression, whereas four SNPs were significantly associated with LTNP: rs10882665 (P = 1.33×10⁻²), rs3181123 (P = 1.38×10⁻²), rs1933166 (P = 1.76×10⁻²), and rs11188513 (P = 3.60×10⁻²) (Fig. S5). Of note, rs10882665 and rs3181123 are in full linkage disequilibrium (r2 = 1). To eliminate a potential association with HIV-1 infection rather than with LTNP, we compared the allelic frequency of each of these SNPs in the RP population. The frequency observed in the RP group was similar to the frequency observed in the control group, confirming that this was an association with LTNP.
To confirm these results, we used two additional independent Caucasian cohorts that examined AIDS progression phenotype: the ACS and the MACS cohorts (see Methods). The rs11188513 SNP (whose frequency in LTNP and control groups were, respectively, 39% and 34%, P = 3.60×10⁻², (Fig. 7a) was the only polymorphism also associated with disease progression both in ACS (P = 2.64×10⁻²) and MACS (P = 2.07×10⁻²) (Fig. 7b,c and Table S1). The P values compute the probability that an association is due to chance and the combined P value for rs11188513 over the three cohorts was significant after Bonferroni corrections, P = 6.11×10⁻³. Importantly, as shown in Fig. 7, the rs11188513-C allele favoured slower progression of HIV infection in all three cohorts. This association was independent from the CCR5 polymorphisms (P1 and Delta32) also located in chromosome 3, since the p value was not modified by using the CCR5 variants as covariates.

To further explore this association, we examined the Genevar [24] and the Dixon [25] mRNA expression databases, and found a correlation (P = 3.26×10⁻⁵ and P = 1.9×10⁻¹⁴, respectively) between the rs11188513-C allele and lower expression of the CD39 gene. Thus, the genetic association study combined with the mRNA expression database information demonstrate that the rs11188513-C allele is associated both with a slower progression to AIDS and with a lower expression of CD39 gene.
Discussion
We show here the involvement of the CD39/adenosine pathway in the Treg-mediated suppressive effect on HIV-1-infected subjects' T cell functions. We demonstrate that HIV-positive subjects exhibit both a higher frequency of Treg CD39+ and a higher in vitro sensitivity of effector T cells to the suppressive effect of adenosine, due to a higher expression of its predominant A2A receptor. Expansion of Treg CD39+ correlates inversely with CD4 T cell counts in HIV infection independently of plasma viral loads and T cell activation. Finally, in a genetic association study conducted in three different HIV-positive cohorts we show that the level of CD39 gene expression can indeed impact the course of disease progression.
Recent data have shown that mouse Treg constitutively express CD39 [26], while the proportion of Treg CD39+ cells appears highly variable in healthy human controls [10]. Therefore, in contrast to mice, CD39 expression might delineate a subpopulation of human Treg [10], [27]. However, studies on human Treg CD39+ cells are scarce. Few studies have analyzed the expression of CD39 in HIV disease [28]. Leal et al. have shown an increased nucleotidase activity related to enhanced CD39 expression on lymphocytes of HIV-positive subjects [28]. More recently, and in accordance with results presented here, an increase in the frequency of Treg expressing CD39 has been shown in different cohorts of HIV infected patients [29]. However, these observations warrant further investigations on the role of CD39 and the clinical relevance of these findings. Our results reinforce these observations and provide new insights about the biological mechanisms involving the CD39/adenosine axis. The demonstration that blocking of CD39 with BY40 mAb relieved, although not completely, the suppressive effect of Treg on effector T cells opens the way to new therapeutic interventions aimed to modulate Treg functions [29]. Moreover, we found that Treg CD39+ inhibit cytokine production by HIV-specific CD8 T cells, an effect partially relieved by pre-incubation of Treg CD39+ with anti-CD39 mAb. These results demonstrate that CD39 enzymatic pathway is responsible, at least in part, for the inefficiency of CD8 T cells responses in chronic HIV-1 infection. In contrast, the CD39 pathway seemed to be less predominant in coculture studies performed with cells purified from HIV negative controls. However, we cannot rule out that down-modulation of CD39 enzymatic activity may also interfere with other suppressive pathways.
Our results are similar to those reported in cancer and HIV patients in whom the purified Treg CD39+ subset mediated a higher suppression as compared to control patients [27]. From a clinical stand-point, it is interesting to note the persistence of a higher frequency of Treg CD39+ cells in HIV-positive subjects with controlled viral load, as compared to HIV-negative controls. Likely, this may reflect ongoing chronic immune activation. We show here that the frequency of TregCD39+ is correlated positively to the percentages of activated CD4+ T cells expressing HLA-DR (Fig. 6b) and a higher frequency of conventional T cells (CD4+CD25−) expressing CCR5 (not shown) which may partly explain CD4+ T cell depletion. Alternatively, since the Treg CD39+ subset is mostly confined to the memory CD4 T cell compartment, this population may represent HIV-inducible Treg, as previously reported [5], [6]. Recently, an expansion of suppressive FoxP3+CD39+ CD8 regulatory T cells associated with poor antiviral response has been reported in HIV-infected patients [30]. In our study, we have checked that expression of CD39 molecule on other blood subsets (B, NK and monocytes) did not vary significantly between patients' groups (Fig S6).
Altogether these results support the conclusion that the Treg subset expressing a high density of both CD25 and CD39 molecules represents a highly-enriched population of suppressor T cells in HIV-1 infected patients.
Adenosine is formed in tissue microenvironments under inflammatory insult [16], [31], [32], [33]. Several studies have shown that adenosine plays an important non-redundant role in the regulation of T cell activation [18], [34], [35]. Using the dose-dependant inhibitory effect of the adenosine receptor agonist CGS21680 [18], we confirmed the involvement of CD39/adenosine pathway in the Treg-mediated inhibition of T cell proliferation in HIV-1 infected patients. It is noteworthy that CD39/adenosine inhibition affected both CD8 and CD4 T cells, and was significantly more important in c-ART-naïve HIV positive subjects. This latter difference was due to a significantly higher level of A2AR expression. We found that CGS21680 did not inhibit the proliferation of T cells from c-ART treated patients. However, as we did not evaluate CGS21680 effects on other T cell functions, we cannot rule out that A2AR agonists may also impair T cell cytotoxicity and production of cytokines such as IL-2 and IFN-g rather than cell proliferation, as recently demonstrated [36], [37].
Our data provide clues to the suppressive mechanisms of Treg in the context of chronic immune activation. CD39 expression by Treg is important for the extracellular removal of ATP and allows Treg infiltration of inflamed tissues, resulting in an increase of local extracellular adenosine concentration by ATP catabolism [11], [38]. Extracellular ATP depletion may also increase Treg survival and favour the local accumulation of Treg, since high levels of ATP have been shown to be a pro-apoptotic factor [39], [40]. On the other hand, this microenvironment represents a self-protective mechanism against immune attacks [16], [41] by inducing a rapid tolerization of activated cells, as demonstrated in cancer models [42]. Recent data in a mice model has shown that tissue-derived adenosine promotes peripheral tolerance by inducing T cell anergy and Treg differentiation [37]. Altogether, these studies show that initiation of T cell activation in inflamed tissue and/or tumour microenvironments might result in the induction of T cell unresponsiveness by an A2AR-dependent mechanism. These observations may explain the reports of HIV infection in which Treg coexist in tissues infiltrated with HIV-specific T cells that are poorly capable of controlling local HIV replication [43], [44]. Of note, our study was limited to peripheral blood. Whether, the involvement of CD39/adenosine pathway plays also a key role in secondary lymphoid organs or in mucosa deserves further studies.
Treg CD39+ expansion may help establish the relationship between immune activation and Treg-mediated suppression in HIV-1 infection. Increased ATP and adenine nucleotides in inflamed sites may serve as substrates for Treg-expressed nucleotidases but also may exert direct Treg-activating effects [45]. Thus, the ATP-Treg balance might be crucial for the regulation of inflammation. However, in the long term, CD39-mediated inhibition of T cell proliferation might exert an adverse effect not only on the immediate generation of T-cell immune responses, but also on the maintenance and restoration of the T-cell pool, thus contributing to disease progression. We also showed that despite efficient c-ART, the percentage of Treg CD39+ remains higher in c-ART+ HIV-1 subjects as compared to controls. Although T cells from these individuals express low levels of A2AR, we found that Treg still exert a significant inhibitory effect that was relieved by anti-CD39 blocking antibodies. This observation corroborates the observation of an inverse relationship between the frequency of Treg CD39+ and CD4+ T cell counts in patients (Fig. 6). Although the role of Treg in HIV-1 infection remains unclear, the identification of a novel Treg subset participating in Treg suppression may be useful to discriminate between a “friend or foe” role of Treg in HIV-1 infection.
Through a candidate gene association study, we identified a CD39 gene variant associated with down-modulation of CD39 expression that impacts the course of disease progression, a finding that was replicated in three different cohorts. Such high P values for the association of this variant and CD39 expression in both Genevar and Dixon databases are extremely rare. Since the SNP identified is in high linkage disequilibrium (r2>0.9) with several other SNPs within the CD39 gene, further studies are warranted to determine which of them is a causal variant. It is important to note that, according to the HapMap database, this SNP exists at a allelic frequency of ∼30% in the African population and at ∼70% in the Asian population, suggesting that this genetic variant may be an important determinant of disease progression in both populations. Overall, the genetic association study confirms in vivo the hypotheses put forward by our experimental work: subjects carrying the CD39-C allele are likely to exhibit a lower CD39 expression, which could impact the control of T cell immune responses, and in turn slow down HIV-1 disease progression.
Our data show that the CD39/adenosine axis might be a novel pathway involved in the Treg-mediated suppression in HIV infection through both an expansion of Treg strongly expressing the ectonucleotidase CD39, and an increased sensitivity of patients' T cells to adenosine. In this context, the possibility to revert Treg-mediated inhibition using CD39-blocking mAb or by modifying the adenosine turnover with specific drugs seems an attractive approach for the design of novel treatments to enhance T lymphocyte restoration and effector T cell responses.
Materials and Methods
Patients and cell populations
Blood samples were collected from HIV-1-positive subjects either naive from treatment (c-ART–, n = 39, CD4+ T cells counts (mean ± SD): 387±242 cells/µl; viral load (mean ± SD): 4,2±1,1 log HIV RNA copies /ml or stable under c-ART for more than 6 months (c-ART+, n = 39, CD4+ T cells counts (mean ± SD): 485±440 cells/µl ; viral load <1,6 log copies /ml), at the Hospital of Infectious Diseases, Sofia, Bulgaria and Henri Mondor Hospital, Créteil, France. Blood from 25 HIV-negative donors was obtained at the Regional Blood Transfusion Centre, Creteil, France. CD8+ and CD4+ T cells were purified using RosetteSep enrichment antibody cocktails (StemCell Technologies, Vancouver, BC, Canada) according to the manufacturer's instructions. CD4+CD25hi cells were further isolated with CD25 magnetic beads and two passages on MS columns (Miltenyi Biotec, Bergisch-Gladbach, Germany). The positive fraction contained >80% Treg expressing high levels of FoxP3 transcription factor as verified by flow cytometry (data not shown).
Proliferation and intra-cellular cytokine production assays
CD8+ T cells were stained with 0.5 mM CFSE (Molecular probes, Eugene OR, US) as previously described [46]. CFSE-labelled CD8+ T cells were cultivated in 96-well U-bottom plates, coated with 5 mg/mL anti-CD3 mAb (UCHT1; Beckman Coulter, Villepinte, France) in the presence or absence of Treg (total cell concentration 1.25×10⁵/ml and final volume 200 ml and the Treg/Effector ratio was 1/4 as determined in previous studies [43], [44]). In some experiments, Treg were pre-incubated with 10 µg/ml of anti-CD39 (BY40, IgG1) or isotype control mAb for 15 min at 37°C, and added to CD8+ T cells without a washing step.
The effects of BY40 mAb on CD39 expression and inhibition of ATPase activity were evaluated using YT2C2 NK cell line (flow cytometry) and fresh monocytes using malachite green phosphate detection kit (R&D System, Minneapolis, USA), according to manufacturer's instruction (See methods in the legend of Fig. S3). To assess the effect of adenosine analogue CGS 21680, PBMC were pre-incubated for 1 h with different concentrations of either CGS 21680 (Sigma-Aldrich, Lyon, France) or DMSO as control. Cells were then stimulated with anti-CD3 for 5 days as described above. At day 2 of culture, DMSO and CGS 21680 were added in identical concentrations.
For intracellular staining (ICS), CD8+ T cells were stimulated in the presence or absence of Treg (Treg/effector ratio:1/4) overnight with a pool of whole Gag 15-mer peptides (2 µg/ml) supplemented with anti-CD28 and anti-CD49d antibodies (1 µg/ml of each). Brefeldine A (10 µg/ml) was added 1 h after the peptide stimulation. Cells were surface stained with anti-CD8 mAb and ICS was performed with PE-Cy7-conjugated IFN-γ, TNFα and IL-2 antibodies. When indicated, Treg were pre-incubated with 10 µg/ml of anti-CD39 mAb or isotype control for 15 min at 37°C, and added to CD8+ T cells without a washing step.
A2AR mRNA quantification
Total RNA was isolated from purified CD4+ and CD8+ T cells and RT-PCR was performed by the ABI Prism 7500 Sequence Detection System (Applied Biosystems, Courtaboeuf, France) in 50 µL reaction with Platinum SYBR Green qPCR SuperMix-UDG w/ROX (Invitrogen) and 0.2 µM of each primer. S14 mRNA which expression was found to be stable among the different group of patients was used as control to normalize each sample. Sequences of the A2AR - and S14-specific primers were forward: CGAGGGCTAAGGGCATCATTG, reverse: CTCCTTTGGCTGACCGCAGTT) and forward: GGCAGACCGAGATGAATCCTCA, reverse: CAGGTCCAGGGGTCTTGG TCC. The relative levels of A2AR mRNA were calculated using the 2−ΔΔCT method.
Immunofluorescence and flow cytometry
Anti-CD39-PE (clone TU66), anti-CD25-PC7, anti-CD4-FITC or Pac.blue, anti-CD8-PerCP, anti-CD3-APC, and CD28-PerCP-Cy5.5, were products of BD Biosciences (Le Pont de Claix, France),CD45RA-ECD from Beckman Coulter (Villepinte, France), and CD127-Biot/ strepta-APCCy5.5, FoxP3-Alexa 488, CCR7-APC-Alexa 750 from ebiosciences (Montrouge, France). Blocking anti-CD39 mAb (BY40) was produced in one of our laboratories (A.B) by immunizing mice with the YT2C2 NK cell line. BY40 is IgG1 monoclonal antibody, which is with BY12 mAb unique regarding its epitope mapping as we previously reported [47]. BY40 is not cytotoxic and it inhibits directly ATPase activities mediated by cell membrane anchored CD39 (AB personal data and this paper Fig. S3) Cells were analysed by LSR II (BD Immunocytometry systems). At least 20 000 CD4 or CD8-gated events were collected for cell surface studies.
Statistical analysis
Statistically significant differences were assessed by one-way ANOVA, followed by paired t-samples T-test, or by unpaired T-test assuming independent samples where appropriate. Correlations were assessed using Spearman's rank order test (GraphPad° Prism 5.0 statistical software). The independent prognostication value of CD39 expression on Treg was evaluated in multiple linear regression models (SPSS v.17.0).
Cohorts used for the CD39 genetic association study
The GRIV cohort
The GRIV (Genomics of Resistance to Immunodeficiency Virus) cohort comprised 275 LTNP and 86 RP French HIV-1 seroprevalent individuals of Caucasian descent [20], [48]. All of them are French HIV-1 seroprevalent subjects of Caucasian descent and included on the basis of the main clinical outcomes, CD4 T-cell count and time to disease progression: an asymptomatic HIV-1 infection for more than 8 years, no antiretroviral treatment and a CD4 T-cell count consistently above 500/mm3 for LTNP; and a drop of CD4 T-cell count below 300/mm3 less than 3 years after the last seronegative test for RP. The control group used for comparison with GRIV subjects [22], [23] comprised 697 French HIV-1 seronegative individuals of Caucasian descent from the D.E.S.I.R. program [49]. GRIV is a case-control study (LTNP vs. CTR or RP vs. CTR) and the comparison of the LTNP vs. RP groups is less adequate to identify signals for the following reasons: 1. The past experience has shown that most signals are either linked to long-term non-progression or to rapid progression, very rarely to both; 2. Without a control population, the LTNP vs. RP comparison does not allow to discriminate if a putative signal is associated to LTNP or to RP; 3. Finally, the three groups are needed to discriminate if a signal is linked to progression or to the acquisition phenotype.
The ACS group
417 HIV-1 seroconverter and seroprevalent Dutch subjects were collected from the ACS (Amsterdam Cohort Study) on the course of HIV-1 infection using AIDS-related death as an endpoint [50]. AIDS-related death is defined as death with AIDS-related malignancy, death with AIDS-opportunistic infections, or death with an AIDS-related cause not specified by the treating physician. Written informed consent was obtained prior to data collection for the ACS, and the study was approved by the Academic Medical Center institutional medical ethics committee.
The MACS cohort
156 HIV-1 seroconverter Caucasian homosexual men were collected from the MACS (Multicenter AIDS Cohort Study) cohort using time to clinical AIDS (CDC 1987 definition) as an endpoint [51]. This panel was enriched with extreme AIDS progression phenotypes (rapid progressors, and long-term non-progressors) in order to increase the power of the study.
Genotyping methods and quality control for the CD39 genetic association study
(For more details, see previously published works [23], [50], [51]). For the GRIV (cases and controls) and ACS analyses, the CD39 genotyping data were obtained using the Illumina Infinium II HumanHap300 BeadChips, when for the MACS analysis, they were obtained using the Affymetrix GeneChip Human Mapping 500K Array. In each study, quality control filters (e.g. missingness, low minor allele frequency, Hardy-Weinberg equilibrium deviation) were applied to ensure reliable genotyping data as previously described [23], [50], [51]. In each cohort, potential population stratification was also considered using the Eigenstrat software [52]. First, to confirm continental ancestries, the genotypes of each participants group were combined with the genotypes from the three HapMap reference populations. Among the initial ACS group, 13 subjects were thus excluded from further analyses (n = 404) to avoid spurious associations resulting from a non-European ancestry. Then, in each study group of European descent, the top ten most significant principal components were identified and included as covariates in the regression models described below. The rs11188513 SNP untyped in the MACS group was imputed using Impute software [53] and the HapMap release 21 phased data for the population of European descent (CEU) as the reference panel.
Statistical analysis for the CD39 genetic association study
We first performed a genetic case-control association analysis in the GRIV cohort using a logistic regression and an additive model, including as covariates the 10 principal components identified by Eigenstrat. All SNPs found to be significant in the GRIV cohort were tested for replication in ACS and MACS cohorts. The SNP rs11188513 was the only polymorphism exhibiting a significant p-value both in ACS and MACS. For the replication in the ACS and MACS groups, we performed Kaplan-Meier survival analysis and regression -Cox proportional regression and linear regression for ACS and MACS respectively - in an additive model including as covariates the 10 principal components identified by Eigenstrat. The significant associations (P<0.05) were also retested using age, sex, and CCR5-P1 and D32 polymorphisms as covariates and yielded identical results.
To evaluate the combined p-value obtained over the 3 cohorts for each SNP, we used the classical Fisher method [54].
Ethic statements
Approval and written informed consent from all subjects were obtained before study initiation. The study was approved by the following ethical committees : Hospital of Infectious Diseases, Sofia, Bulgaria and CCP IX Ile de France - Henri Mondor Hospital, Créteil, France. Ethic statements for GRIV, MACS ACS cohorts have been already reported [23], [50], [51].
Supporting Information
Zdroje
1. AppayVNixonDFDonahoeSMGillespieGMDongT 2000 HIV-specific CD8(+) T cells produce antiviral cytokines but are impaired in cytolytic function. J Exp Med 192 63 75
2. AandahlEMMichaelssonJMorettoWJHechtFMNixonDF 2004 Human CD4+CD25+ regulatory T cells control T-cell responses to human immunodeficiency virus and cytomegalovirus antigens. J Virol 78 2454 2459
3. CabreraRTuZXuYFirpiRJRosenHR 2004 An immunomodulatory role for CD4(+)CD25(+) regulatory T lymphocytes in hepatitis C virus infection. Hepatology 40 1062 1071
4. KinterALHennesseyMBellAKernSLinY 2004 CD25(+)CD4(+) regulatory T cells from the peripheral blood of asymptomatic HIV-infected individuals regulate CD4(+) and CD8(+) HIV-specific T cell immune responses in vitro and are associated with favorable clinical markers of disease status. J Exp Med 200 331 343
5. KaredHLelievreJDDonkova-PetriniVAoubaAMelicaG 2008 HIV-specific regulatory T cells are associated with higher CD4 cell counts in primary infection. AIDS 22 2451 2460
6. WeissLDonkova-PetriniVCaccavelliLBalboMCarbonneilC 2004 Human immunodeficiency virus-driven expansion of CD4+CD25+ regulatory T cells, which suppress HIV-specific CD4 T-cell responses in HIV-infected patients. Blood 104 3249 3256
7. CollisonLWWorkmanCJKuoTTBoydKWangY 2007 The inhibitory cytokine IL-35 contributes to regulatory T-cell function. Nature 450 566 569
8. PaustSLuLMcCartyNCantorH 2004 Engagement of B7 on effector T cells by regulatory T cells prevents autoimmune disease. Proc Natl Acad Sci U S A 101 10398 10403
9. VignaliDACollisonLWWorkmanCJ 2008 How regulatory T cells work. Nat Rev Immunol 8 523 532
10. BorsellinoGKleinewietfeldMDi MitriDSternjakADiamantiniA 2007 Expression of ectonucleotidase CD39 by Foxp3+ Treg cells: hydrolysis of extracellular ATP and immune suppression. Blood 110 1225 1232
11. DeaglioSDwyerKMGaoWFriedmanDUshevaA 2007 Adenosine generation catalyzed by CD39 and CD73 expressed on regulatory T cells mediates immune suppression. J Exp Med 204 1257 1265
12. MandapathilMSzczepanskiMJSzajnikMRenJLenznerDE 2009 Increased ectonucleotidase expression and activity in regulatory T cells of patients with head and neck cancer. Clin Cancer Res 15 6348 6357
13. AirasLHellmanJSalmiMBonoPPuurunenT 1995 CD73 is involved in lymphocyte binding to the endothelium: characterization of lymphocyte-vascular adhesion protein 2 identifies it as CD73. J Exp Med 182 1603 1608
14. BoursMJSwennenELDi VirgilioFCronsteinBNDagneliePC 2006 Adenosine 5′-triphosphate and adenosine as endogenous signaling molecules in immunity and inflammation. Pharmacol Ther 112 358 404
15. RobsonSCSevignyJZimmermannH 2006 The E-NTPDase family of ectonucleotidases: Structure function relationships and pathophysiological significance. Purinergic Signal 2 409 430
16. SitkovskyMVLukashevDApasovSKojimaHKoshibaM 2004 Physiological control of immune response and inflammatory tissue damage by hypoxia-inducible factors and adenosine A2A receptors. Annu Rev Immunol 22 657 682
17. ThielMCaldwellCCSitkovskyMV 2003 The critical role of adenosine A2A receptors in downregulation of inflammation and immunity in the pathogenesis of infectious diseases. Microbes Infect 5 515 526
18. HuangSApasovSKoshibaMSitkovskyM 1997 Role of A2a extracellular adenosine receptor-mediated signaling in adenosine-mediated inhibition of T-cell activation and expansion. Blood 90 1600 1610
19. MaliszewskiCRDelespesseGJSchoenbornMAArmitageRJFanslowWC 1994 The CD39 lymphoid cell activation antigen. Molecular cloning and structural characterization. J Immunol 153 3574 3583
20. HendelHCaillat-ZucmanSLebuanecHCarringtonMO'BrienS 1999 New class I and II HLA alleles strongly associated with opposite patterns of progression to AIDS. J Immunol 162 6942 6946
21. FriedmanDJKunzliBMYIARSevignyJBerberatPO 2009 From the Cover: CD39 deletion exacerbates experimental murine colitis and human polymorphisms increase susceptibility to inflammatory bowel disease. Proc Natl Acad Sci U S A 106 16788 16793
22. Le ClercSLimouSCoulongesCCarpentierWDinaC 2009 Genomewide association study of a rapid progression cohort identifies new susceptibility alleles for AIDS (ANRS Genomewide Association Study 03). J Infect Dis 200 1194 1201
23. LimouSLe ClercSCoulongesCCarpentierWDinaC 2009 Genomewide association study of an AIDS-nonprogression cohort emphasizes the role played by HLA genes (ANRS Genomewide Association Study 02). J Infect Dis 199 419 426
24. GeDZhangKNeedACMartinOFellayJ 2008 WGAViewer: software for genomic annotation of whole genome association studies. Genome Res 18 640 643
25. DixonALLiangLMoffattMFChenWHeathS 2007 A genome-wide association study of global gene expression. Nat Genet 39 1202 1207
26. DwyerKMDeaglioSGaoWFriedmanDStromTB 2007 CD39 and control of cellular immune responses. Purinergic Signal 3 171 180
27. MandapathilMLangSGorelikEWhitesideTL 2009 Isolation of functional human regulatory T cells (Treg) from the peripheral blood based on the CD39 expression. J Immunol Methods 346 55 63
28. LealDBStreherCABertoncheli CdeMCarliLFLealCA 2005 HIV infection is associated with increased NTPDase activity that correlates with CD39-positive lymphocytes. Biochim Biophys Acta 1746 129 134
29. Schulze Zur WieschJThomssenAHartjenPTothILehmannC 2011 Comprehensive Analysis of Frequency and Phenotype of T Regulatory Cells in HIV Infection: CD39 expression of FoxP3+ T regulatory cells correlates with progressive disease. J Virol 85 1287 1297
30. NigamPVeluVKannanganatSChennareddiLKwaS 2010 Expansion of FOXP3+ CD8 T cells with suppressive potential in colorectal mucosa following a pathogenic Simian Immunodeficiency Virus infection correlates with diminished antiviral T cell response and viral control. J Immunol 184 1690 1701
31. BurnstockG 2006 Pathophysiology and therapeutic potential of purinergic signaling. Pharmacol Rev 58 58 86
32. MartinCLeoneMViviandXAyemMLGuieuR 2000 High adenosine plasma concentration as a prognostic index for outcome in patients with septic shock. Crit Care Med 28 3198 3202
33. OguraYSutterwalaFSFlavellRA 2006 The inflammasome: first line of the immune response to cell stress. Cell 126 659 662
34. ErdmannAAGaoZGJungUFoleyJBorensteinT 2005 Activation of Th1 and Tc1 cell adenosine A2A receptors directly inhibits IL-2 secretion in vitro and IL-2-driven expansion in vivo. Blood 105 4707 4714
35. OhtaASitkovskyM 2001 Role of G-protein-coupled adenosine receptors in downregulation of inflammation and protection from tissue damage. Nature 414 916 920
36. OhtaAOhtaAMadasuMKiniRSubramanianM 2009 A2A adenosine receptor may allow expansion of T cells lacking effector functions in extracellular adenosine-rich microenvironments. J Immunol 183 5487 5493
37. ZarekPEHuangCTLutzERKowalskiJHortonMR 2008 A2A receptor signaling promotes peripheral tolerance by inducing T-cell anergy and the generation of adaptive regulatory T cells. Blood 111 251 259
38. KobieJJShahPRYangLRebhahnJAFowellDJ 2006 T regulatory and primed uncommitted CD4 T cells express CD73, which suppresses effector CD4 T cells by converting 5′-adenosine monophosphate to adenosine. J Immunol 177 6780 6786
39. AswadFKawamuraHDennertG 2005 High sensitivity of CD4+CD25+ regulatory T cells to extracellular metabolites nicotinamide adenine dinucleotide and ATP: a role for P2X7 receptors. J Immunol 175 3075 3083
40. DongRPKameokaJHegenMTanakaTXuY 1996 Characterization of adenosine deaminase binding to human CD26 on T cells and its biologic role in immune response. J Immunol 156 1349 1355
41. SitkovskyMVOhtaA 2005 The ‘danger’ sensors that STOP the immune response: the A2 adenosine receptors? Trends Immunol 26 299 304
42. GajewskiTFMengYHarlinH 2006 Immune suppression in the tumor microenvironment. J Immunother 29 233 240
43. KinterAMcNallyJRigginLJacksonRRobyG 2007 Suppression of HIV-specific T cell activity by lymph node CD25+ regulatory T cells from HIV-infected individuals. Proc Natl Acad Sci U S A 104 3390 3395
44. EstesJDLiQReynoldsMRWietgrefeSDuanL 2006 Premature induction of an immunosuppressive regulatory T cell response during acute simian immunodeficiency virus infection. J Infect Dis 193 703 712
45. LichterfeldMKaufmannDEYuXGMuiSKAddoMM 2004 Loss of HIV-1-specific CD8+ T cell proliferation after acute HIV-1 infection and restoration by vaccine-induced HIV-1-specific CD4+ T cells. J Exp Med 200 701 712
46. NikolovaMLelievreJDCarriereMBensussanALevyY 2009 Regulatory T cells differentially modulate the maturation and apoptosis of human CD8+ T-cell subsets. Blood 113 4556 4565
47. GouttefangeasCMansurIBensussanABoumsellL 1995 Biochemical analysis and epitope mapping of mAb defining CD39. SchlossmanSFBoumsellLGilksWHarlanJMKishimotoT Leucocyte Typing V New York Oxford University Press 383 385
48. WinklerCAHendelHCarringtonMSmithMWNelsonGW 2004 Dominant effects of CCR2–CCR5 haplotypes in HIV-1 disease progression. J Acquir Immune Defic Syndr 37 1534 1538
49. BalkauB 1996 [An epidemiologic survey from a network of French Health Examination Centres, (D.E.S.I.R.): epidemiologic data on the insulin resistance syndrome]. Rev Epidemiol Sante Publique 44 373 375
50. van ManenDKootstraNABoeser-NunninkBHandulleMAvan't WoutAB 2009 Association of HLA-C and HCP5 gene regions with the clinical course of HIV-1 infection. AIDS 23 19 28
51. HerbeckJTGottliebGSWinklerCANelsonGWAnP 2010 Multistage genomewide association study identifies a locus at 1q41 associated with rate of HIV-1 disease progression to clinical AIDS. J Infect Dis 201 618 626
52. PriceALPattersonNJPlengeRMWeinblattMEShadickNA 2006 Principal components analysis corrects for stratification in genome-wide association studies. Nat Genet 38 904 909
53. MarchiniJHowieBMyersSMcVeanGDonnellyP 2007 A new multipoint method for genome-wide association studies by imputation of genotypes. Nat Genet 39 906 913
54. FisherRAImmerFRTedinO 1932 The Genetical Interpretation of Statistics of the Third Degree in the Study of Quantitative Inheritance. Genetics 17 107 124
Štítky
Hygiena a epidemiologie Infekční lékařství LaboratořČlánek vyšel v časopise
PLOS Pathogens
2011 Číslo 7
- Parazitičtí červi v terapii Crohnovy choroby a dalších zánětlivých autoimunitních onemocnění
- Vakcíny proti klíšťové encefalitidě
- Kdy je nejlepší očkovat
- Možné vedlejší účinky očkování
- Imunogenita vakcín
Nejčtenější v tomto čísle
- Requires Glycerol for Maximum Fitness During The Tick Phase of the Enzootic Cycle
- Comparative Genomics Yields Insights into Niche Adaptation of Plant Vascular Wilt Pathogens
- The Role of IL-15 Deficiency in the Pathogenesis of Virus-Induced Asthma Exacerbations
- “Persisters”: Survival at the Cellular Level
Zvyšte si kvalifikaci online z pohodlí domova
Mazová zátka a její řešení
nový kurzVšechny kurzy