
C Metabolic Flux Analysis Identifies an Unusual Route for Pyruvate Dissimilation in Mycobacteria which Requires Isocitrate Lyase and Carbon Dioxide Fixation
Mycobacterium tuberculosis requires the enzyme isocitrate lyase (ICL) for growth and virulence in vivo. The demonstration that M. tuberculosis also requires ICL for survival during nutrient starvation and has a role during steady state growth in a glycerol limited chemostat indicates a function for this enzyme which extends beyond fat metabolism. As isocitrate lyase is a potential drug target elucidating the role of this enzyme is of importance; however, the role of isocitrate lyase has never been investigated at the level of in vivo fluxes. Here we show that deletion of one of the two icl genes impairs the replication of Mycobacterium bovis BCG at slow growth rate in a carbon limited chemostat. In order to further understand the role of isocitrate lyase in the central metabolism of mycobacteria the effect of growth rate on the in vivo fluxes was studied for the first time using 13C-metabolic flux analysis (MFA). Tracer experiments were performed with steady state chemostat cultures of BCG or M. tuberculosis supplied with 13C labeled glycerol or sodium bicarbonate. Through measurements of the 13C isotopomer labeling patterns in protein-derived amino acids and enzymatic activity assays we have identified the activity of a novel pathway for pyruvate dissimilation. We named this the GAS pathway because it utilizes the Glyoxylate shunt and Anapleurotic reactions for oxidation of pyruvate, and Succinyl CoA synthetase for the generation of succinyl CoA combined with a very low flux through the succinate – oxaloacetate segment of the tricarboxylic acid cycle. We confirm that M. tuberculosis can fix carbon from CO2 into biomass. As the human host is abundant in CO2 this finding requires further investigation in vivo as CO2 fixation may provide a point of vulnerability that could be targeted with novel drugs. This study also provides a platform for further studies into the metabolism of M. tuberculosis using 13C-MFA.
Published in the journal:
. PLoS Pathog 7(7): e32767. doi:10.1371/journal.ppat.1002091
Category:
Research Article
doi:
https://doi.org/10.1371/journal.ppat.1002091
Summary
Mycobacterium tuberculosis requires the enzyme isocitrate lyase (ICL) for growth and virulence in vivo. The demonstration that M. tuberculosis also requires ICL for survival during nutrient starvation and has a role during steady state growth in a glycerol limited chemostat indicates a function for this enzyme which extends beyond fat metabolism. As isocitrate lyase is a potential drug target elucidating the role of this enzyme is of importance; however, the role of isocitrate lyase has never been investigated at the level of in vivo fluxes. Here we show that deletion of one of the two icl genes impairs the replication of Mycobacterium bovis BCG at slow growth rate in a carbon limited chemostat. In order to further understand the role of isocitrate lyase in the central metabolism of mycobacteria the effect of growth rate on the in vivo fluxes was studied for the first time using 13C-metabolic flux analysis (MFA). Tracer experiments were performed with steady state chemostat cultures of BCG or M. tuberculosis supplied with 13C labeled glycerol or sodium bicarbonate. Through measurements of the 13C isotopomer labeling patterns in protein-derived amino acids and enzymatic activity assays we have identified the activity of a novel pathway for pyruvate dissimilation. We named this the GAS pathway because it utilizes the Glyoxylate shunt and Anapleurotic reactions for oxidation of pyruvate, and Succinyl CoA synthetase for the generation of succinyl CoA combined with a very low flux through the succinate – oxaloacetate segment of the tricarboxylic acid cycle. We confirm that M. tuberculosis can fix carbon from CO2 into biomass. As the human host is abundant in CO2 this finding requires further investigation in vivo as CO2 fixation may provide a point of vulnerability that could be targeted with novel drugs. This study also provides a platform for further studies into the metabolism of M. tuberculosis using 13C-MFA.
Introduction
Initial infection with Mycobacterium tuberculosis is either asymptomatic or leads to the development of acute disease (primary tuberculosis). In both cases, infection (including recovery in the absence of treatment) is generally followed by a period of latency which may last for months, years, decades or a lifetime. Reactivated tuberculosis (post-primary) can occur at any time and is a major source of transmission. Unlike many pathogens M. tuberculosis does not rely on the production of specific toxins to cause disease. Rather the ability to adapt and survive within the changing and adverse environment provided by the human host during the course of an infection seems to be the secret to the success of M. tuberculosis. It is becoming apparent that key to this adaptation is the metabolic reprogramming of M. tuberculosis during both the acute and chronic phase of tuberculosis (TB) disease and therefore a more complete understanding of mycobacterial metabolism remains a major goal of TB research.
Our previous studies have investigated the influence of growth rate on metabolism in M. tuberculosis [1], [2]. We found significant differences in macromolecular composition between fast and slow-growing cells [1] and demonstrated that the transcriptional response to slow growth in vitro has many similarities to the transcriptional response characteristic of the adaptation of M. tuberculosis to the macrophage environment [3]. Growth rate modulation is therefore likely to be a significant component of the adaptation of M. tuberculosis to the host environment. Yet, the shift to slow growth is much more than a general slowing down of cellular processes. Global mutagenesis analysis demonstrated that growth rate control in M. tuberculosis is in fact a carefully orchestrated process which requires a distinct set of genes encoding several virulence determinants, gene regulators, and metabolic enzymes [4]. However, the precise metabolic changes that underlie the shift to slow growth both in vitro and in vivo remain unclear.
We previously investigated the metabolic response of slow growing glycerol-limited M. tuberculosis in silico using flux balance analysis (FBA) of our genome-scale reconstruction of TB metabolism [2]. The most significant result of this study was a predicted increase in flux through the isocitrate lyase reaction during slow growth. This hypothesis was tested experimentally using our chemostat-based experimental system of mycobacterial growth [1]. By directly measuring the activity of isocitrate lyase, in fast and slow growing BCG cells from a chemostat we demonstrated that isocitrate lyase activity was, in accordance with predictions, induced during slow growth [1].
Isocitrate lyase (ICL) has been shown to have an essential role in the survival and persistence of M. tuberculosis in both macrophages and mice [5], [6] and is also essential for the persistence of other intracellular pathogens [7], [8]. As this enzyme is apparently absent from human cells, ICL has been intensively investigated as an attractive target for drug development.
The glyoxylate shunt is an anaplerotic pathway important for the metabolism of fatty acids which is mediated by the enzyme ICL along with malate synthase. The essentiality of ICL in the survival and persistence of M. tuberculosis has therefore been generally interpreted to be due to this enzyme's role in the glyoxylate shunt and reflect a metabolic shift in the principal carbon source from carbohydrates to fat in the host. However, the ICL's of M. tuberculosis also function as methylisocitrate lyases in the methyl citrate cycle where they are involved in the metabolism of propionyl-CoA [9]. More recently ICL has been shown to be essential for intracellular ATP level reduction in a nutrient starvation model of persistence [10] and the glyoxylate shunt has been shown to operate concurrently with an oxidative (tricarboxylic acid) TCA cycle which is completed by an anaerobic α-ketoglutarate ferredoxin oxidoreductase (KOR) [11]. Our in vitro enzyme activity data demonstrates a role for ICL during slow growth rate on glycerol [2], a substrate that would be expected to be catabolised via glycolysis and the TCA cycle and provided a first clue that the glyoxylate shunt in M. tuberculosis operates under more general conditions.
However, FBA cannot provide unique solutions for intracellular fluxes because of the existence of multiple parallel pathways; so the method could not identify the metabolic pathways utilized by M. tuberculosis during slow growth. A more direct means of establishing the intracellular fluxes is through 13C metabolic flux analysis (13C-MFA). This powerful technique has been successfully applied to identify functional flux states in various microbes [12], [13] and has enormous potential for studying the metabolism of M. tuberculosis. The method utilizes the fact that amino acids are constructed from metabolic precursors in central metabolism. Growth of a cell with 13C-labeled substrate therefore leads to a pattern of 13C incorporation in the proteinogenic amino acids that is determined by the intracellular fluxes to these compounds. Computational tools may then be used to find the values of the intracellular fluxes that are consistent with the pattern of amino acid labeling, as determined by NMR or mass spectrometry.
In this study we further examine the hypothesis that ICL plays a role in dissimilation of carbohydrates in M. tuberculosis at slow growth rates using mutational, enzymatic and macromolecular analysis. We demonstrate that ICL is actually essential in slowly growing Mycobacterium bovis BCG in a glycerol-limited chemostat. In addition we use 13C-MFA to determine the metabolic phenotype of M. bovis BCG at fast and slow growth rates and M. tuberculosis H37Rv at slow growth rate, in order to provide a system-level understanding of the metabolism of slowly growing mycobacteria and particularly the role of ICL. This approach provides a novel insight into the M. tuberculosis metabolism that may have implications for how the tubercle bacillus survives in vivo.
Results
Deletion of icl1 from M. bovis BCG
To further explore the role of ICL during slow growth, the icl1 gene was deleted from BCG to generate BCGΔicl1 and this was confirmed by Southern blot (Figure S1). Enzyme activity of the resulting mutant (1.32 nmol min−1 mg protein−1) was less than one tenth that of the wild type value (21.20 nmol min−1 mg protein−1). The residual activity demonstrates that another gene encodes an active ICL in M. bovis BCG. Two ICL genes have been identified in M. tuberculosis H37Rv (icl1 and icl2) but only one (icl1) encodes a functional enzyme in this strain [14]. In M. tuberculosis CSU93 [14], M. bovis [15] and M. avium both genes encode active enzymes. The arrangement of the isocitrate lyase genes in the M. bovis BCG genome sequence suggests that both enzymes are also functional in this strain and the data presented here confirms this.
Growth of Δicl1 in continuous culture in a chemostat
The phenotype of the Δicl1 mutant strain was characterized at two specific growth rates in the chemostat: µS = 0.03 h−1 (td = 23 h) and µF = 0.01 h−1 (td = 69 h). The physiological [1] and transcriptomic [3] profile and also the genetic requirements [4] of mycobacterial cells at these growth rates have been described previously. The loss of the icl1 gene did not impair the ability of the mutant to adapt to growth in the bioreactor, as growth of the mutant strain was indistinguishable from the wild type during the batch phase (Figure 1). However, the wild type and mutant strain behaved very differently after media flow from the feed reservoir into the bioreactor was initiated in order to establish carbon-limited continuous culture conditions. At a dilution rate of 0.01 h−1 (corresponding to a doubling time of 69 h), wild type BCG reached a steady state after approximately six volume changes (day 40) after which little variation was observed in the CO2 and biomass production rates, indicating that steady state (continuous culture) conditions had been attained (Figure 2). Cells were harvested for analysis at day 42. In contrast, Δicl1 mutant strain appeared unable to establish a steady-state at this growth rate. Instead, the biomass and CO2 production of Δicl1 mutant culture declined continuously from day 16 until day 59 when the strain was completely washed out of the chemostat and the experiment was terminated (Figure 2). Consumption of glycerol also differed between the two strains during the course of the experiment (Figure 2). The Δicl1 mutant consumed glycerol much more slowly than the wild type BCG. Growth of the Δicl1 mutant was similar to the wild type strain up to the point at which glycerol became limited, which occurred at day 16 for Δicl1 and at day 10 for the wild type strain (Figure 2). After this point the growth of the wild type adjusted to the rate of nutrient supplied by the chemostat to reach steady state whereas the Δicl1 mutant started to flush out from the bioreactor vessel. These results indicated that loss of icl1 significantly changed the growth properties of M. bovis BCG even when growing with glycerol as the principal carbon source.


In contrast, the behavior of the wild type and Δicl1 mutant was similar in the chemostat at a higher dilution rate of 0.03 h−1 (corresponding to a doubling time of 23 h) (Figure 3) in that both wild type and mutant attained a steady state after 22 days of growth (five volume changes). There were however significant physiological differences between wildtype and mutant strains (Table 1). A significant decrease in the specific glycerol uptake rate, increased CO2 production and an increased biomass yield was observed for the Δicl1 mutant compared with the wild type. Interestingly the Tween 80 consumption rates did not differ significantly between the wild type and mutant strains (Table 1). Macromolecular analysis demonstrated that whereas the relative fraction of lipid was similar for wild type icl1 mutant strains (Table 1) the carbohydrate content was markedly decreased in the icl1 mutant and this was balanced by an increase in protein content.


Enzyme activities
We have previously demonstrated that the in vitro activities of ICL were two-fold higher in slow (td = 69 h) growing chemostat cultures than in the more rapidly (td = 23 h) growing cultures [2]. In order to further explore the unexpected role of ICL at slow growth we measured the in vitro activities of the competing enzyme, isocitrate dehydrogenase (IDH), and also enzymes involved in downstream anaplerotic reactions (Table 2) in the wild-type strain. We also measured the activity of glycine dehydrogenase (GDH) as this enzyme was shown to act in concert with ICL in Wayne's model of non-replicating persistence [16]. As these enzymes play important roles in controlling the distribution of metabolic flux in the cell this could provide information about the metabolic wiring during slow growth rate. Consistent with elevation of the glyoxylate pathway, in vitro activity of IDH was 50% lower at the slow as compared with the fast growth rate (Table 2). The pattern of the anaplerotic phosphoenolpyruvate carboxykinase (PCK) enzyme activity paralleled that of ICL and higher activities were observed at slow growth rate as compared with fast growth rate. The in vitro activity of the competing anaplerotic enzyme, pyruvate carboxylase (PCA) was however below the detection level of the assay at both growth rates indicating that this enzyme is either inactive in the growth conditions tested or that the assay conditions were not optimum. Very low levels of malic enzyme (MEZ) were also detected at both growth rates. This is in accordance with previous observations [17]. GDH activity was detected in almost equal amounts at both growth rates.

13C MFA of M. bovis BCG
In order to complement the enzyme activity data and further explore the metabolic phenotype of slowly growing mycobacterial cells we performed metabolic flux analysis (MFA) using [13C3]glycerol. The labeling experiments with M. bovis BCG were carried out at both fast (td = 23 h) and slow (td = 69 h) growth rates. The physiological characteristics of cells at these growth rates are summarized in Table 1. Our initial data demonstrated that, in addition to glycerol, Tween 80 was also utilized by BCG as a carbon source during the chemostat experiments. We therefore developed and utilized an assay to measure Tween 80 uptake (Methods) in the chemostat, and Tween 80 was also included as a carbon source in the metabolic flux analysis. Perhaps surprisingly, significantly less of the available Tween 80 was consumed during slow growth (16%) than at the faster growth rate (43%).
Steady state chemostat cultures were switched to medium containing 20% [13C3]glycerol and samples were removed for analysis every volume change for a minimum of five volume changes. Labeling of proteinogenic amino acids was measured using gas chromatography coupled to mass spectrometry (GC-MS). The labeling pattern of most of the fragments changed very little between the third and fourth volume change indicating that the culture had reached an isotopic steady state (Table S1). After correction for the naturally occurring isotopes of atoms other than carbon, experimental GC-MS data was compared to data simulated from flux distributions using the 13CFlux software package (Table S3; Table S4) [18].
For flux calculations we constructed an isotopomer model composed of reactions extracted from our GSMN-TB model [2] and included the reactions of glycolysis, the pentose phosphate pathway, the TCA cycle and anaplerosis. This isotopomer model is applicable to both M. bovis BCG and M. tuberculosis as current knowledge indicates that these pathways are identical in these two species. The model included fully formulated amino acid biosynthesis pathways and reactions for output of metabolic precursors to biomass, allowing estimate of the fluxes to biomass from each precursor, which are shown as output fluxes in Figure 4 and Table S2. This was a relatively large network for analysis and therefore we simplified this initial network to the point where it could be solvable using the GC-MS data. M. tuberculosis and M. bovis BCG are peculiar in that two distinct and unconventional TCA cycles are utilized [11], [19]. Lacking the traditional TCA ketoglutarate dehydrogenase (KGD) both M. tuberculosis and M. bovis BCG express an anaerobic α-ketoglutarate ferredoxin oxidoreductase (KOR) normally associated with the reductive TCA cycle and this is thought to complete the oxidative TCA cycle [11]. In addition a novel TCA cycle which uses an alternative pathway from α-ketoglutarate to succinate via succinic semialdehyde has also been proposed in M. tuberculosis [19]. The existence of this pathway is now called into question due to the re-characterisation of the proposed α-ketoglutarate decarboxylase (KGD) as a 2-hydroxy-3-oxoadipate synthase [20]. However, these pathways cannot be distinguished by 13C-MFA as the carbon flow from α-ketoglutarate to succinate is the same irrespective of which route is taken. Consequently both routes are combined and lumped into one flux model. Simplifications were also introduced where the accuracy of flux estimates was predicted to be poor. For example based on available measurements it was also not possible to discriminate between the MEZ and PCA reactions with high confidence so the summed flux is shown between pyruvate and malate/oxaloacetate. The refined network is illustrated in Figure 4 and the component steps defined in Table S2.

In addition, in order to directly compare the fast (D = 0.03 h−1, td = 23 h) and slow (D = 0.01 h−1, td = 69 h) growth rates and also to incorporate information from the enzymatic data the final isotopomer model consists of two sub-models, representing fast and slow growth rates. Both sub-models are structurally identical and are coupled via inequality constraints to reflect the tendencies of the measured in vitro enzyme activities (Table 2). This allowed the parameter estimation process to fit simultaneously all of the measured data for both growth rates without hard coding enzyme activity measurements.
All fluxes were normalized relative to the rate of glycerol uptake which was considered to be 100. A unique best fit was obtained for the fast growth rate BCG (Figure 5) whereas two significantly different, but equally likely solutions (A and B) were obtained for the slow growth rate (Figure 6 and 7; Table S5). For the slow growth rate therefore it can be concluded that the flux values cannot be determined unambiguously from the available labeling data. This is a relatively common outcome in 13C-MFA. The major differences in these two flux solutions are in the operation of the gluconeogenesis, the pentose phosphate pathway and the output of acetyl CoA. However, whilst there are differences between the two slow growth rate solutions they share a common metabolic route for pyruvate dissimilation via the TCA cycle, glyoxylate shunt and anaplerotic reactions and we therefore focus our conclusions on the operation of these pathways.
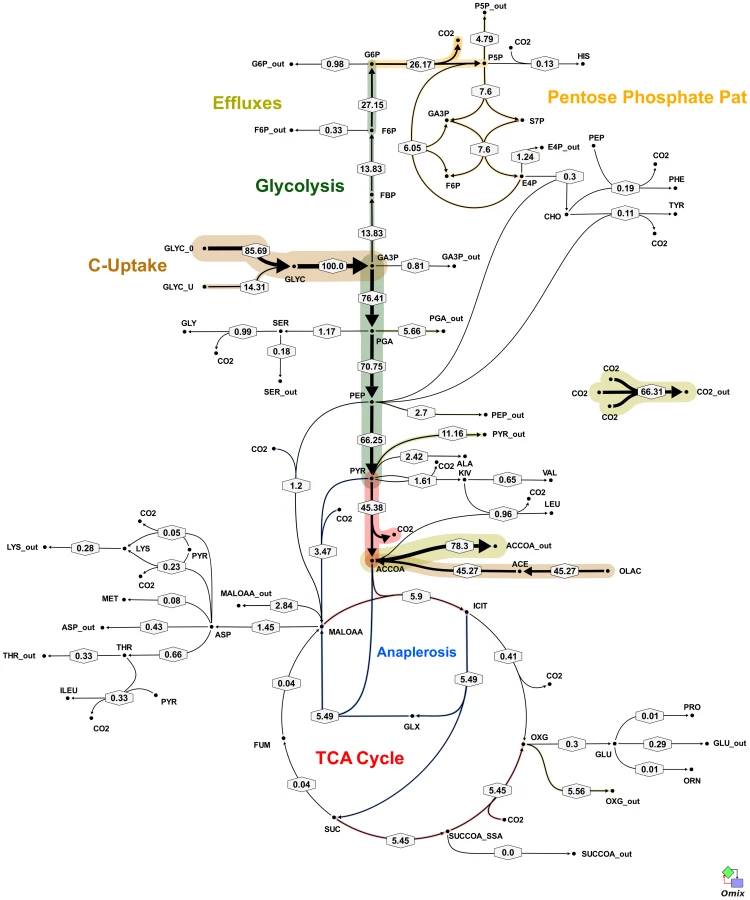


According to the weak constraints applied to the model (see above) ICL flux was higher at the slow growth rate (8.76–9.04%) than at the fast growth rate (5.49%) for both slow growth rate solutions. In addition, at either the slow or fast growth rate use of the glyoxylate shunt was coupled with an unexpectedly low flux (0–1.55% at slow growth rate and 0.02% at fast growth rate) through the later part of the TCA (from succinate to malate/oxolacetate) with the malate/oxaloacetate pool being replenished primarily using carbon fixing anaplerotic reactions. Another interesting feature of the BCG flux solutions obtained for both fast and slow growth rates was a negative flux (going in the reductive direction) through the α-ketoglutarate ferredoxin oxidoreductase (KOR) reaction. Approximately 11% of the oxalocetate originated from the anaplerotic PCK at slow growth rate, whereas at fast growth rate there was only a 1.2% anaplerotic flux through PCK with an additional 3.47% flux to malate/oxaloacetate through the reactions catalysed by either PCA or MEZ. Both slow growth rate solutions show a negative flux from succinate to succinyl CoA via succinyl-CoA synthetase (SCS) whereas at the fast growth rate there is negligible flux to succinyl CoA. Succinyl CoA is a precursor of methyl branched lipids, which are a major component of biomass, as well as being used for synthesis of diaminopepimelate, sulpholipids and heme. The increased flux to succinyl CoA may therefore reflect an increased requirement for some or all of these metabolites at slow growth rate. In contrast to the increased succinate/succinyl CoA output flux at slow growth rate, there was a dramatic increase in the output flux of acetyl CoA at the fast growth rate and this was also present in one of the two solutions for slow BCG cells.
13C MFA of M. tuberculosis
In order to confirm that the observed metabolic pathway for pyruvate dissimilation in slowly growing BCG was also occurring in M. tuberculosis we performed steady state chemostat cultivations of the tubercule bacillus at a dilution rate of 0.01 h−1 (td = 69.3 h). The steady state glycerol and Tween 80 consumption rates were very similar to those of BCG (Table 1). M. tuberculosis exhibited a lower CO2 production rate (0.23 mmol g biomass−1 h−1) compared to BCG (0.57 mmol g biomass−1 h−1).
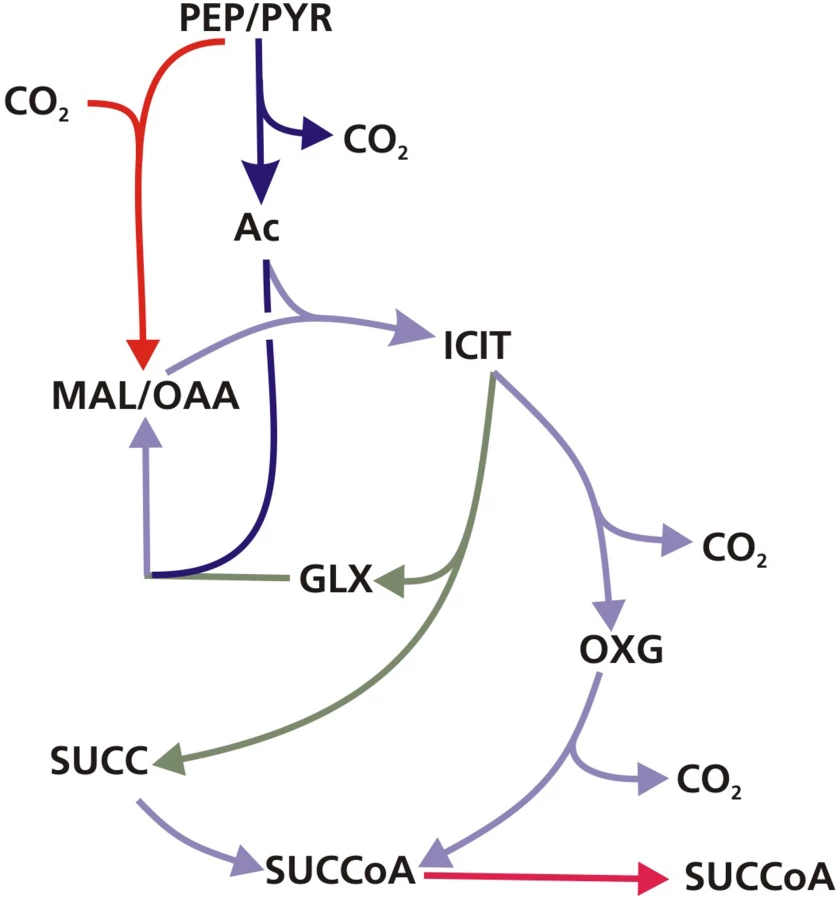
The metabolic fluxes for slowly growing M. tuberculosis were calculated from GC-MS data obtained from steady state [13C]glycerol labeling experiments by applying methodology similar to that used for BCG (Table S4). Again the flux values could not be determined unambiguously from the available labeling data and two best-fit solutions were obtained (Figure 8 and 9; Table S5). As found with BCG, the major differences between the two solutions were in the flux through gluconeogenesis, the pentose phosphate pathway and the output of acetyl CoA. Although the present data do not allow a unique flux solution, these data show that M. tuberculosis and BCG are operating the same route for pyruvate dissimilation which is characterized by flux through the glyoxylate shunt, synthesis of oxaloacetate primarily by an anaplerotic reaction from either phosphoenolpyruvate or pyruvate rather than via the TCA cycle and succinyl CoA synthetase for the generation of succinyl CoA . We have named this the GAS pathway (Figure 10) because of the usage of the Glyoxylate shunt, Anaplerotic fixation of carbon from CO2 and Succinyl CoA synthetase for the generation of succinyl CoA.


An interesting feature of the GAS pathway is the synthesis of oxaloacetate by anaplerotic reactions. These anaplerotic reactions involve assimilation of a carbon atom from CO2; so, to independently confirm this aspect of the flux solution we performed labeling experiments with [13C]sodium bicarbonate. Biomass samples were taken from steady state chemostat cultures of Mycobacterium tuberculosis growing at either fast or slow growth rate in media containing unlabeled glycerol and [13C]sodium bicarbonate. Because the rate of labeled and unlabeled CO2 uptake could not be accurately quantified (since bicarbonate is labile), it was not possible to perform full 13C-MFA analysis of these experiments. However, GC-MS analysis of the proteinogenic amino acids clearly demonstrated incorporation of the CO2-derived 13C into several amino acids including those derived from oxaloacetate, such as lysine (Table S4) at both the fast and slow growth rates, which is consistent with CO2 being fixed into biomass. Additionally, there were distinct differences in the degree of labeling of amino acids between fast and slow-growing cells. For instance, 22% of lysine is labeled with 13C at slow growth rate but 16% at fast growth rate. These ratios were reversed for methionine which is 16% labeled at fast growth rate but less than 5% at slow growth rate. These differences indicate growth rate-dependent shifts in the relative flux through anaplerotic carboxylating reactions.
Discussion
The demonstration that ICL was essential for the multiplication of M. tuberculosis in macrophages and mice [5], [6] was interpreted as further evidence that fats are the major carbon source for this pathogen in the human host. Subsequent studies and the data presented here demonstrate that the function of ICL extends beyond lipid metabolism and that this enzyme has a role in the central metabolism of mycobacteria [2], [10], [11]. Our results show that ICL's were utilized even when glycerol was the major carbon source and that disruption of just one of the two functional icl genes impairs the viability of M. bovis BCG growing slowly in a carbon limited chemostat. Although the strain behaved like the parental strain at the faster growth rate (corresponding to a doubling time of 23 h), disruption of the icl1 gene resulted in a loss of viability at the slower growth rate (corresponding to a doubling time of 69 h). This finding echoes the previous demonstration that persistence of the icl1 mutant was attenuated in mice [5] and suggests that slow growth in the chemostat may simulate some aspects of in vivo growth. It also demonstrates the value of the chemostat for identifying growth-rate dependent phenotypes.
The essential requirement of icl1 for adaptation of BCG to slow growth under glycerol limiting conditions was not due to an increased consumption of the hydrolysis products of the detergent Tween 80 which is added to mycobacterial cultures to minimize clumping. Although some Tween 80 was metabolized by BCG during carbon limited growth in a chemostat, the Tween 80 consumption rate was significantly lower at slow growth rate than at the faster growth rate. In addition, the Tween 80 consumption rate did not differ significantly between the wild type and BCGΔicl1. Whilst deletion of icl1did not reduce viability of M. bovis BCG at the faster growth rate in the chemostat, our findings indicate that the icl1 mutant had altered biomass yields and macromolecular composition, indicating that the icl1 gene is also playing a non-essential role in the physiology of BCG at the higher growth rate. Although it is unclear why the removal of icl1 results in an increased yield on glycerol it is consistent with similar findings for Escherichia coli where it was demonstrated that a functional icl gene was associated with a growth disadvantage in competition experiments in the chemostat [21]. The reduction in the carbohydrate content of the mutant cells indicate that the glyoxylate shunt may be involved in providing precursors for biosynthesis of non-essential carbohydrates. The metabolic cost of producing these carbohydrates is a possible explanation of the increased yield of the ICL mutant.
Using enzymatic methods and 13C-MFA we have identified a new route for pyruvate dissimilation which occurs in both BCG and M. tuberculosis, in which ICL is a key enzyme. The GAS pathway is characterized by flux through the glyoxylate shunt and also through the carbon fixing anaplerotic reactions at the PEP-pyruvate-oxaloacetate node (Figure 10). The very high flux through these ‘anaplerotic reactions’ are in excess of anaplerotic demands (Table S3) and therefore these reactions are also being used to oxidize pyruvate generated from glycolysis, in a similar manner to that described for the novel PEP-glyoxylate cycle in hungry E. coli [22], and to generate biomass. Another feature of the novel pathway is a very low flux through the succinate-oxaloacetate segment of the TCA cycle. Indeed it appears that most of the flux from the ICL reaction goes, not into the TCA cycle (to be used for catabolism), but into biosynthesis via succinyl CoA. Therefore under these conditions ICL plays an anabolic rather than a catabolic role (in fatty acid dissimilation). Given the importance of both ICL and PCK in the pathogenesis of the tubercle bacillus [6], [23] the discovery that it operates as part of this novel metabolic pathway is an important finding that may have implications for our understanding of how the tubercle bacillus survives in vivo. The fluxes through this novel pathway were significantly influenced by growth rate with a shift towards increased utilization of the glyoxylate shunt at slow growth rate accompanied by a diversion of precursors from synthesis of acetyl CoA to synthesis of succinate/succinyl CoA, which is consistent with our previous data indicating that the shift to slow growth rate is accompanied by changes in macromolecular composition [1]. Although two functioning ICL enzymes were identified in BCG, ICL2 has a significantly lower maximum activity [14] and, alone, may not be able to synthesize sufficient succinate/succinyl CoA for biosynthetic needs (e.g. synthesis of branched chain fatty acids), accounting for the observed essentiality of icl1 at slow growth rate. Indeed icl2 was unable to rescue an icl M. smegmatis mutant for growth on two carbon substrates or prevent the death of an icl1 mutant of M. tuberculosis during chronic TB infection in mice [5].
The ‘anaplerotic reactions’, PCK/PCA/MEZ, play a key role in the novel pathway we have described. These reactions may be used for gluconeogenesis but are also utilized to convert C3 acids to C4 acids. In E. coli this role is performed by phosphoenolpyruvate carboxylase but this enzyme is absent in M. tuberculosis. At the slow growth rate we found evidence that this function is performed primarily by PCK (operating in direction towards synthesis of oxaloacetate) in BCG and M. tuberculosis, as has been found for Bacillus subtilis [24]. This is interesting as PCK, like ICL is required for the growth of M. tuberculosis in macrophages and mice [23]. PCK catalyses the reversible conversion of oxaloacetate and phosphophoenolpyruvate and, with PCA and MEZ, controls the metabolic link between the TCA cycle and glycolysis represented by the PEP-pyruvate-oxaloacetate anaplerotic node. Previous data suggested that this enzyme predominantly functions in the gluconeogenic direction when M. tuberculosis is metabolizing glucose [23]. Here, we provide evidence that this enzyme can also operate anaplerotically during slow growth in a glycerol limited chemostat. Reversable fluxes from PEP to oxaloacetate would offer M. tuberculosis the metabolic flexibility to fine tune the balance of catabolic and replenishing reactions. This could be particularly important in the nutrient restricted human host.
At the fast growth rate, the flux solutions indicated that some carboxylating anaplerosis was catalysed by either PCA or MEZ. 13C-MFA was unable to distinguish which enzyme was responsible but we were unable to detect any activity of PCA in vitro. Although activity of this enzyme has been detected in Mycobacterium smegmatis [25] PCA activity has never been detected in either BCG or M. tuberculosis. However, the gene encoding this enzyme was identified as essential for growth of M. tuberculosis on media containing glycerol and glucose [26] and therefore we cannot rule out the possibility that the reaction conditions were not optimum for assaying this enzyme. The PCA of Corynebacterium glutamicum has been shown to be very unstable [27] and this may also be the case for BCG. Malic enzyme decarboxylates malate to pyruvate and is thought to be important in providing acetate and NADPH for the biosynthesis of lipids. Although this enzyme can function anaplerotically, in other bacteria it is generally thought to operate in the gluconeogenic direction. Low levels of MEZ activity was detected in the BCG cells but this activity was unaffected by growth rate. Recent 13C data has provided evidence for malic enzyme activity in M. tuberculosis [23] whereas early studies had suggested that activity was very low or absent in slow growing mycobacteria [17]. Further studies are required to elucidate precisely which enzymes are involved in these important reactions.
Isotopic tracer experiments using sodium [13C]bicarbonate confirmed that, in accordance with the flux solutions, an appreciable proportion (up to 22% incorporation in some amino acids after the addition of one volume of media containing sodium [13C]bicarbonate) of carbon in M. tuberculosis growing in a glycerol limited chemostat arises from CO2 fixation through carboxylation reactions. The estimated flux through carboxylating anaplerotic reactions is much more than the relatively modest requirement for anaplerotic replenishment of the TCA cycle intermediates due to their removal for amino acid synthesis (less than 1% of total flux) and suggests that fixed CO2 is being incorporated into other components of biomass, as well as amino acids. These data alongside a number of different studies provide evidence that CO2 fixation maybe important for the growth and virulence of M. tuberculosis. The stimulatory effect of CO2 on the growth of mycobacterium has been known for decades [28] and also 14C tracer experiments performed in the 1950's demonstrated that M. tuberculosis could use CO2 as a source of carbon [29], [30]. It has also been shown that physiological relevant levels of CO2 prevent the growth arrest of M. bovis BCG in a hypoxic model of persistence [31]. In addition, M. tuberculosis encodes three carbonic anhydrases, Rv1284, Rv3273 and Rv3588c which have a role in the growth and virulence of M. tuberculosis: Rv3588c is essential for growth in vivo [32] and Rv1284 is essential for in vitro growth [26] and was also highly upregulated in a starvation model of persistence [33]. These enzymes catalyse the reversible hydration of CO2 to bicarbonate and are associated with metabolic enzymes such as PCK, PCA and MEZ which produce or consume CO2 or bicarbonate.
It is unlikely that M. tuberculosis is operating either the Calvin, Wood-Ljungdahl or the 3-hydroxypropionate cycles to fix CO2 as this pathogen does not have a ribulose-bisphosphate carboxylase (RuBisCO) [34] and the genes for malyl CoA lyase or formate-tetrahydrofolate ligase are not annotated in the genome [35]. The presence of KOR and a gene homologous to the ATP-citrate lyase ß-chain (citE, Rv2498c) has led to suggestions that a reductive tricarboxylic acid cycle may function to fix CO2 in this bacterium [34], [36]. The flux solutions presented here do indeed suggest that at least the KOR reaction may operate in the reductive (carboxylating) direction in some circumstances. Operation of the entire reductive TCA pathway seems unlikely as M. tuberculosis lacks the α and γ-subunits of citrate lyase required for the reductive TCA and studies suggest that CitE functions in fatty acid biosynthesis [37]. The pattern of incorporation of bicarbonate-derived 13C differed between fast and slow growth rate, with lysine being the predominant labeled product at slow growth rate but methionine being the predominant labeled product at fast growth rate. The carbon backbone of both amino acids is derived from oxaloacetate supporting anaplerotic flux via PCK as being the predominant carboxylating reaction at both growth rates. However, as both amino acids do share the same four carbon backbone, the shift in label accumulation between lysine and methionine at slow and fast growth rate is puzzling. One possibility is that the difference is due to differences in the degree of labeling of the methyl group of methionine, which is not derived from oxaloacetate but via a methylation reaction performed by methionine synthase with methylated tetrahydrofolate being the C1 source. The ultimate source of the carbon atom in C1 metabolism of mycobacteria has however not been determined.
Conclusions
This study is the first to use 13C-MFA to investigate the metabolism of a mycobacterium. Using this method we identify a novel metabolic pathway operating in M. tuberculosis which we have named the GAS pathway (Figure 8) because it utilizes the glyoxylate shunt and anaplerotic reactions for oxidation of pyruvate combined with very low flux through the succinate – oxaloacetate segment of the TCA cycle. These results also add to a growing body of evidence which indicates that ICL is involved in processes beyond lipid metabolism in vitro, and probably also in vivo. We demonstrate that the fluxes through this novel pathway are influenced by growth rate such that one of the two ICL's becomes essential at slow growth rate. This essentiality is unrelated to lipid catabolism and appears to reflect an anabolic shift at slow growth rate, possibly towards synthesis of complex lipids. The relevance of these findings to the in vivo situation is demonstrated by our previous finding that adaptation M. tuberculosis to growth in macrophages also involves a shift to slow growth. The GAS pathway is also characterized by significant levels of CO2 fixation through anaplerotic reactions that generate oxaloacetate. We were able to confirm significant levels of CO2 fixation in M. tuberculosis. Given the importance of the glyoxylate shunt in the pathogenesis of the tubercule bacillus and the abundance of CO2 in the human host, the discovery of this novel pathway is an important finding that is likely to be relevant to the pathogenesis of tuberculosis.
Materials and Methods
Bacterial strains and growth conditions
M. bovis BCG strain (ATCC 35748) or Mycobacterium tuberculosis (H37Rv) was cultured in a 2 - l bioreactor (Adaptive Biosystem Voyager) under aerobic conditions and at pH 6.6 as previously described [1]. Chemostat cultures were grown in Roisin's minimal medium at a constant dilution rate of 0.03 h−1 (equivalent to a doubling time, td of 23 h) or 0.01 h−1 (td = 69 h). Culture samples were withdrawn from the chemostat to monitor cellular dry weight, viable counts, optical density, nutrient utilization and CO2 and O2 levels were measured in the exhaust gas [1]. After waiting five residence times at a particular dilution rate, the reactor was assumed to be at steady state if the OD, glycerol concentration, oxygen uptake rate and CO2 production rate were steady within a 15% range for 48 h. Once the steady state was reached cells were harvested for analysis.
The 13C labeling experiments were initiated after the chemostat culture was in steady state by replacing the feed medium with an identical medium containing a mixture of 1 ml [13C3]glycerol and 4 ml of natural glycerol l−1. For the carbon fixation chemostat experiments a modified Roisin's medium was used which contained 0.15% sodium bicarbonate [38]. After steady state was achieved the medium was replaced with an identical medium containing 0.15% sodium [13C]bicarbonate. Since CO2 is rapidly lost to air from a stirred solution of sodium bicarbonate, the chemostat air supply was made recyclable by connecting the effluent gas outlet to the air inlet. Oxygen concentrations were monitored carefully to ensure that oxygen levels remained above 70%. Biomass samples for GC-MS analysis were taken for analysis every volume change.
Culture analysis
Biomass and supernatant samples were collected and harvested [1]. Biomass was determined according to the method described by Lynch and Bushell [39]. The amounts of glycerol in the supernatant and in fresh medium were assayed by use of a commercial assay kit that employs a glycerokinase-coupled enzyme assay system (Boehringer Mannheim). To assay for Tween 80 supernatant samples were hydrolysed by boiling for 1 h in methanolic KOH (5% potassium hydroxide: 50% methanol). After neutralizing the samples with HCl the free fatty acids were assayed using a commercial kit (Roche). Non-hydrolysed samples were also analyzed to measure any free fatty acids present in the supernatant.
Macromolecular composition
The macromolecular composition of the cellular biomass was determined from freeze-dried cell pellets as previously described [1].
Strain construction
For the construction of an isocitrate lyase mutant, E. coli strain DH5α was grown in solid or liquid Luria-Bertani (LB) medium as described by Sambrook et al. [40]. M. bovis BCG cells were propagated in Middlebrook 7H9 broth or 7H11 agar containing 5% (v/v) OADC enrichment media supplement (Becton Dickenson), 0.5% glycerol plus 0.05% Tween 80 for liquid cultures. For mycobacteria, when selection was required, kanamycin at 20 µg ml−1, X-gal at 50 µg ml−1 and sucrose at 2% (w/v) were added to the culture media.
An unmarked isocitrate lyase mutant of M. bovis BCG was constructed using the strategy described by Parish and Stoker [41]. PCR was used to amplify two separate 1 kb DNA regions flanking the M. bovis BCG icl1 gene. These fragments were cloned into p2NIL to generate p2NIL-icl1. The final delivery vector was generated by cloning the Pac I cassette from pGOAL19 into the p2NIL-icl1 construct to give pUSicl1. Single crossovers were selected for on 7H11 agar supplemented with kanamycin and X-gal and then grown in media lacking antibiotics to allow the second recombination to occur. Following growth the cells were sub-cultured onto sucrose plates to select for sucrose-resistant white colonies, which had lost the integrated plasmid through a second crossover. PCR and Southern analysis were performed to verify the expected genotypes.
Analysis of in vitro enzyme activities
Crude enzyme extracts were prepared according to Tian et al (2005) with minor modifications [2]. Protein was assayed using the Bio-Rad DC protein assay kit and following the manufacturer's instructions. All reaction mixtures (1 ml) contained 100 µg of M. bovis BCG lysates.
Isocitrate dehydrogenase (ICDH)
ICDH was assayed as described [19].
Phosphoenolpyruvate carboxykinase (PCK)
The procedure described by Mukhopadhyay et al (2001) was used for assaying PCK activity in the direction of oxaloacetate formation [42].
Malic enzyme (malate dehydogenase, decarboxylating) (MEZ)
A modification of previously described procedures was used to assay for MEZ activity [17], [43], [44]. The reaction mixture contained 100 mM Tris-HCl (pH 7.8), 5 mM MnCl2, 40 mM sodium l-malate, 0.6 mM NADP+, 20 mM KCl. Reactions were monitored spectrophotometrically by following the production of NADPH at 340 nm (ε = 6.223 M−1 cm−1) at 30°C.
Pyruvate carboxylase (PCA)
PCA was assayed exactly as described [25].
Glycine dehydrogenase (GDH)
GDH was monitored by the method described by Wayne (1996) [45].
Construction of an isotopomer model of central metabolism in M. tuberculosis
An isotopomer model of central metabolism (Figure 3, Table S1) in M. tuberculosis and M. bovis BCG was constructed in the framework of 13CFlux [18] (http://www.13cflux.net/), a software toolbox for flux distribution estimation.
The model was based on our GSMN-TB genome-scale model [2] of M. tuberculosis and includes reactions of glycolysis (EMP), the pentose phosphate pathway (PPP), the tricarboxylic acid cycle (TCA) and anaplerosis (ANA). Moreover, all biosynthesis pathways relevant for M. tuberculosis are formulated in simplified form in that linear reaction sequences are combined into one reaction (Figure S1). The scrambling reaction tca6a/b is assumed to proceed in equal proportion. This metabolic network model was supplemented with carbon atom transitions and consisted of a total of 75 reactions. Flux values for net and exchange rates can be derived from 47 independent flux parameters (35 net +12 exchange) that are estimated using 137 labeling measurements (mass isotopomers of amino acids, Table S3) and 30 flux measurements obtained from biomass hydrolysates or calculated from intermediates (25 precursor requirements, (Table S4), (labeled) glycerol and Tween 80 uptake rates (Table 1) as well as the overall CO2 net production rate.
In order to incorporate enzyme activities, steady state data for experiments with different growth rates µS = 0.01 h−1 and µF = 0.03 h−1 are fitted in one model. This is achieved by doubling all reaction equations of the basic flux model (Figure S1). The two sub-models are then “loosely” connected via inequality constraints reflecting the tendencies of measured activities between slow and fast growth for the enzymes PCK, ICL and ICDH (see also results).
Biomass hydrolysate and preparation of amino acid derivatives
Biomass samples from the 13C labeled chemostat cultures were washed and hydrolysed as described by Borodina et al, 2008 [46]. The dried hydrosylate was dissolved in 1 ml norvaline solution (0.075 mM in 80∶20 H2O:MeOH). 0.1 ml was dried in-vacuo and this mixture was derivatised by adding 140 µl acetonitrile:N-tert-butyldimethylsilyl-N-methyltrifluoroacetamide (MTBSTFA):1% tert-butyldimethylchlorosilane (TBDMCSI), 1 : 1., sonicating (room temperature, 30 min) and then heating (90°C, 30 min) to complete the derivatisation. Samples were analysed by Gas Chromatography-Mass Spectrometry (GC-MS) within 72 h after derivitisation. The concentration of protein in each hydrolysate was determined using the Lowry method [47]. Bovine serum albumin was used as a standard and was included with each set of samples.
GC-MS analysis
The analysis was performed with a 6890N Network GC system (Agilent) fitted with a DB-5ms capillary column (15 m×0.18 mm internal diameter×0.18 µm film with 5 m Duraguard integrated guard column) and deactivated quartz wool packed FocusLiner (SGE) coupled to a Pegasus III time-of-flight (TOF) mass spectrometer (Leco) equipped with a splitless injector. The injector temperature was initially held at 70°C for 2 min followed by heating to 350°C at a rate of 17°C min−1. This temperature was held for 1.5 min. The flow was held constant at 1.4 ml He min−1. Injection volume, 5 µl. Inlet temperature, 250°C. Interface temperature, 310°C. Source temperature, 245°C. The system was operated with a mass range of 40–800 m/z at an EM voltage of 70 V with a spectral acquisition rate of 20 spectra s−1.
13C isotopologue abundances (i.e., 13C incorporation; 12Cn, 13C1, …, 13Cn) for each amino acid were determined for fragments containing the intact carbon skeleton for each amino acid; generally using the [M-57]+ ion. To obtain further information relating to the 13C incorporation at individual positions within individual amino acids, isotopologue abundances were also determined for fragments formed by cleavage of the C1–C2 bond in some samples. Within a subset of these, isotopologue abundances for the fragment formed by cleavage of the C2–C3 bond in serine were also determined allowing comprehensive characterization of the isotopic incorporation into serine. Mass spectra of the derivatized amino acids were corrected for the natural abundance of all stable isotopes.
Flux parameter estimation
Non-linear weighted least squares fitting is applied in order to determine the flux values which are the most likely description of the labeling data and biomass constraints [48]. Initial flux distributions are generated by Monte Carlo sampling and used for a multi-start optimization. For validation of the solution, flux or labeling measurements (whole groups, C2-Cn fragments or single measurements) that fit the least are combinatorially removed from the data set. Solutions obtained using the reduced data set that are consistent with the best fit gives an indication that the estimated flux values describe the experimental data set.
Statistical analysis
Based on normally distributed measurement errors, flux errors were calculated using a linearized statistical approach [48]. Phosphoglucose isomerise (PGI) and PCK were constrained to fitted values in order to determine confidence levels for the split ratio between glycolysis and the pentose phosphate pathway as well as the reaction cycle consisting of PCK, PCA/MEZ, pyruvate kinase (PK). These fluxes are comparably low and and so this was not a severe restriction. As is common practice all net fluxes in direction of biomass synthesis are likewise constrained. Resulting flux standard deviations are given in Table S4.
Supporting Information
Zdroje
1. BesteDJVPetersJHooperTAvignone-RossaCBushellME 2005 Compiling a molecular inventory for Mycobacterium bovis BCG at two growth rates: evidence for growth rate-mediated regulation of ribosome biosynthesis and lipid metabolism. J Bacteriol 187 1677 1684
2. BesteDJVHooperTStewartGBondeBAvignone-RossaC 2007 GSMN-TB: a web-based genome-scale network model of Mycobacterium tuberculosis metabolism. Genome Biol 8 R89
3. BesteDJVLaingEBondeBAvignone-RossaCBushellME 2007 Transcriptomic analysis identifies growth rate modulation as a component of the adaptation of mycobacteria to survival inside the macrophage. J Bacteriol 189 3969 3976
4. BesteDJVEspasaMBondeBKierzekAMStewartGR 2009 The genetic requirements for fast and slow growth in mycobacteria. PLoS ONE 4 e5349
5. McKinneyJDHonerzMunozEMiczakAChenB 2000 Persistence of Mycobacterium tuberculosis in macrophages and mice requires the glyoxylate shunt enzyme isocitrate lyase. Nature 406 735 738
6. Munoz-EliasEJMcKinneyJD 2005 Mycobacterium tuberculosis isocitrate lyases 1 and 2 are jointly required for in vivo growth and virulence. Nat Med 11 638 644
7. LorenzMCFinkGR 2001 The glyoxylate cycle is required for fungal virulence. Nature 412 83 86
8. LyeYMChanMSimTS 2005 Endorsing functionality of Burkholderia pseudomallei glyoxylate cycle genes as anti-persistence drug screens. J Mol Catal B: Enzymatic 33 51 56
9. Munoz-EliasEJUptonAMCherianJMcKinneyJD 2006 Role of the methylcitrate cycle in Mycobacterium tuberculosis metabolism, intracellular growth, and virulence. Mol Micro 60 1109 1122
10. GengenbacherMRaoSPSPetheKDickT 2010 Nutrient-starved, non-replicating Mycobacterium tuberculosis requires respiration, ATP synthase and isocitrate lyase for maintenance of ATP homeostasis and viability. Microbiology 156 81 87
11. BaughnADGarforthSJVilchzeCJacobsWR 2009 An anaerobic-type α-ketoglutarate ferredoxin oxidoreductase completes the oxidative tricarboxylic acid cycle of Mycobacterium tuberculosis. PLoS Pathog 5 e1000662
12. LiuZWangQZhaoX 2008 Metabolic flux analysis of yfiD gene knockout Escherichia coli based on 13C-labeling experiments under anaerobic conditions. J Biotech 136 S34
13. DaunerMStorniTSauerU 2001 Bacillus subtilis metabolism and energetics in carbon-limited and excess-carbon chemostat culture. J Bacteriol 183 7308 7317
14. BentrupKHZMiczakASwensonDLRussellDG 1999 Characterization of activity and expression of isocitrate lyase in Mycobacterium avium and Mycobacterium tuberculosis. J Bacteriol 181 7161 7167
15. GarnierTEiglmeierKCamusJCMedinaNMansoorH 2003 The complete genome sequence of Mycobacterium bovis. Proc Natl Acad Sci U S A 100 7877 7882
16. WayneLGLinKY 1982 Glyoxylate metabolism and adaptation of Mycobacterium tuberculosis to survival under anaerobic conditions. Infect Immun 37 1042 1049
17. SeshadriRSuryanarayanaMVenkitasubramanianTA 1978 Role of malic enzyme in mycobacteria: Part I–Malic enzyme & its relationship to growth rate & intracellular level of NADPH. Indian J Biochem Biophys 15 277 281
18. WiechertWMollneyMPetersenSrde GraafAA 2001 A universal framework for 13C metabolic flux analysis. Met Eng 3 265 283
19. TianJBrykRItohMSuematsuMNathanC 2005 Variant tricarboxylic acid cycle in Mycobacterium tuberculosis: Identification of α-ketoglutarate decarboxylase. Proc Natl Acad Sci USA 102 10670 10675
20. de CarvalhoLPZhaoHDickinsonCEArangoNMLimaCD 2010 Activity-based metabolomic profiling of enzymatic function: Identification of Rv1248c as a mycobacterial 2-hydroxy-3-oxoadipate synthase. Chem Biol 17 323 332
21. Prasad MaharjanRYuPLSeetoSFerenciT 2005 The role of isocitrate lyase and the glyoxylate cycle in Escherichia coli growing under glucose limitation. Res Micro 156 178 183
22. FischerESauerU 2003 A novel metabolic cycle catalyzes glucose oxidation and anaplerosis in hungry Escherichia coli. J Biol Chem 278 46446 46451
23. MarreroJRheeKYSchnappingerDPetheKEhrtS 2010 Gluconeogenic carbon flow of tricarboxylic acid cycle intermediates is critical for Mycobacterium tuberculosis to establish and maintain infection. Proc Natl Acad Sci USA 107 9819 9824
24. ZamboniNMaaheimoHSzyperskiTHohmannHPSauerU 2004 The phosphoenolpyruvate carboxykinase also catalyzes C3 carboxylation at the interface of glycolysis and the TCA cycle of Bacillus subtilis. Metab Eng 6 277 284
25. MukhopadhyayBPurwantiniE 2000 Pyruvate carboxylase from Mycobacterium smegmatis: stabilization, rapid purification, molecular and biochemical characterization and regulation of the cellular level. Biochim Biophys Acta 1475 191 206
26. SassettiCMBoydDHRubinEJ 2003 Genes required for mycobacterial growth defined by high density mutagenesis. Mol Micro 48 77 84
27. Peters-WendischPGWendischVFPaulSEikmannsBJSahmH 1997 Pyruvate carboxylase as an anaplerotic enzyme in Corynebacterium glutamicum. Microbiology 143 1095 1103
28. SchaeferWBCohnMLMiddlebrookG 1955 The roles of biotin and carbon dioxide in the cultivation of Mycobacterium tuberculosis. J Bacteriol 69 706 712
29. NishiharaH 1954 Studies on the metabolism of the tubercule bacillus with the use of radioactive substrates in the presence and absence of streptomycin. J Biochem 41 167 181
30. LongERAndersonRJRittenbergDKarnovskyMLHendersonHJ 1955 The carbon metabolism of the tubercule bacillus. Am Rev Tuberc 71 609 615
31. FlorczykMAMcCueLAPurkayasthaACurrentiEWolinMJ 2003 A family of acr-coregulated Mycobacterium tuberculosis genes shares a common DNA motif and requires rv3133c (dosR or devR) for expression. Infect Immun 71 5332 5343
32. RengarajanJBloomBRRubinEJ 2005 Genome-wide requirements for Mycobacterium tuberculosis adaptation and survival in macrophages. Proc Natl Acad Sci USA 102 8327 8332
33. BettsJCLukeyPTRobbLCMcAdamRADuncanK 2002 Evaluation of a nutrient starvation model of Mycobacterium tuberculosis persistence by gene and protein expression profiling. Mol Microbiol 43 717 731
34. ParkSWHwangEHParkHKimJAHeoJ 2003 Growth of mycobacteria on carbon monoxide and methanol. J Bacteriol 185 142 147
35. ColeSTBroschRParkhillJGarnierTChurcherC 1998 Deciphering the biology of Mycobacterium tuberculosis from the complete genome sequence. Nature 393 537 544
36. SrinivasanVMorowitzHJ 2006 Ancient genes in contemporary persistent microbial pathogens. Biol Bull 210 1 9
37. GouldingCWBowersPMSegelkeBLekinTKimCY 2007 The structure and computational analysis of Mycobacterium tuberculosis protein CitE suggest a novel enzymatic function. J Mol Biol 365 275 283
38. FregnanGBSmithDWRandallHM 1961 Biological and chemical studies on mycobacteria: Relationship of colony morphology to mycoside content for Mycobacterium kansasii and Mycobacterium fortuitum. J Bacteriol 82 517 527
39. LynchHCBushellME 1995 The physiology of erythromycin biosynthesis in cyclic fed batch culture. Microbiology 141 3105 3111
40. SambrookJFritschEFManiatisT 1989 Molecular Cloning: A Laboratory Manual. Cold Spring Harbor, New York Cold Spring Harbor Laboratory Press
41. ParishTStokerNG 2000 Use of a flexible cassette method to generate a double unmarked Mycobacterium tuberculosis tlyA plcABC mutant by gene replacement. Microbiology 146 1969 1975
42. MukhopadhyayBConcarEMWolfeRS 2001 A GTP-dependent vertebrate-type phosphoenolpyruvate carboxykinase from Mycobacterium smegmatis. J Biol Chem 276 16137 16145
43. GourdonPBaucherMFLindleyNDGuyonvarchA 2000 Cloning of the malic enzyme gene from Corynebacterium glutamicum and role of the enzyme in lactate metabolism. Appl Environ Microbiol 66 2981 2987
44. SeshadriRSuryanarayanaMVenkitasubramanianTA 1978 Role of malic enzyme in mycobacteria: Part II–Purification & properties of malic enzyme from Mycobacterium smegmatis. Indian J Biochem Biophys 15 282 285
45. WayneLGHayesLG 1996 An in vitro model for sequential study of shiftdown of Mycobacterium tuberculosis through two stages of nonreplicating persistence. Infect Immun 64 2062 2069
46. BorodinaISiebringJZhangJSmithCPvan KeulenG 2008 Antibiotic overproduction in Streptomyces coelicolor A3(2) mediated by phosphofructokinase deletion. J Biol Chem: 283 25186 25199
47. LowryOHRosebroughNJFarrALRandallRJ 1951 Protein measurement with the folin phenol reagent. J Biol Chem 193 265 276
48. WiechertWSiefkeCde GraafAAMarxA 1997 Bidirectional reaction steps in metabolic networks: II. Flux estimation and statistical analysis. Biotechnol Bioeng 55 118 135
Štítky
Hygiena a epidemiologie Infekční lékařství LaboratořČlánek vyšel v časopise
PLOS Pathogens
2011 Číslo 7
- Parazitičtí červi v terapii Crohnovy choroby a dalších zánětlivých autoimunitních onemocnění
- Vakcíny proti klíšťové encefalitidě
- Kdy je nejlepší očkovat
- Možné vedlejší účinky očkování
- Imunogenita vakcín
Nejčtenější v tomto čísle
- Requires Glycerol for Maximum Fitness During The Tick Phase of the Enzootic Cycle
- Comparative Genomics Yields Insights into Niche Adaptation of Plant Vascular Wilt Pathogens
- The Role of IL-15 Deficiency in the Pathogenesis of Virus-Induced Asthma Exacerbations
- “Persisters”: Survival at the Cellular Level
Zvyšte si kvalifikaci online z pohodlí domova
Mazová zátka a její řešení
nový kurzVšechny kurzy