
Genome-Wide Association Study of Golden Retrievers Identifies Germ-Line Risk Factors Predisposing to Mast Cell Tumours
Pet dogs develop many of the same diseases as humans. Hence, studying diseases in dogs can be valuable for learning about human conditions. The genetic structure caused by inbreeding within dog breeds has proven to be advantageous to map genetic diseases. Golden retrievers have a very high risk of developing mast cell tumours suggesting that there is a genetic background for this disease. In the present study we investigated genetic risk factors for this disease in golden retrievers. We identified three regions of the genome predisposing to the development of mast cell tumors. A candidate mutation in the GNAI2 gene was found to change the form of this gene. The disease associated regions also harbour multiple hyaluronidase genes (HYAL1, HYAL2 and HYAL3 on cfa20 and HYAL4, SPAM1 and HYALP1 on cfa14) suggesting that turnover of hyaluronic acid plays an important role in the development of CMCT. Human mastocytosis shares many characteristics with canine mast cell tumours and we believe our findings can help clarifying the biology behind this disease in humans as well as identifying new therapeutic targets.
Published in the journal:
. PLoS Genet 11(11): e32767. doi:10.1371/journal.pgen.1005647
Category:
Research Article
doi:
https://doi.org/10.1371/journal.pgen.1005647
Summary
Pet dogs develop many of the same diseases as humans. Hence, studying diseases in dogs can be valuable for learning about human conditions. The genetic structure caused by inbreeding within dog breeds has proven to be advantageous to map genetic diseases. Golden retrievers have a very high risk of developing mast cell tumours suggesting that there is a genetic background for this disease. In the present study we investigated genetic risk factors for this disease in golden retrievers. We identified three regions of the genome predisposing to the development of mast cell tumors. A candidate mutation in the GNAI2 gene was found to change the form of this gene. The disease associated regions also harbour multiple hyaluronidase genes (HYAL1, HYAL2 and HYAL3 on cfa20 and HYAL4, SPAM1 and HYALP1 on cfa14) suggesting that turnover of hyaluronic acid plays an important role in the development of CMCT. Human mastocytosis shares many characteristics with canine mast cell tumours and we believe our findings can help clarifying the biology behind this disease in humans as well as identifying new therapeutic targets.
Introduction
Mastocytosis is a term that covers a broad range of human conditions involving the uncontrolled proliferation and infiltration of mast cells in tissues. A common characteristic for these diseases is a high frequency of activating mutations in the C-KIT oncogene [1–3]. An intriguing feature of the disease spectrum is its ability to spontaneously resolve despite having a mutation in an oncogene, as seen commonly in the juvenile condition [4].
Mastocytosis in adults can be accompanied by additional haematological abnormalities and a reduced life expectancy [5]. In addition, the disease has major adverse effects on life quality for the affected individuals [6]. The most severe forms of mastocytosis, such as mast cell leukaemia, are considered very malignant and are associated with a poor prognosis due to a lack of treatment options [1,2].
CMCT shares many phenotypic and molecular characteristics with mastocytosis, including paraclinical and clinical manifestations, and a high prevalence of activating C-KIT mutations [7,8]. CMCT in dogs thus provides a good naturally occurring comparative disease model for studying mastocytosis [9,10]. As reported in humans [1,11,12], there is evidence for germ-line risk factors in dogs as specific breeds, including golden retrievers, Labrador retrievers, boxers and Chinese shar-pei, have a high frequency of CMCT [13,14]. Current treatment options for CMCT encompass radical surgery alone, or in combination with chemotherapy or radiotherapy. The tyrosine kinase inhibitors masitinib and toceranib are licensed for treatment of non-resectable CMCT [9]. Human mastocytosis on the other hand is often not responsive to tyrosine kinase inhibitors, as the common V816D C-KIT mutation makes this receptor resistant to the classical tyrosine kinase inhibitors [3].
The behaviour of mast cell tumours in dogs is difficult to predict and accurate prognostication is challenging despite current classification schemes based on histopathology [15,16]. Mastocytosis is commonly seen as a systemic or generalized cutaneous disease whilst CMCT are commonly solitary masses, which are localized in the skin. These spread via the lymphatic system to local lymph nodes and visceral organs such as liver spleen and kidneys [9]. Interestingly haematological spread of CMCT to the lungs has never been reported suggesting that these tumours spread solely via the lymphatic system rather than via a haematogenous route. In humans germline C-KIT mutations have been detected in familial mastocytosis [1]. There is no published research regarding predisposing germline mutations in dogs.
Modern dog breeds have been created by extensive selection for certain phenotypic characteristics. As a side effect, unwelcomed traits like diseases have also been enriched in different breeds. The recent bottlenecks during breed creation have given rise to extensive linkage disequilibrium (LD) within breeds [17]. Furthermore, as a result of the reduced genetic heterogeneity, the number of genetic risk factors is limited within a breed, thereby reducing the genetic complexity. These characteristics of the dog genome enable efficient disease mapping within a breed, using fewer markers and individuals compared to human studies and reducing the required sample numbers from thousands to hundreds [17,18].
The aim of this study was to identify genetic risk factors for CMCT in dogs. We carried out a genome wide association study (GWAS) comparing 107 healthy geriatric golden retrievers with 124 golden retrievers affected with CMCT. Samples were collected from Europe and the US, representing two populations from separate continents. This allowed us to identify two different significantly associated loci in the two populations each of which harbours three of the six hyaluronidase genes. Subsequent targeted sequencing and fine mapping was carried out in the associated regions and identified at least one compelling disease-associated variant.
Results
Genome-wide association testing
We conducted a case-control GWAS of 273 golden retrievers (GR) to find candidate regions associated with CMCT. After quality control and removal of related individuals, the final data set included a total of 124 cases and 107 controls with low levels of relatedness (genetic relationship matrix value <0.25) within the two subpopulations, and high genotype call rates (>90%). Two individuals were removed due to low genotyping rate, 40 individuals where removed due to high levels of relatedness. The multidimensional scaling plot (MDS) showed that the American and European GRs form two distinct clusters, indicating genetic differentiation between the populations on different continents (Fig 1A). This implies that the CMCT predisposition could have different genetic causes in the two populations. MDS plots for the two groups analysed separately indicated no outliers or substantial stratification within either cohort (Fig 1B and 1C).

The two cohorts were first analysed separately, and then together using a mixed model approach. Essentially no genomic inflation was detected in the US and EU analysis, as evidenced by the QQ plots and genomic inflation factor (λ = 1.01 for both EU and US respectively, Fig 2). The Manhattan plots for the two different populations (Fig 2A and 2B) showed one major associated locus for each population. However, the two loci were not overlapping, but are on two different chromosomes (cfa14 and 20), suggesting that different genetic risk factors are influencing the two populations of GRs.
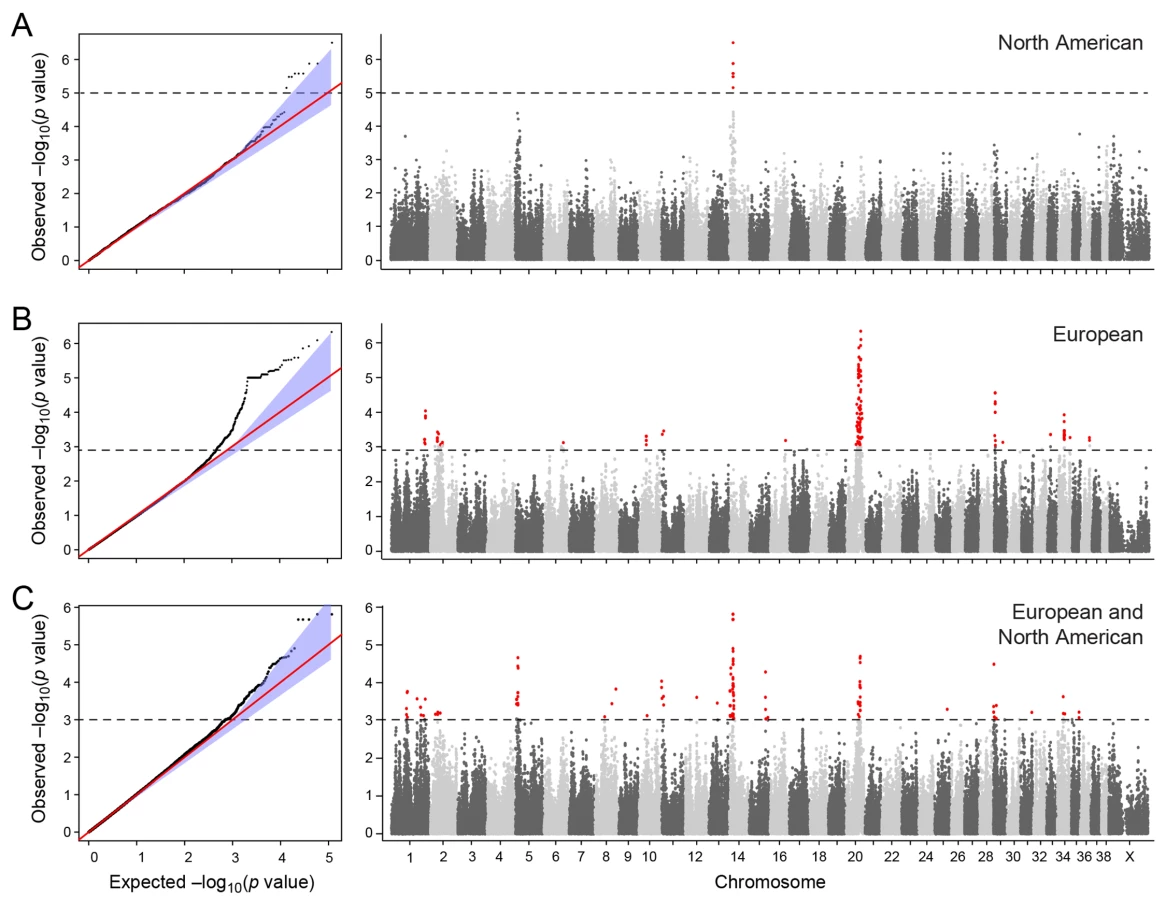
The American GR association analysis (ncases = 59, ncontrols = 45) resulted in one significantly associated region on cfa14 (nominal significance threshold at -log p>5.0, based on the deviation in the QQ plot, Fig 2A). Nine SNPs were found to be significantly associated with CMCT (Fig 3), with the strongest association (p = 3.2x10⁻⁷, pperm = 0.03) at CanFam2.0 cfa14 : 14,714,009 bp conferring a substantial risk effect (OR = 5.3). The risk allele frequency for the most associated SNP was 0.86 in cases and 0.53 in control GRs, and all cases except for one carry at least one copy of the risk genotype (S1A Fig). However, this case is heterozygous for the European GR risk alleles. The five SNPs with the strongest association are presented in Table 1, and all significantly associated SNPs are listed in S1 Table. All of the significant SNPs on chromosome 14 show high LD with the most associated SNP (Fig 3C) and nine SNPs form a risk haplotype spanning 111 kb (14.64–14.76 Mb) containing only three genes; SPAM1, HYAL4 and HYALP1. Notably, the genes are all hyaluronidase enzymes. The top SNP is located within the 2nd intron of the HYALP1 pseudogene.


In the European population (ncases = 65, ncontrols = 62), chromosome 20 showed the strongest association, while ten chromosomes showed nominal significance (-log p>2.9, based on the QQ-plot, Fig 2B). The nominal significance determines that there are associated SNPs below the nominal significance threshold, however not all p-values below this level are significant. The strong signal from chromosome 20 suggest that this region has a high probability of being associated, while only some of the less significant regions may be truly associated. On chromosome 20, 167 SNPs spanning 20 Mb (33.9Mb–53.1Mb) showed nominal significance. They form two major loci at 42Mb (most associated SNP p = 1.4x10⁻⁶, pperm = 0.039, OR = 6.3, cfa20 : 42,547,825 bp) and 48Mb (strongest associated SNP p = 4.3x10⁻⁷, pperm = 0.022, OR = 4.1, cfa20 : 48,599,799 bp). Analysis of the LD in the area shows that the top SNPs in each region are in high LD with nearby SNPs, but low LD (r2<0.2) with SNPs in the other peak (Fig 4). The risk allele frequency for the SNP at 42Mb is high, with an allele frequency of 0.92 in cases and 0.64 in controls. However, the risk allele at 48Mb is less common, with a frequency of 0.65 in cases and 0.31 in controls. The discrepancy in allele frequencies supports the inference that the associated loci are independent and could harbour separate risk factors for CMCT. The differences in risk haplotype frequencies are also evident from the minor allele frequency plot (Fig 4B). The minor allele frequency is reduced around 42Mb, indicating a reduction in genetic diversity, possibly due to selection in that region. The candidate region contains nearly 500 genes and corresponds to human chromosome 3p21, a region often affected by chromosomal abnormalities in cancer [19]. The most associated SNP at 48Mb falls between the MYO9B and HAUS8 genes and, interestingly, there is a cluster of hyaluronidase genes (HYAL1, HYAL2 and HYAL3) positioned within the association locus at 42Mb. As expected the GWAS analysis of the full cohort (ncases = 124, ncontrols = 107) showed partial overlap with the results from the American and European subsets and resulted in a decrease in the p-values for both cfa 20 and 14 (Fig 2C). Full cohort analysis resulted in a residual genomic inflation after correction (λ = 1.03).

Sequence capture and fine mapping
Hybrid capture and subsequent Illumina sequencing of the most associated GWAS regions were performed in order to identify all variants in the regions. In total 3,357 variants were identified in 0.9 Mb on chromosome 14 and 16,972 variants were identified in 5.5 Mb on chromosome 20, including both INDELs and SNPs. The 132 SNPs selected for fine mapping were located on cfa 14 in the 14 Mb region (30 SNPs), on cfa 20 in the 42Mb region (38 SNPs), and on cfa 20 in the 48 Mb region (64 SNPs). Fine mapping was performed on DNA from 384 dogs. Twenty-eight SNPs were filtered out due to low genotyping rate (>0.7). This high number was due in part to the presence of repeat elements or duplicated sequences in the proximity of the SNP, allowing primers to align to more than one region in the genome. Six SNP’s were not polymorphic in the sequencing data but were chosen for genotyping because of their interesting location. These SNPs were excluded from further association analysis as all genotyped individuals carried the alternative allele. Five individuals were removed for a low genotyping rate (<50%) and 4 control individuals were removed, as they were no longer deemed suitable as controls due to development of a secondary malignancy, these individuals were not included in the original GWAS analysis. After filtering, DNA samples from 375 individuals remained for analysis, comprising 245 American dogs (100 cases, 145 controls) and 130 European dogs (65 cases, 65 controls). The DNA samples were from dogs included in the GWAS analysis and additional American individuals. Related individuals were not excluded from the analysis.
The American GR population showed the strongest fine mapping association to a SNP at cfa14 : 14,644,897 (piPLEX(US) = 6.4x10⁻⁸, pperm = 9.0 x10⁻⁶). This is one of the original GWAS SNPs (pGWAS(US) = 3.3x x10-6) that formed part of the original GWAS risk haplotype. Six SNPs showed a strong association (p <10−7) and formed a high LD haplotype narrowing the associated risk haplotype to a 60kb region encompassing the HYAL4 and SPAM11 genes (S2 and S4A Figs). Among the most associated SNPs in the HYAL4 gene were three coding SNPs (cfa14 : 14,685,543, cfa 14 : 14,685,602, cfa14 : 14,685,771), of which 14 : 14,685,543 was a GWAS SNP. All three mutations in the HYAL4 gene cause amino acid changes, which are predicted as benign (score < 0.2, PolyPhen-2). A less associated coding SNP in the SPAM1 gene (cfa14 : 14,653,880) was also found, which causes an amino acid change, which is predicted to be damaging (score 0.91, PolyPhen-2). This mutation is more prevalent in cases than controls, although the SNP is not in high LD with the risk haplotype. The most associated GWAS SNP from the American analysis (pGWAS(US) = 3.2x10⁻⁷, cfa14 : 14,714,009 bp), was included in the fine mapping (pIPLEX(US) = 4.08x10⁻⁶), and was found to be the 7th most associated SNP (S2 Table and S4A Fig).
An outstanding causal variant for the cfa14 14Mb association with CMCT in US GRs has yet to be identified. However, the associated haplotype traversing the region could be used as a predictive marker for development of CMCT in US GR dogs. Only a subset of the variants identified from the hybrid capture, were included in the fine mapping. Some coding SNPs in the SPAM1 and HYAL4 genes were not included in the fine mapping due to constraints of the design.
The European population showed the strongest fine mapping association to a SNP (cfa20 : 42,080,147, p = 2.0x10⁻¹⁵, pperm <0.00001). This SNP showed an association p = 7.0 x10⁻⁴ when the US dogs were analysed alone. When the US and European data were analysed together a lower p-value was seen (cfa20 : 42,080,147, p = 2.2x10⁻¹⁶, pperm<0.00001). Interestingly this SNP is not in LD with the surrounding SNPs and appears to be a recent mutation, which is present only on the risk haplotype (S4B Fig). All but two European cases carry a copy of the risk allele (allele frequencies: cases = 0.83, controls = 0.35). However, the allele is rare in both cases and controls in the US population (allele frequencies: cases = 0.07, controls = 0.01) (S2 and S3 Tables and S5A Fig). The SNP is a synonymous SNP located at the final position in exon 3 of the Guanine Nucleotide Binding Protein (G Protein) Alpha Inhibiting Activity Polypeptide 2 (GNAI2). This changes the last base from a guanine (G) to an adenine (A). A splice site prediction software (Alternative Splice Site Predictor [20]) predicted this variant to change the site from a constitutive donor splice site to a suboptimal donor site.
The second most associated SNP (cfa20 : 42,131,456 p = 7.7x10⁻⁶) in the European analysis forms a long haplotype with 12 other fine mapping SNPs in high LD, traversing the region across the hyaluronidase genes in the 42MB region (S4C Fig). This SNP is a conserved, coding synonymous SNP located in exon four of the GNAT1 gene (amino acid D98).
The GWAS identified the strongest association to the cfa20 48Mb region in the European population. In the fine mapping the association to the cfa20 48Mb region is less noteworthy than the association to the cfa20 42Mb region. The two most associated SNPs (cfa20 : 48,599,799 and cfa20 : 49,201,505) from the GWAS were included in the fine mapping. The SNP cfa20 : 49,201,505 was found to have the lowest p value of the SNPs located in the 48Mb region piplex_EU = 2.1x10⁻⁵. This SNP was found to be the 4th most associated SNP in the European analysis. S3 Table summarises the results of association testing in the European population and the combined European and US population.
Phenotypic correlation with risk genotype
Phenotypic data such as age of onset, mast cell tumour grade and disease outcome was available for some of the cases. As the samples were collected from multiple institutions and the format of reporting was variable. For the European population the mean age of disease onset varied significantly between dogs which were homozygous versus heterozygous for the GNAI2 risk SNP. Mean age of onset homozygous: 5.6 ± 0.4, n = 43, heterozygous: 7.6 ± 0.5, n = 17, p = 0.0073 as determined by unpaired t-test statistics. Only two dogs were homozygous for the protective allele and hence this was too little for statistical analysis. For the United States population age of onset was only available for 15 dogs and hence reliable test statistics could not be performed.
Hyaluronan staining in normal and mast cell tissue
The GWAS analysis suggested that the breakdown of hyaluronic acid may play a role in the development of CMCT. We hence wanted to evaluate if hyaluronan formed part of the extracellular matrix of CMCT. Immunohistochemistry was performed on 12 mast cell tumour samples from GRs and on normal control tissues (skin and pannicular fat) from an unaffected dog. As seen in S9A and S9B Fig, immunohistochemistry confirmed that the mast cell cytoplasmic membrane does stain intensely positive for hyaluronan confirming that indeed hyaluronan forms part of the mast cell cytoplasmic membrane. Dermal and pannicular collagen directly adjacent to the mast cell tumour is increased and showed more intense staining of the intercellular/extracellular matrix. In comparison, normal dermal and pannicular tissue stained only mildly positive for hyaluronan, except for the basal membranes of the epidermis, which is known to contain hyaluronan, and which stained intensively positive (S9C and S9D Fig).
Identification and confirmation of an alternative splice site in the GNAI2 gene
RNA sequencing of a CMCT and a normal cutaneous tissue sample was carried out in order to identify alternative transcript isoforms, and to evaluate which genes are expressed in CMCT. The CMCT was borne by a GR known to be homozygous for the variant SNP at cfa20 : 42,080,147 in the GNAI2 gene that is predicted to change the site from a constitutive donor splice site to a suboptimal donor site. An alternative isoform of the GNAI2 gene was identified by visual examination of the TopHat [21] output in IGV. This alternative isoform skips exon 3, showing that the identified cfa20 : 42,080,147 variant does change the splicing at this site. Quantitative PCR was performed on cDNA samples from 9 GRs using splice-specific primers traversing both the normal and the alternative splice site (S6 and S7 Figs). As seen in Fig 5, PCR products for the alternative splice form, were only detected in the individuals carrying one or more copies of the A allele at the cfa20 : 42,080,147 position. On average, the wild-type isoform was expressed at a 6.9-fold greater level than the alternatively spliced version as calculated by the difference in CT values between the normal and alternative splice products in homozygous individuals. The alternative splicing, splices out of frame and is predicted to produce a truncated protein, changing the open reading frame from 356 aa to 109 aa.

The RNA sequencing data also confirmed that GRs express the hyaluronidase genes. The HYAL1, HYAL2, HYAL3 and SPAM1 genes were expressed in both the CMCT and marginal normal tissue, but the HYAL4 and HYALP1 genes showed no evidence of expression in either tissue.
Discussion
We identified genetic associations between CMCT and three different loci for American and European GR populations. The American population had the strongest association to a locus on chromosome 14 in which the hyaluronidase genes HYAL4 and SPAM1, and the pseudogene HYALP1, are located. The European population showed association to two separate regions on chromosome 20 located around 42Mb and 48Mb, of which the 42Mb region harbours the remaining hyaluronidase genes HYAL1, HYAL2 and HYAL3.
Sequence capture of the associated regions, in a small subset of individuals, identified thousands of variants, of which a large subset in each region followed the GWAS predicted risk haplotype. Fine mapping with additional markers narrowed down the risk haplotype on chromosome 14 from 111kb to a 60kb region, harbouring the SPAM1 and HYAL4 genes. The strongest associated SNP from the fine mapping on cfa14, was one of the original GWAS SNPs, BIC2G630521696 cfa14 : 14,756,089. Although the majority of candidate variants were included in the fine mapping in this region, including three coding SNPs in the HYAL4 gene and one coding SNP in the SPAM1 gene, there were several candidate variants, which could not be included in the fine mapping. For instance, a non-synonymous coding SNP in the SPAM1 gene and a SNP 227bp downstream of the SPAM1 gene could not be evaluated. Based on this and the strong LD in the region we have identified a predisposing haplotype, but not the causative variant yet. Future work will focus on further restriction of the identified risk haplotype with the aim to pinpoint the causative variant that could potentially be used to predict risk for CMCT development.
In the European population, the two associated loci located at 42 and 48Mb on cfa 20, respectively, were shown to be independent. Low LD was found between the SNPs in the two regions and the allele frequencies were also different, which suggest that they are independent and potentially contain separate risk factors for CMCT. Fine mapping of the relatively large 48Mb region did not narrow down the risk haplotype and the most associated SNP in the region was BICF2P623297 cfa20 : 49,201,505, which was one of the original GWAS SNPs. Fine mapping of the 42Mb region identified the cfa20 : 42,080,147 SNP strong association with CMCT in the European population and also mild association in the US GRs where it was rare. This SNP was not in LD with any of the other SNPs in the region although it was located only on the GWAS risk haplotype and hence it is likely to be a recent mutation on the risk haplotype. This SNP causes a change in a splice site in exon 3 of the GNAI2 gene resulting in the production of an alternative transcript isoform through the skipping of the third exon. This alternative splice isoform splices out-of-frame and therefore introduces a stop codon at amino acid position 109 resulting in a truncated GNAI2 protein. Expression analysis of the GNAI2 gene, using splice specific primers, confirmed the presence of alternative splice isoforms in individuals carrying the mutation. As the normal isoform for this gene is still expressed in individuals carrying the risk genotype it is not known what effect the alternatively spliced protein will have. GNAI2 belongs to a group of proteins, which regulate receptor signalling by controlling adenylyl cyclase activity [22]. GNAI2 has frequently been linked to cancer and is also known as the gip2-oncogene [23]. Suppression of GNAI2 has been detected in ovarian cancer [24] and somatic GNAI2 mutations have been identified in diffuse large B-cell lymphoma [25]. GNAI2 is highly expressed in the human mastocytoma cell line HMC-1 (The Human Protein Atlas [26]), as confirmed by both antibody staining and mRNA expression. We also found that GNAI2 was expressed in a GR mast cell tumour, and marginal normal tissue. We have not been able to determine in this study whether the truncated GNAI2 protein has a direct detrimental effect, or whether a loss of function from the truncation results in reduced regulation of adenylyl cyclase and increase activity of certain cellular pathways. This question warrants further study.
The coincidence that the two loci identified in the American and European GR populations, each contain three of the known six hyaluronidase genes, has lead us to hypothesize that hyaluronan turnover could play a role in CMCT predisposition. Interestingly, the Chinese shar-pei dog, which has an increase in hyaluronan accumulation in the skin due to a duplication upstream of the HAS2 gene [27], also has an increased risk of developing CMCT. Furthermore, the naked mole rat has a decreased activity of hyaluronan degrading enzymes, which is believed to contribute to its longevity and resistance to cancer [28].
It is not known whether the GNAI2 variant, located almost 20kb away from the hyaluronidase cluster, also has an effect on the hyaluronidase genes, or if this is a separate risk factor recently acquired by the risk haplotype. It has been shown that the human region (3p21.31), which is autologous to the canine cfa20 42Mb region, has been under selection in East Asians. This is thought to be due to HYAL2 and its functions in the cellular response to UV-B light exposure [29]. It is possible that the low minor allele frequency in the hyaluronidase gene-containing areas of the genome in the golden retriever is a sign of selection. We speculate that the selection could be related to reproductive fitness, as the hyaluronidase genes play a role in reproduction [30,31].
Early studies of mast cells suggested that these cells contain hyaluronan. A correlation between the presence of hyaluronan and mast cells has been documented, and hence it was natural to believe that mast cells were the source of the hyaluronan [32,33]. However, later studies show that there is no evidence of mast cells producing hyaluronan in vitro [34]. Hyaluronan is broken down on the cell surface to smaller molecules by hyaluronidase [35], and the fragmented hyaluronan is then taken into the lysosomes of the cell and there further broken down by intracellular hyaluronidase. We find it plausible that mast cells interact with hyaluronan and play a role in hyaluronan turnover. Concordant with that, our CMCT RNA sequencing demonstrated expression of all the hyaluronidase genes except HYAL4 and HYALP1. The breakdown products of hyaluronan, known as low molecular hyaluronan, have both pro-inflammatory and pro-oncogenic effects [35]. Studies in rats showed that intravesical injection of hyaluronidase resulted in inflammation and an increase in the number of activated mast cells, suggesting a direct role between hyaluronan break down products and mast cell activation and migration [36,37]. In vitro studies have also shown that mast cell proliferation can be inhibited by hyaluronan excreted by co-cultured cells [34]. Furthermore, mast cell secretion products have been shown to regulate hyaluronan secretion from other cells [38]. Mast cells also express the CD44 hyaluronan receptor on their cell surface [39]. Our immunohistochemical staining showed that hyaluronan forms part of the extracellular matrix in mast cell tumours and so likely interacts with the CD44 receptor. The interaction between CD44 and hyaluronan is known to promote both transformation and metastasis of cancer cells. Together these factors suggest that alterations in hyaluronan turnover could play a role in CMCT development.
Based on our data it appears possible that alterations in both the GNAI2 and hyaluronidase genes play a role in mast cell tumour development. The association to regions containing hyaluronidase genes on both chromosome 14 and 20 together with the much stronger association to a novel variant in the GNAI2 gene supports both findings. Still more work is required to validate and explore the functional consequences of these candidate genes. Many candidate variants were identified from the sequence capture and only a small subset were included in the fine mapping, which is a major limitation in this study. Many variants need to be studied in more detail to determine their effects.
The dog has proven to be a good model for many human disorders. Similarities between CMCT and human mastocytosis suggest that genes and genetic pathways altered in CMCT could also play a role in human mastocytosis. We will continue to evaluate the role of the GNAI2 and the hyaluronidase genes in CMCT and hope that these investigations will help shed a light not only on CMCT, but also on human mastocytosis leading the way to a better understanding of the disease and potential new drug targets.
Materials and Methods
Samples
A total of 127 golden retriever (GR) samples were collected in the United States (70 cases and 57 controls), 113 in the United Kingdom (53 cases and 60 controls) and 33 in the Netherlands (18 cases and 15 controls). All samples were collected between year 2000 and 2013. The samples collected in the United States were collected from all over the United States. These samples were all collected by a veterinary professional and were submitted to the BROAD institute either by the veterinarian or by the dog owner. Samples collected in the UK were primarily collected at the Animal Health Trust (AHT). A subset of UK samples were collected by veterinarians or dog owners not affiliated with the AHT. Samples collected in the Netherlands were collected at either Utrecht University clinic of Companion Animals or Veterinary Specialist Center De Wagenrenk. Cases were diagnosed with CMCT by histopathology or cytology. Data was collected when available regarding age of onset, and grading of the mast cell tumour. Control dogs were unaffected by any form of cancer, and were over 7 years old. For the American controls, phoning the owners bi-yearly provided follow up health information. Genomic DNA was extracted from whole blood (240 samples) or buccal swabs (33 samples) using the QIAamp DNA Blood Midi Kit (QIAGEN), the Nucleon® Genomic DNA Extraction Kit (Tepnel Life Sciences), by phenol chloroform extraction, or by salt extraction [40].
Genome-wide association mapping
Illumina 170K canine HD SNP arrays were used for the genotyping of approximately 174,000 SNPs with a mean genomic interval of 13kb. Genotyping of the European samples was performed at the Centre National de Genotypage, France. Genotyping of the American samples was performed at the Broad Institute, USA.
The American and European GR cohorts were analysed separately and as a joint dataset. Data quality control was performed using the software package PLINK [41], removing SNPs and individuals with a call rate below 90%. Markers showing a low level of variability (MAF<0.01) were excluded from further association analysis. A total of 1,582 SNPs were removed due to platform-related genotyping inconsistencies due to differences in hybridization and calling algorithms used between two different sequencing platforms. Population stratification was estimated and visualized in multidimensional scaling plots (MDS) using PLINK to detect outliers and subgroups in the dataset after eliminating SNPs in high LD (r2>0.95). Due to the cryptic relatedness that often exists within a dog breed, the level of relatedness between individuals in each population was calculated using the GCTA software [42], and a genetic relationship matrix (grm) value of 0.25 was used as the cut-off threshold to remove highly related dogs (corresponding to half-sib level of relatedness). Regions associated with CMCT were detected by case-control genome-wide association analysis. PLINK and EMMAX software [41,43], were used to calculate association p-values, the latter software corrected for stratification and cryptic relatedness using mixed model statistics [43]. The LD-pruned SNP set was used for MDS, estimation of relatedness in GCTA and within the relationship matrix in EMMAX, whereas the full QC filtered SNP set was used for the association testing.
Quantile-quantile (QQ)-plots were created in R to assess possible genomic inflation and to establish suggestive significance levels. Permutation testing was performed in PLINK for the PLINK calculated association results, or GenABEL [44] for the mixed model association results. 10,000 permutations were performed. Minor allele frequencies and odds ratios, were calculated for each cohort (cases and controls) using PLINK.
Pair-wise r2–based LD between markers was used to evaluate the size of candidate regions and whether the associated loci were independent. The r2 calculations were performed using the Haploview and PLINK software packages [41,45]. Gene annotations were extracted from Ensemble [46] and UCSC [47].
Targeted sequencing
Fifteen dogs (7 European (3 cases and 4 controls), and 8 American (5 cases and 3 controls)) were selected for sequencing of the associated genomic regions. A custom sequence capture array was designed (Nimblegen 2.1M solid array) to cover all associated regions. In total the capture array was designed to include 11.5 Mb DNA including the top associated regions CanFam2.0 cfa 20 : 41,149,999–43,000,000, cfa 20 : 46,099,999–49,700,000 and cfa14 : 14,599,999–15,450,000. Sequence capture was performed as previously described [48]. DNA from 15 individuals was individually barcoded and 3 DNA samples hybridized to each of 5 arrays. The DNA captured by each array was used to prepare a sequencing template library, and the libraries were sequenced on four Hi-Seq 2500 lanes.
Sequencing data was pre-processed and aligned using BWA [49], Samtools [50] and Picard to make bam files and to mark duplicate reads. Sequencing data was aligned to the CanFam 2.0 reference genome. Coverage of the targeted regions was 7-69x. GATK software [51] was used for data processing and genotype calling as well as filtering of variants. Called variants were annotated using SnpEff [52] and variants were scored according to conservation based on the 29 mammals data [53] using SEQScoring software [54], producing files which could be visualized graphically in the CanFam 2.0 UCSC browser. Bam files were visualized in IGV [55] to evaluate the presence of structural variants. Identified variants were evaluated in the CanFam3.1 genome assembly to assure that these variants were not due to faults in the CanFam2.0 assembly.
Fine mapping of associated regions
SNPs that conformed to the haplotype for the most associated SNP were chosen for fine mapping. Priority was given to SNPs, which were conserved (as deemed by SEQscoring based on the 29 mammals data, including SNPs up to 6bp from conserved sites), coding SNPs, SNPs in UTR regions, SNPs upstream of genes in a predicted promoter region, and SNPs in introns. Additional SNPs, which did not conform to the risk haplotype, were chosen due to their location in interesting regions. SNPs were genotyped using the Sequenom MassArray iPLEX platform. Not all candidate SNPs could be genotyped due to iPLEX (multiPLEX) design limitations, or because of limitations in the number of SNPs that could be co-typed. Fine mapping data was analysed using Haploview, and 1,000,000 permutations were performed.
RNA sequencing
Poly-A selected, strand-specific RNA sequencing was performed on a CMCT surgically excised from a GR. Sequencing libraries were prepared as described [56]. Normal marginal tissue was sampled as control. Samples were sequenced on one Illumina Hi-Seq 2500 lane. Data was analysed and aligned to CanFam3.1 using the tuxedo suite [21]. The sequence data was viewed in IGV.
Immunohistochemistry
Immunohistochemistry was performed in order to visualize if hyaluronan is present in canine mast cell tumours. Slices of archived paraffin-embedded formalin-fixed CMCT tissue were dewaxed., and endogenous peroxidase blocked by incubation in 1% (v/v) H202 in 70% (v/v) ethanol for 5 min. Sections were washed sequentially in water and PBS and blocked for non-specific binding by a 30 min incubation in 1% (w/v) BSA in PBS. Sections were incubated over night at 4˚C with 2.5μg/ml Biotinylated Hyaluronan Binding Protein (AMS.HKD-BC41, AMSBIO) in 1% (w/v) BSA in PBS. Sections were washed with PBS and incubated with Vectastain Elite ABC Reagent (Vectastain Elite ABC Kit, Vector) for 30 minutes. After an additional wash in PBS the sections were incubated in diaminobenzidine for 7 min. The sections were rinsed in water and counterstained with 10% Mayer’s haematoxylin for 30s. The samples were then washed, dried for two minutes, and mounted in DPX mounting medium.
Case selection for immunohistochemistry (IHC)
Eight cases of CMCT (6 dogs – 2 with multiple tumours), on which genome analysis was performed, were selected for IHC. In addition, four cases of CMCT in GRs were selected from AHT recent case submission and similarly stained.
As a negative control a portion of haired skin from the lateral chest of a dog with no evidence of skin disease was used.
Prior to IHC histopathological evaluation was performed on both test groups to confirm the presence of a CMCT. Blocks containing unaffected tissue margins were as far as possible selected for staining.
Immunohistochemical evaluation
Medium to dark brown staining in a linear, granular or diffuse staining pattern in the epidermis, dermis, panniculus and in mast cells was considered as positive staining. A normal expected staining pattern as observed in the negative skin control included positive (linear) staining of the basement membrane of the epidermis, hair follicles, apocrine gland and blood vessels. Normal positive staining was also visible between dermal and pannicular collagen fibres and between adipocytes.
Positive staining in the mast cells was evaluated as nuclear (granular or diffuse), intracytoplasmic (granular or diffuse) or cytoplasmic membrane (linear). Positive staining was evaluated as light or intense.
RNA extraction
RNA was extracted from RNAlater-preserved normal skin and CMCT samples using either TRIzol (Life Technologies) or the RNAeasy kit (QIAGEN). RNA integrity was evaluated by microfluidic electrophoresis (Agilent 2100 Bioanalyser RNA 6000 Nano Kit). cDNA was synthesised using the RT-for-PCR kit (Clontech).
PCR validation of alternative splicing
PCR Primers were designed targeting the exon before and after the alternatively spliced exon. In addition, splice-specific primers were designed traversing the alternative splice site (see S6 Fig for design) as well as for the wild-type splice form as a control.
Alternative_splice_primer:
Forward: CATTGTCAAGCAGATGAAGATG,
Reverse: CTGCACACCG TTGTCAGCC
Splice_primer_control:
Forward: GACCCCTCCCGAGCGGATG
Reverse: As for alternative splice
Primer_traversing_alternative_spliced_exon
Forward: AGAGCACCATTGTCAAGCAG
Reverse: TCCGGATGACACAAGACAGATC
Quantitative PCR was performed on the 7900HT Fast Real-Time PCR (Applied Biosystems) using SyBr Green mastermix (Applied Biosystems). Delta Cq (Cqnormal_splice−Cqalternative_splice) was calculated between the splice specific and alternative splice products for each cDNA sample. The PCR products were analysed by agarose gel analysis.
Ethics statement
This study was approved by the Committee for Animal Care at the Massachusetts Institute of Technology, approval number MIT CAC 0910-074-13 and by the Uppsala Animal ethical board, approval number C2-12. No experimental animals were used in this research. Blood or buccal swaps were taken with owners consent. Tissue samples consisted of surplus material from surgical resections with owners consent.
Supporting Information
Zdroje
1. Molderings GJ (2014) The genetic basis of mast cell activation disease—looking through a glass darkly. Crit Rev Oncol Hematol.
2. Amon U, Hartmann K, Horny HP, Nowak A (2010) Mastocytosis—an update. J Dtsch Dermatol Ges 8 : 695–711; quiz 712. doi: 10.1111/j.1610-0387.2010.07482.x 20678151
3. Laine E, Chauvot de Beauchene I, Perahia D, Auclair C, Tchertanov L (2011) Mutation D816V alters the internal structure and dynamics of c-KIT receptor cytoplasmic region: implications for dimerization and activation mechanisms. PLoS Comput Biol 7: e1002068. doi: 10.1371/journal.pcbi.1002068 21698178
4. Bodemer C, Hermine O, Palmerini F, Yang Y, Grandpeix-Guyodo C, et al. (2010) Pediatric mastocytosis is a clonal disease associated with D816V and other activating c-KIT mutations. J Invest Dermatol 130 : 804–815. doi: 10.1038/jid.2009.281 19865100
5. Lim KH, Tefferi A, Lasho TL, Finke C, Patnaik M, et al. (2009) Systemic mastocytosis in 342 consecutive adults: survival studies and prognostic factors. Blood 113 : 5727–5736. doi: 10.1182/blood-2009-02-205237 19363219
6. Georgin-Lavialle S, Moura DS, Bruneau J, Chauvet-Gelinier JC, Damaj G, et al. (2014) Leukocyte telomere length in mastocytosis: correlations with depression and perceived stress. Brain Behav Immun 35 : 51–57. doi: 10.1016/j.bbi.2013.07.009 23917070
7. London CA, Galli SJ, Yuuki T, Hu ZQ, Helfand SC, et al. (1999) Spontaneous canine mast cell tumors express tandem duplications in the proto-oncogene c-kit. Exp Hematol 27 : 689–697. 10210327
8. Letard S, Yang Y, Hanssens K, Palmerini F, Leventhal PS, et al. (2008) Gain-of-function mutations in the extracellular domain of KIT are common in canine mast cell tumors. Mol Cancer Res 6 : 1137–1145. doi: 10.1158/1541-7786.MCR-08-0067 18644978
9. Blackwood L, Murphy S, Buracco P, De Vos JP, De Fornel-Thibaud P, et al. (2012) European consensus document on mast cell tumours in dogs and cats. Vet Comp Oncol 10: e1–e29. doi: 10.1111/j.1476-5829.2012.00341.x 22882486
10. Ranieri G, Marech I, Pantaleo M, Piccinno M, Roncetti M, et al. (2014) In vivo model for mastocytosis: A comparative review. Crit Rev Oncol Hematol.
11. Broesby-Olsen S, Kristensen TK, Moller MB, Bindslev-Jensen C, Vestergaard H, et al. (2012) Adult-onset systemic mastocytosis in monozygotic twins with KIT D816V and JAK2 V617F mutations. J Allergy Clin Immunol 130 : 806–808. doi: 10.1016/j.jaci.2012.04.013 22608575
12. Rosbotham JL, Malik NM, Syrris P, Jeffery S, Bedlow A, et al. (1999) Lack of c-kit mutation in familial urticaria pigmentosa. Br J Dermatol 140 : 849–852. 10354021
13. Miller DM (1995) The occurrence of mast cell tumors in young Shar-Peis. J Vet Diagn Invest 7 : 360–363. 7578452
14. White CR, Hohenhaus AE, Kelsey J, Procter-Gray E (2011) Cutaneous MCTs: associations with spay/neuter status, breed, body size, and phylogenetic cluster. J Am Anim Hosp Assoc 47 : 210–216. doi: 10.5326/JAAHA-MS-5621 21498594
15. Kiupel M, Webster JD, Bailey KL, Best S, DeLay J, et al. (2011) Proposal of a 2-tier histologic grading system for canine cutaneous mast cell tumors to more accurately predict biological behavior. Vet Pathol 48 : 147–155. doi: 10.1177/0300985810386469 21062911
16. Patnaik AK, Ehler WJ, MacEwen EG (1984) Canine cutaneous mast cell tumor: morphologic grading and survival time in 83 dogs. Vet Pathol 21 : 469–474. 6435301
17. Lindblad-Toh K, Wade CM, Mikkelsen TS, Karlsson EK, Jaffe DB, et al. (2005) Genome sequence, comparative analysis and haplotype structure of the domestic dog. Nature 438 : 803–819. 16341006
18. Karlsson EK, Baranowska I, Wade CM, Salmon Hillbertz NH, Zody MC, et al. (2007) Efficient mapping of mendelian traits in dogs through genome-wide association. Nat Genet 39 : 1321–1328. 17906626
19. Ji L, Minna JD, Roth JA (2005) 3p21.3 tumor suppressor cluster: prospects for translational applications. Future Oncol 1 : 79–92. 16555978
20. Wang M, Marin A (2006) Characterization and prediction of alternative splice sites. Gene 366 : 219–227. 16226402
21. Trapnell C, Roberts A, Goff L, Pertea G, Kim D, et al. (2012) Differential gene and transcript expression analysis of RNA-seq experiments with TopHat and Cufflinks. Nat Protoc 7 : 562–578. doi: 10.1038/nprot.2012.016 22383036
22. Patel TB (2004) Single transmembrane spanning heterotrimeric g protein-coupled receptors and their signaling cascades. Pharmacol Rev 56 : 371–385. 15317909
23. Lowndes JM, Gupta SK, Osawa S, Johnson GL (1991) GTPase-deficient G alpha i2 oncogene gip2 inhibits adenylylcyclase and attenuates receptor-stimulated phospholipase A2 activity. J Biol Chem 266 : 14193–14197. 1907271
24. Raymond JR, Appleton KM, Pierce JY, Peterson YK (2014) Suppression of GNAI2 message in ovarian cancer. J Ovarian Res 7 : 6. doi: 10.1186/1757-2215-7-6 24423449
25. Morin RD, Mungall K, Pleasance E, Mungall AJ, Goya R, et al. (2013) Mutational and structural analysis of diffuse large B-cell lymphoma using whole-genome sequencing. Blood 122 : 1256–1265. doi: 10.1182/blood-2013-02-483727 23699601
26. Uhlen M, Oksvold P, Fagerberg L, Lundberg E, Jonasson K, et al. (2010) Towards a knowledge-based Human Protein Atlas. Nat Biotechnol 28 : 1248–1250. doi: 10.1038/nbt1210-1248 21139605
27. Olsson M, Meadows JR, Truve K, Rosengren Pielberg G, Puppo F, et al. (2011) A novel unstable duplication upstream of HAS2 predisposes to a breed-defining skin phenotype and a periodic fever syndrome in Chinese Shar-Pei dogs. PLoS Genet 7: e1001332. doi: 10.1371/journal.pgen.1001332 21437276
28. Tian X, Azpurua J, Hine C, Vaidya A, Myakishev-Rempel M, et al. (2013) High-molecular-mass hyaluronan mediates the cancer resistance of the naked mole rat. Nature 499 : 346–349. doi: 10.1038/nature12234 23783513
29. Ding Q, Hu Y, Xu S, Wang J, Jin L (2014) Neanderthal introgression at chromosome 3p21.31 was under positive natural selection in East Asians. Mol Biol Evol 31 : 683–695. doi: 10.1093/molbev/mst260 24336922
30. Kimura M, Kim E, Kang W, Yamashita M, Saigo M, et al. (2009) Functional roles of mouse sperm hyaluronidases, HYAL5 and SPAM1, in fertilization. Biol Reprod 81 : 939–947. doi: 10.1095/biolreprod.109.078816 19605784
31. Rempel LA, Freking BA, Miles JR, Nonneman DJ, Rohrer GA, et al. (2011) Association of porcine heparanase and hyaluronidase 1 and 2 with reproductive and production traits in a landrace-duroc-yorkshire population. Front Genet 2 : 20. doi: 10.3389/fgene.2011.00020 22303316
32. Asboe-Hansen G (1950) A survey of the normal and pathological occurrence of mucinous substances and mast cells in the dermal connective tissue in man. Acta Derm Venereol 30 : 338–347. 14782821
33. Velican C, Velican D (1959) Histochemical investigations on the presence of hyaluronic acid in mast cells. Acta Haematol 21 : 109–117. 13626512
34. Takano H, Furuta K, Yamashita K, Sakanaka M, Itano N, et al. (2012) Restriction of mast cell proliferation through hyaluronan synthesis by co-cultured fibroblasts. Biol Pharm Bull 35 : 408–412. 22382329
35. Girish KS, Kemparaju K (2007) The magic glue hyaluronan and its eraser hyaluronidase: a biological overview. Life Sci 80 : 1921–1943. 17408700
36. Boucher WS, Letourneau R, Huang M, Kempuraj D, Green M, et al. (2002) Intravesical sodium hyaluronate inhibits the rat urinary mast cell mediator increase triggered by acute immobilization stress. J Urol 167 : 380–384. 11743360
37. Lv YS, Yao YS, Rong L, Lin ME, Deng BH, et al. (2014) Intravesical hyaluronidase causes chronic cystitis in a rat model: a potential model of bladder pain syndrome/interstitial cystitis. Int J Urol 21 : 601–607. doi: 10.1111/iju.12358 24286489
38. Nagata Y, Matsumura F, Motoyoshi H, Yamasaki H, Fukuda K, et al. (1992) Secretion of hyaluronic acid from synovial fibroblasts is enhanced by histamine: a newly observed metabolic effect of histamine. J Lab Clin Med 120 : 707–712. 1431498
39. Fukui M, Whittlesey K, Metcalfe DD, Dastych J (2000) Human mast cells express the hyaluronic-acid-binding isoform of CD44 and adhere to hyaluronic acid. Clin Immunol 94 : 173–178. 10692236
40. Miller SA, Dykes DD, Polesky HF (1988) A simple salting out procedure for extracting DNA from human nucleated cells. Nucleic Acids Res 16 : 1215. 3344216
41. Purcell S, Neale B, Todd-Brown K, Thomas L, Ferreira MA, et al. (2007) PLINK: a tool set for whole-genome association and population-based linkage analyses. Am J Hum Genet 81 : 559–575. 17701901
42. Yang J, Lee SH, Goddard ME, Visscher PM (2011) GCTA: a tool for genome-wide complex trait analysis. Am J Hum Genet 88 : 76–82. doi: 10.1016/j.ajhg.2010.11.011 21167468
43. Kang HM, Sul JH, Service SK, Zaitlen NA, Kong SY, et al. (2010) Variance component model to account for sample structure in genome-wide association studies. Nat Genet 42 : 348–354. doi: 10.1038/ng.548 20208533
44. Aulchenko YS, Ripke S, Isaacs A, van Duijn CM (2007) GenABEL: an R library for genome-wide association analysis. Bioinformatics 23 : 1294–1296. 17384015
45. Barrett JC, Fry B, Maller J, Daly MJ (2005) Haploview: analysis and visualization of LD and haplotype maps. Bioinformatics 21 : 263–265. 15297300
46. Clamp M, Andrews D, Barker D, Bevan P, Cameron G, et al. (2003) Ensembl 2002: accommodating comparative genomics. Nucleic Acids Res 31 : 38–42. 12519943
47. Kent WJ, Sugnet CW, Furey TS, Roskin KM, Pringle TH, et al. (2002) The human genome browser at UCSC. Genome Res 12 : 996–1006. 12045153
48. Tengvall K, Kierczak M, Bergvall K, Olsson M, Frankowiack M, et al. (2013) Genome-wide analysis in German shepherd dogs reveals association of a locus on CFA 27 with atopic dermatitis. PLoS Genet 9: e1003475. doi: 10.1371/journal.pgen.1003475 23671420
49. Li H, Durbin R (2009) Fast and accurate short read alignment with Burrows-Wheeler transform. Bioinformatics 25 : 1754–1760. doi: 10.1093/bioinformatics/btp324 19451168
50. Li H, Handsaker B, Wysoker A, Fennell T, Ruan J, et al. (2009) The Sequence Alignment/Map format and SAMtools. Bioinformatics 25 : 2078–2079. doi: 10.1093/bioinformatics/btp352 19505943
51. McKenna A, Hanna M, Banks E, Sivachenko A, Cibulskis K, et al. (2010) The Genome Analysis Toolkit: a MapReduce framework for analyzing next-generation DNA sequencing data. Genome Res 20 : 1297–1303. doi: 10.1101/gr.107524.110 20644199
52. Cingolani P, Platts A, Wang le L, Coon M, Nguyen T, et al. (2012) A program for annotating and predicting the effects of single nucleotide polymorphisms, SnpEff: SNPs in the genome of Drosophila melanogaster strain w1118; iso-2; iso-3. Fly (Austin) 6 : 80–92.
53. Lindblad-Toh K, Garber M, Zuk O, Lin MF, Parker BJ, et al. (2011) A high-resolution map of human evolutionary constraint using 29 mammals. Nature 478 : 476–482. doi: 10.1038/nature10530 21993624
54. Truvé K EO, Norling M, Wilbe M, Mauceli E, Lindblad-Toh K, Bongcam-Rudloff E (2011) SEQscoring: a tool to facilitate the interpretation of data generated with next generation sequencing technologies EMBnet journal 17 : 38–45.
55. Robinson JT, Thorvaldsdottir H, Winckler W, Guttman M, Lander ES, et al. (2011) Integrative genomics viewer. Nat Biotechnol 29 : 24–26. doi: 10.1038/nbt.1754 21221095
56. Hoeppner MP, Lundquist A, Pirun M, Meadows JR, Zamani N, et al. (2014) An improved canine genome and a comprehensive catalogue of coding genes and non-coding transcripts. PLoS One 9: e91172. doi: 10.1371/journal.pone.0091172 24625832
Štítky
Genetika Reprodukční medicínaČlánek vyšel v časopise
PLOS Genetics
2015 Číslo 11
- Kazuistika – Perspektivy využití precizované medicíny v rámci personalizované specifické terapie onkologických pacientů
- Nobelova cena za chemii pro genetické nůžky: Objev, který změní naši budoucnost?
- Technologie na bázi RNA v klinické praxi: od přebarvených petúnií k terapii vzácných a dosud jen obtížně léčitelných chorob u lidí
- „Nepředstavovali jsme si, že náš výzkum povede přímo ke vzniku nových léků, dokonce ještě za našeho života“
- Bezplatné služby pro diagnostiku ATTRv amyloidózy pro kardiology
Nejčtenější v tomto čísle
- UFBP1, a Key Component of the Ufm1 Conjugation System, Is Essential for Ufmylation-Mediated Regulation of Erythroid Development
- Metabolomic Quantitative Trait Loci (mQTL) Mapping Implicates the Ubiquitin Proteasome System in Cardiovascular Disease Pathogenesis
- Genus-Wide Comparative Genomics of Delineates Its Phylogeny, Physiology, and Niche Adaptation on Human Skin
- Encodes Dual Oxidase, Which Acts with Heme Peroxidase Curly Su to Shape the Adult Wing
Zvyšte si kvalifikaci online z pohodlí domova
Mazová zátka a její řešení
nový kurzVšechny kurzy